
Abstract
This work addresses the use of tablets and smartphones to enhance both student learning and engagement. Tablets were tested as potential substitutes for digital whiteboards, while smartphones were tested as potential survey media in the classroom using a question and answer method. Two teaching strategies were evaluated and compared: (1) traditional, which includes the use of the blackboard together with PowerPoint presentations and (2) interactive, where lessons are taught with the aid of a tablet, using interactive activities and digital materials. Measures of performance outcomes achieved with these strategies were made using the question and answer method at two points, during the classes and during the end-of-term examination. Three different question and answer methodologies were studied and compared, ranging from the very traditional method where students raise their hand to answer a question to the most modern where students use their smartphones to answer. The findings demonstrated higher outcomes with interactive lessons than with traditional learning (PowerPoint included). Tablets proved to be an effective and cheaper substitute for interactive whiteboards during lessons. The results suggested that the use of interactive procedures increased student participation. Furthermore, the students were very receptive to the use of smartphones as survey media. The use of smartphones as clickers is an interesting and instant way for both teachers and students to check students’ learning and perceived engagement. Considering that students are advanced users of smartphones and/or tablets, the use of these may be considered as more convenient than clickers. In addition, it is economically more acceptable than some other audience response systems.
Evolution of teaching tools: from hand-raising to smartphones and transparencies to tablets
The traditional lecture, especially in large classes, is subject to several extensively studied problems in terms of student engagement and learning. Low motivation, minimal contact between teachers and students, and low student involvement with the material are the usual complaints of learners (Beichner, 2008). Moreover, students attending traditional lectures usually do not respond well to research-based concepts (Hake, 1998). To overcome these drawbacks, teachers can try to increase students’ attention with learning strategies based on discussions and questions. Various methods such as hand raising and response cards have been used in the past to monitor students’ learning performance. However, with these traditional methods, students are usually very reticent. Many do not answer until others have done so or respond according to the majority opinion (Kennedy and Cutts, 2005; Stowell and Nelson, 2007). The existence of the Internet and personal hardware such as e-books, smartphones and tablets has changed the ways in which the new generation of students communicates and relates, and teachers should exploit this new scenario for learning purposes by making the most of these new technologies that students like to use (DiMaggio et al., 2001; Ley et al., 2013). Consequently, it is highly desirable to test these new devices and share with the educational community the results and feedback obtained after the integration of new teaching strategies in the classroom. There is, therefore, a need for further work which addresses the use of tablets and smartphones to enhance student learning and engagement.
What follows summarises how different teaching methods have contributed to the dissemination of knowledge and how they have evolved in recent years in order to illustrate the high potential that smartphones and tablets could have in education if used appropriately. A theoretical background is thus provided to put the experimental part of the study described in this article into context.
Presentation graphics software
Presentation graphics software, such as PowerPoint, was first introduced in the business world but quickly penetrated scientific and educational circles because it is a very powerful and effective tool for communication. Nevertheless, this effectiveness can be limited by overuse and misuse which can promote passive rather than active learning (Szabo and Hastings, 2000) and therefore its usage does not significantly contribute to any improvement in grades (Apperson et al., 2006; Szabo and Hastings, 2000). In addition, lecturers are warned to use information technology for the enrichment of students’ learning rather than simply for the improvement and/or modernisation of their performance in the classroom (Sipress, 1995). In contrast, there are several studies indicating that making presentations with computer graphics increases the level of interest and attention in the classroom and that students believe that learning with presentation graphics enhances information delivery because lectures are better structured and clearer (Apperson et al., 2006; Mantei, 2000).
It is nevertheless obvious that the use of presentation graphics has a number of weaknesses. One, it makes students rely too much on the presentations rather than on textbooks (Silverman, 2010). Two, it reduces information down to a list of multi-word bullet points, neglecting context and inhibiting the processing and storing of information (Adams, 2006). Three, the interaction and discussion between the student and teacher is lost, both of which are known to be important to student learning (Carini et al., 2006). Despite these weaknesses, it must be said that presentation graphics has great potential to enhance learning (Luse and Miller, 2010), but only if teachers first learn how to use it effectively.
Interactive whiteboards and new electronic devices
The lack of interaction between teachers and students potentiated the development of interactive whiteboards (IWBs). This technology allows the user to prepare material in advance, quickly display it to the whole class and manipulate items directly on the display in a similar fashion to working with an individual PC (Kennewell et al., 2008). Several benefits are claimed for the use of IWBs (Higgins et al., 2007; Smith et al., 2005) such as flexibility, versatility and multisensory presentation, but it is the possibility that students can easily interact and participate in a class that has led to the introduction of this technology as a teaching tool. However, there are some important disadvantages in using IWBs: they are more expensive than conventional whiteboards or projector and screen combinations and their surface can easily become damaged and replacing them is very expensive (Higgins et al., 2007; Smith et al., 2005). This helps to explain why new ICT resources which fulfil the most important requirements of low prices and high interaction are in great demand. Tablets have attracted considerable attention as a potential tool for educational use and surveys of this ICT resource indicate that learners pay more attention and gain a better understanding of the course material (Ambikairajah et al., 2005).
The interactive power of IWB and tablets is similar, but while everything that can be done with an IWB can also be done with a tablet, the reverse is not necessarily true (Scott, 2011).Tablets have several advantages over IWBs. One, writing on IWBs means that the teacher must be close to the board, whereas teachers handling a tablet can walk around their classrooms while writing. Two, with tablets, notes can be projected and even saved so that they are visible and downloadable to all students. Three, teachers can show students anything displayed on their tablets, such as Internet sites or special software (Scott, 2011: 4) The students can remain seated as the instructor hands them the tablet and they work through problems in the class. This saves time, minimises disruptions and promotes teacher–learner interactivity since not all students are willing or perhaps even physically able to write on the board in front of an audience. Tablets can be used anywhere that has a projector, but an IWB can be used only in the room where it is installed (Scott, 2011). In addition, tablets allow automatic magnification of what is written, whereas with an IWB the instructor can write only in the space provided (Scott, 2011). Tablets are one of the best tools available for creating a classroom with collaborative learning opportunities, where everyone shares and explores ideas together (Scott, 2011).
Clickers and response cards
The effectiveness of the use of new technologies in student engagement and teaching needs to be evaluated. Assessment is important because it can help to contribute to feedback to the students on their learning and the certification of their achievement (Boud and Falchikov, 2007). A quick survey of students’ achievements can be an important tool for re-directing or re-planning teaching activities (Bruff, 2009; Freed, 2010). The most popular tools available for surveys include response cards and clickers. Clickers are interactive remote response devices that transmit and record student responses to questions, providing immediate knowledge about the results of a particular teaching tool. This allows a high degree of interactivity for both the teacher and the students so that they can ‘learn about the learning process’ (Homme et al., 2004). The use of clickers can have a positive effect on active collaborative learning and engagement, improving student learning performance (Blasco-Arcas et al., 2013). Other previous studies with clickers showed benefits for students’ achievements, even if these were sometimes moderate (Anthis, 2011; Elicker and McConnell, 2011; Kennedy and Cutts, 2005; Stowell and Nelson, 2007). Response cards are note cards stored in an envelope on which students write their responses to questions (Desrochers and Shelnutt, 2012).
There have been mixed findings in studies comparing the response card method with the use of clickers. Some studies showed automatic response systems may be more effective compared to students raising their hand (Morling et al., 2008). In contrast, one study conducted under regular classroom conditions showed that manual answers (response cards) out-performed answers given with clickers (Freeman et al., 2007). Others have not found significant differences in student learning between clickers and other interactive tools (Desrochers and Shelnutt, 2012; Fallon and Forrest, 2011; Lasry, 2008; Stowell and Nelson, 2007). In addition, both tools have drawbacks: while the application of clickers is limited as they are expensive, obtaining results from response cards is a time-consuming process.
Advanced technologies in learning strategies
Mobiles for learning were first used through sending SMS (Motiwalla, 2007). Today, with smartphones and tablets, students are not limited by space and time, so they can be situated in a real-world scenario accessing online public resources and teacher-prepared materials (Hwang and Chang, 2011). This scenario has been called ‘mobile learning’, ‘m-learning’ (Crompton, 2013; Sharples et al., 2002) or ‘ubiquitous learning’ (Hwang et al., 2011a). Educators have emphasised that well-designed digital support is needed for improving students’ learning achievements (Hwang and Chang, 2011).
Some have reported the use of mobile or ubiquitous learning in different disciplines: science (Hwang et al., 2011b), social sciences (Chiou et al., 2010) and language (Ogata et al., 2009). Hwang and Wu (2014) reviewed the 2008–2012 publications on this topic and found that mobile learning is promising for improving students’ learning achievements, motivation and interests. However, few have explored the possibilities of polling through mobiles (Sun, 2014). Mobile polling with the Just in Time Teaching (JiTT) strategy (Lasry, 2008) may have benefits for students including reducing anxiety, improving students’ outcomes and holding students’ attention during polling. Others (Sun, 2014) are confident that mobile polling will be recognised as an effective and widespread tool.
Taking all this information into account, there is a need to address the effects of teaching using different resources based on digital tools, namely, traditional presentation graphics software (PowerPoint) and an alternative to IWBs, that is, the tablet. There is also a need to better understand the use of tablets and mobiles for polling from the perspective of assessing the learning process and student engagement.
Materials and methods
Participants, instruments and methodologies
This study was carried out at the University of Zaragoza, Spain, over two academic years (2012–2014). A total of 32 students (20 in the first academic year and 12 in the second) took part in the study. They were Chemical Engineering undergraduate students, (34% females and 66% males), all Spanish and ranging from 22 to 30 years old, attending the optional subject “Extensions of Chemical Reactors” given on three days for a total of 5 hours a week during the autumn semester. Three Spanish teachers conducted the lessons, teaching the same number of hours using the same teaching methods.
This work comprises two parts: a student engagement part and a teaching method part. For the engagement part smartphones were tested as polling tools by using the student response system “Socrative” (http://www.socrative.com). This free software synchronises the teacher tablet or laptop with the students’ smartphones, allowing the conversion of the smartphones into free clickers. A tablet connected to a projector was used as a potential substitute for IWBs in the teaching method part. Specifically, the free computer software “iBooks Author” was employed to create the digital material projected during the lessons with an Apple iPad making use of the free software “iBooks”. The results regarding learning and engagement obtained with the use of smartphones and tablets were compared to those obtained using traditional technologies in the engagement and teaching parts respectively.
In the engagement part, three different question and answer (Q&A) methods were tested, thus addressing how and to what extent student learning and participation are influenced by the degree of interactivity of the Q&A process. For this purpose, different multiple-choice questions were posed during the lessons, employing three different methods: Traditional Question-Traditional Answer (TQ-TA), Interactive Question-Traditional Answer (IQ-TA) and Interactive Question-Interactive Answer (IQ-IA). The teaching method part examines how the teaching method influences student learning using two different teaching methods. The first is a traditional method where the blackboard and PowerPoint slides were used, while the second is a more modern method where a tablet was connected to the classroom projector so that it could be used as an IWB, taking advantage of the available resources already installed in the classrooms. In this case, the teachers had the benefit of all the interactive utilities available for tablets, such as pictures, videos and interactive activities.
Question and answer methods used for the engagement part
Figure 1 provides a pictorial representation of the three Q&A methods used, which are fully described below, together with a schematic of the classroom showing the location of the teacher and students in the classroom. The maximum class size is 120 students, allocated in 24 desk units (12 × 12), with a maximum capacity of 5 students a unit. During the lectures, students sat in the first 5 rows.
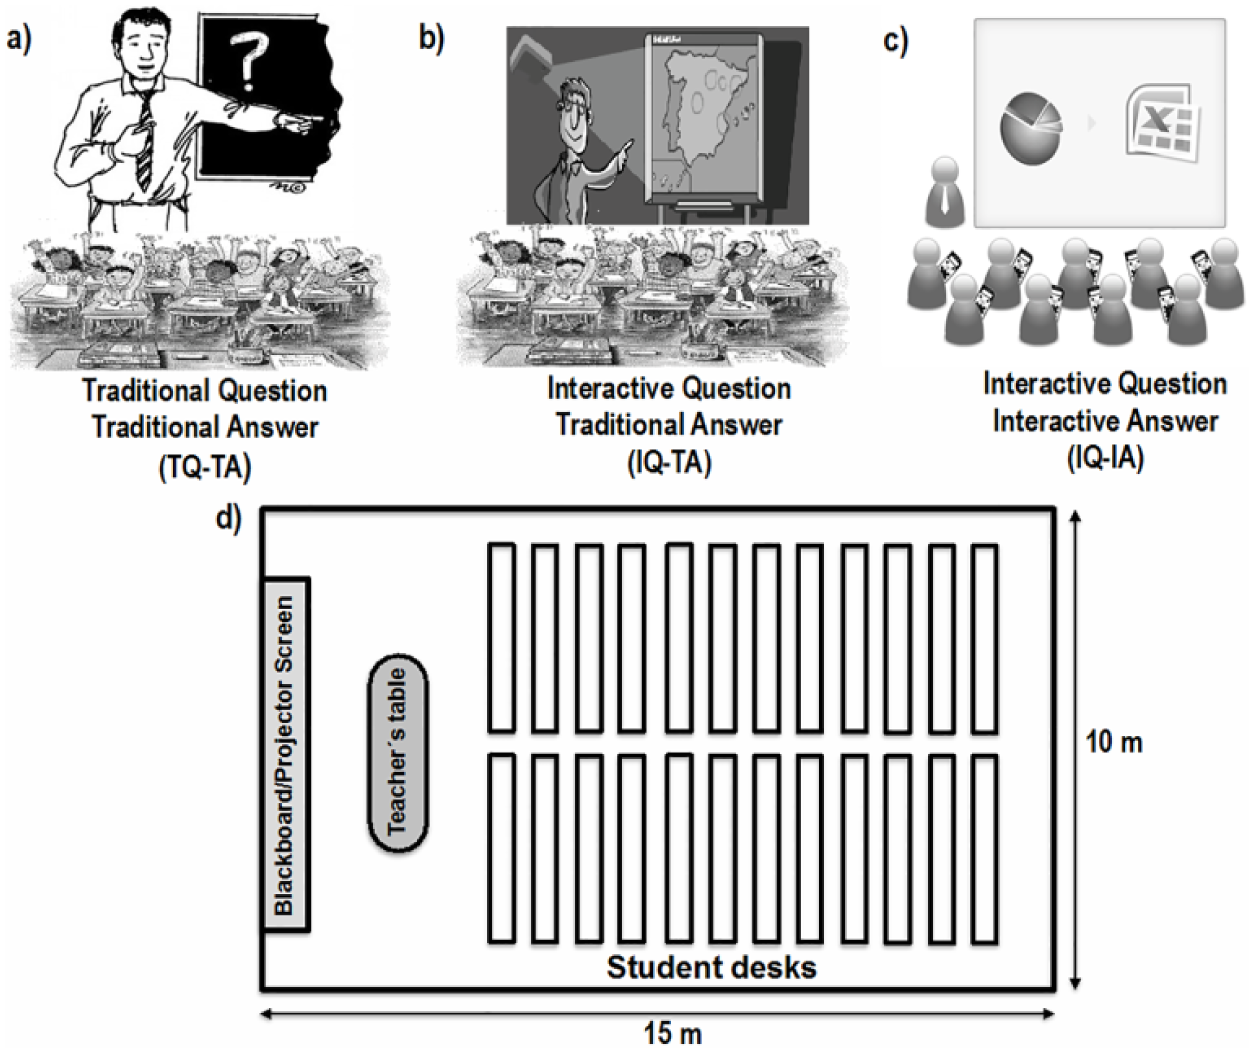
Q&A methods (a–c) and schematic of teacher and students organisation in the classroom (d).
Method 1: TQ-TA
The teacher asked the questions out loud with no tools. Once the question was asked, up to four different possible answers were provided. The teacher asked the students to choose one of the different options. They responded by raising their hands as the different options were read out. In other words, this was a manual voting system. The teacher provided the correct answer at the end of the poll.
Method 2: IQ-TA
The teacher used a tablet connected to a projector in order to convert the tablet into an interactive screen. The questions were projected with up to four possible answers. The students responded to the questions by raising their hands as the teacher read out the questions in the same manner as for method 1. However, in this case, the most voted answer was displayed on the screen and automatic feedback was given, indicating whether the answer was right or not.
Method 3: IQ-IA
The teacher used a tablet connected to a projector to display the questions as in method 2. In this case, the students used a free voting system to answer the questions. The teacher’s tablet was synchronised with the students’ smartphones using Socrative free software, and the students anonymously responded to the questions using their own smartphones. Once all the students had answered the question, automatic feedback was given. The correct answer as well as the distribution of answers was plotted on the screen.
Response variables, experimental planning and statistical analysis of the results
Achievement and active participation (perceived engagement) were used as response variables to compare the different response systems and teaching methods. They were calculated using the definitions shown in equations 1 and 2. Achievement was used in both parts while active participation was only calculated and compared between the different methods used in the engagement part. Engagement is normally conceptualised as the simultaneous occurrence of elevated concentration, interest, and enjoyment (Hamari et al., 2016). Concentration is related to meaningful learning including depth of cognitive processing and academic performance. Interest directs attention, reflects intrinsic motivation, and stimulates the desire to continue engagement in an activity. Enjoyment is a positive feeling related to the demonstration of competencies (Kelly, 2014). All these variables are subjective and very difficult to measure. Therefore, active participation has been used to obtain a numerical measurement of the participation of the students in the activities. This numerical quantification together with the students own opinions about the different learning activities obtained from an open-ended questionnaire provides what is considered to be a good approximation of perceived engagement.


All the results concerning achievement and active participation obtained in the 2 years were used as a whole. For each question, achievement and/or participation was/were calculated and compared between methods regardless of the academic year. As the subject and teachers were the same, this strategy allowed the methods to be compared, increased the number of times each method was used and consequently helped to more easily detect meaningful differences. Specifically, for the engagement study, a total number of 85 different multiple-choice questions were posed to the students during the two academic years making use of the three different methods: TQ-TA (13); IQ-TA (10); and IQ-IA (62).
In the teaching methods, student learning was evaluated during the lessons as well as in an end-of-term test using a total number of 101 multiple-choice questions. Specifically, 29 questions were used to test student knowledge acquisition when the interactive teaching method was used (19 before and 10 questions in the examination). In all, 73 questions were used to test the traditional procedure (43 before and 30 in the examination). The number of questions for each method was different because the number of times each method could be used was not the same. The questions covered the whole course syllabus and the two teaching methods. The results obtained with both methods were compared both before and in the examination. To test the effect of the teaching method on student learning during the lesson, the IQ-IA method was used, as it provided high participation and allowed anonymity in answering questions. Thus, the number of questions for this method is considerably higher than those of the other methods.
One-way analysis of variance (one-way ANOVA) was used to compare the different results, that is, the different engagement results obtained with the three different Q&A methods, as well as the learning results (both before and after the examination) depending on the two teaching methods. For any comparison, if the obtained p-value is lower than the significance level used (0.05), it can be concluded with 95% confidence that there are statistically significant differences between the values that are being compared. When the ANOVA analysis detected significant differences, a post-hoc analysis by means of the multiple range Fisher’s least significant difference (Fisher’s LSD) test was carried out to determine differences between groups.
Student open-ended questionnaire
An anonymous survey consisting of an open-ended questionnaire was carried out at the end of the course to know the students’ opinions about the teaching and Q&A methods.
Results
Effect of different Q&A methods on student participation and learning
The results regarding student participation and achievement are listed in Tables 1 and 2. The analysis shows how and to what extent the method used by the teacher to pose questions and the way students respond to them affect student engagement and learning, bearing in mind the possibility that students could use their smartphones as free clickers.
Results and ANOVA analysis for the participation (%) obtained with the three Q&A methods.
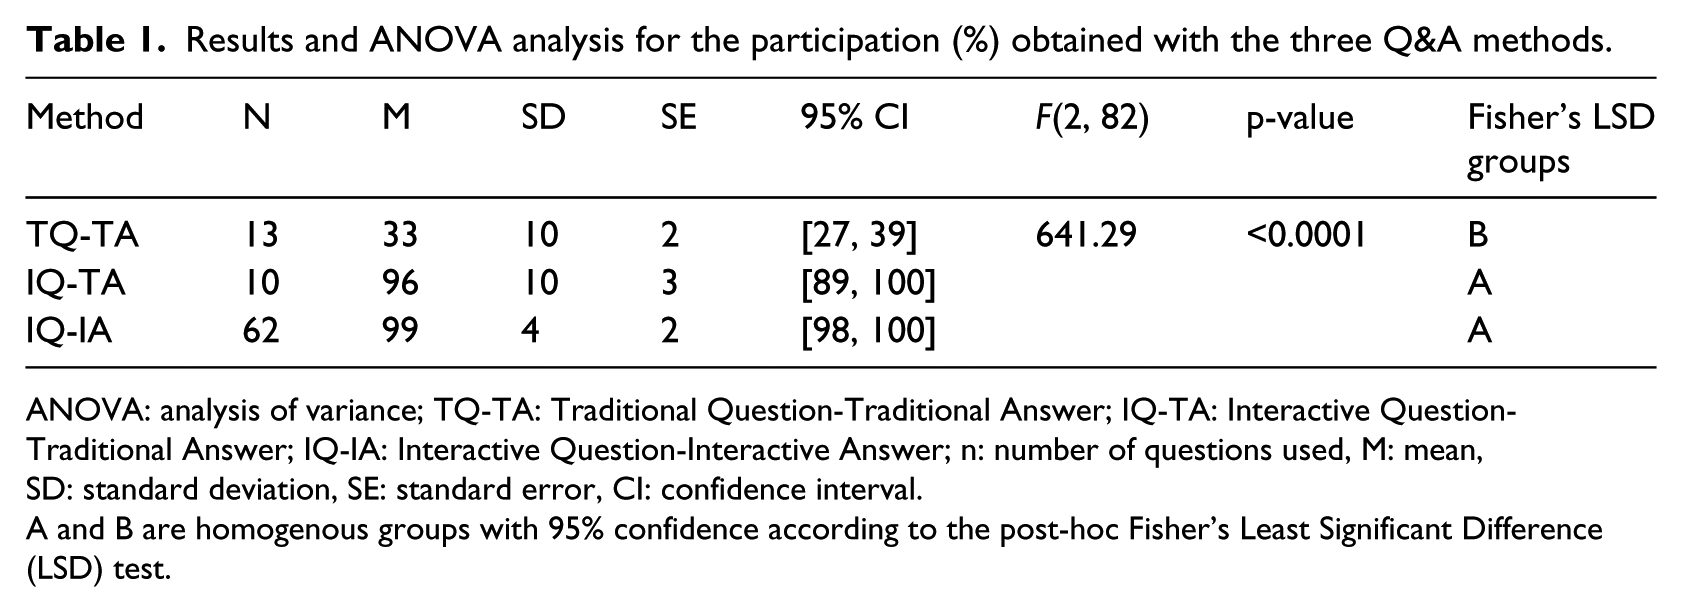
ANOVA: analysis of variance; TQ-TA: Traditional Question-Traditional Answer; IQ-TA: Interactive Question-Traditional Answer; IQ-IA: Interactive Question-Interactive Answer; n: number of questions used, M: mean, SD: standard deviation, SE: standard error, CI: confidence interval.
A and B are homogenous groups with 95% confidence according to the post-hoc Fisher’s Least Significant Difference (LSD) test.
Results and ANOVA analysis for the achievement (%) obtained with the three Q&A methods.
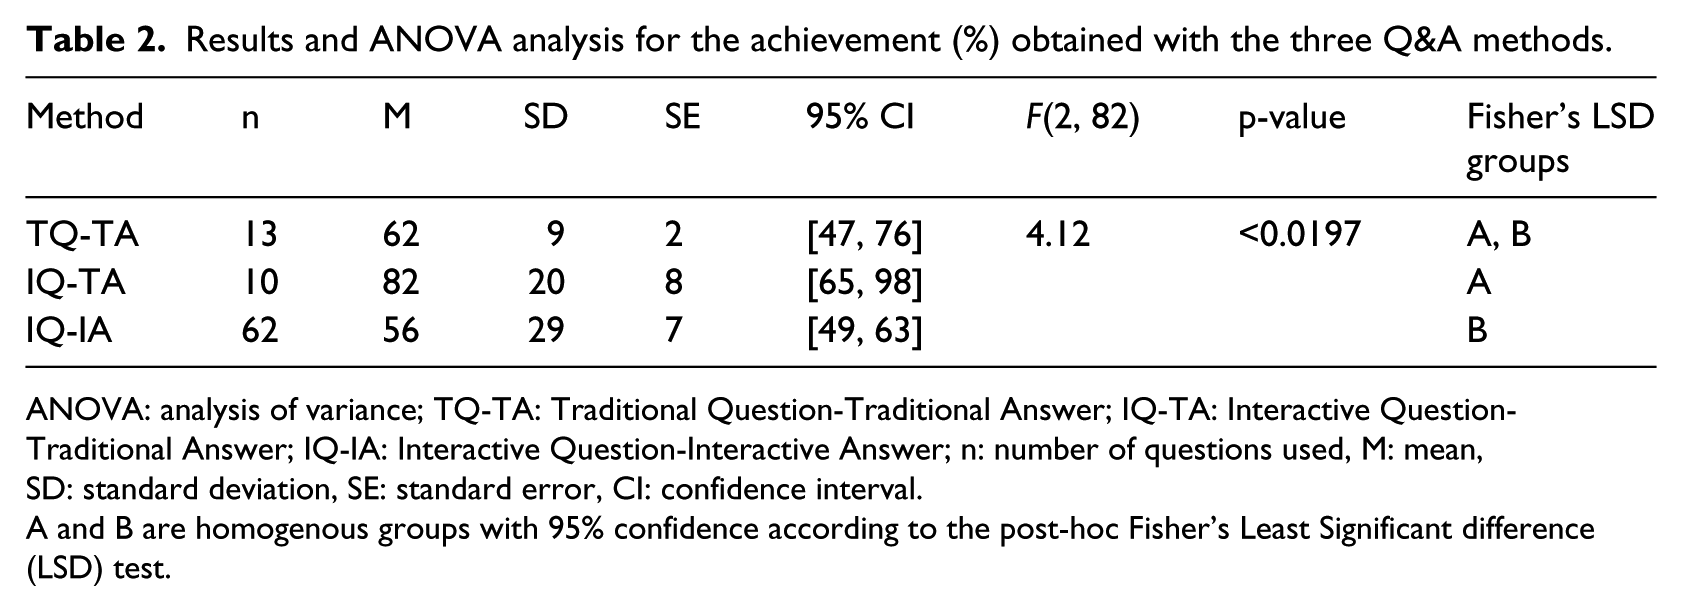
ANOVA: analysis of variance; TQ-TA: Traditional Question-Traditional Answer; IQ-TA: Interactive Question-Traditional Answer; IQ-IA: Interactive Question-Interactive Answer; n: number of questions used, M: mean, SD: standard deviation, SE: standard error, CI: confidence interval.
A and B are homogenous groups with 95% confidence according to the post-hoc Fisher’s Least Significant difference (LSD) test.
The statistical analysis of the results reveals that the Q&A method exerts a significant influence on both student active participation and achievement. Thus, the method the teacher uses to ask the questions and the way students can respond to the questions significantly influence both student participation and learning. Additionally, according to the post-hoc LSD test shown in Table 1, the TQ-TA method provides the lowest student active participation. Conversely, almost total student participation was obtained when either the IQ-TA or IQ-IA procedures were used. It is worth mentioning that statistically significant differences in student participation between the IQ-TA and IQ-IA methods were not found.
As regards student assessment, the results of the post-hoc LSD test shown in Table 2 reveal that the IQ-TA and the IQ-IA methods provided the highest and the lowest student achievement, respectively. Due to the lack of significant differences in student participation for these two methods, together with the fact that the same method was used to ask questions (IQ, that is, Interactive Question), useful information can be gathered. At the same participation level, a significantly higher percentage of correct answers was obtained when the TA method was used. This is consistent with the participation observed during the question making process. In both cases, the introduction of interactivity in the questions makes students more interested in replying. However, when using the TA method, a case of student dishonesty was observed. Some students responded immediately after others. In contrast, when students used their smartphones as clickers to answer, they did not know their classmates’ answers and the real level of student knowledge could be obtained.
Effect of different teaching methods on student learning
The results concerning student learning when the traditional or the modern methods were used are provided in Table 3. The analysis shows how interactivity during lessons affects students’ learning acquisition and enables us to evaluate whether or not tablets could be postulated as plausible substitutes for IWBs.
Results and ANOVA analysis for the achievement (%) obtained with the two methods before (in class) and in the examination.
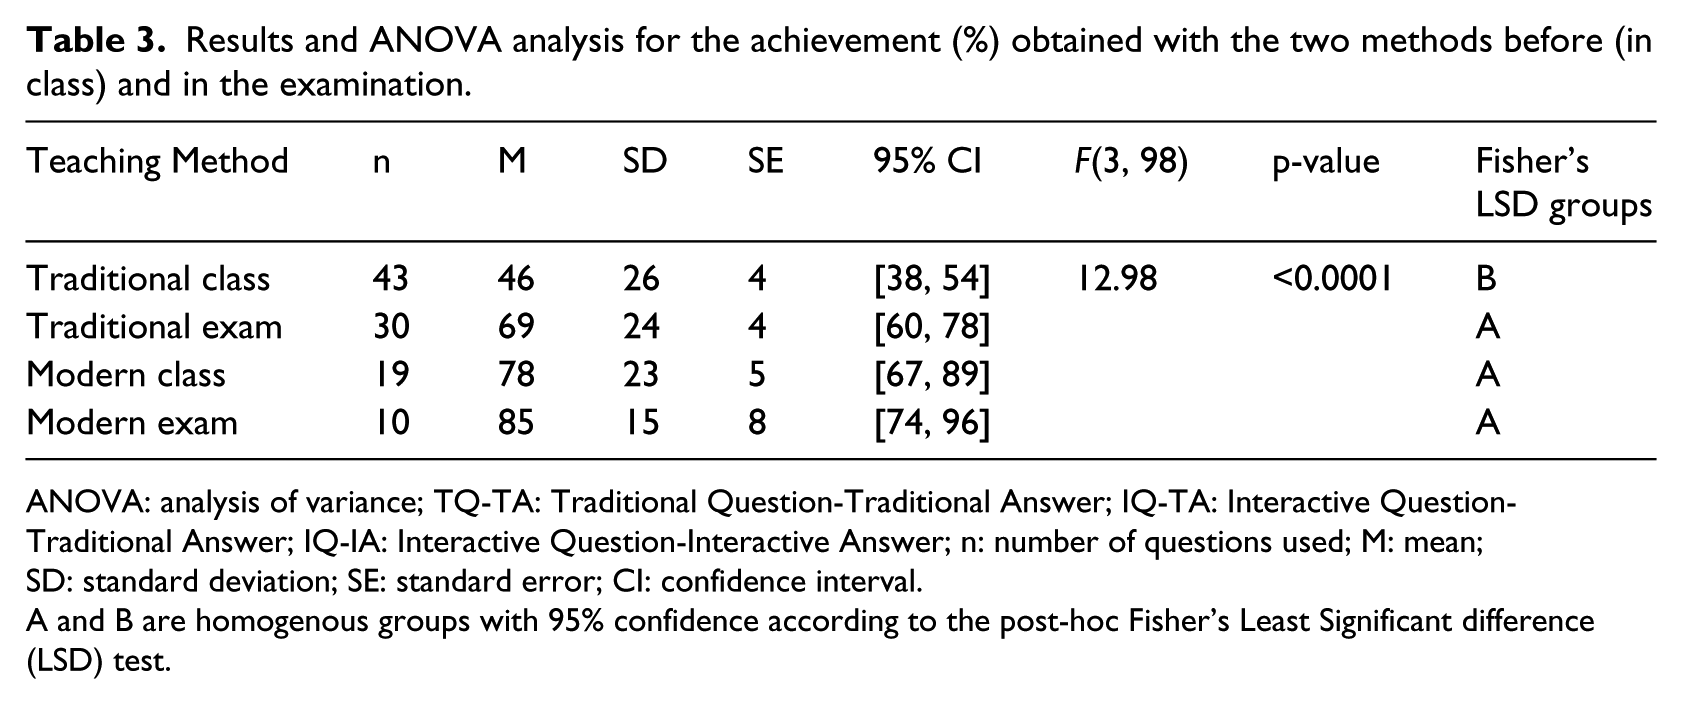
ANOVA: analysis of variance; TQ-TA: Traditional Question-Traditional Answer; IQ-TA: Interactive Question-Traditional Answer; IQ-IA: Interactive Question-Interactive Answer; n: number of questions used; M: mean; SD: standard deviation; SE: standard error; CI: confidence interval.
A and B are homogenous groups with 95% confidence according to the post-hoc Fisher’s Least Significant difference (LSD) test.
The statistical analysis reveals that the teaching method exerts a significant influence on student learning with 95% confidence. Specifically, comparing the achievement obtained with the two methods during the lessons, the post-hoc LSD test indicates that a higher student achievement was obtained when the modern teaching method was used. However, the comparison between the results obtained with the two teaching methods in the examination does not provide statistically significant differences with 95% confidence between the two methods. Furthermore, comparing the effect of the teaching technology on students’ achievement before and in the examination, non-statistically significant differences are found when the interactive technology was used. In this respect, it is worth mentioning that when the interactive technology is used, student achievement remains high throughout the academic year. However, in the case of using the traditional method, a statistically higher student performance was obtained in the end-of-term test than before it. These results suggest that the students’ own preparation for the examination is able to partially compensate for the differences between teaching methods.
Student opinions
The questions used in the open-ended questionnaire together with the answers of the students are listed in Table 4.
Open-ended questionnaire.
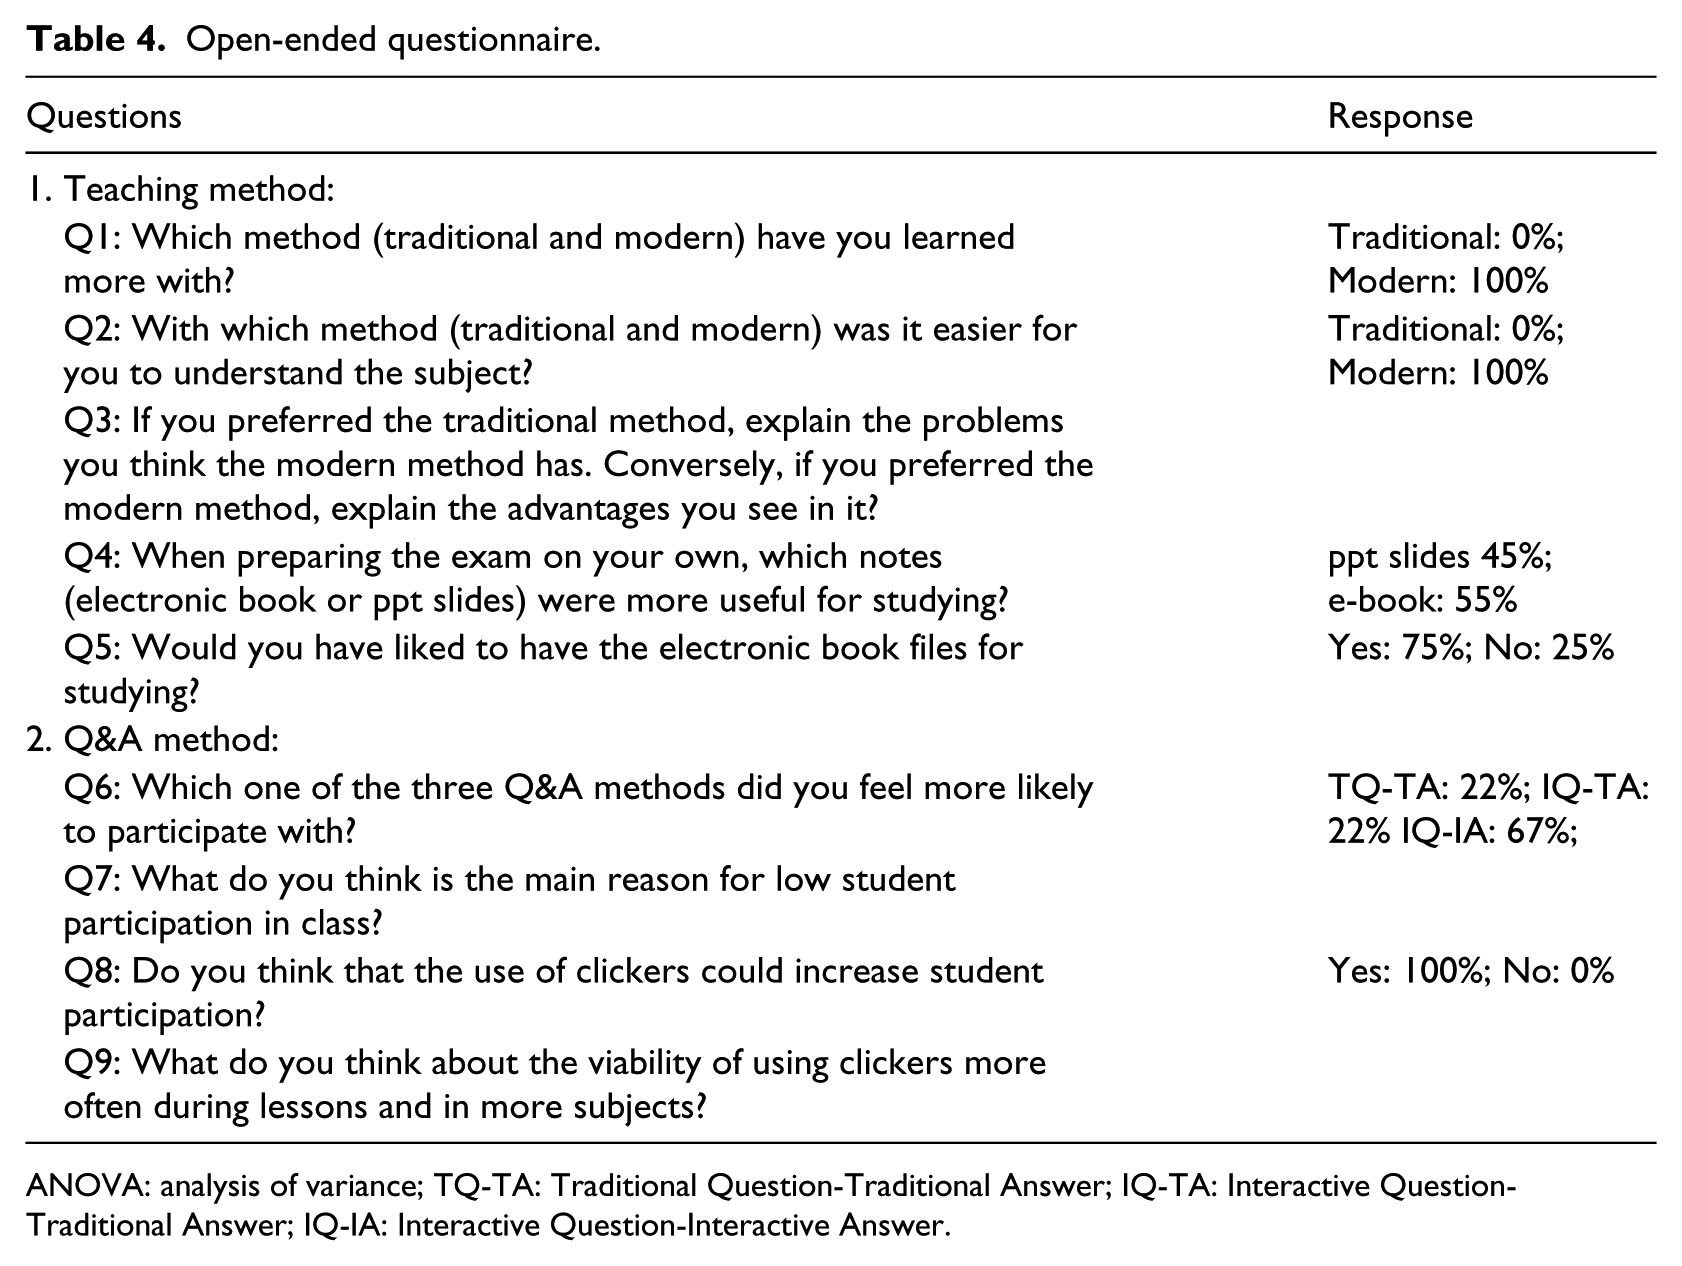
ANOVA: analysis of variance; TQ-TA: Traditional Question-Traditional Answer; IQ-TA: Interactive Question-Traditional Answer; IQ-IA: Interactive Question-Interactive Answer.
The interactive lessons were preferred by 100% of the students. They pointed out that they learnt more during lessons when this teaching method was used. However, opinion was equally divided between innovative and traditional teaching methods when it comes to using the material for personal study. Students were given the electronic (interactive) and the traditional (PowerPoint slides) lessons in pdf files; consequently, all the interactivity of the electronic book (interactive methodology) used in class was lost. As a consequence, during their personal study, students accepted both methods equally. Furthermore, the survey reveals that 75% of students would have liked to have the interactive material in electronic format when preparing for the examination.
As regards the question and answer methods, the vast majority preferred the IQ-IA method, highlighting its anonymity. In addition, some of the students also recognised the teacher’s awareness of student dishonesty when the IQ-TA method was used. In addition, the students were very receptive to the use of smartphones as survey media and stated that this method strengthens their learning and participation.
Discussion and conclusion
Q&A methods
In the Q&A study, the greatest student participation was achieved when interactive methods were used, which suggests that students are very receptive to the use of interactive technologies for academic purposes. Traditional methods provided the lowest participation. This low participation is very common in higher education, where students are usually very reticent about participating. Many of them do not answer until others have done so or respond according to the majority (Kennedy and Cutts, 2005; Stowell and Nelson, 2007). In addition, several factors such as shyness, poor motivation, fear of ridicule and nervousness make students reluctant to participate in class, especially when it comes to answering the teacher’s questions (Lasry, 2008).
However, and very interestingly, the introduction of interactive tools during the question-making process exerts a significant positive influence on student participation (DiMaggio et al., 2001; Ley et al., 2013), increasing students’ active participation during the lessons. The introduction into the classroom of technologies that the students are used to and can relate with encourages them to participate as these modern technologies can create a more comfortable and relaxing atmosphere, augmenting students’ engagement (Scott, 2011). In addition, statistically significant differences in student participation between the IQ-TA and IQ-IA methodologies were not found. This might indicate that factors such as nervousness and fear of looking ridiculous disappear, probably thanks to the participation of the whole class.
As regards student assessment, the IQ-TA and the IQ-IA methods provided the highest and the lowest student achievement, respectively. At the same participation level, a significantly higher percentage of correct answers were obtained when the TA method was used. However, when using this method, a case of student dishonesty was observed. This circumstance was also observed in other works (Kennedy and Cutts, 2005; Stowell and Nelson, 2007), where it was reported that many students responded according to the majority without expressing their own opinion. This phenomenon falsified the results and experimentally causes an artificial increase in student success that does not correspond to the real learning achievement of the class. In contrast, when students used their smartphones as clickers the level of student knowledge could be obtained. Consequently, the experimental results of this study suggest that high student participation and anonymity in the answers are crucial factors for student assessment throughout the course before examination. The IQ-IA method meets both these requirements and reduces or prevents student dishonesty.
Teaching methods
Regarding the teaching method, the interactive method provided the highest student achievement, which suggests that higher academic progress is made when using interactive tools. These interactive activities, including pictures and videos, allow teachers not only to easily explain difficult topics but also to increase the level of interest and attention in the classroom (Apperson et al., 2006; Scott, 2011). This in turn increases both student interest and may influence knowledge acquisition. These results are consistent with the findings of others (Ambikairajah et al., 2005) which indicate that learners pay more attention and gain a better understanding of the course material when interactive tools are used.
Conversely, in the examination, non-statistically significant differences between the two teaching methods were found. This might indicate that student preparation for the examination causes the differences between teaching methods to shrink. However, a higher achievement can be ensured, suggesting that a more detailed study might be needed to clearly elucidate whether or not the teaching method also has a significant impact on students’ achievement in the end-of-term tests. In contrast, non-statistically significant differences are found between the results obtained before and in the examination when the interactive technology was used. Additionally, the student achievement remains high throughout the academic year. Interactive teaching methods facilitate students’ acquisition of the course material (Bruff, 2009) and may affect collaborative learning, which in turn may impact learning performance and interest (Blasco-Arcas et al., 2013).
Student opinions
The results from the open-ended questionnaire indicate that the interactive lessons were preferred by 100% of the students. This fact was also reported in the work of Apperson et al. (2006), where students were more positive in their lecture evaluations when multimedia resources were used instead of traditional methods. During their personal study, students accepted interactive and traditional methods equally since all the interactivity of the electronic book (interactive method) was lost when providing the students with a pdf version of the interactive material. This result suggests that a well-prepared electronic book may not only be used by the teacher during lessons as a potential substitute for IWBs, but that it may also be used by students at home (Hwang and Chang, 2011). Very interestingly, the vast majority of students would have liked to have the interactive material in electronic format when preparing for the examination. Social behaviour has been greatly influenced by technology and students have become more interested in learning using multimedia resources (DiMaggio et al., 2001; Ley et al., 2013). The Internet, wireless technology, software with social and communication networks together with the use of smartphones and tablets have changed the ways in which the new generation of students communicate and relate to each other. This has changed student perception about teaching materials and suggests that the engagement, interest, and achievement of today’s computer-based generation of students could be increased by taking advantage of the knowledge available through the electronic devices they like to use.
As regards the Q&A methods, the students preferred the IQ-IA method, highlighting its anonymity. These opinions are consistent with those relating to the mobile polling and JiTT strategies (Lasry, 2008). In addition, some of the students also recognised the teacher’s awareness of student dishonesty, as explained above, and were very receptive to the use of smartphones as survey media. This is consistent with the findings reported by Sun (2014) who is confident that mobile polling will come to be recognised as an effective and widespread tool.
This study has several limitations that should be borne in mind for future research. First, the number of students taking part in the study was relatively low and the results were obtained over two academic years with different students. To compensate for this, the global participation and achievement of the class were considered as response variables in the analyses to eliminate the student/class factors. This small number of students also facilitates the synchronisation of the students’ mobile phones with the teacher’s tablet or laptop. Nevertheless, it is worth mentioning that student participation when using traditional methods is normally higher for smaller than for bigger classes. In this work, where the methods were used with small class numbers, statistically significant differences were obtained and the use of modern technology proved to be successful in improving student active participation. Second, a control group was not possible because of a bias that clickers and instructional strategies contribute to learning and using a control group where these technologies had not been used would have been an unfair practice. Third, three different teachers took part in the study. Although they used the two teaching methods and the three different Q&A procedures equally, the inherent human factor relating to teacher empathy could not be avoided even though the experimental analysis was designed to minimise this circumstance. Lastly, this study was carried out in a particular higher education context and country, and results may be different elsewhere. Future research should focus on the possible applicability of these methods with larger classes, in other subjects and with other students belonging to different institutions to analyse the effect of contextual factors on learning and engagement. In addition, the use of clickers could also be considered for other teaching activities where an increase in student participation could be beneficial such as in seminars for activities involving problem solving.
The results described in this study suggest that smartphones and tablets could be positively used in higher education. The students were very receptive to the use of smartphones as survey media. These devices are very common in students’ everyday activities and consequently they are willing to use them for learning purposes. In addition, considering the lower cost of tablets in comparison to IWBs, a tablet connected to a projector using the appropriate software was found to be a potential substitute for IWBs. Students have positively welcomed the use of tablets and smartphones for learning purposes. Therefore, it is now time for teachers to abandon the old-fashioned transparencies, blackboards and hand raising questions and make the most of these new technologies for the benefit of the students of the present who might become the teachers of the future.
Footnotes
Funding
The authors wish to express their gratitude to the University of Zaragoza for the projects (PIIDUZ_13_225 and PIIDUZ_14_323) conceded and to the Spanish MICINN for the FPI grant (BES- 2011-044856) awarded to Javier Remón Núñez.