
Abstract
Introduction:
The hereditability of insulin resistance has been demonstrated in both familial and twin studies. The effects of renin-angiotensin-aldosterone system gene polymorphisms on insulin resistance remain inconclusive.
Methods:
This is a sibling-based association study. Polymorphisms of renin-angiotensin-aldosterone system genes were examined in 1113 hypertension and 676 normotension siblings from Chinese and Japanese hypertensive families. The generalized estimation equations method was used to compare the differences in metabolic variables between hypertension and normotensive siblings.
Results:
For the G-6A polymorphism of AGT, GG siblings had lower 2-h insulin than siblings carrying the A allele (p=0.006). Siblings with different variants of the angiotensin II type 1 receptor A1166C had no difference in metabolic variables. Siblings carrying the D allele of the angiotensin converting enzyme gene had higher levels of fasting glucose, fasting insulin, area under the curve of insulin levels and the homeostasis model assessment of insulin resistance than II siblings (all p<0.05). Lower levels of fasting glucose and 2-h glucose were observed in siblings with the T allele than their CC homozygotes for the C-344T polymorphism of CYP11B2 (p<0.05). Siblings carrying three high-risk genotypes of the angiotensin converting enzyme, angiotensinogen and CYP11B2 had higher fasting glucose level than siblings carrying no high-risk genotypes (p=0.011).
Conclusion:
Our comprehensive analysis of renin-angiotensin-aldosterone system gene polymorphisms demonstrates that the angiotensin converting enzyme and CYP11B2 gene polymorphisms are associated with insulin resistance in hypertensive families.
Keywords
Introduction
The association of insulin resistance (IR) and hypertension (HTN) has been noted in general population and family studies.1–3 Several mechanisms accounting for high blood pressure (BP) by IR have been postulated, including fluid retention by insulin, endothelial dysfunction, sympathetic stimulation, etc. 4 In our previous study, we have demonstrated the heritability of IR in Asian hypertensive families. 5 Although the mechanisms that account for the elevation of BP by IR are not fully understood, both genetic and environmental factors contribute to IR.1,2 However, the molecular mechanism of inherited IR remains undetermined. Although several candidate genes have been studied to explore their associations with IR, the results of most studied candidate genes intrinsic to the target cells of insulin action were relatively disappointing.3,6,7 Factors that modulate insulin sensitivity extrinsic to the target cells have been now further explored.
Both in vivo and in vitro studies have suggested a role of the renin-angiotensin-aldosterone system (RAAS) in modulating insulin sensitivity. Infusion of angiotensin II (AII) in normal subjects as well as patients with non-insulin-dependent diabetes mellitus (NIDDM) increased insulin-mediated glucose disposal. 8 Early in vitro studies showed that AII increased glycogenolysis 9 and decreased gluconeogenesis. 10 An intracellular cross-talk between AII and the insulin signaling system has been demonstrated in the rat aorta smooth muscle cells. 11 Improvement of beta-cell function and signaling transduction of insulin action by the AII receptor blocker (ARB) have been documented in animals.12–14 An increase of insulin sensitivity or decrease in incidence of new-onset diabetes has been observed in hypertensive subjects treated with angiotensin-converting enzyme (ACE) inhibitors or the AII type 1 receptor (ATR1) antagonist.15–17
The effect of ACE I/D polymorphism on IR has been examined in several studies,18–23 but with conflicting results. Fewer studies have been conducted to examine the effect of angiotensinogen (AGT) or ATR1 gene polymorphisms on IR and the results were inconclusive.20,24,25 Most of these studies are case–control or population-based.
A sibling (sib)-based association study is advantageous in eliminating sampling bias and some environmental factors. In the present study, we examined the effects of several RAAS gene polymorphisms on insulin sensitivity and glucose homeostasis in a group of hypertensive families ascertained for genetic influence on HTN and IR, the Stanford-Asian Pacific Program in Hypertension and Insulin Resistance (SAPPHIRe) study. 5 Using this approach, we compared phenotypic variables that relate to glucose tolerance and/or IR between sibs discordant for the AGT, ATR1, ACE and aldosterone synthase (CYP11B2) genes. We demonstrated that the RAAS genes were involved, although with varying extents, in IR and its associated metabolic variables in the non-diabetic sibs of hypertensive families.
Methods
Study population
The SAPPHIRe cohort has been previously described. 5 Briefly, the study design incorporated both concordant sib-pairs (both sibs with HTN) and discordant sibs (one hypertensive and one low-blood-pressured sib from either Chinese or Japanese descendants However, sibs with BP who did not fit the criteria of HTN or low BP were also recruited. The network consists of six field centers in Taiwan, Hawaii and Stanford University. A total of 1789 subjects (1309 Chinese and 480 Japanese) were recruited from 727 families. Among them, 1113 were HTN and 676 were normotensive (including those with low BP). This human genetic study has been approved by the institutional review board of each field center/hospital and all participants gave their informed written consent.
Phenotype measurements
BP was recorded automatically according to a common protocol by using the DINAMAPTM Vital Signs Monitor (Model 1846 SX/P). After subjects were seated and at rest for 10 min, three separate readings were taken with intervals of 1 min. The average of the second and the third readings was used for analysis. Body mass index (BMI) was defined as weight (kg)/height (m2) and waist/hip ratio as waist circumference (WC) divided by hip circumference, which were measured in a standard way.
A 75-g oral glucose tolerance test (OGTT) was given to all subjects. Subjects with a fasting plasma glucose level greater than 126 mg/dl or having a 2-h post-load glucose level over 200 mg/dl were diagnosed as diabetics and were excluded. The concentrations of plasma glucose, total cholesterol, low density lipoprotein, very low density lipoprotein, high density lipoprotein (HDL), triglycerides (TG) and insulin were measured in fasting samples.
Smoking status was categorized as non-smoker and current smoker; alcohol drinking status was categorized as non-drinker and drinker. With the use of a questionnaire, overall measures of physical activity at a variety of intensities were assessed by recording the number of hours per day spent at each of five levels of activity. The five levels of activity were basal (sleeping or lying down), sedentary (sitting or standing), slight (for example, casual walking), moderate (e.g. aerobic dancing) and heavy (e.g. swimming). A physical inactivity score was calculated by the formula: (hours of sedentary activity) / (24 h ─ hours of basal activity). A person was categorized as sedentary if his or her physical inactivity score was higher than 0.5. The metabolic syndrome for Asians is defined by the International Diabetes Federation recommendations (revised): 26 (1) abdominal obesity (a must): WC ≥ 90 cm in men and ≥ 80 in women; (2) two or more of the following for non-hypertensive: fasting plasma glucose ≥ 100 mg/dl; TG ≥ 150 mg/dl; high-density lipoproteins < 40 mg/dl; systolic BP ≥ 130 or diastolic ≥ 85 mmHg.
Genotyping of the RAA gene polymorphisms
Total genomic DNA was purified from peripheral blood leukocytes using a DNA extraction kit of Puregene (Minneapolis, MN, USA), following the manufacturer’s protocol. 27
Genotyping was performed on genomic DNA isolated from peripheral white blood cells. Polymorphisms of AGT (G-6A) and ATR1 (A1166C) were examined by TaqMan. 28 The probes and primers used in the TaqMan assay were as follows. For the G-6A, primers were: 5’-ATCCCCACCCCTCAGCTATAA-3’ (forward) and 5’-TATGTACACCCGG-TCACCTGC-3’ (reverse). The polymorphism of G-6A is in linkage disequilibrium with M235T. 28 For A1166C of ATR1, the probes are 5’-CTTCACTACCAAATGAG-CATTAGCTACTTTTCAG-3’ and 5’-TTCACTACCAAATGAGCCTTAGCTAC-TTTTCAG-3’ and primers were 5’-TGTGAAAGAAGGAGCAAGAGAACAT-3’ (forward) and 5’-CCACATAATGCATTTTCTCCTTCA-3’ (reverse).
The polymorphisms of ACE (insertion/deletion, I/D) and CYP11B2 (T-344C) were examined based on a polymerase chain reaction (PCR) strategy. Genotyping of the D/I polymorphism of the ACE gene was done as previously described. 24 Briefly, two specific primers (5’-GCCCTGCAGGT- GTCTGCAGCATGT-3’ and 5’-GGATGGCTCTCCCCGCCTTGTCTC-3’) were used to amplify the intron 16 DNA fragment for detection of the I/D polymorphisms of the ACE gene. The PCR products are 597-base pair (bp) with I allele and 319-bp with D allele. Because the D allele is often preferentially amplified in samples of I/D genotype, each sample that had only the D allele or an inconspicuous band of I allele after the first PCR amplification was subjected to a second PCR amplification with a primer pair (5’-TGGGACCACAGCGCCCGCCACTAC-3’and 5’-TCGCCAGCCCTC- CCATGCCCATAA-3’) that recognized an insertion-specific sequence. The reaction yields a 335-bp amplified product in the presence of I allele and no products in samples homozygous for the DD genotype. The variants of CYP11B2 (T-344C) were examined with the PCR-restriction enzyme method, using the primers of 5’- GGATCCTGCAAGGAGGGATAC-3’ (forward) and 5’- CTGAGTGCCATTCCAATGCTC-3’ (reverse) and HaeIII as the restriction enzyme. The products were separated in 6% polyacrynamide gel. Three fragments (sized 336 bp, 147 bp and 138 bp) will be obtained if the genotype is T/T homozygote; four fragments (265 bp, 147 bp, 138 bp and 61 bp) for C/C homozygote and 5 for T/C heterozygote.
Laboratory
Plasma glucose was measured by a glucose oxidase method in a glucose analyzer (Elan Diagnostics, Smithfield, RI). Plasma insulin was measured by an enzymatic immunoassay (Access system; Beckman Coulter, Fullerton, CA). Lipid profile including total cholesterol, total TG and high-density lipoprotein cholesterol (HDL-C) was measured by previously described methods. 29 The homeostasis model assessment of insulin resistance (HOMAIR, defined as fasting insulin (µIU/ml) × fasting glucose (mmol/l) / 22.5) is used to estimate the degree of IR; the homeostasis model assessment of insulin secretion (HOMABETA) was defined as (20 × fasting insulin)/ (fasting glucose – 3.5). 30
Statistical analysis
The metabolic variables were logarithmically transformed to normalize their distributions before all other analyses. Within each HTN status, quantitative variables including age, BMI, TG, HDL, fasting plasma glucose (FPG), Glu60, Glu120, fasting insulin level (FPI), Ins60, Ins120, Ins_area under curve (AUC), HOMAIR were expressed as mean ± standard deviation (SD), while gender, ethnicity, alcohol drinking status, smoking status and sedentary activity were presented as a percentage. Since we recruited participants from hypertensive probands and their family, the data are familial in nature and thus might lack independence among observations. As an alternative approach, the generalized estimating equations (GEE), which are like the general regression models but account for the dependence among observations, 31 were used to assess differences between HTN sibs and normotensive sibs. The differences of the metabolic variables were also compared between discordant sibs with different genotypes by the GEE method with adjustments of covariates. Covariant effects included age, gender, log(BMI), smoking, alcohol drinking, hypertensive status and sedentary. Only the families with discordant sibs in terms of each gene polymorphism were enrolled for analysis, regardless of their BP status. The frequency of genotypes and allele of each polymorphism was calculated from all the subjects examined. The allele with the lower frequency was defined as ‘mutant’ and the other as ‘wild’. Analysis was thus performed to compare each variable between sibs carrying the wild-type allele and sibs with the homozygous mutant type (the recessive model) or between sibs carrying the mutant-type allele and sibs with the homozygous wild type (the dominant model).
The GEE method was also used to assess the effect of the combination of the putative high-risk genotype of the RAAS genes on the metabolic variables with adjustments of covariates. We used the SAS PROC GENMOD procedure (Version 8.2, SAS Institute Inc., Cary, NC) to fit GEE models. All statistical tests were two-sided. A p-value less than 0.05 was considered statistically significant, while a p-value less than 0.10 was considered marginally significant.
Results
Genotype distribution and allele frequency
In this study, 1789 sibs from 727 families were genotyped. The clinical and biochemical characteristics of these subjects are shown in Table 1. HTN sibs were heavier with greater BMI than normotensive sibs. After adjustments for age, gender and BMI, they had higher levels of TG, fasting glucose, 1-h glucose, 2-h glucose, 2-h insulin, area under the curve of insulin levels and HOMAIR, but lower HDL-C; the HOMAbeta was not different between hypertensive and normotensive sibs.
Clinical and biochemical characteristics of the study population
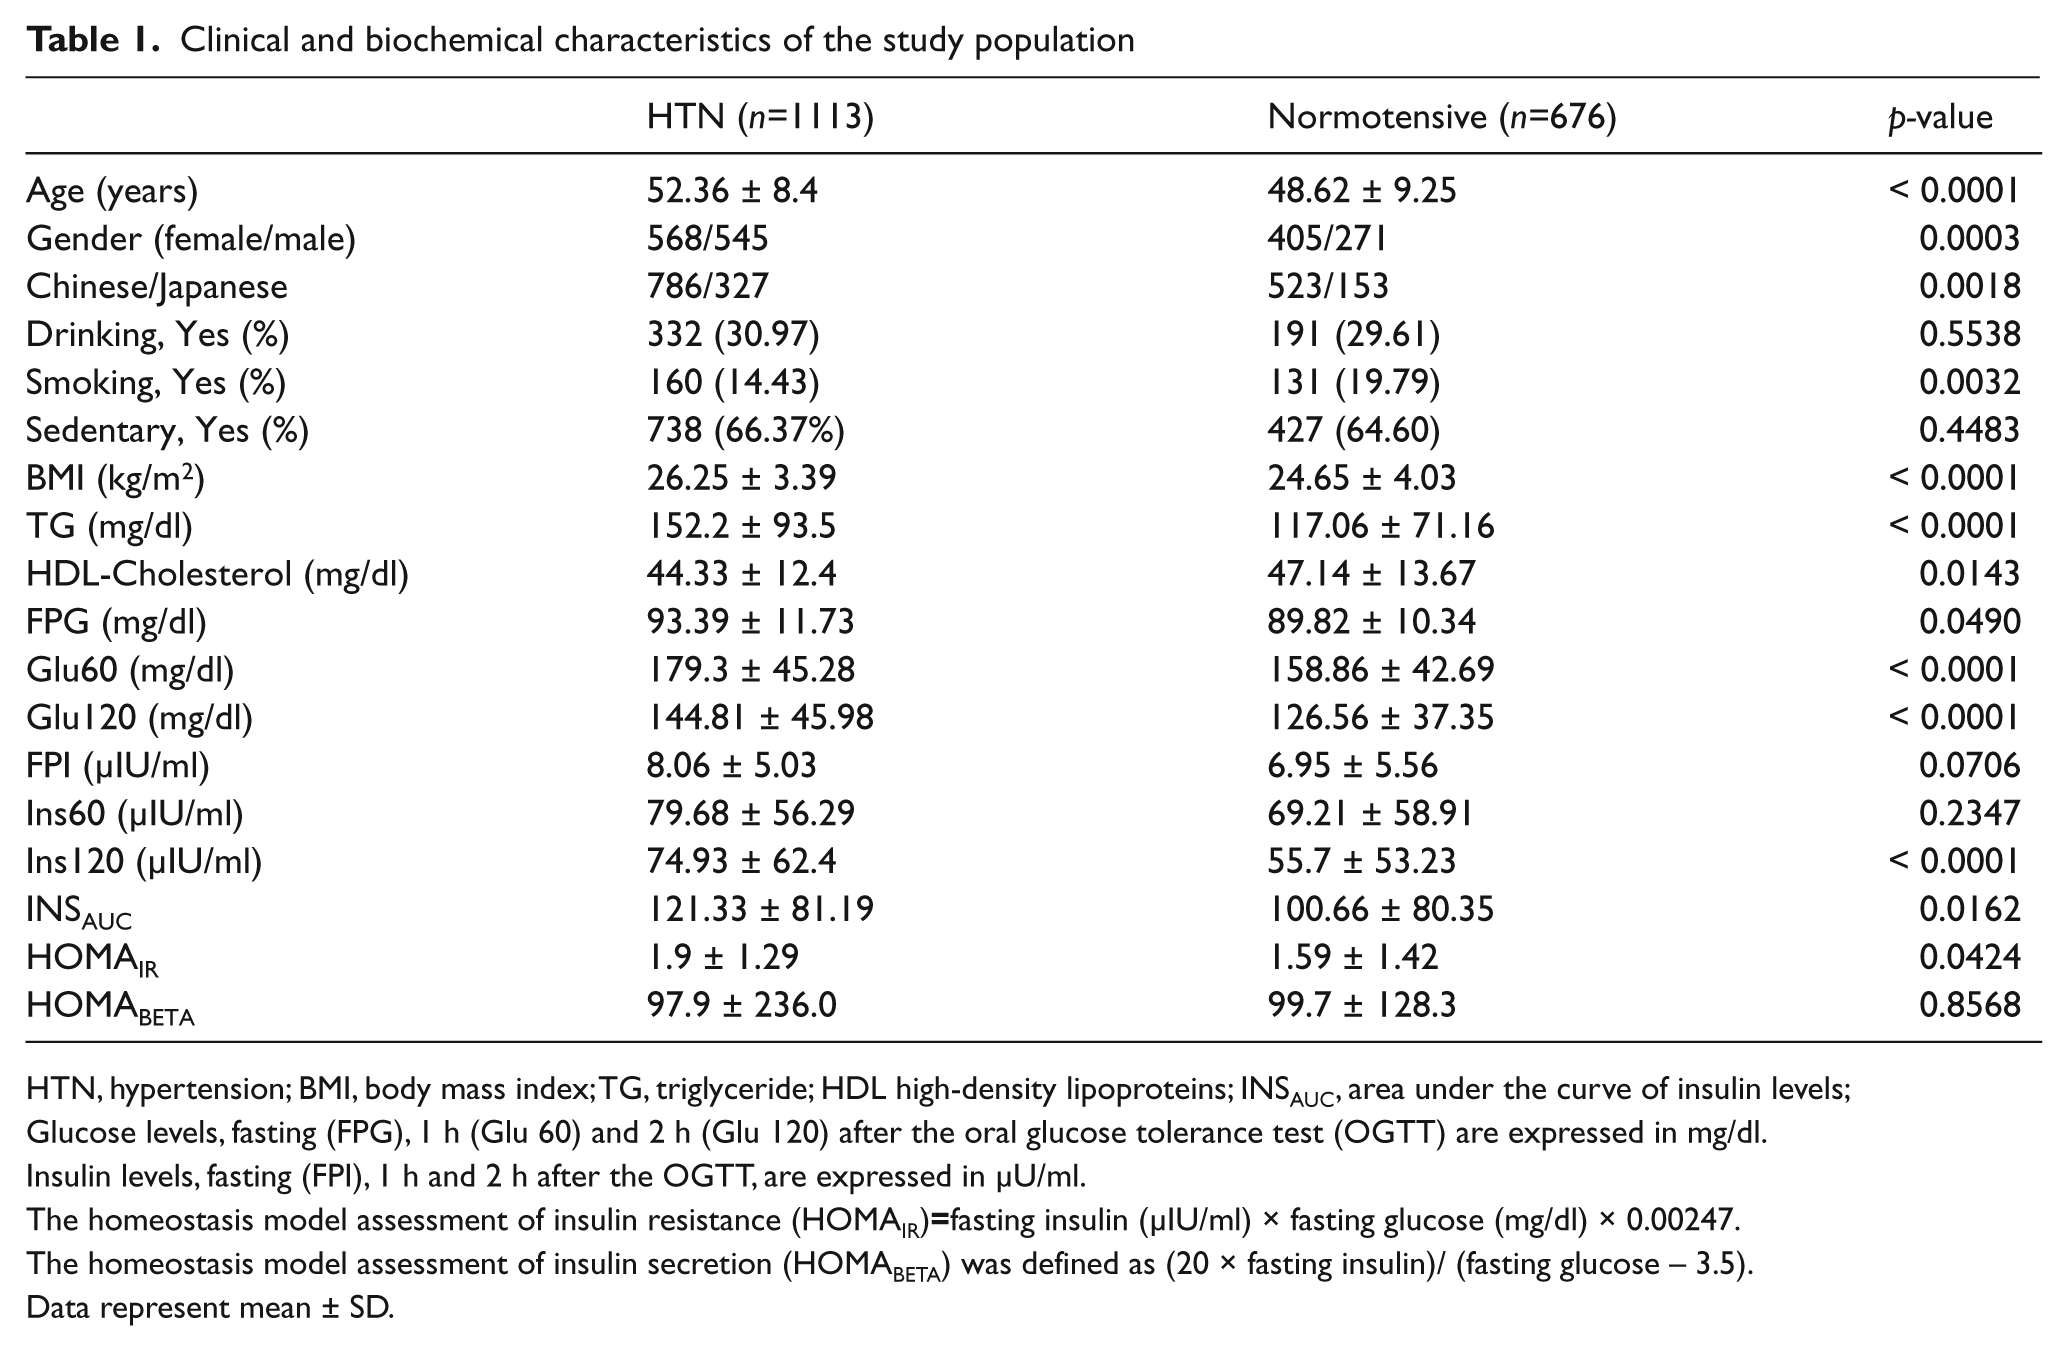
HTN, hypertension; BMI, body mass index; TG, triglyceride; HDL high-density lipoproteins; INSAUC, area under the curve of insulin levels;
Glucose levels, fasting (FPG), 1 h (Glu 60) and 2 h (Glu 120) after the oral glucose tolerance test (OGTT) are expressed in mg/dl.
Insulin levels, fasting (FPI), 1 h and 2 h after the OGTT, are expressed in µU/ml.
The homeostasis model assessment of insulin resistance (HOMAIR)=fasting insulin (µIU/ml) × fasting glucose (mg/dl) × 0.00247.
The homeostasis model assessment of insulin secretion (HOMABETA) was defined as (20 × fasting insulin)/ (fasting glucose – 3.5).
Data represent mean ± SD.
The frequency of alleles and genotypes of each gene polymorphism from all the subjects is shown in Table 2. For each polymorphism, there was no difference in genotype or allele frequency between HTN and normotensive sibs, neither between Chinese nor Japanese (data not shown). The distribution of genotypes and allele frequencies of the G-6A polymorphism, which is in linkage disequilibrium with M235T, was compatible with other investigations in these two ethnicities.24,32 It is also true for I/D polymorphism of the ACE gene and A1166C of the ATR1 gene.19,21,32 These results indicate that there is no bias in terms of population sampling in our study.
The frequency of genotypes and alleles of each gene polymorphism in total, hypertensive and normotensive subjects
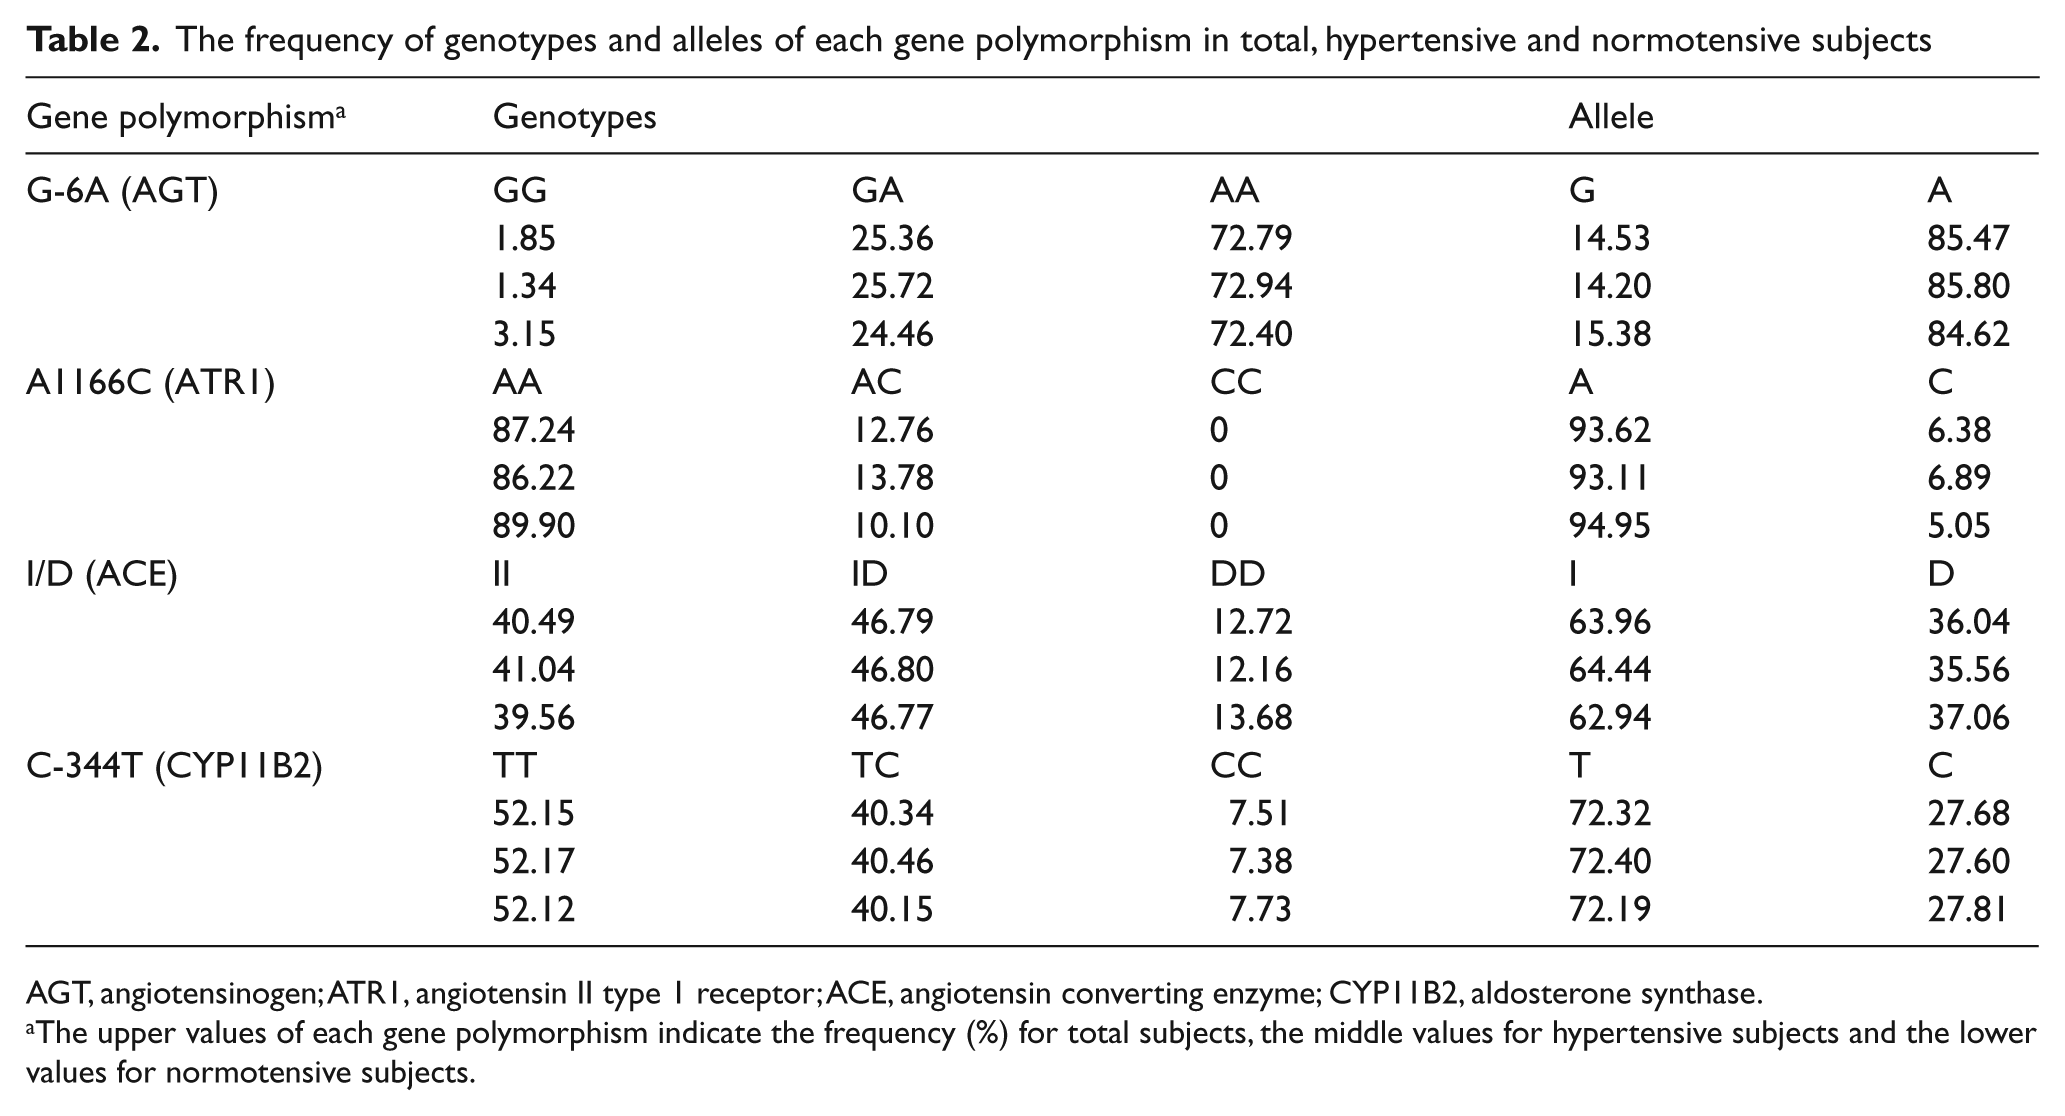
AGT, angiotensinogen; ATR1, angiotensin II type 1 receptor; ACE, angiotensin converting enzyme; CYP11B2, aldosterone synthase.
The upper values of each gene polymorphism indicate the frequency (%) for total subjects, the middle values for hypertensive subjects and the lower values for normotensive subjects.
Differences of metabolic variables in each gene polymorphism
To minimize the potential family effect, we first used the GEE method to analyze the differences in metabolic variables between sibs discordant for each polymorphism within families. Table 3 shows the results of these analyses.
Differences in the metabolic lipids, glucose and insulin levels of OGTT between sibs discordant with individual gene polymorphism analysed by GEE method
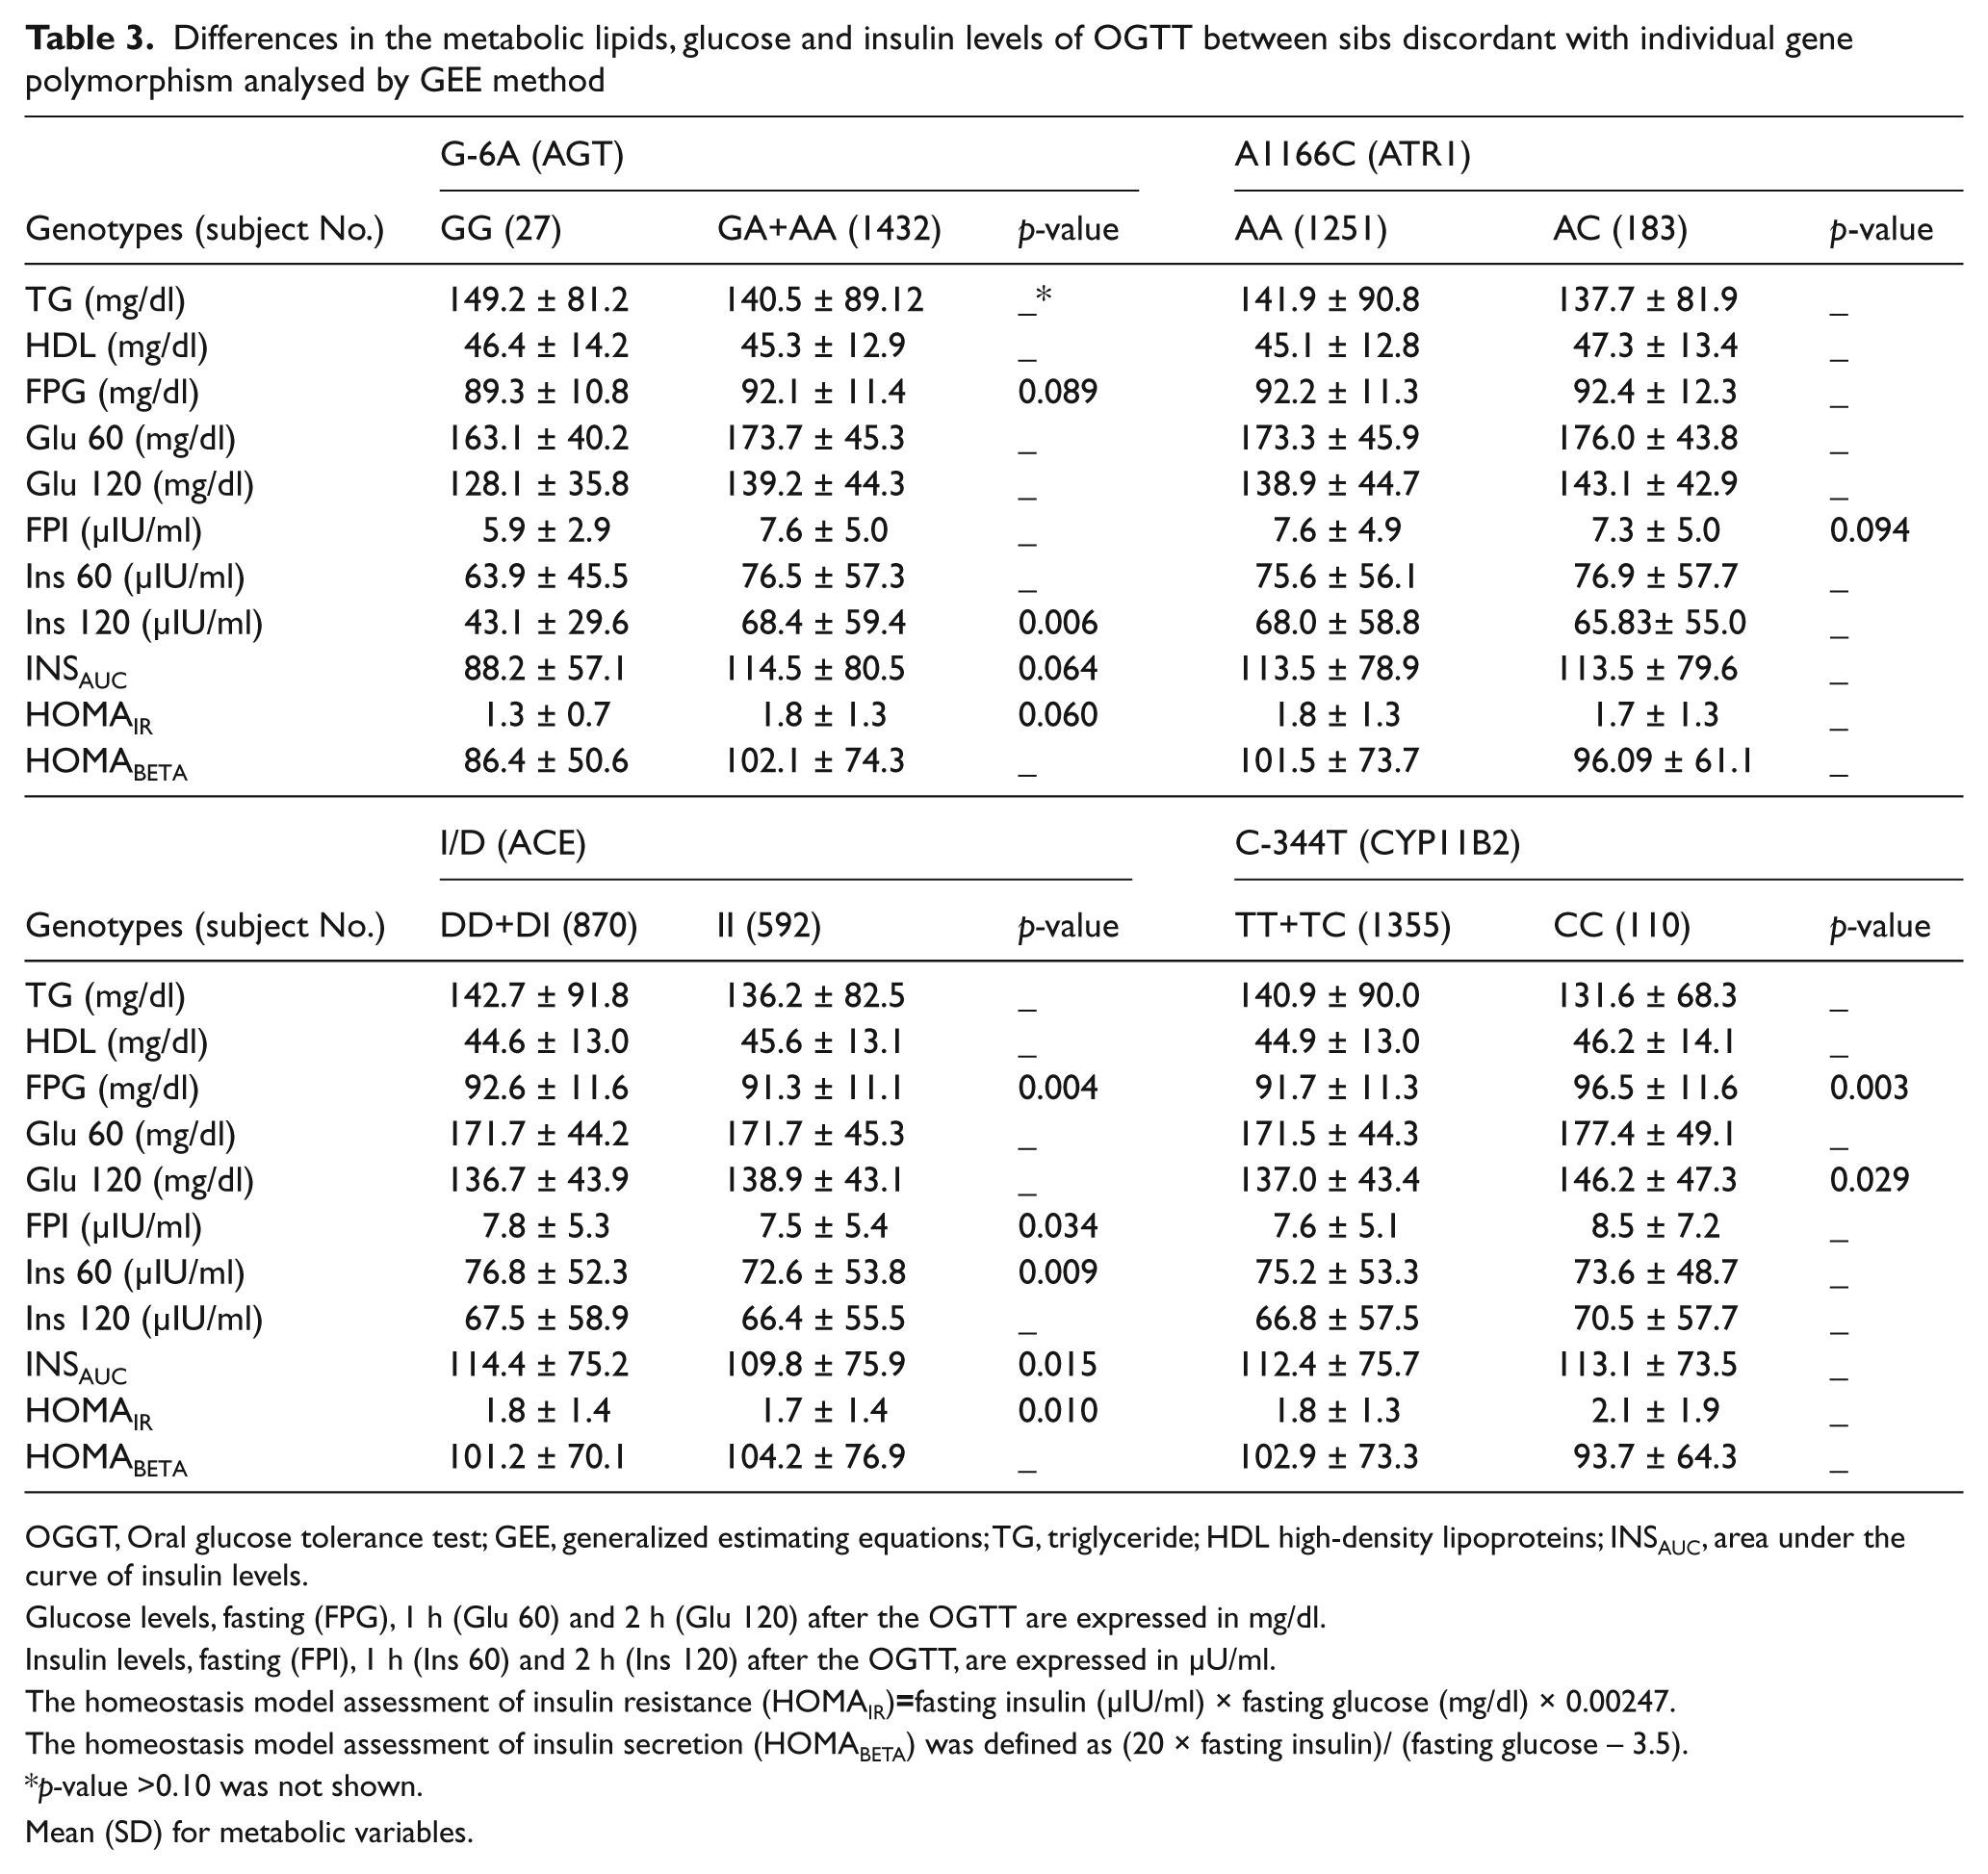
OGGT, Oral glucose tolerance test; GEE, generalized estimating equations; TG, triglyceride; HDL high-density lipoproteins; INSAUC, area under the curve of insulin levels.
Glucose levels, fasting (FPG), 1 h (Glu 60) and 2 h (Glu 120) after the OGTT are expressed in mg/dl.
Insulin levels, fasting (FPI), 1 h (Ins 60) and 2 h (Ins 120) after the OGTT, are expressed in µU/ml.
The homeostasis model assessment of insulin resistance (HOMAIR)=fasting insulin (µIU/ml) × fasting glucose (mg/dl) × 0.00247.
The homeostasis model assessment of insulin secretion (HOMABETA) was defined as (20 × fasting insulin)/ (fasting glucose – 3.5).
p-value >0.10 was not shown.
Mean (SD) for metabolic variables.
G-6A polymorphism of AGT
For the G-6A polymorphism, no difference was found between AA sibs and sibs carrying G allele (data not shown). In the recessive model, GG sibs had lower 2-h insulin than sibs carrying A allele (fold of change=0.63, p=0.006). In addition, marginally higher fasting glucose, area under the curve of insulin levels and HOMAIR were found in GG sibs compared with sibs carrying A allele (fold of changes=0.97, 0.77, and 0.72, p=0.089, p=0.064 and p=0.060, respectively). Also, the odds ratio of getting metabolic syndrome between sibs with G allele and AA sibs is 1.37 (95% confidence intervals (CI), 1.08–1.75, p=0.011) after adjustment for age, gender, smoking, alcohol drinking and sedentary.
A1166C polymorphism of ATR1
Because no CC genotype was detected in our subjects, only the dominant model was analyzed for A1166C polymorphism. There was no significant difference in metabolic variables between AA and AC genotypes (data not shown). However, AA sibs had marginally higher fasting glucose than AC sibs (fold of change=1.04, p=0.094).
I/D polymorphism of ACE
In the dominant model, sibs carrying D allele (DD and DI genotypes) had higher levels of fasting glucose, fasting insulin, 1-h insulin, area under the curve of insulin levels and HOMAIR than II sibs (fold of changes=1.02, 1.04, 1.06, 1.04, and 1.06, p=0.004, 0.033, 0.009, 0.015, and 0.01 respectively). No significant results were observed in the recessive model (data not shown).
C-344T polymorphism of CYP11B2
Sibs carrying T allele had lower levels of fasting glucose and 2-h glucose than their sibs with CC variant (fold of changes=0.97 and 0.94, p=0.003 and p=0.029, respectively), but no difference in all insulin levels, HOMAIR or lipids. In the dominant model analysis, all variables were of no difference between discordant sibs (data not shown).
The HOMAbeta was not different among the polymorphisms examined in these four genes.
Combination of the putative high-risk genotypes
We assessed the effect of the combination of the putative high-risk genotype of the RAAS genes on the metabolic variables with adjustments of covariates. We defined the at-risk as that having a higher glucose level, insulin level, HOMAIR and TG and lower HDL. As shown in Table 3, sibs carrying A allele of AGT, AA genotype of ATR1, D allele of ACE and CC genotype of CYP11B2 were considered as at risk. Only the metabolic variables affected significantly or marginally by at least two genes were considered in the analysis. It can be seen from Table 3 that the analyses were performed on the fasting glucose, fasting insulin, area under the curve of insulin levels and HOMAIR. As shown in Table 4, an increased trend of risk to develop higher metabolic levels was found in sibs harboring a higher number of at-risk genotypes of the RAAS genes. However, only fasting glucose was significantly influenced by the combination of ACE, AGT and CYP11B2. More specifically, sibs carrying three high-risk genotypes had higher fasting level than sibs carrying no high-risk genotypes (fold of change=1.08, p=0.0108). Sibs with two high-risk genotypes of ACE and AGT had higher HOMAIR than sibs without any high-risk genotypes (fold of change=1.18, p=0.074).
Effects of combination of the putative high-risk genotypes on metabolic variables

INSAUC, area under the curve of insulin levels.
Glucose levels, fasting (FPG), 1 h (Glu 60) and 2 h (Glu 120) after the oral glucose tolerance test (OGTT) are expressed in mg/dl.
Insulin levels, fasting (FPI), 1 h (Ins 60) and 2 h (Ins 120) after the OGTT, are expressed in µU/ml.
The homeostasis model assessment of insulin resistance (HOMAIR)=fasting insulin (µIU/ml) × fasting glucose (mg/dl) × 0.00247.
Adjusted for age, gender, log(body mass index), hypertension, smoking, alcohol drinking and sedentary.
Discussion
Association of HTN and IR has been demonstrated by many studies. 33 The association between RAAS and IR has been shown in both clinical and experimental studies.34–38 A study of Pima Indians showed a significant association of the plasma ACE concentration with TG and cholesterol levels, 34 and several studies noted that the circulating components of RAAS were related with body weight, especially in hypertensive patients.35,36 Inhibition of renin or the activities of AII or aldosterone can improve IR in animals.39–41
In this hypertensive sib study, we demonstrated that the polymorphisms of the RAAS genes were associated with metabolic variables of IR. Many association studies of IR with RAAS gene polymorphisms have been done, but with divergent results.18–25 The conflicting observations may result from the differences in sample size, ethnicity, measurements of insulin sensitivity, disease status of insulin resistant syndrome (IRS), or application of statistical programs. To our knowledge, this is the first sib study with a comprehensive analysis of the RAAS genes in IRS. The present study shows that the metabolic variables between sibs discordant for AGT, ATR1, ACE and CYP11B2 gene polymorphisms were significantly different, especially ACE I/D polymorphism. Within these hypertensive families, sibs with D allele of the ACE gene had higher fasting glucose and insulin levels at all time points of OGTT than their II sibs. The difference remained significant regardless of HTN status. The effect of I/D polymorphism on fasting glucose is stronger in combination with AGT and CYP11B2. In addition, the AGT gene polymorphism is associated with metabolic syndrome risk.
Several studies have investigated the significance of ACE gene polymorphism in IR but lead to conflicting results. In contrast to our study, increased insulin sensitivity has been found in NIDDM patients18,20 as well as non-diabetic subjects 20 with the DD genotype. Conversely, higher blood glucose levels and HOMAIR were observed in either diabetic or hypertensive patients with the DD genotype19,22 and in a recent large cohort of healthy subjects. 23 Studies of the same ethnicity as ours showed controversial results; either a higher frequency of I allele noted in subjects with varying components of IRS 25 or no effect of this polymorphism on IR in hypertensive patients.21,37 The discrepancy of these studies may be due to the differences in population size, ethnicity, measurements of insulin sensitivity, status of diabetes or statistical programs. Most of these studies have looked at the effect of the ACE gene in NIDDM patients. The stages of NIDDM may influence the response of insulin to OGTT. 34 In the evolution of NIDDM, the augmented rate of insulin secretion may progressively decline, resulting in less hyperinsulinemia in moderately severe diabetes in comparison with mild diabetes. Therefore, the lower plasma insulin concentrations or area under the curve of insulin in NIDDM patients with the DD genotype may be interpreted of beta-cell decompensation, instead of higher insulin sensitivity as those studies concluded.17,20
Both in vivo and in vitro studies have suggested a role of the RAAS in modulating insulin sensitivity. AII was shown to increase glucose output from rat liver through increased glycogenolysis 9 and decreased gluconeogenesis. 10 The hyperglycemic effect of AII was further emphasized by many studies, which demonstrated an improvement of insulin sensitivity in both diabetic and hypertensive patients treated with ACE inhibitors or ARB.15–17 The mechanism remains unclear, but is further complicated by the observations that short-term infusion of AII increases insulin-mediated glucose disposal in healthy subjects as well as patients with NIDDM. 8 The increased glucose utilization by AII has been assumed to result from a hemodynamic mechanism rather than a direct effect. A cross-talk between insulin and the AII signaling system has been postulated by Folli and his colleagues. 11 They demonstrated, both in vivo and in vitro, that AII could phosphorylate serine, instead of tyrosine, to inhibit the association between insulin-stimulated insulin receptor substrates and phosphatidylinositol (PI) 3-kinase. Activation of PI 3-kinase is the key involving the metabolic effects of insulin. 42 Accordingly, AII may interfere with insulin action directly. High activity of the RAAS may thus be associated with IR. Subjects with the DD genotype are suggested to have higher RAAS activity because their ACE levels are higher. 38 In this context, subjects with D allele are assumed to be more susceptible to IR.
The plasma AGT level may also determine RAAS activity. 43 The M235T polymorphism of the AGT gene was demonstrated to influence plasma AGT levels. 44 In addition, the G-6A in linkage disequilibrium with M235T was shown to affect the transcription activity of the AGT gene. 27 There are few studies examining the association of the AGT gene with IR.20,25,45 One study of obese Japanese women showed an association between IR and M235T polymorphism of the AGT gene. 45 Similar to the other studies, our results only showed a significant effect of G-6A polymorphism on the 2-h insulin.
Recent knowledge of ATR2 makes it more complicated to understand the biological effects of AII. It is not known which receptor is mediated by AII in the modulation of glucose metabolism. The physiological significance of the A1166C single nucleotide polymorphism of the ATR1 gene remains unclear. One study of Chinese subjects with diabetes, HTN and dyslipidemia did not show an association of A1166C polymorphism with this metabolic syndrome. 25 A weak association of this polymorphism with IR was, however, noted in a Japanese general population. 37 In the present study, only the fasting glucose was marginally different in analysis of A1166C discordant sibs. An inverse correlation between plasma aldosterone level and insulin sensitivity has been shown in several studies. 46 An in vitro study demonstrated an inhibition action of aldosterone on the expression of insulin receptor mRNA and insulin binding in human promonocytic cells. 47 As demonstrated in our previous study, sibs with the C-344C variant of aldosterone synthase had a higher risk of diabetes and impaired glucose tolerance, 28 although the effect of this polymorphism on aldosterone levels remains controversial.48,49 In the present study, sibs with −344T allele had lower glucose levels.
In this study, the combined effect among the putative at-risk genotypes of AGT, ACE and CYP11B2 was observed. More specifically, the combination of three at-risk genotypes of AGT, ACE and CYP11B2 were found to increase fasting glucose. These combined effects might be due to the involvement of AGT, ACE and CYP11B2 in inducing susceptibility to high BP. Siani et al. 50 showed that the combination of RAAS is associated with altered renal sodium handling and HTN. Epidemiological studies indicate that arterial HTN and IR are related, 51 suggesting the possibility of a common underlying mechanism. In particular, IR is often associated with dyslipidemia, and essential HTN is associated with metabolic IR and dyslipidemia. Although the exact mechanism of the combined effects of the genetic polymorphisms is not well explained, our results may provide new important data on the combined effects of putative gene–gene in the etiology of human HTN.
In summary, our comprehensive analysis of the RAAS gene polymorphisms demonstrates that AGT, ACE and CYP11B2 gene polymorphisms are associated with different levels of glucose and insulin in hypertensive families. Specifically, sibs with D allele genotypes of the ACE gene are more insulin resistant than their sibs with the II genotype. There was no bi-gene interaction on the metabolic variables. Our data suggest that the RAAS plays an important role in IR in Chinese and Japanese hypertensive families.
Footnotes
Funding
This study was supported by grants (NSC-85–2331-B002–350Y, NSC-86–2314-B002–345Y, and NSC-87–2312-B002–021Y) from the National Science Council, Taiwan, ROC, National Health Research Institutes Grant BS-093-PP-01, and UO1 HL54527–0151 from the National Heart Lung and Blood Institute, USA.
Conflict of interest
None declared.