
Abstract
Introduction
Lumbar disc herniation (LDH) involves inflammation and metabolic stress. Tissue-specific renin-angiotensin-aldosterone system (RAAS) signaling may act as an upstream regulator of disc degeneration. This study investigates RAAS dysregulation as a central driver of LDH and its contribution to inflammation, metabolic reprogramming, and disc injury.
Methods
Bulk and single-cell transcriptomics assessed RAAS activity, while MR/GWAS analyses examined causality. Machine learning with the MIMIC database identified biomarkers. In vitro nucleus pulposus cell experiments validated the ACE2/Ang(1–7)/MAS1 protective axis.
Results
RAAS components ACE, AGTR1, ACE2, AGTR2, and MAS1 were dysregulated in LDH across disc cells, immune populations, and endothelium, with a shift toward glycolysis. Patients showed elevated Ang II/Ang(1–7) ratios. Ang II induced NF-κB mediated inflammation, extracellular matrix degradation, and apoptosis, reversible by losartan or protective axis activation.
Conclusion
RAAS dysregulation serves as an upstream hub driving inflammation, metabolic imbalance, extracellular matrix breakdown, and disc cell injury in LDH. Therapeutic strategies should suppress the ACE/Ang II/AT1 axis while enhancing the ACE2/Ang(1–7)/MAS1 protective pathway.
Integrated multi-omics analyses identify renin–angiotensin system dysregulation as a key driver of lumbar disc herniation. Classical ACE/Ang II signaling promotes inflammation and matrix degradation, whereas the ACE2/Ang-(1–7)/MAS1 axis counteracts degenerative processes.
Keywords
Introduction
Lumbar disc herniation (LDH) represents one of the most prevalent degenerative spinal disorders and remains a leading contributor to global disability due to low back pain and radiculopathy.1,2 Recent clinical advances, including open spinal endoscopy, have significantly improved therapeutic outcomes for LDH, underscoring the importance of understanding its molecular underpinnings. 3 Traditionally, LDH has been attributed primarily to mechanical overload and age-related disc attrition. 4 However, accumulating evidence now supports the concept that disc degeneration is not a purely passive wear-and-tear phenomenon, but rather an active and multifactorial pathological process characterized by chronic inflammation, extracellular matrix breakdown, metabolic stress, immune cell infiltration, and progressive cellular injury within the intervertebral disc niche.5,6 In particular, oxidative stress has been increasingly recognized as a key mediator in this degenerative cascade, with excessive reactive oxygen species inducing nucleus pulposus cell senescence and promoting extracellular matrix degradation. 7
Inflammatory activation is increasingly recognized as a central driver of LDH progression.8,9 Degenerated intervertebral discs exhibit elevated production of pro-inflammatory cytokines, activation of the NF-κB signaling pathway, and recruitment of both innate and adaptive immune cells, which collectively amplify catabolic remodeling within the disc microenvironment. These inflammatory cascades are closely associated with extracellular matrix degradation mediated by matrix metalloproteinases and aggrecanases, and are also modulated by post-translational modifications, including ubiquitination and SUMOylation, ultimately contributing to the progressive disruption of disc structural integrity.10,11 In addition, the disc microenvironment is profoundly influenced by reactive oxygen species accumulation and pyroptotic cell death, both of which accelerate extracellular matrix degradation and disrupt tissue homeostasis. 12 Within this complex microenvironment, disc-resident cells—particularly nucleus pulposus cells—must adapt to a uniquely avascular and hypoxic niche, where metabolic reprogramming and stress-response pathways critically determine cellular fate and tissue resilience. In this context, the fate of nucleus pulposus cells is governed by a dynamic interplay between hypoxia-responsive signaling pathways and extracellular matrix–derived cues. Recent evidence further indicates that dysregulation of cellular stress responses, particularly autophagy and ferroptosis, contributes to progressive nucleus pulposus cell loss during intervertebral disc degeneration. 13 Beyond these intracellular stress pathways, recent studies have also highlighted the critical role of the innate immune system in disc degeneration. Notably, targeted confinement of inflammatory cascades within the nucleus pulposus has been shown to promote tissue regeneration, reinforcing the concept that modulation of inflammatory signaling represents a promising therapeutic strategy for intervertebral disc disease. 14 Given the complexity of these interconnected regulatory processes, multi-omics approaches have proven increasingly valuable for dissecting host–microenvironment interactions in musculoskeletal disorders. For instance, recent studies integrating transcriptomic, metabolomic, and microbiome datasets have successfully uncovered regulatory networks such as the gut–bone axis in osteoporosis.15,16 Despite these advances, most mechanistic studies have focused on isolated pathways, leaving unresolved the question of whether an upstream regulatory system coordinates inflammatory, metabolic, vascular, and degenerative signaling in LDH. 17
The renin–angiotensin–aldosterone system (RAAS), classically viewed as a cornerstone of cardiovascular and blood pressure homeostasis, is now increasingly appreciated as a locally active regulatory network in diverse non-cardiovascular tissues, including the intervertebral disc.18,19 Consistent with this concept, tissue-specific activation of the renin–angiotensin system (RAS) has been increasingly implicated in the pathogenesis of various non-cardiovascular disorders, where local angiotensin II signaling contributes to niche-driven disease progression through paracrine regulatory mechanisms. 20 Beyond its classical systemic functions, tissue-resident RAS signaling exerts pleiotropic regulatory effects on inflammation, fibrosis, oxidative stress, apoptosis, and metabolic homeostasis.21,22 In particular, emerging evidence suggests that crosstalk between angiotensin II signaling and peroxisome proliferator–activated receptor gamma (PPARγ) pathways modulates inflammatory and fibrotic responses across multiple tissues, providing mechanistic insight into how RAS interfaces with metabolic regulatory networks. 23 Importantly, the classical ACE/angiotensin II/AT1 receptor (AGTR1) axis is broadly associated with pro-inflammatory and pro-degenerative actions, whereas the counter-regulatory ACE2/angiotensin-(1–7)/MAS1 pathway confers anti-inflammatory and tissue-protective effects.24,25 The renin–angiotensin system maintains an internal balance between its classical and counter-regulatory signaling axes . Dysregulation of this equilibrium has been implicated in numerous chronic inflammatory and degenerative diseases; however, its mechanistic contribution to intervertebral disc pathology remains poorly defined.26,27 In particular, whether RAS imbalance functions as an upstream regulatory hub linking immune activation, metabolic adaptation, extracellular matrix remodeling, and disc cell injury in lumbar disc herniation (LDH) has not been systematically investigated. 28 Consistent with this knowledge gap, a recent comprehensive review on inflammatory biomaterials for intervertebral disc regeneration highlights that inflammation-targeted therapeutic strategies hold substantial translational promise for disc disease, yet the specific role of RAS-mediated inflammatory regulation remains to be elucidated. 29
In this study, we integrated bulk transcriptomics, single-cell RNA sequencing, Mendelian randomization, machine learning-based prioritization, clinical RAS-related biomarker profiling (including renin, plasma renin activity, angiotensin II, angiotensin-(1–7), and aldosterone), and mechanistic cell-based validation to delineate the role of RAS dysregulation in LDH. By combining systems-level discovery with functional interrogation of angiotensin II-driven inflammatory and catabolic responses in nucleus pulposus cells, we aimed to identify upstream regulatory axes that orchestrate LDH-associated molecular degeneration. Our findings demonstrate that a consistent shift toward classical RAS activation, together with attenuation of counter-regulatory protective signaling, is evident across transcriptomic, cellular, genetic, metabolic, and clinical layers. Collectively, these results position RAS imbalance as a potential upstream regulator of inflammatory activation, metabolic disturbance, extracellular matrix degradation, and disc cell injury, thereby highlighting therapeutic modulation of RAS signaling as a promising translational avenue for LDH intervention.
Materials and methods
Bulk transcriptomic data acquisition and preprocessing
We retrieved two independent gene expression datasets, GSE124272 and GSE150408, associated with LDH from the GEO database.30,31 The future analyses leveraged data from raw expression matrices and clinical annotations. Based on the platform annotation files, probes were annotated to gene symbols. For probes that mapped to the same gene, the average expression value was taken. We performed background correction, normalization, and log2 transformation in R (version 4.2.0), following standard pipelines. To mitigate potential batch effects across different datasets, we applied ComBat batch correction using the “sva” package in R, ensuring that observed gene expression changes were not confounded by technical artifacts related to platform effects. Probes were annotated to gene symbols, and for probes mapping to the same gene, the average expression value was used.
Differential expression analysis
We utilized the “limma” analysis package in R to identify differentially expressed genes (DEGs) between the LDH sample group and the healthy control group. Genes meeting both the criteria of an absolute log2 fold change greater than 1 and a corrected P-value less than 0.05 were deemed statistically significant. For each obtained dataset, we generated visualizations such as volcano plots and boxplots for data visualization.
Functional enrichment and pathway analysis
In the data analysis phase, we utilized the clusterProfiler software package to perform Gene Ontology (GO) enrichment analysis and Kyoto Encyclopedia of Genes and Genomes (KEGG) pathway analysis. To more intuitively present the distribution characteristics of the enrichment results, we adjusted P-values were used for visualization. Gene Set Enrichment Analysis (GSEA) was implemented using the fgsea software package, with the corrected gene sets derived from the Molecular Signature Database (MSigDB). Pathways with a false discovery rate below 0.25 were identified as significantly enriched.
Immune cell infiltration analysis
We determined the relative immune cell proportions using computational deconvolution methods implemented in the CIBERSORT algorithm, based on normalized expression matrices derived from bulk transcriptomic data of intervertebral disc tissue, not peripheral blood. As CIBERSORT is sensitive to tissue context, it is essential to note that this analysis was based solely on intervertebral disc tissue samples. Boxplots were used to visualize the differences in immune cell infiltration between LDH and control samples, and statistical significance was determined using P-values < 0.05. This computational deconvolution approach has been widely adopted for characterizing tissue-specific immune landscapes, including in bioinformatic analyses of immune infiltration patterns in cancer and degenerative diseases. 32
Weighted gene co-expression network analysis
We employed the “WGCNA” software package in R to conduct Weighted Gene Co-expression Network Analysis (WGCNA), aiming to identify gene modules associated with LDH status. The appropriate soft threshold power parameter was selected based on the scale-free topology criterion. Correlation analysis was performed between clinical feature data and module characteristic genes to screen for modules associated with disease. Further analysis was conducted on genes within modules that exhibited strong correlation with LDH. WGCNA has been increasingly applied to identify disease-associated gene co-expression modules in complex multifactorial conditions, including its recent use for biomarker discovery in degenerative and inflammatory diseases. 33
Single-cell RNA sequencing analysis
The single-cell RNA sequencing dataset GSE251686 was obtained from GEO. 34 Using the “Seurat” package, we performed quality control, normalization, dimensionality reduction, clustering, and differential expression analyses. Any cells having low gene counts or high mitochondrial gene percentages were removed. Cell type annotation was performed using marker genes. We identified the differentially expressed genes between LDH and control samples of each cell population for pathway enrichment and GSEA analyses. This single-cell analytical framework has been successfully applied to characterize the heterogeneous cellular composition of degenerating intervertebral discs, enabling the identification of cell type-specific transcriptomic signatures and intercellular signaling networks. 35
Mendelian randomization and colocalization analysis
Summary statistics from three genome-wide association study (GWAS) datasets related to LDH (ukb-b-6798, ukb-b-18279, and ukb-b-19054) were obtained from publicly available resources. Summary-data-based Mendelian randomization (SMR) analysis based on pooled data was conducted to investigate the association between gene expression and the risk of LDH disease. Heterogeneity in dependent instruments tests were applied to assess pleiotropy. Colocalization analysis was performed to examine shared causal variants between expression quantitative trait loci (eQTLs) and LDH GWAS signals. Instrumental variables were selected based on genome-wide significant expression quantitative trait loci (eQTLs) (P < 5 × 10⁻⁸) with linkage disequilibrium pruning (r2 < 0.01 within a 10,000 kb window). The SMR analysis assumes that the genetic variant influences disease risk through gene expression in the absence of horizontal pleiotropy. Heterogeneity in dependent instruments tests were conducted to assess potential pleiotropy. Multiple testing correction was performed using false discovery rate adjustment. Sensitivity analyses were applied to ensure robustness of the identified associations.
Metabolite association analysis
Metabolite-related Mendelian randomization analyses were conducted using available metabolomic GWAS summary statistics. Associations between LDH and metabolites related to the RAS (including aldosterone-related endocrine readouts), lipid metabolism, and energy metabolism were evaluated. Effect sizes and statistical significance were visualized using scatter plots.
Machine learning analysis
The “glmnet” package was employed to implement least absolute shrinkage and selection operator (LASSO) regression analysis, aiming to screen informative features from core RAS-related genes. The performance of the constructed models was evaluated using a standardized confusion matrix. Feature importance was analyzed through two methods: mean reduction in impurity and permutation importance. The predictive results of the models were interpreted using SHapley additive explanation analysis. The “pROC” package was utilized to calculate the receiver operating characteristic (ROC) curve and the area under the curve (AUC) value. Machine learning-based feature selection and diagnostic model construction have been increasingly adopted for biomarker discovery in complex diseases, providing robust prediction frameworks that complement traditional statistical approaches. 36
Clinical data analysis
All clinical data were extracted from the MIMIC-IV database (version 2.2), a publicly available critical care database containing de-identified patient records. LDH cases were identified using ICD-9 and ICD-10 diagnostic codes (listed in Supplementary Table S1) from the diagnoses_icd table. Control subjects were selected from patients without LDH diagnostic codes during the same hospitalization period. Structured query language was used to extract laboratory measurements from the labevents table. Laboratory item IDs (Supplementary Table S2) corresponding to renin activity and aldosterone were identified based on database documentation and verified through manual inspection. Only patients with available laboratory records for these measurements were included in the comparative analysis. The Ang II/Ang-(1–7) ratio was calculated using available recorded measurements where applicable. Because endocrine-related biomarkers are not routinely measured in all ICU patients, the analysis was restricted to the subset of patients with documented laboratory data. Inclusion and exclusion criteria, ICD codes, laboratory item IDs, and query workflow are provided in Supplementary Methods.
Cell culture and treatments
Human nucleus pulposus cells (NPCs) were cultured under standard temperature and CO2 conditions in DMEM (Dulbecco's modified Eagle's medium) supplemented with 10% fetal bovine serum and antibiotics. The cells received treatments with angiotensin II for 24 h, unless otherwise specified. For AT1 receptor blockade experiments, cells were pretreated with losartan for 1 h prior to Ang II stimulation and maintained throughout the stimulation period. In protective pathway activation experiments, cells were treated with angiotensin-(1–7) for 24 h. The selected concentrations were based on prior literature and preliminary dose–response optimization experiments to ensure robust biological responses without inducing excessive cytotoxicity. All reported results correspond to the final working concentrations described above. Control groups consisted of untreated cells. The cells were transfected with oe-ACE2 and its negative control (oe-NC) (both purchased from GenePharma Co, Ltd, Shanghai, China) at a final concentration of 100 ng/μL using a transfection reagent (Lipofectamine 2000, Invitrogen, Carlsbad, CA, USA). Experiments were conducted on cells 24 h after transfection. 37
Cell isolation, enzymatic digestion, and hypoxic culture
Mice were anesthetized by intraperitoneal injection of sodium pentobarbital and were killed by cervical dislocation. The lumbar spine was collected and the intervertebral disc was dissected after disinfecting in 75% ethanol for 5 min. The nucleus pulposus tissues were collected in a 15 mL centrifuge tube containing 0.25% trypsin and digested at 37°C for 15 min under gentle shaking. The samples were centrifuged at 1000 rpm for 5 min in the temperature range of 22–24°C, and the supernatant was discarded. The leftover rosette was incubated with 0.25% type II collagenase and digested at 37°C under continuous shaking for 6 h. The cells were then centrifuged again at 1000 rpm for 5 min and supernatant discarded. After washing cell suspension with PBS once more and centrifuging again, it was resuspended for culture. Primary nucleus pulposus cells were cultured in Dulbecco's modified Eagle's medium (DMEM; Sigma, D6046) supplemented with 10% FBS including antibiotics. The hypoxia workstation Invivo2 400 (Baker Ruskinn, Bridgend, UK) was used to expose the cells for 24 h in a controlled environment containing 1% O₂, 5% CO₂, and 94% N₂ before protein extraction. For induction of mitophagy, cells were incubated with deferiprone (1 mM; Sigma, 379409) for 24 h.
Immunocytochemistry
DFP-treated nucleus pulposus cells were seeded onto sterile glass coverslips. Following the execution of experimental treatments, the cells were incubated with MitoTracker Red CMXRos (100 nM; Thermo Fisher Scientific, M7512) for 30 min. The cells were then fixed for 15 min in 4% paraformaldehyde or ice-cold methanol and permeabilized using 0.1% Triton X-100 (Sigma, T8787) for 10 min. To prevent non-specific binding, we used 1% BSA (Thermo Fisher Scientific, BP9706) for 1 h. The cells incubated overnight with primary antibodies at 4°C. After washing, samples were incubated with Alexa Fluor 488-conjugated secondary antibody (Jackson ImmunoResearch, 712-545-150). Coverslips were mounted using ProLong Gold antifade reagent containing DAPI (Invitrogen, P36971). Fluorescence images were acquired using a Zeiss LSM 800 Axio inverted confocal microscope.
Quantitative real-time polymerase chain reaction
Total RNA was extracted using TRIzol reagent and reverse-transcribed into cDNA. Real-time quantitative polymerase chain reaction was performed with SYBR Green chemical reagent. Relative gene expression was calculated using the 2^−ΔΔCt method, with GAPDH selected as the internal reference gene.
Immunofluorescence staining
NPCs were plated at a density of 1 × 10⁴ cells in 24-well culture plates. Subsequently, these plates were incubated at 37°C humidified incubator with 5% CO₂ for 24 h to allow cell adherence. Thereafter cells were transferred into different experimental groups and treated. The cells were washed with PBS thrice (3 min each) after the treatments. The subsequent protocol consists of a fixation using 4% paraformaldehyde at room temperature for 20 min, followed by three washes in PBS. Cells were treated with 0.3% Triton X-100 for 10 min at 20°C and washed again three times with PBS. Thereafter, immunostaining blocking solution was used to block cells for 30 min at room temperature. The primary antibody was applied and incubated overnight at 4°C. The following day, cells underwent a triple wash with pre-chilled PBS. The secondary antibodies were then added and incubated for 1 h at room temperature in dark. The nuclei were counterstained for 20 min in an antifade mounting medium containing DAPI after three further washes with PBS (3 min each). Fluorescence microscope was used for visualization and capturing of fluorescence signals.
Cell viability and apoptosis assays
Cell viability was assessed using the Cell Counting Kit-8 (CCK-8) assay. Cells were seeded at a density of 4000 cells per well in 96-well plates with complete medium. After 48 h, the medium was replaced with complete medium supplemented with Ang-1-7 (1 μM; HY-12403; MedChemExpress), a Mas receptor agonist, dissolved in sterile water. Due to the short half-life of Ang-(1–7), the medium was replaced every 24 h. All experiments were performed with 5 technical replicates (multiple wells within the same plate) and 3–5 biological replicates (cells from different passages of the same cell line). Technical replicates were averaged for each independent experiment prior to intergroup comparisons. Apoptosis was evaluated by Annexin V/propidium iodide staining followed by flow cytometric analysis.
Enzyme-linked immunosorbent assay
After treatment for 72 h, culture supernatants were collected, and interleukin-6 (IL-6) levels were measured using standard ELISA kits (DuoSet®, R&D Systems, DY008). To put it briefly, 100 µL per well of diluted capture antibody at the recommended working concentration was applied to microplates and incubated overnight at room temperature. The next day, plates were washed with PBS containing 0.05% Tween-20 (pH 7.2-7.4). To ensure their proper utilization, plates were prepared in advance, by having them blocked with 300 µL of blocking buffer, which is 1% BSA (bovine serum albumin) in PBS (Phosphate-buffered saline) for at least 1 h at room temperature. This buffer is sterile-filtered through a 0.2 µm membrane. After washing, standards and samples were diluted in reagent diluent composed of 0.1% BSA and 0.05% Tween-20 in Tris-buffered saline (TBS: 20 mM Trizma base, 150 mM NaCl, pH 7.2–7.4, 0.2 µm filtered). The wells were supplied with diluted standards or samples and were allowed to incubate for 2 h at room temperature. After several washes, a 100 µL addition of streptavidin-HRP working solution for each well was done and incubated for 20 min in dark. The plates were again washed and the substrate solution (H₂O₂ and tetramethylbenzidine in a 1:1 mixture) was added for 20 min at room temperature in light-protected conditions. The chemical reaction was stopped by adding dropwise 2N H₂SO4 and absorbance measurement was done at 450 nm with a correction at 570 nm using a microplate reader.
Statistical analysis
All statistical analysis was performed using GraphPad Prism v8.0 (GraphPad Software, Inc., La Jolla, CA, USA). The normality test was done using Shapiro–Wilk test. A Student's t-test or one-way analysis of variance was performed for normally distributed data, depending on the experimental design. Nonparametric analyses, including the Kruskal–Wallis test, were applied to variables with non-normal distributions. Mann-Whitney U tests were used for pairwise comparisons. Statistical significance had a two-sided p value <0.05.
Results
Global transcriptomic remodeling in lumbar disc herniation reveals a coordinated inflammatory-homeostatic imbalance
We first performed differential expression analyses on two independent GEO datasets, GSE124272 and GSE150408, to delineate the molecular landscape underlying LDH (Supplementary Figure 1–5, Figure 1). Volcano plots showed widespread and concordant changes in expression that occurred between LDH samples and healthy controls in both cohorts. This indicates dramatic changes to disease-associated gene expression programs (Figure 1A and B). The markedly dysregulated transcripts included those linked to inflammatory signaling, extracellular matrix remodeling, and vasoactive regulatory processes. As with the global patterns, boxplots of the most differentially expressed genes showed highly reproducible gene expression changes (Figure 1C and D). Pro-inflammatory factors, such as IL6 and TNF, were upregulated together with matrix-degrading enzymes, such as MMP1 and vasoactive or enzymatic regulators in the LDH samples; whereas structural-maintenance and regulatory-restraint genes were relatively downregulated. This bidirectional transcriptional shift suggests a reconfiguration of tissue equilibrium rather than isolated pathway perturbations.
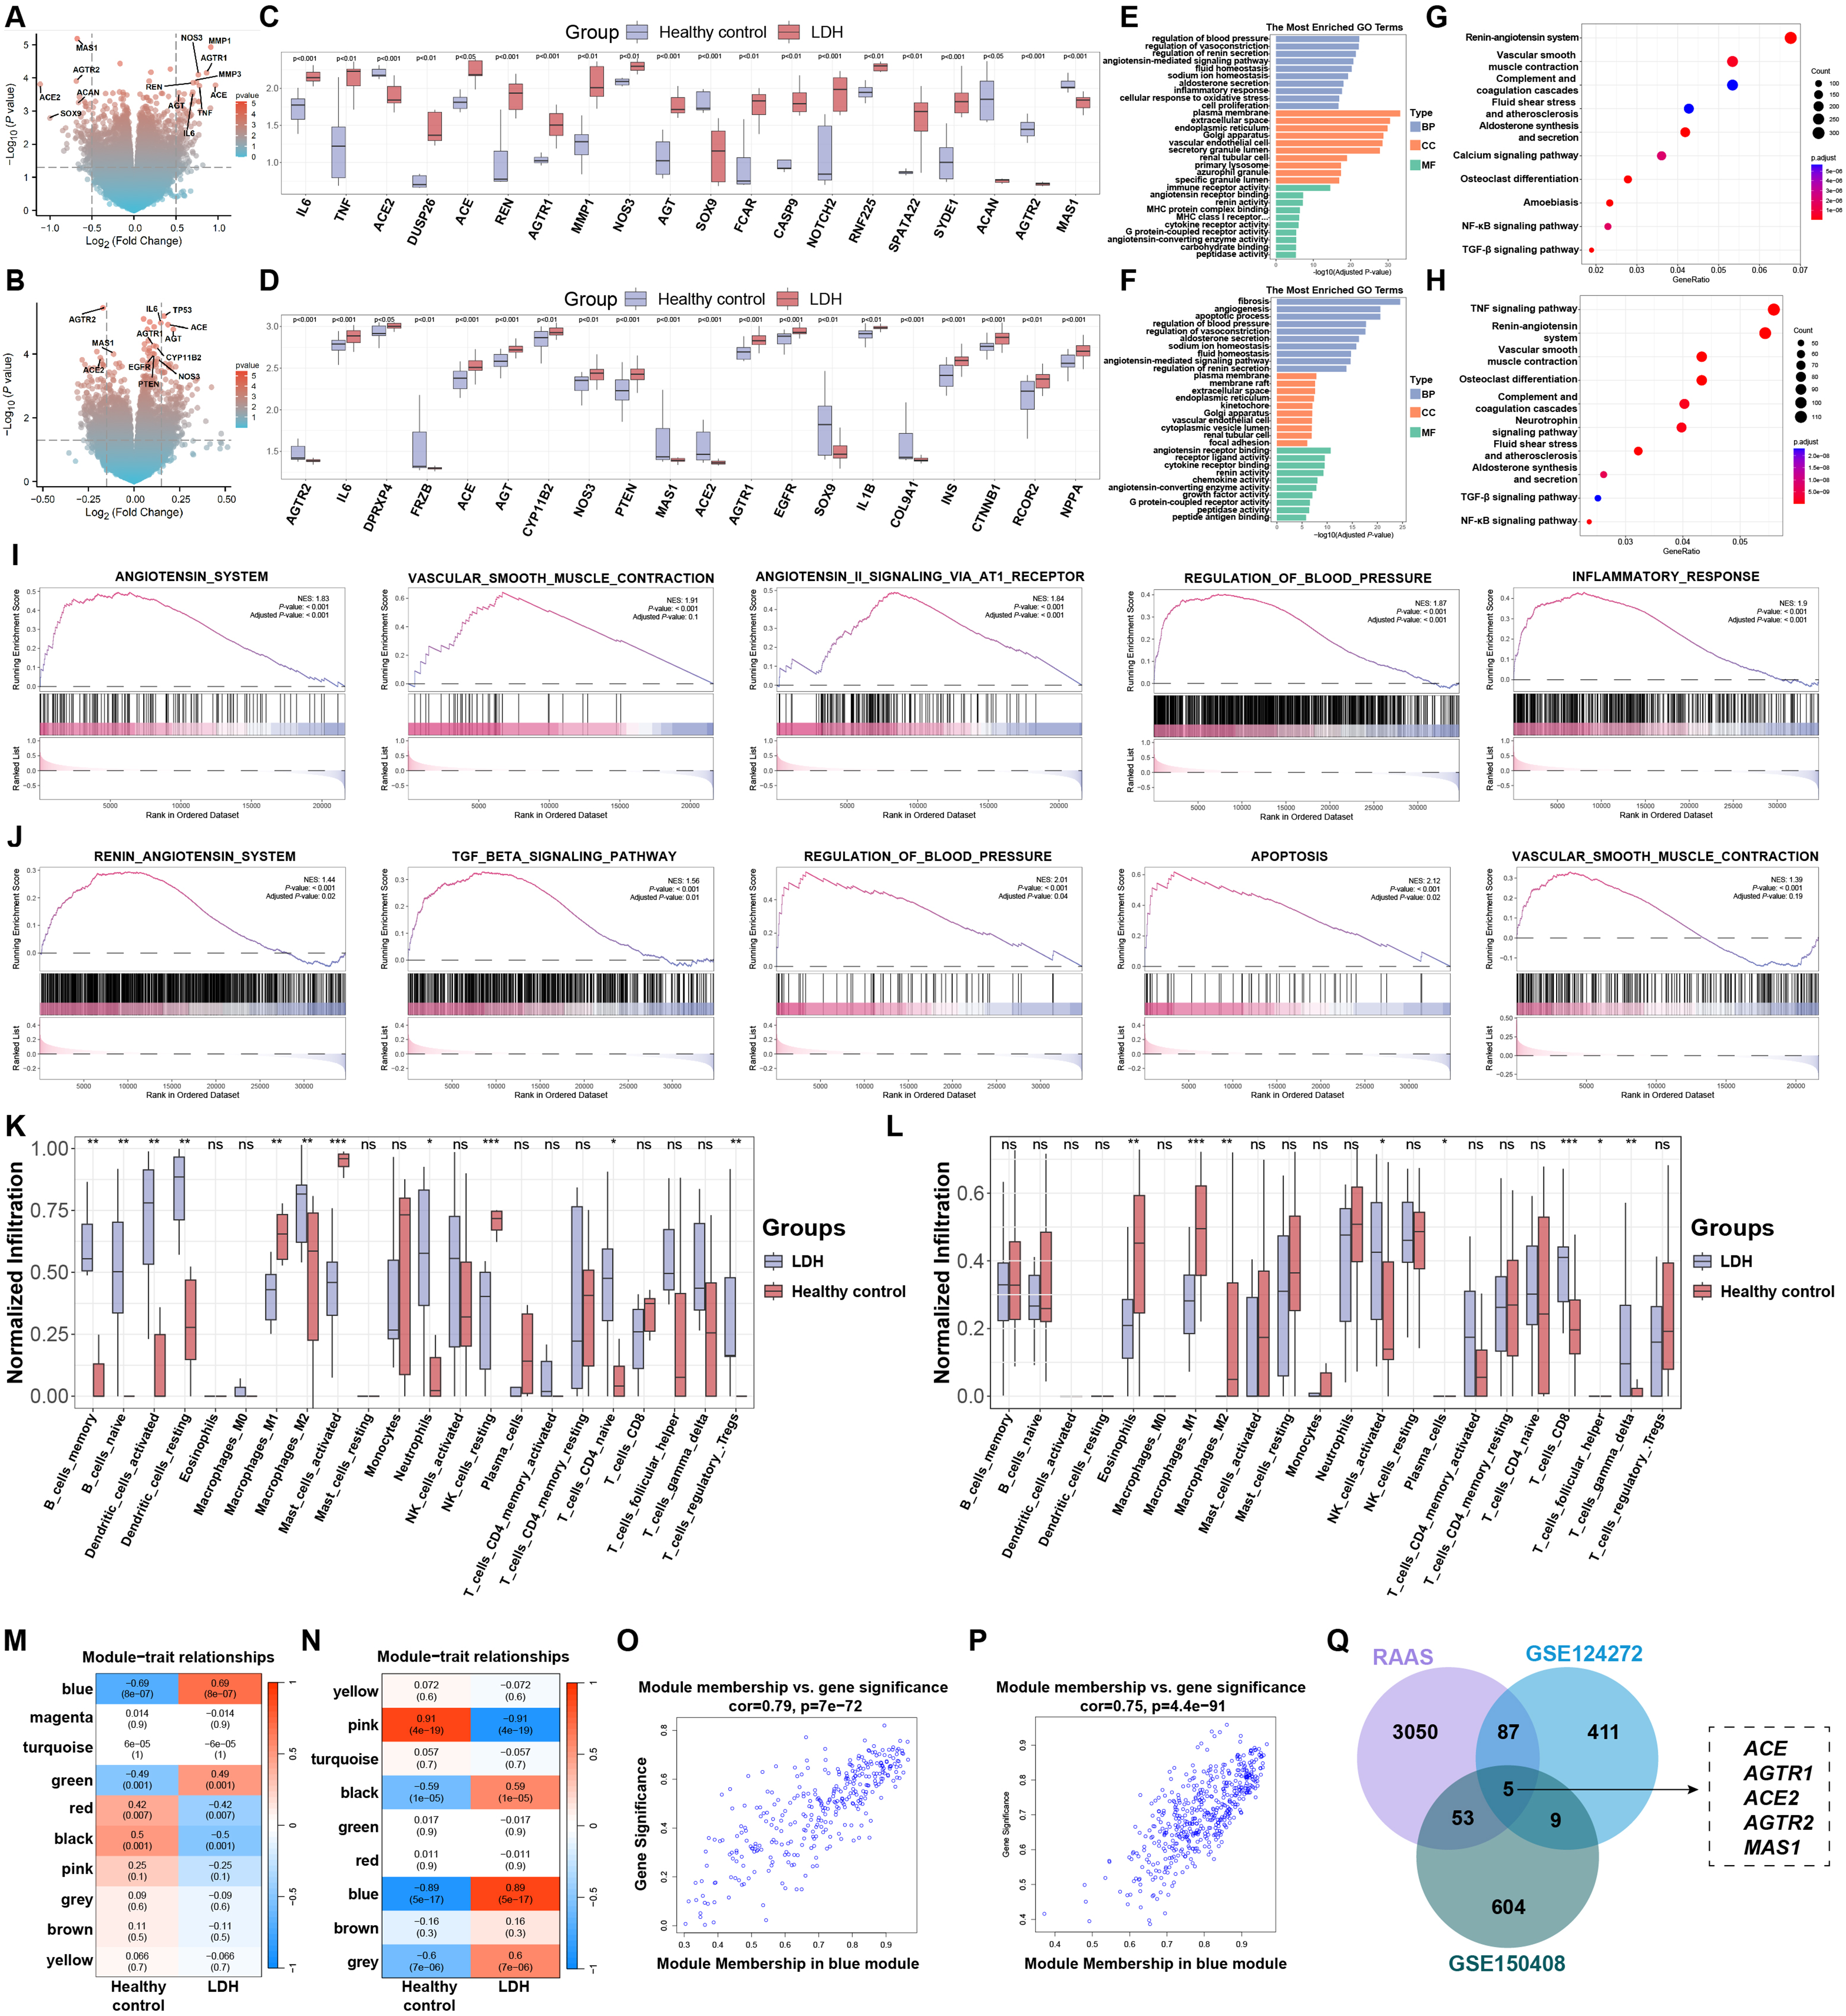
Global transcriptomic remodeling and identification of a disease-associated renin-angiotensin system signature in lumbar disc herniation. (A, B) Volcano plots showing differentially expressed genes between lumbar disc herniation samples and healthy controls in the GSE124272 (A) and GSE150408 (B) datasets. Red and blue dots represent significantly upregulated and downregulated genes, respectively. (C, D) Boxplots illustrating the expression patterns of representative top differentially expressed genes in LDH and control samples in GSE124272 (C) and GSE150408 (D). (E, F) GO enrichment analysis of differentially expressed genes in GSE124272 (E) and GSE150408 (F), highlighting enriched molecular functions, cellular components, and biological processes. (G, H) KEGG pathway enrichment analysis showing significantly enriched signaling pathways associated with inflammation, extracellular matrix remodeling, vascular regulation, and the renin-angiotensin system in GSE124272 (G) and GSE150408 (H). (I, J) GSEA demonstrating coordinated enrichment of angiotensin-related, inflammatory, fibrotic, and vascular regulatory pathways in LDH samples from GSE124272 (I) and GSE150408 (J). (K, L) Immune cell infiltration analysis comparing the relative abundance of immune cell populations between LDH and control samples in GSE124272 (K) and GSE150408 (L). (M, N) Module-trait relationship heatmaps derived from WGCNA identifying LDH-associated gene modules in GSE124272 (M) and GSE150408 (N). (O, P) Scatter plots depicting the relationship between gene significance for LDH and module membership within the disease-associated modules. (Q) Venn diagram showing the overlap between genes in the LDH-associated co-expression modules and curated renin-angiotensin system-related genes, highlighting shared core components. Statistical significance is indicated as ns (not significant), *P < 0.05, **P < 0.01, and ***P < 0.001.
GO enrichment analysis additionally illustrated the biological processes relevant to these transcriptional changes. Within both datasets, molecular functions related to peptidase activity, G protein-coupled receptor activity, cytokine receptor activity, and angiotensin-converting enzyme activity along with extracellular space, plasma membrane, and vascular-associated organelles were significantly enriched with differentially expressed genes (Figure 1E and F). Enrichment analysis at the biological process level showed strong enrichment for inflammatory response, regulation of blood pressure, sodium ion homeostasis, fluid balance, and aldosterone secretion. This indicates that transcriptional remodeling associated with LDH causes a divergence away from just local turnover within the matrix. As shown in KEGG pathway analysis, consistent enrichment of pathways like TGF-β signaling, NF-κB signaling, vascular smooth muscle contraction and the renin-angiotensin system was observed (Figure 1G and H). The concurrent activation of inflammatory, fibrotic, and vasoactive pathways indicates that LDH is characterized by a tightly coupled regulatory network in which immune activation and homeostatic control are jointly engaged.
To study pathway level coherence across the whole range of expression we did GSEA. In the GSE124272 dataset, we found that gene sets associated with Angiotensin System, angiotensin II signaling via AT1 receptor, vascular smooth muscle contraction, regulation of blood pressure and inflammatory response were significantly and positively enriched in LDH samples (Figure 1I). Parallel analysis of GSE150408 revealed that the renin-angiotensin system, TGF-β signaling pathway, apoptosis, and vascular regulators were consistently enriched (Figure 1J). Significantly, these enriched gene sets do not operate in isolation but instead show characteristics of overlapping enrichment, therefore showcasing that vasoactive signaling, inflammatory responses and tissue remodeling constitute a cohesive transcriptional program in LDH. This points to an upstream regulatory axis that can coordinate vascular tone, inflammatory signaling, and extracellular matrix remodeling pathways.
Analyzing immune cell infiltration through deconvolution analysis, we next examined transcriptomic levels in light of the strong inflammatory signature. Both datasets unveiled altered infiltration patterns of LDH samples, marked by higher representation of innate immune populations, including macrophage subsets and neutrophils, as well as changes in activated DCs and T cell subpopulations (Figure 1K and L). The various cohorts shared remarkable similarities regarding these altered immune parameters in LDH, supporting a stable remodelling of the local immune microenvironment. The disruption of regulatory balance between injury response and tissue maintenance in LDH is further supported by the coexistence of heightened inflammatory signaling and immune cell redistribution.
Weighted gene co-expression network analysis was done on both datasets to explore higher-order transcriptional organization. The analysis of module-trait relationships consistently revealed a blue module that correlated strongly with LDH status in different cohorts (Figure 1M and N). In this module, gene significance and module membership were highly correlated, indicating that highly-connected genes were also highly disease-associated (Figure 1O and P). The functional inspection results of this module highlighted the co-localization of inflammatory mediators, extracellular matrix regulators, and vascular and enzymatic control genes suggesting that they act as a unit and not as separate pathways.
To examine the biological identity of the LDH-associated blue module in more detail, we with the RAS-related gene set curated from GeneCards. Both datasets have five common genes found in the disease modules: ACE, AGTR1, ACE2, AGTR2, and MAS1 (Figure 1Q). The co-expression module association of LDH with both classical (ACE, AGTR1) and counter-regulatory (ACE2, AGTR2, MAS1) components put forth that it is linked not just with activation of a signaling arm, but a highly coordinated reconfiguration of a regulatory system characterized by internal balance and opposition. Collectively, these new findings position the renin-angiotensin system as a central integrative node within the LDH-associated transcriptional network of inflammatory activation, vascular control and tissue remodeling.
Single-cell and genetic evidence reveal the renin-angiotensin system dysregulation in lumbar disc herniation
To further understand the cellular and regulatory specificity of RAS in LDH, we analyzed the single-cell RNA sequencing dataset GSE251686. The analysis of single-cell level differential expression revealed that the core RAS genes (i.e., ACE, AGTR1, ACE2, AGTR2 and MAS1) were significantly dysregulated between LDH patients and controls in multiple intervertebral disc-resident and immune cell types (Figure 2A). The changes were especially prominent in nucleus pulposus cells, annulus fibrosus cells, macrophages, neutrophils and endothelial cells, indicating that RAS components are broadly involved in cellular compartments involved in structure and inflammatory cellular compartments within the herniated disc microenvironment.

Single-cell, metabolic, and genetic analyses reveal multi-level dysregulation of the renin-angiotensin system in lumbar disc herniation. (A) Volcano plot displaying differential expression of core renin-angiotensin system genes (ACE, AGTR1, ACE2, AGTR2, and MAS1) between LDH patients and controls in the single-cell RNA sequencing dataset GSE251686. (B) Metabolic pathway enrichment analysis of single-cell differentially expressed genes across major disc-resident and immune cell populations, highlighting alterations in carbohydrate and energy metabolism. (C) GSEA of single-cell differentially expressed genes showing enrichment of inflammatory, extracellular matrix, hypoxia-related, vascular, and renin-angiotensin system pathways. (D-F) SMR analysis of core renin-angiotensin system genes using three independent LDH genome-wide association study datasets (ukb-b-6798, ukb-b-18279, and ukb-b-19054). (G-I) Differential metabolite analysis associated with LDH in Mendelian randomization datasets, highlighting alterations in renin-angiotensin system-related metabolites and metabolic intermediates. (J) Colocalization analysis demonstrating shared genetic signals between LDH-associated loci and expression quantitative trait loci of core renin-angiotensin system genes. (ALD: Aldosterone).
LDH induced cellular metabolism reprogramming, as evidenced by metabolic pathway enrichment analysis of single-cell differentially expressed genes (Figure 2B). Enriched pathways were mainly related to carbohydrate and energy metabolism. These pathways included glycolysis/gluconeogenesis, TCA cycle, pentose phosphate pathway, amino sugar and nucleotide sugar metabolism, as well as butanoate and propanoate metabolism. Macrophages displayed the strongest metabolic signatures, whereas nucleus pulposus cells showed comparatively weaker enrichment signals. This indicates that inflammatory activation and tissue degeneration in LDH are accompanied by profound metabolic adaptations at the cellular level.
Analysis of gene set enrichment confirmed such findings, suggesting the simultaneous activation of inflammatory, extracellular matrix, hypoxia-related, and vascular pathways (Figure 2C). Hallmark pathways that include TNFα signaling via NF-κB, extracellular matrix-receptor interaction glycosaminoglycan, lactic acid, apoptosis, inflammatory response, HIF-1 signaling, VEGF signaling, and prominently the renin–angiotensin system were predominantly enriched in specific immune-related populations such as macrophages. In contrast, disc-resident populations like nucleus pulposus cells displayed comparatively weaker or negative enrichment in these specific stress and RAS-associated pathways. The pronounced enrichment of inflammatory, hypoxic, and RAS-related pathways in the immune compartment supports the notion that LDH is characterized by an integrated stress-response microenvironment linking immune activity, vascular regulation, and matrix remodeling.
The potential genetically supported association of RAS genes with LDH was evaluated using the SMR analysis. This was done using three independent LDH GWAS datasets, which are ukb-b-6798, ukb-b-18279, and ukb-b-19054. In these datasets, ACE, AGTR1, ACE2, AGTR2 and MAS1 gave strong SMR signals with consistent effect directions (Figure 2D–F), indicating that genetically regulated expression of these genes is associated with LDH risk. The concordance of SMR effects across multiple cohorts strengthens the evidence for a contributory role of RAS gene regulation in LDH pathogenesis.
In light of the potent metabolic signals observed at the transcriptomic level, we then moved on to examine metabolite associations in the LDH MR datasets. Differential metabolite analysis indicated that metabolites highlighting associations of LDH with the activity of the RAS, lipid metabolism and extracellular matrix turnover, including angiotensin I, angiotensin II, angiotensin-(1-7), aldosterone, arachidonic acid, glycosaminog, lycans lactic acid, total fatty acids and related intermediates (Figure 2G–I). The above findings demonstrate that LDH-associated genetic perturbations manifest not only at the gene expression level but also in systemic metabolic and vasoactive characteristics.
The co-localization analysis was ultimately performed to determine whether LDH-related GWAS signals shared the same pathogenic variants with the expression quantitative trait loci (eQTLs) of the RAS genes. Robust colocalization was observed for ACE, AGTR1, ACE2, AGTR2, and MAS1 between LDH GWAS datasets and corresponding genomic loci (Figure 2J), supporting a shared genetic basis underlying both disease susceptibility and RAS gene regulation. Collectively, these multi-layered analyses demonstrate that dysregulation of the renin-angiotensin system in LDH is evident at the single-cell, transcriptomic, metabolic, and genetic levels, positioning RAS as a central integrative axis linking inflammation, metabolism, and tissue remodeling in LDH.
Machine learning-based identification and clinical validation of core renin-angiotensin system genes in lumbar disc herniation
To evaluate the diagnostic relevance and predictive potential of the identified core RAS genes, we applied multiple machine learning algorithms to two independent transcriptomic datasets, GSE124272 and GSE150408 (Supplementary Figure 6, Figure 3). LASSO regression analysis was first performed to reduce dimensionality and identify the most informative features. In GSE124272, cross-validation identified an optimal penalty parameter that retained five genes with non-zero coefficients, with ACE, AGTR1, ACE2, AGTR2, and MAS1 consistently contributing to model performance (Figure 3A and B). In GSE150408, a similar LASSO-based feature selection process retained all five core genes under the optimal lambda value, indicating strong stability of these predictors across datasets (Figure 3C and D).

Machine learning identification and clinical validation of renin-angiotensin system-related diagnostic signatures in lumbar disc herniation. (A-D) Least absolute shrinkage and selection operator regression analyses of five core renin-angiotensin system genes (ACE, AGTR1, ACE2, AGTR2, and MAS1) in the GSE124272 and GSE150408 datasets, including cross-validation curves and coefficient profiles. (E, F) Normalized confusion matrices illustrating classification performance of machine learning models distinguishing LDH samples from healthy controls in GSE124272 (E) and GSE150408 (F). (G, H) Feature importance rankings based on mean decrease in impurity and permutation importance analyses in GSE124272 (G) and GSE150408 (H). (I, J) SHapley Additive exPlanations value plots showing the contribution of individual genes to model predictions. (K, L) Distribution of feature values in the test datasets. (M) Receiver operating characteristic curves assessing the diagnostic performance of individual core genes in GSE124272 and GSE150408. (N-S) Comparison of renin-angiotensin-aldosterone system-related clinical indicators between LDH patients and non-LDH controls in the MIMIC database, including renin, plasma renin activity, angiotensin II, angiotensin-(1-7), angiotensin II/angiotensin-(1-7) ratio, and aldosterone levels. Statistical significance is indicated as ns (not significant), *P < 0.05, **P < 0.01, and ***P < 0.001.
Model performance was evaluated using a standardized confusion matrix, with results demonstrating accurate differentiation between LDH samples and healthy controls across both datasets (Figure 3E and F). Feature importance analysis, consistent with the results of the mean decrease in impurity and permutation importance analysis, revealed that ACE and ACE2 were the most influential variables, followed by AGTR1, AGTR2, and MAS1 (Figure 3G and H). Shap value analysis further elucidated the direction and extent of each gene's contribution to model output. High expression levels of ACE and AGTR1 were associated with elevated LDH prediction scores, while counter-regulatory components such as ACE2 and MAS1 exhibited opposite or modulatory effects depending on the dataset context (Figure 3I and J). The distribution of feature values in the test set confirmed stable expression patterns of these genes across different cohorts (Figure 3K and L).
We employed receiver operating characteristic (ROC) curve analysis to evaluate the diagnostic efficacy of each core gene. In the GSE124272 dataset, the ACE gene demonstrated the highest AUC of 0.969, followed by ACE2 (AUC = 0.859), AGTR2 (AUC = 0.828), AGTR1 (AUC = 0.805), and MAS1 (AUC = 0.750) (Figure 3M). In the GSE150408 dataset, ACE again exhibited the highest diagnostic efficacy (AUC = 0.790), while the remaining genes showed moderate but stable discriminative capacity. These results indicate that RAS-related genes (particularly ACE) possess reliable diagnostic potential for LDH across different independent datasets.
To validate transcriptomic and predictive findings at the clinical level, we measured circulating biomarkers related to RAS biology in LDH patients and controls from a simulated database. Compared to non-LDH individuals, LDH patients exhibited significantly elevated levels of renin, plasma renin activity, angiotensin II, and aldosterone, along with a markedly increased angiotensin II/angiotensin-(1-7) ratio (Figure 3N–S), while angiotensin-(1-7) levels were relatively reduced. These alterations indicate a systemic shift in LDH patients toward classical ACE/Ang II axis activation and weakened ACE2/Ang-(1–7) counter-regulatory pathways. Notably, the elevated Ang II/Ang-(1–7) ratio provides a quantitative index of imbalance between degenerative and protective RAS signaling arms. Given that Ang II stimulation in nucleus pulposus cells promoted inflammatory activation, extracellular matrix degradation, glycolytic metabolic reprogramming, and apoptosis, whereas Ang-(1–7) exerted opposing protective effects, this circulating ratio may serve as a functional surrogate marker of net biological activity within the disc microenvironment.
Although the present cross-sectional analysis does not allow evaluation of disease severity stratification or longitudinal monitoring, the observed ratio elevation suggests potential applicability for future assessment of LDH progression or therapeutic response. These findings enhance the translational relevance of RAS dysregulation in LDH pathophysiology.
Imbalance of RAS develops intervertebral disc degeneration through inflammation, metabolic disorder and degradation of extracellular matrix
To simulate an Ang II–rich microenvironment arising from immune-cell and systemic RAS activation in LDH, primary nucleus pulposus cells (NPCs) were exposed to exogenous Ang II and subjected to pharmacologic modulation of the RAS pathway (Figure 4A). Stimulation with Ang II caused a significant upregulation in the expression of proinflammatory cytokines, including IL6, TNF-α and IL1β, with significant differences compared to control cells; combined treatment with losartan, an AT1 receptor antagonist, significantly attenuated these effects (Figure 4B–C). Treatment with Ang-(1-7) inhibited expression of inflammatory genes, indicating an antagonistic activity of the counter-regulatory renin-angiotensin axis. Concurrently, Ang II stimulation caused a marked disruption of extracellular matrix homeostasis, characterized by increased MMP9 expression. These effects were reversed by losartan or Ang-(1-7) treatment (Figure 4B). Besides, gene expression of enzymes HK2, PFKFB3 and LDHA involved in glycolysis was also increased by Ang II. Losartan was able to reverse this effect partially, while Ang-(1-7) downregulated the gene expression of glycolysis-related genes close to or below control levels. These data suggest Ang-(1-7) helps maintain metabolic homeostasis and has a potential anti-inflammatory protective effect (Figure 4D). The results show that Ang II-treated cells consistently produced more lactate while their intracellular ATP levels decreased, which implicated glycolytic metabolism and disturbed energy balance (Figure 4D). Similarly, findings revealed that Ang II significantly reduced the viability of NPCs and increased the proportion of apoptotic cells in a time-dependent manner, as confirmed by Annexin V/PI staining (Figure 4E–F). Moreover, the proapoptotic markers Bax and cleaved caspase-3 were upregulated, while the antiapoptotic protein Bcl-2 was downregulated (Figure 4E). AT1 receptor inhibition and Ang-(1-7) treatment improved cell viability and reduced apoptosis signaling, showing that the counter-regulatory RAS axis has protective capacity. Collectively, these findings demonstrate that Ang II–mediated RAS activation promotes degenerative changes in NPCs through inflammatory, metabolic, and apoptotic mechanisms.
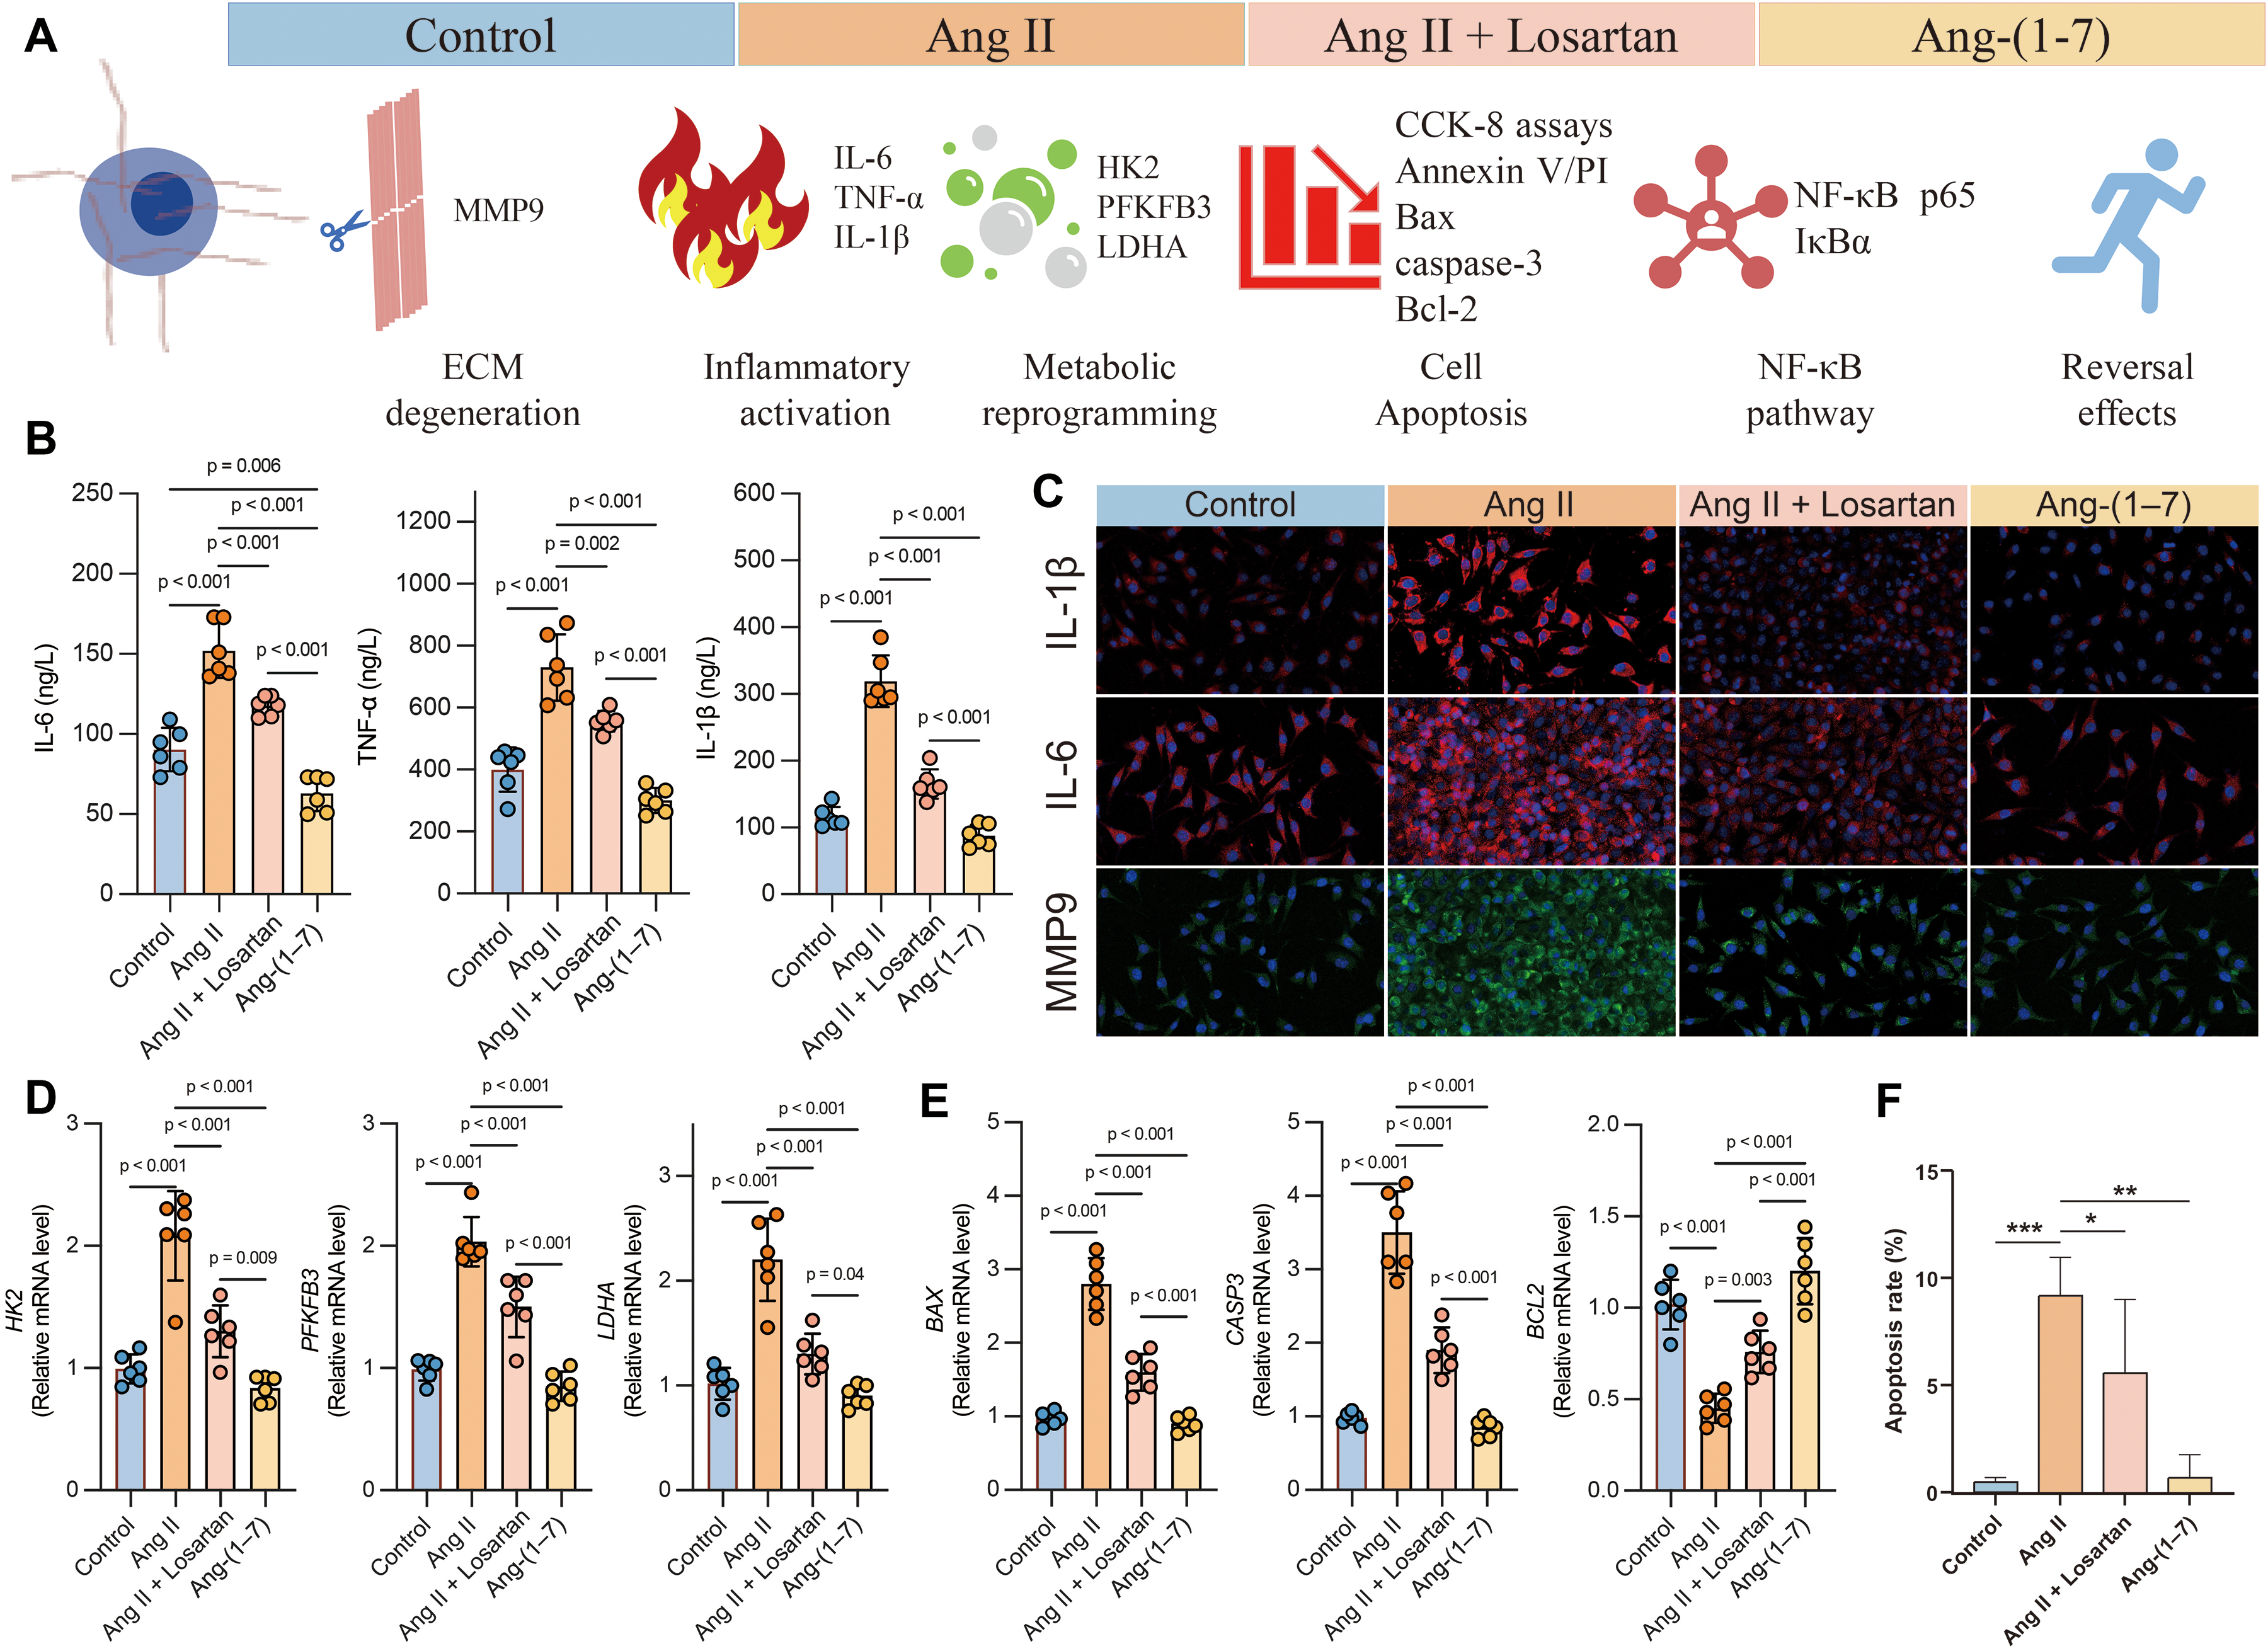
Ang II–induced inflammatory and degenerative responses in nucleus pulposus cells are alleviated by losartan or Ang-(1-7). (A) Schematic overview illustrating the experimental design and proposed mechanisms by which Ang II promotes extracellular matrix degradation, inflammatory cytokine production, glycolytic metabolic remodeling, NF-κB pathway activation, and apoptosis, while Ang II receptor blockade (losartan) or Ang-(1-7) treatment exerts protective reversal effects. (B) Quantification of pro-inflammatory cytokines (IL-6, TNF-α, and IL-1β) in nucleus pulposus cell culture supernatants measured by ELISA. (C) Representative immunofluorescence staining showing elevated IL-1β, IL-6, and MMP9 expression following Ang II exposure, attenuated by losartan or Ang-(1-7). (D) Expression of glycolysis-related metabolic genes (HK2, PFKFB3, LDHA), indicating Ang II–driven metabolic reprogramming. (E) Apoptosis-associated gene expression changes (BAX, CASP3, BCL2) assessed by RT–qPCR. (F) Flow cytometry (Annexin V/PI staining) demonstrating increased apoptotic rates in Ang II–treated nucleus pulposus cells, with significant reduction after losartan or Ang-(1-7) intervention. Nucleus pulposus cells were treated with Ang II, losartan, or angiotensin-(1–7), as indicated.
Discussion
LDH, which is a multifactorial degenerative disorder, is thought to be caused by complex events including inflammatory activation, extracellular matrix remodeling, metabolic disturbance, infiltration of immune cells, and progressive cellular injury.38,39 The investigators have made considerable advances towards characterizing these downstream pathological events, yet the upstream regulatory systems that can integrate inflammatory, metabolic, vascular, and degenerative signaling within disc microenvironment are still incompletely characterized. In the study conducted presently, we present convergent evidence by use of bulk transcriptomics, single-cell RNA sequencing, Mendelian randomization, machine learning-based prioritization, clinical biomarker profiling, and targeted functional experiments, which reveals that dysregulation of the RAS may represent a candidate integrative regulatory axis in LDH pathophysiology. In this context, recent evidence from single-cell transcriptomic studies has revealed distinct immune cell subsets that contribute to disc microenvironment remodeling, including pro-inflammatory macrophage populations that promote catabolic signaling. 14
We observed strong and reproducible alterations in gene expression programs at the transcriptomic level in two independent LDH cohorts. Analyses of differential expression repeatedly identified a coordinated increase in the inflammatory mediators, the catabolic enzymes and vasoactive regulators, together with the attenuation of homeostatic and structural maintenance pathways. 40 These transcriptomic alterations are consistent with single-cell level observations in degenerating discs, where stem cell-based therapeutic approaches have demonstrated the capacity to reverse these gene expression changes and promote tissue repair. 41 Functional enrichment further underscored the recurrent engagement of NF-κB signaling, processes of extracellular matrix turnover, and vascular regulatory processes as well as the renin-angiotensin system.42,43 Weighted gene co-expression network analysis demonstrated that these pathways are not isolated perturbations but instead form an integrated transcriptional architecture linked to LDH status. 44 Complementary single-cell RNA sequencing-guided analyses of intervertebral disc degeneration have further validated the utility of co-expression-based approaches in identifying functionally coherent gene modules associated with disc pathology. 35 The repeated identification of ACE, AGTR1, ACE2, AGTR2 and MAS1 in disease-associated modules indicates the simultaneous engagement of both canonical and counter-regulatory RAS components, suggesting a state of regulatory imbalance rather than activation. 45 Further refinement of the findings was provided by single-cell transcriptomic profiling, which revealed cell type-specific and compartment-wide RAS signaling in the intervertebral disc microenvironment. Core RAS genes were predominantly enriched in infiltrating immune populations such as macrophages, whereas disc-resident cells including nucleus pulposus cells exhibited comparatively weaker or negatively enriched stress-response signatures. 46 This compartmentalization suggests that RAS signaling in LDH operates via a paracrine-like local effect, where immune cell-driven RAS activation generates a toxic, Ang II-rich microenvironment that impacts vulnerable resident cells. This extensive cellular distribution indicates that RAS signaling in LDH is not limited to systemic hemodynamic regulation, but rather utilizes local effects to influence the intensity of inflammatory responses, vascular remodeling, and tissue degeneration. 47 Enrichment analysis of glycolytic and energy metabolism pathways at single-cell resolution revealed that inflammatory activation in LDH is closely associated with metabolic reprogramming, particularly under hypoxic and nutrient-restricted conditions, with with the most robust metabolic reprogramming occurring primarily within the immune cell compartment, while disc-resident cells struggle to maintain metabolic homeostasis under hypoxic and nutrient-restricted conditions. 48 This metabolic vulnerability of disc cells is further compounded by the observation that senescence-associated bioenergetic failure, including mitochondrial dysfunction and impaired oxidative phosphorylation, accelerates the degenerative phenotype in hypoxic disc microenvironments. 49 Genetic association analyses supported the potential pathogenic relevance of RAS dysregulation. Mendelian randomization and colocalization analyses showed that genetically regulated expression of key RAS-related genes was strongly associated with LDH susceptibility across several independent GWASs. 48 These findings make it less likely that observed transcriptomic changes are merely downstream effects of injury and instead imply that RAS signaling may contribute to disease susceptibility. It should be emphasized that SMR, heterogeneity in dependent instruments, and colocalization analyses provide statistical evidence for association under defined instrumental variable assumptions and do not constitute definitive biological causality at the tissue level. Although our in vitro functional experiments support mechanistic plausibility, in vivo validation in animal models would be required to establish direct causal relationships. The results from metabolite-based additional analysis reaffirmed a link between LDH and systemic alterations in angiotensin peptides, aldosterone action, lipid mediators and energy-related metabolites, suggesting a broader RAS-linked endocrine and metabolic disturbance (including aldosterone-related readouts). 50 Parallel metabolic disturbances have also been observed in other tissue contexts where local RAS overactivation drives inflammatory niche remodeling, supporting the interpretation that RAS-linked metabolic reprogramming is a generalizable pathological mechanism. 51
From a translational perspective, machine learning analyses show that RAS-related genes like ACE and ACE2 have high diagnostic and predictive value in independent cohorts. 52 MSC-derived exosomes exposed to inflammatory and hypoxic conditions have been shown to attenuate disc degeneration through epigenetic modulation, suggesting that machine learning-identified RAS biomarkers may also serve as indicators of therapeutic responsiveness. 53 Clinical validation in the MIMIC database supported these transcriptomic signatures, as LDH patients exhibited enhanced renin, angiotensin II, aldosterone, and increased angiotensin II to angiotensin-(1–7) ratios, along with dampening of counter-regulatory signaling. 54 Analogously, angiotensin II and AGTR1 activation have been shown to drive disease progression through JAK/STAT3 signaling in other tissue contexts, reinforcing the concept that Ang II-mediated pro-inflammatory signaling extends well beyond the cardiovascular system. 55 These clinically measurable changes indicate a systemic bias toward classical axis activation. It also suggests that RAS imbalance may be relevant for patient stratification, biomarker development and disease monitoring. Most importantly, functional experiments directly validated the multi-omics inferences for mechanistic relevance. Pharmacological stimulation of the classic ACE/angiotensin II/AT1 receptor axis in nucleus pulposus cells led to NF-κB-driven inflammatory responses and extracellular matrix degradation.56,57 These effects were accompanied by glycolytic metabolic reprogramming, reduced intracellular energy availability, and increased apoptotic susceptibility. Inhibition of the AT1 receptor with losartan and activation of the beneficial ACE2/angiotensin-(1–7)/MAS1 pathway partially corrected these pathological changes. 58 This receptor-dependent modulation provides causal support for the concept that the balance between opposing RAS arms is a key determinant of disc cell homeostasis and degenerative progression.32,59 Our data are consistent with the proposition that dysregulation of the renin-angiotensin system functions as an upstream regulatory hub that orchestrates inflammatory activation, metabolic disturbance, matrix remodeling, and cell fate determination to drive LDH initiation and progression. In this regard, RAS signaling in intervertebral discs should not be interpreted as an endocrine pathway, but rather a locally acting, tissue-specific system within the disc microenvironment. 60 There is new evidence emerging that supports the view that RAS activity is critically important in degenerative and inflammatory diseases outside cardiovascular disease. 61
Beyond its diagnostic implication, the Ang II/Ang-(1-7) ratio may conceptually represent a dynamic equilibrium index of RAS signaling tone. Unlike absolute peptide levels, the ratio captures the relative dominance of pro-degenerative versus counter-regulatory signaling arms, which aligns closely with our mechanistic observations in nucleus pulposus cells. Ang II enhanced inflammatory cytokine production, extracellular matrix catabolism, metabolic reprogramming, and apoptotic susceptibility, whereas Ang-(1-7) mitigated these pathological changes. Therefore, an elevated Ang II/Ang-(1-7) ratio may reflect a systemic bias toward degenerative signaling, potentially paralleling local disc microenvironment imbalance. This concept is supported by evidence that the ACE2-mediated protective axis attenuates tissue injury through modulation of anti-inflammatory cascades and antifibrotic pathways across diverse organ systems. 62 From a pharmacological perspective, the AGTR1 polymorphism has also been associated with variable susceptibility to RAS-mediated tissue injury, suggesting that genetic background may influence the magnitude of local RAS imbalance and hence the severity of disc degeneration. 63
Although direct correlation with radiographic grading, pain scores, or functional disability was beyond the scope of the present study, future investigations integrating imaging severity scales and longitudinal follow-up may clarify whether this ratio could serve as a biomarker for disease staging, risk stratification, or treatment monitoring. Our transcriptomic analysis showed a significant dysregulation of gene expression in LDH samples, with coordinated changes in inflammatory pathways, extracellular matrix remodeling, and vascular regulation. This analysis was validated through various methods, including single-cell RNA sequencing and Mendelian randomization, which provided additional confidence in the robustness of our findings. We acknowledge that future studies should include formal sensitivity analyses to assess the effect of batch effects, platform variations, and covariates such as age, gender, and BMI on the results. Additionally, while CIBERSORT is a valuable tool for analyzing immune infiltration, we emphasize that it is sensitive to the tissue context, and in this study, it was applied to intervertebral disc tissue samples rather than peripheral blood. Importantly, recent single-cell RNA sequencing (scRNA-seq) studies of degenerating intervertebral discs have revealed the heterogeneous cellular composition of disc tissue and identified emerging molecular pathways that drive cell type–specific degenerative phenotypes, thereby providing independent support for our transcriptomic observations. 64
Although our study integrates multiple independent datasets and complementary experimental approaches, the observational nature of the transcriptomic and clinical data limits our ability to establish definitive temporal or causal relationships. 65 To address this limitation, we further incorporated Mendelian randomization together with colocalization analysis, an increasingly recognized strategy for strengthening causal inference from observational genomic data. 66 Performed under simplified conditions, in vitro experiments may not accurately mimic the biomechanical loading, immune complexity, and chronic inflammatory milieu of the in vivo disc environment. Future studies using longitudinal cohorts and animal models with specific modulations of RAS components will be needed to elucidate the spatio-temporal role of RAS signaling in the initiation and progression of LDH. In summary, this study demonstrates that the RAS system represents a central regulatory axis in LDH and that its imbalance contributes to inflammation, metabolic disturbances, extracellular matrix degeneration, and disc cell injury. Our findings offer a new perspective on LDH pathogenesis and suggest that suppressing the classical ACE/Ang II/AT1 axis and enhancing the protective ACE2/Ang-(1-7)/MAS1 axis may form the basis of new therapeutic strategies, combining systems-level multi-omics analyses with mechanistic validation.
Conclusion
This study identifies dysregulation of the renin-angiotensin system as a candidate upstream regulatory mechanism underlying LDH. By integrating bulk and single-cell transcriptomics, genetic causal inference, machine learning-based prioritization, clinical biomarker validation, and mechanistic experiments, we demonstrate that the imbalance between the classical ACE/Ang II/AT1 axis and coordinate the processes of inflammatory activation, metabolic reprogramming, extracellular matrix degradation, and intervertebral disc cell injury in the intervertebral disc microenvironment. Importantly, the elevated Ang II/Ang-(1-7) ratio observed in LDH patients may provide a clinically accessible index reflecting the balance between classical and counter-regulatory RAS signaling arms. While further validation in severity-stratified and longitudinal cohorts is warranted, this ratio may hold promise as a candidate biomarker for disease monitoring and therapeutic response evaluation. In summary, our study provides an integrative framework for understanding the pathogenesis of LDH, highlighting the potential direction of future interventions through modulating RAS components (including inhibition of the pathological angiotensin II signaling pathway and enhancement of protective angiotensin-converting enzyme 2/angiotensin-(1-7) activity).
Supplemental Material
sj-docx-1-jra-10.1177_14703203261440460 - Supplemental material for Integrated multi-omics and functional analyses identify the renin-angiotensin system dysregulation as a central driver of lumbar disc herniation
Supplemental material, sj-docx-1-jra-10.1177_14703203261440460 for Integrated multi-omics and functional analyses identify the renin-angiotensin system dysregulation as a central driver of lumbar disc herniation by Haojun Shi, Litao Shao, Jiale Ma, Peigang Fang, Linsun Lin, Qiangqing Wang, Liang Shi and Min Chen in Journal of the Renin-Angiotensin-Aldosterone System
Footnotes
Ethical approval
This study utilized clinical data from the publicly available MIMIC-IV database, which was collected in compliance with ethical standards. The use of the MIMIC-IV database was approved by the Institutional Review Board (IRB) at the institution. For the animal experiments, all procedures involving mice were performed in accordance with institutional guidelines and approved by the Institutional Animal Care and Use Committee (IACUC).
Consent
All authors have given their consent for the publication of this manuscript.
Author contributions
Haojun Shi: Writing-original draft, Methodology, Investigation, Formal analysis, Data curation.
Litao Shao: Writing-Methodology, Investigation, Formal analysis.
Jiale Ma: Software, Data curation.
Peigang Fang: Methodology, Investigation.
Linsun Lin: Methodology, Project administration.
Qiangqing Wang: Methodology, Project administration.
Min Chen (corresponding author): Writing-review & editing, Project administration, Funding acquisition, Conceptualization.
Liang Shi (corresponding author): Writing-review & editing, Writing – original draft, Visualization, Validation, Supervision, Resources, Project administration, Methodology, Funding acquisition, Conceptualization.
Funding
The authors disclosed receipt of the following financial support for the research, authorship, and/or publication of this article: This work was supported by the University Youth Innovation Team of Shandong Province, Medicine and Health Science and Technology Project of Shandong Province, Science and Technology Development Fund, Macau SAR, (grant number 2023KJ176, 202404070291, No.0018/2024/RIA1, No.0114/2022/A).
Declaration of conflicting interests
The authors declared no potential conflicts of interest with respect to the research, authorship, and/or publication of this article.
Data availability statement
The data are available from the corresponding author on reasonable request.
Supplemental material
Supplemental material for this article is available online.
References
Supplementary Material
Please find the following supplemental material available below.
For Open Access articles published under a Creative Commons License, all supplemental material carries the same license as the article it is associated with.
For non-Open Access articles published, all supplemental material carries a non-exclusive license, and permission requests for re-use of supplemental material or any part of supplemental material shall be sent directly to the copyright owner as specified in the copyright notice associated with the article.