
Abstract
This exploratory study examined 16 participants’ reasons for relating representations when reading online information that presented weather forecasts comprising a variety of representations. They were told to advise a friend, who was planning to paint the exterior of his house, based on the online information. The participants’ multimodal reading was tracked with a SMI RED (50 Hz) eye-tracker, and their reasons for relating representations were investigated through a retrospective think-aloud protocol cued by the recording of the individual’s reading behaviour and a stand-alone interview. In line with expected behaviour, results suggest that decision-making processes influenced the construction of reading paths. More interestingly, results showed that the participants’ reasons for making transitions between representations were to control and compare information. The discussion focuses on this study’s unique contribution in terms of new conjectures for future research.
Introduction
Multimodal information composed of multiple representations is the dominant form of communication in our society (Baldry and Thibault, 2010; Holsanova, 2012). Thus, multimodal reading is increasingly important to master, for people to critically examine information in newspapers and on the internet. Studies of readers’ integration of representations can provide a foundation for designing multimodal information (Baldry and Thibault, 2010). Previous studies of information graphics indicate that the spatial organization of the information influences readers’ meaning-making processes (Holsanova et al., 2009). Thus, this type of study is important for improving the readability of multimodal information and in a wider sense to make it easier for people to comprehend the information and participate in the society.
Traditionally, reading research has focused on the processing of words and sentences in verbal texts (Hyönä, 2010), whereas a multimodal view of reading has been embraced in social semiotics (Kress et al., 2001). Earlier studies of multimodal reading focused on successful reading and the times when it works (Cromley et al., 2010; Hyönä, 2010; Liversedge and Findlay, 2000; Mason et al., 2013). However, there are few empirical studies of the ways authentic multimodal information is read, that is, the meaning-making process itself (Holsanova et al., 2009). Also, reception studies, focusing on readers’ reasons for selecting information are rare and more research is needed (Holsanova, 2012).
To make meaning in multimodal texts, readers need to interpret and integrate information from several representations (Solheim and Uppstad, 2011). Typically, there are few cues to guide the reader to make connections between representations in the multimodal text, and this lack of explicit connections may hamper the integration of information (Holsanova et al., 2009). Online weather reports are typically complex multimodal reading material in this sense. As scientific texts, they are used extensively and are important in people’s everyday decision-making (Mylne, 2002). All of the world’s top five weather sites, including www.Yr.no, are dominated by a variety of graphical representations, such as tables, symbols, maps and diagrams, rendering online weather reports an interesting and well-suited case for the exploration of multimodal reading (as of 15 February 2016, based on daily visitors and page views; Alexa, 2016).
This study was designed to explore the use of multimodal weather forecasts presented in the Yr website (http://www.Yr.no) and, more specifically, the reasons for relating representations when reading the text. The study attempts to arrive at new conjectures about digital multimodal reading by exploring the reasons given for the paths taken through the multimodal information.
Background
Reading multimodal information
When making meaning of a text, the reader identifies elements and constructs a re-presentation of them. This is what Lemke (2005) characterizes as the presentational function. Central to this function is that the creation of these re-presentations involves interpretation, which depends on the person, task and situation, in addition to historical and cultural conventions (De Vries et al., 2009; Kress and Van Leeuwen, 2006). Building on Halliday’s (1978) systemic functional linguistic, Lemke (2005) argues that readers structure all meaning-making of multimodal information around three generalized semiotic processes or functions: presentational, orientational and organizational. When filling the orientational function, the reader identifies who the sender is and assesses the information regarding relevance and reliability (Knain, 2015; Lemke, 2005). Thus, meaning is made through use in the social life of a particular community and differs among societies (Jewitt, 2008; Kress and Van Leeuwen, 2006), and more than one relevant interpretation is possible.
When making meaning of a text, the reader also creates an organized structure of the verbal and visual elements into regions and a whole (organizational function) (Lemke, 2005). Understanding a representational system involves knowing how to process the information in the representation and different representations require different processes (De Vries et al., 2009). For example, finding the maximum temperature in a temperature/time graph requires a process different from that of finding the maximum temperature in a table. In the absence of context or knowledge of the representational system, it can be impossible to make meaning due to the (spatial, temporal, material or cultural) distance between the producer and the user of the system.
Similar to other interactive multimodal texts, online weather reports are not primarily linear but are relatively open in their organization and not meant to be read according to a unique implied sequence. The process of reading multimodal information generates certain expected and other unexpected reading paths (Baldry and Thibault, 2010). Rather than following a linear sequence, the reader may jump to various elements. Readers use these elements and the relationships between them to make meaning in a specific context, that is, meanings are developed along the reading path.
Multiple representations can provide both benefits and challenges for the meaning-making process (De Vries et al., 2009). A representation is never the ‘whole object’ (Kress and Van Leeuwen, 2006) because all representations are partial and focus on certain aspects and contribute to the construction of meaning in various ways (Jewitt, 2008). Together, because they have different affordances (i.e. different potential and limitations to express, represent, or communicate meaning), words and graphics can represent more aspects of a phenomenon than they can alone. For example, using words, a forecast can report local rain showers without being more specific about their distribution. A map, however, must show the spatial distribution of the showers. Thus, when a reader integrates representations, this can have a synergistic effect by forming a complex whole that cannot be reduced to its separate parts (Baldry and Thibault, 2010; Unsworth and Cléirigh, 2014). By establishing correlations across various representations, readers may develop a deeper understanding of the underlying structure of the domain being represented (Ainsworth, 1999; De Vries et al., 2009). For example, by reading temperature numbers in a table and the word ‘warmer’ or ‘colder’ in a verbal text forecast, the reader can identify a pattern in which a certain increase or decrease in temperature (a numerical value) is connected to the use of a certain word and thus develop a deeper understanding of the structure. Several representations can also be integrated to complement each other and/or to clear up misunderstanding in constraining interpretation, either by using a familiar representation to support the interpretations of a less familiar one or by exploiting the inherent properties of one to constrain the interpretation of another (Ainsworth, 1999; De Vries et al., 2009). The integration of information is the greatest challenge associated with the use of multiple representations (Ainsworth, 2006).
Integration of information and eye-tracking
Eye-tracking is commonly used in reading studies (Solheim and Uppstad, 2011) and can be used to identify reading paths and integration of information (Holsanova et al., 2009; Liversedge and Findlay, 2000). In their study of 59 high-school students reading a science text containing one illustration, Mason et al. (2013) found that better learning performance was positively correlated with the number of transitions between the verbal text and the illustration. These transitions are assumed to indicate the reader’s attempts to integrate information (Mason et al., 2013). Solheim and Uppstad (2011) defined more than one fixation on the representations both before and after the saccade (rapid eye movements between fixations) as an integrative saccade. Integrative saccades are used as an indicator of attempts, not necessarily successful, to integrate information from representations (Schwonke et al., 2009). According to Holmqvist et al. (2011) there is no consensus that more integrative saccades indicate better integration of the information across representations. On the one hand, it is speculated that a high number of transitions might be related to difficulties in processing information (Hannus and Hyönä, 1999) On the other hand, according to Solheim and Uppstad (2011), a lack of integrative saccades is assumed to indicate that representations are read separately. The two assumptions are not mutually exclusive, in some situations a high number of transitions might be due to the readers’ difficulties in processing information, in other situations it might be indicative of the readers’ successful integration of information.
The Present Study
In the present study, eye-tracking methodology was used to capture the process of multimodal reading and to provide a recording of this process to elicit the participants’ retrospective think-aloud. The interviews were conducted to further investigate the reasons for relating representations. The participants’ process of meaning-making of the Yr website was focused by studying their actual reading paths (eye-tracking) and their reported reasons (think-aloud and interview) for the transitions between representations in order to fulfill the reading task. The study attempts to arrive at new conjectures about digital multimodal reading through the exploration of two research questions:
RQ1: What reasons are given for constructing reading paths?
RQ2: What reasons are given for making a transition from one to another representation?
The eye-movement data, showing aspects of behaviour that are not otherwise easily accessible for reflection, here take the advantage of being combined with verbal data (from retrospective think-aloud and interview). As an example, reports on cognitive activity from the verbal data were used to judge whether a long dwell time (eye-tracking) was caused by high informational value for the participant or by difficulty in reading the information. Holsanova et al. (2009) emphasized the need to include these qualitative aspects when analysing transitions because various cognitive processes lead to transitions from one to another representation. The rich descriptions acquired through the qualitative methods in this study provide an insight into the way the information on the Yr website was read.
Methods
The study design of this qualitative and exploratory study consisted of three primary steps: (1) the participants’ eye-movements were recorded as they were performing a task; (2) the participants were asked to think aloud when looking at a replay of their eye movements; and (3) semi-structured interviews were conducted to further investigate the reasons for relating representations in a digital multimodal text.
Eye-tracking
According to the eye–mind assumption, the information currently being viewed is what is being processed because the direction of gaze is closely related to the focus of attention (Just and Carpenter, 1980; Schwonke et al., 2009; Solheim and Uppstad, 2011). Long dwell times (the time spent viewing an area) indicate an interest in the information or a high informational value (Holmqvist et al., 2011). However, it can also indicate difficulties in processing the information (Holmqvist et al., 2011; Stieff et al., 2011). Scan paths recorded with eye-tracking equipment show the traces of eye movements (position and time) and determine the sequence in which information is read (the reading path; Holsanova et al., 2009). Automatic reading detectors based on the concept of scan paths are often used to identify reading in eye-tracking studies (Holmqvist et al., 2011). For example, reading is assumed to be present if at least three fixations (maintaining the visual gaze on a single location) satisfy the detection conditions (e.g. horizontal in direction; Holmqvist et al., 2011). However, these methods are primarily designed to identify reading from skimming. In this study, the focus was on multimodal reading, that is reading information that consists of several different representations. It is likely that these partly graphical representations are read differently from a purely verbal text.
In this study, SensoMotoric Instruments’ (SMI) 50-Hz remote system (RED) was used to track eye movements. This equipment recorded the positions, including the duration and sequence, where the participants looked when reading from a computer screen. The eye-tracking equipment consisted of two cameras behind a thin, black panel below the computer screen tracking the eye movements of the participants. For the participants, the experimental setting was similar to reading from a regular computer screen. The primary difference was that the participants were restricted to only small body-movements during the experiment.
Think-aloud
It is possible to move the eye in a reading-like pattern even if the mind is busy with something else (Holmqvist et al., 2011). Thus, eye-tracking data alone do not provide sufficient information regarding the cognitive processes (meaning and thoughts) that underlie eye movements (Schwonke et al., 2009). For that purpose, verbal data (think-aloud, interviews) are needed (Holsanova, 2012; Hyönä, 2010). Think-aloud data included the participants’ spontaneously expressed thoughts. These data have been shown to provide useful information regarding cognition and can clarify and complement eye-tracking data (Schwonke et al., 2009). The participants were asked to think aloud immediately afterwards, retrospectively, when viewing a replay of their eye movements, in order to minimize the loss of detail in their memories (Holmqvist et al., 2011). Also, the use of a retrospective think-aloud after fulfilling the reading task reduced the risk of altering the reading process compared to the use of think-alouds during the task. The verbalizations were recorded by using the BeGaze software from SMI.
Interviews
In the present study, interviews were used to further investigate the relating of representations when reading digital multimodal science information. While the task was performed, the interviewer (the first author) could follow the eye movements on a separate screen. In addition to an interview guide that was prepared in advance, these observations provided a basis for the qualitative semi-structured interviews that immediately followed the completed task and the think-aloud verbalization. The interviews focused on the participants’ thoughts about reading paths and their reasons for their use and integration of information. For example, the participants were asked why they read both symbols and numbers or why they first read a table and then a verbal text.
Participants
The sample consisted of 16 participants (6 female), all students in upper secondary school in Norway (all participants in the study are anonymized). These participants were similar in terms of their age (from 17 to 19 years with a mean age of 17 years and 6 months), educational background and residential neighbourhood. All participants studied science as an elective and also had been taught some meteorology one half to a year earlier. Thus, they were expected to be familiar, to a certain extent, with weather forecasts (including Yr.no) and with various representations thereof, such as tables, diagrams and maps.
A pilot study at the same school was performed to adjust the eye-tracking equipment and to refine the study design and interview guide.
Task and reading material
All the participants were given the same task:
A close friend of yours is about to paint a house in Bergen (Norway). He does not have access to a weather forecast, and he phones you for help. Would you advise him to paint the house tomorrow between 9 and 12 am or at the same time a week from tomorrow? Try to use approximately as much time as you would at home.
A half-open task such as this could encourage the use of much information and simultaneously allow the participants to make rapid decisions based on little information. To perform the task, the participants were provided with two online sources of information. One source was a website (http://www.ifi.no/sjekk-varmeldingen-for-du-maler) that gave information regarding weather and outdoor house painting via verbal text and was meant as an aid for participants who were not familiar with outdoor painting. Another source was the Yr website (http://www.Yr.no), which presents weather forecasts primarily in the form of graphical representations and was the primary source of information used in the study. The task was designed to be authentic in that weather forecasts are typically consulted when deciding to undertake an activity, thus increasing the ecological validity of the study (Hannus and Hyönä, 1999).
Procedures
At first, all the participants were given information, instructions and an occasion to practise thinking aloud. Afterwards, the eye-tracking equipment was calibrated for each participant until each gaze position could be validated with a deviation of less than 0.5 degrees.
Then the task started, and the participants’ eye movements were recorded. There was no time limit. The participants spent from 29 seconds to 3 minutes and 49 seconds studying the Yr website, with a median time of 48 seconds, while performing the task. After the eye tracking was finished, a playback of the eye-tracking data (gaze replay) was shown to the participants. Simultaneously, the participants expressed their thoughts regarding what they viewed, considered, did and felt (retrospective think-aloud). If the participant stopped talking for a few seconds, he or she was reminded to think aloud, as recommended by Holmqvist et al. (2011). Finally, a semi-structured interview was conducted.
Because the data were collected over a period of nine days in an authentic task setting, the forecasts changed from day to day. As a consequence, the participants solved the task based on the actual forecasts. This increased the ecological validity of the study as the different forecasts elicited different self-paced trial durations and reading paths.
All of the think-alouds and interviews were conducted and transcribed (verbatim) by the first author. The Atlas software program (atlas.ti) was used for the analysis of the verbal data. When analysing the eye-tracking data, the BeGaze software from SMI was used.
Data analysis
The present study explores the reasons for relating representations when reading digital multimodal science information by examining why different representations in a weather report are read and integrated. The term ‘representation’ is used in this study as a collective term for tables, diagrams, maps, verbal text, symbols and numbers that represent weather phenomena. To understand readers’ meaning-making through representations, Tang et al. (2014) suggest considering and integrating two analytic levels: a large-grained (whole representations) one and a fine-grained one (modes/elements within a representation). For the large-grained analysis, the interface of the primary source (Yr.no) was divided into areas of interest (AOIs). The AOIs were, for instance, menus and headings in addition to whole representations such as tables or diagrams representing several weather phenomena (see Figure 1). For the fine-grained analysis, the AOIs were examined in more detail with respect to, for example, symbols and numbers used to represent specific weather phenomena (precipitation, clouds, wind and temperature; see examples in Figure 2).
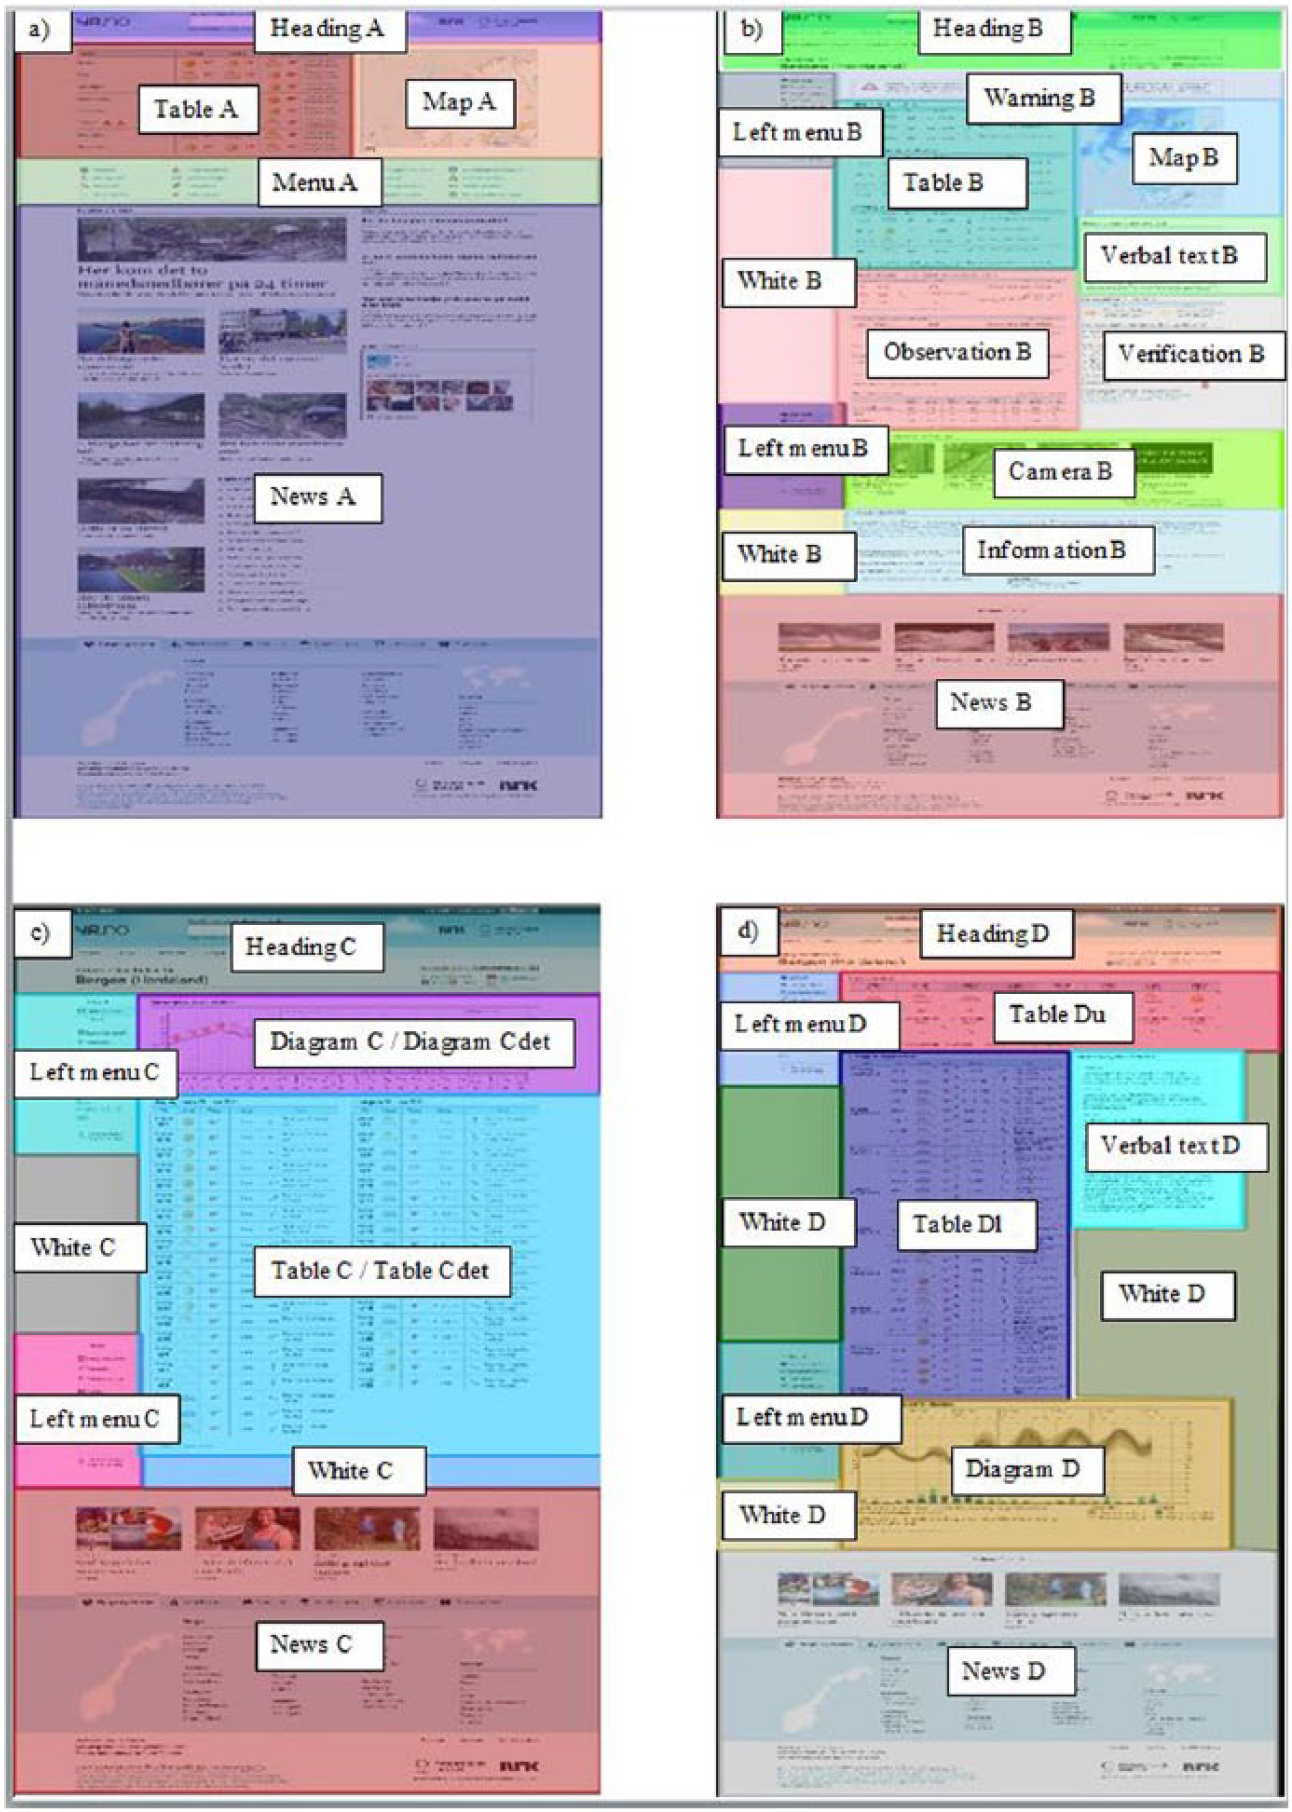
The Yr site divided in AOIs: (a) home page, (b) overview page, (c) hour-by-hour page (including a detailed hour-by-hour table and diagram), and (d) long-term forecast page. Please visit www.Yr.no (English-language version is available) to view the information on the website in detail.
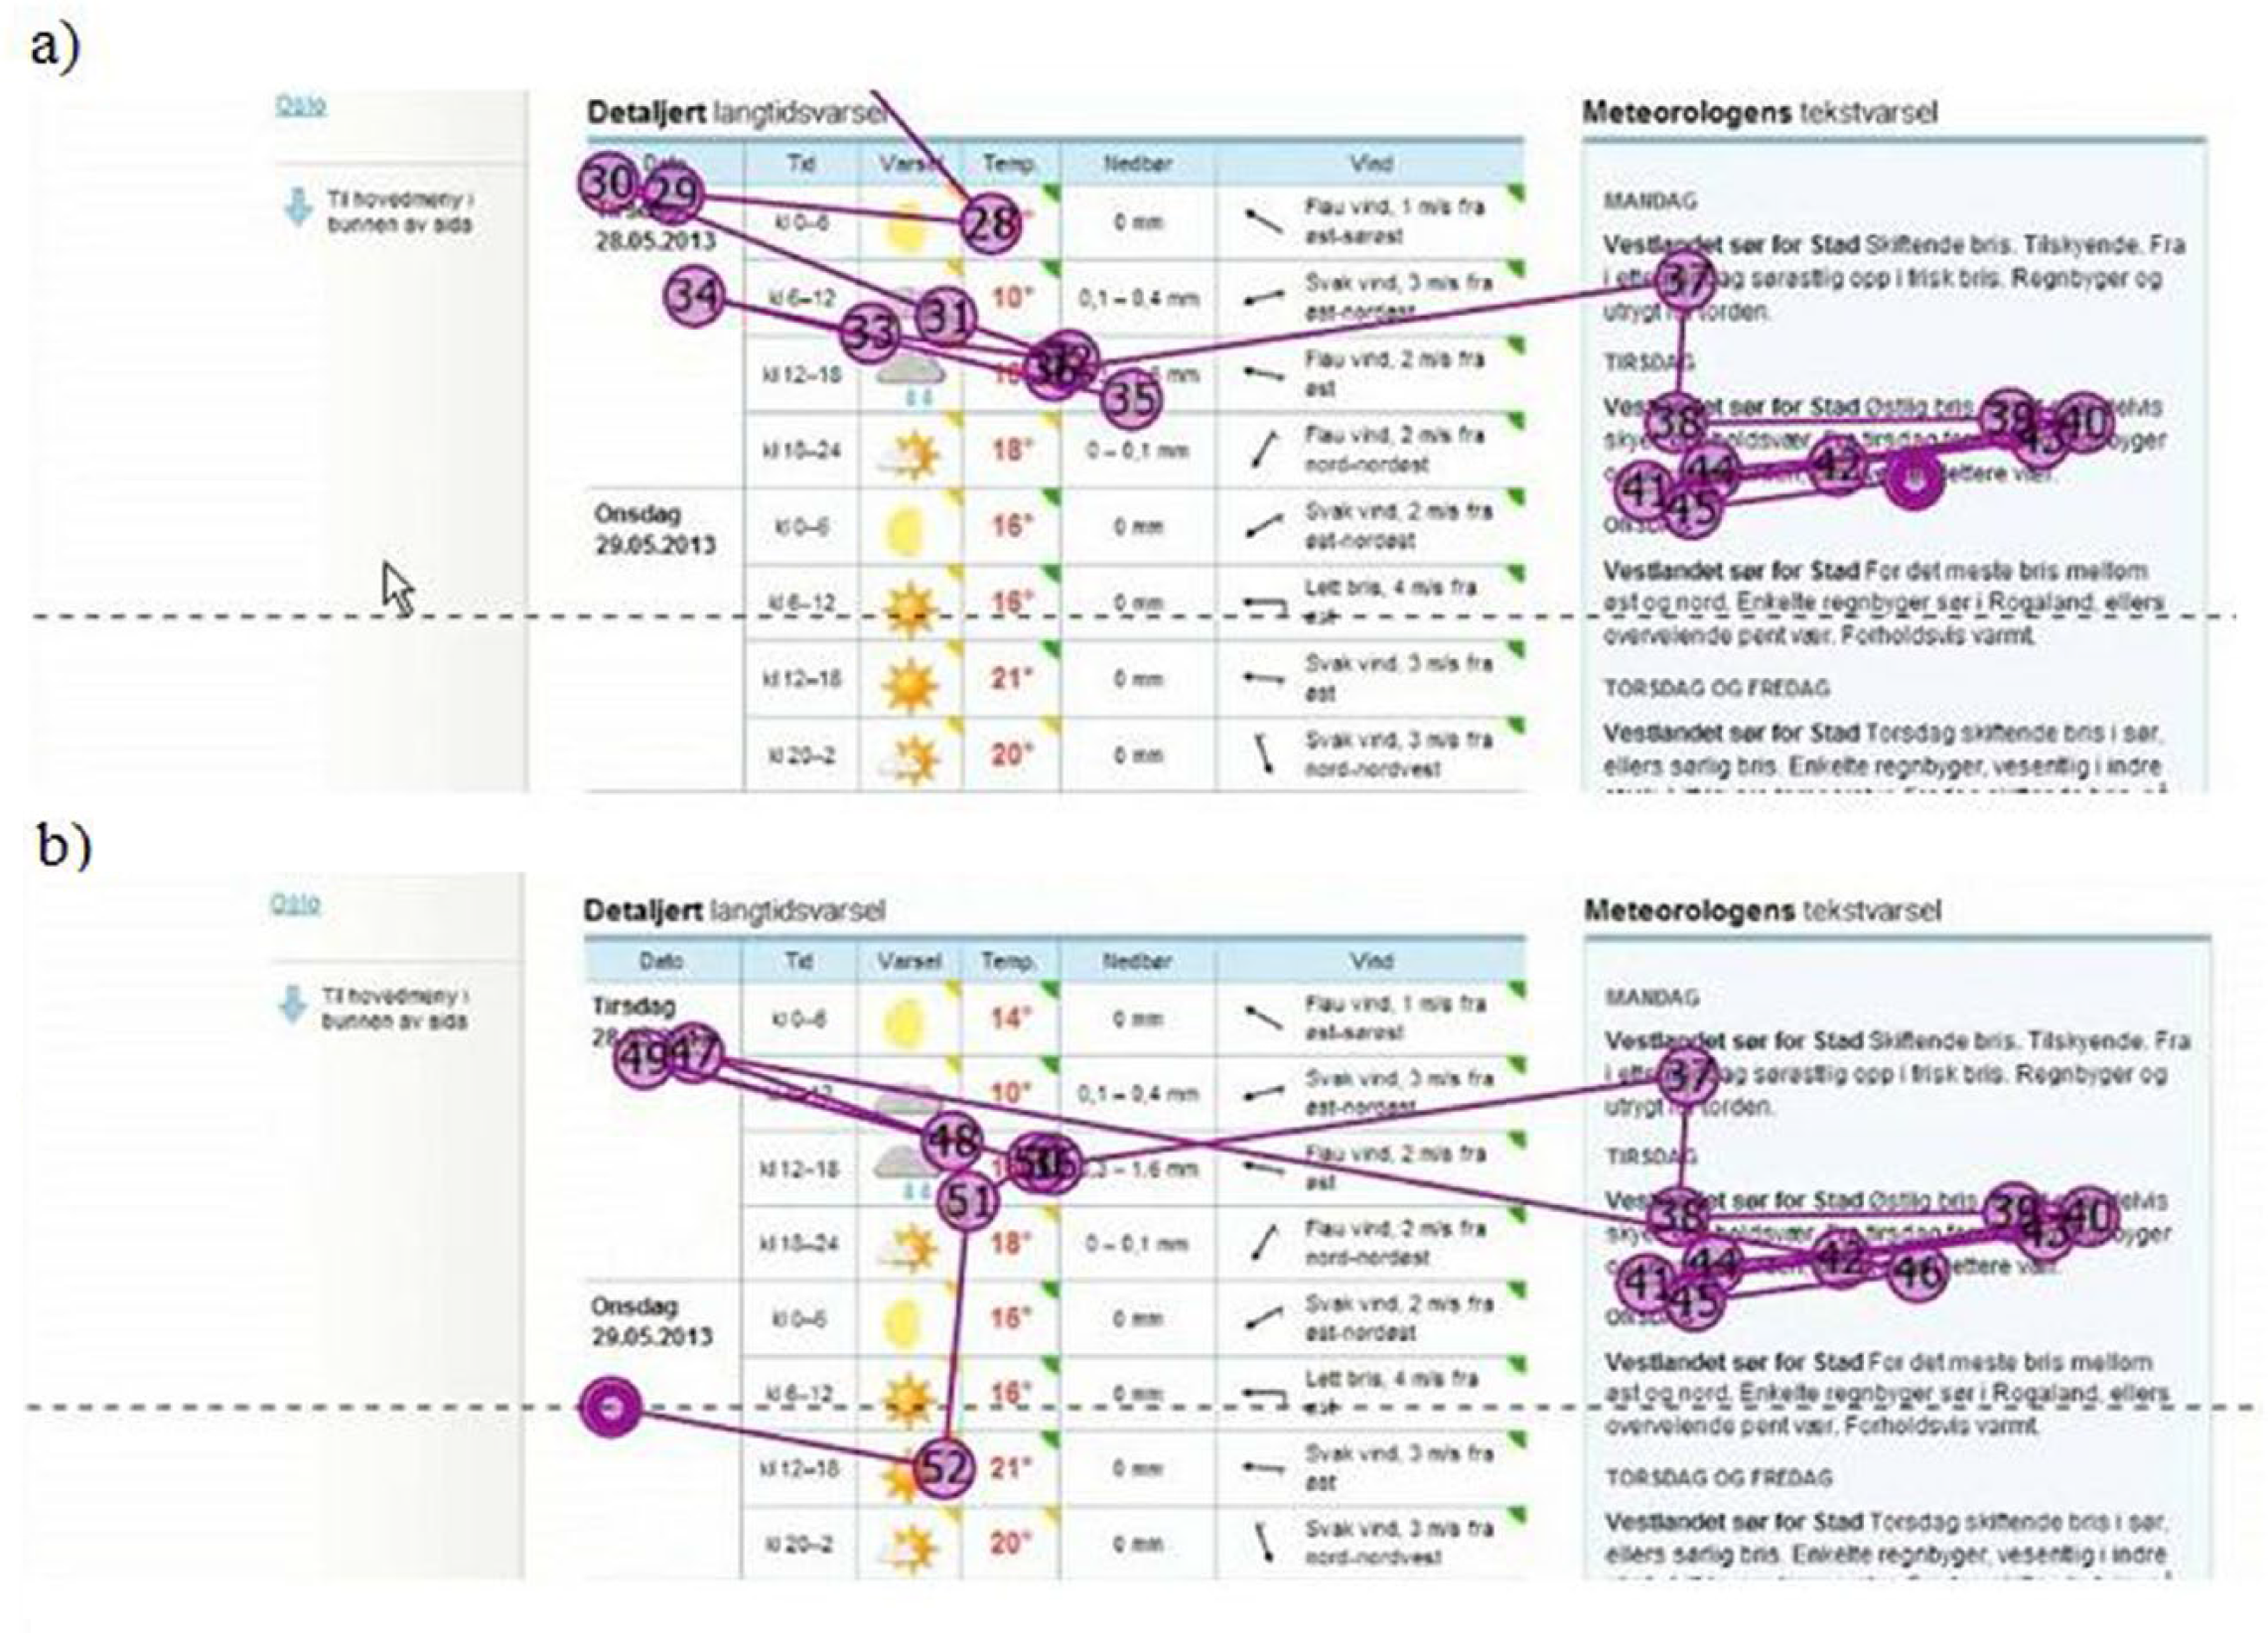
Examples of transitions evident in the eye-tracking data from Johan (all participants are anonymized). The upper part (a) shows the transition from table Dl to verbal text D (the first part of a two-way transition), and the lower part (b) shows the immediate transition from verbal text D back to table Dl (the second part of a two-way transition). The symbols and numbers representing precipitation, clouds, wind and temperature are also shown.
The analysis proceeded through three primary steps.
First, the verbal data transcripts were coded. All utterances concerned with the searching, navigating and reading of the website (at both the large- and fine-grained level) were marked with a code name that described the content of the utterance, e.g. ‘reading the table’. Thereafter, all utterances concerned with reasons for reading were inductively given the code name reason read and the name of the representation and the participant’s expressed reason for reading it.
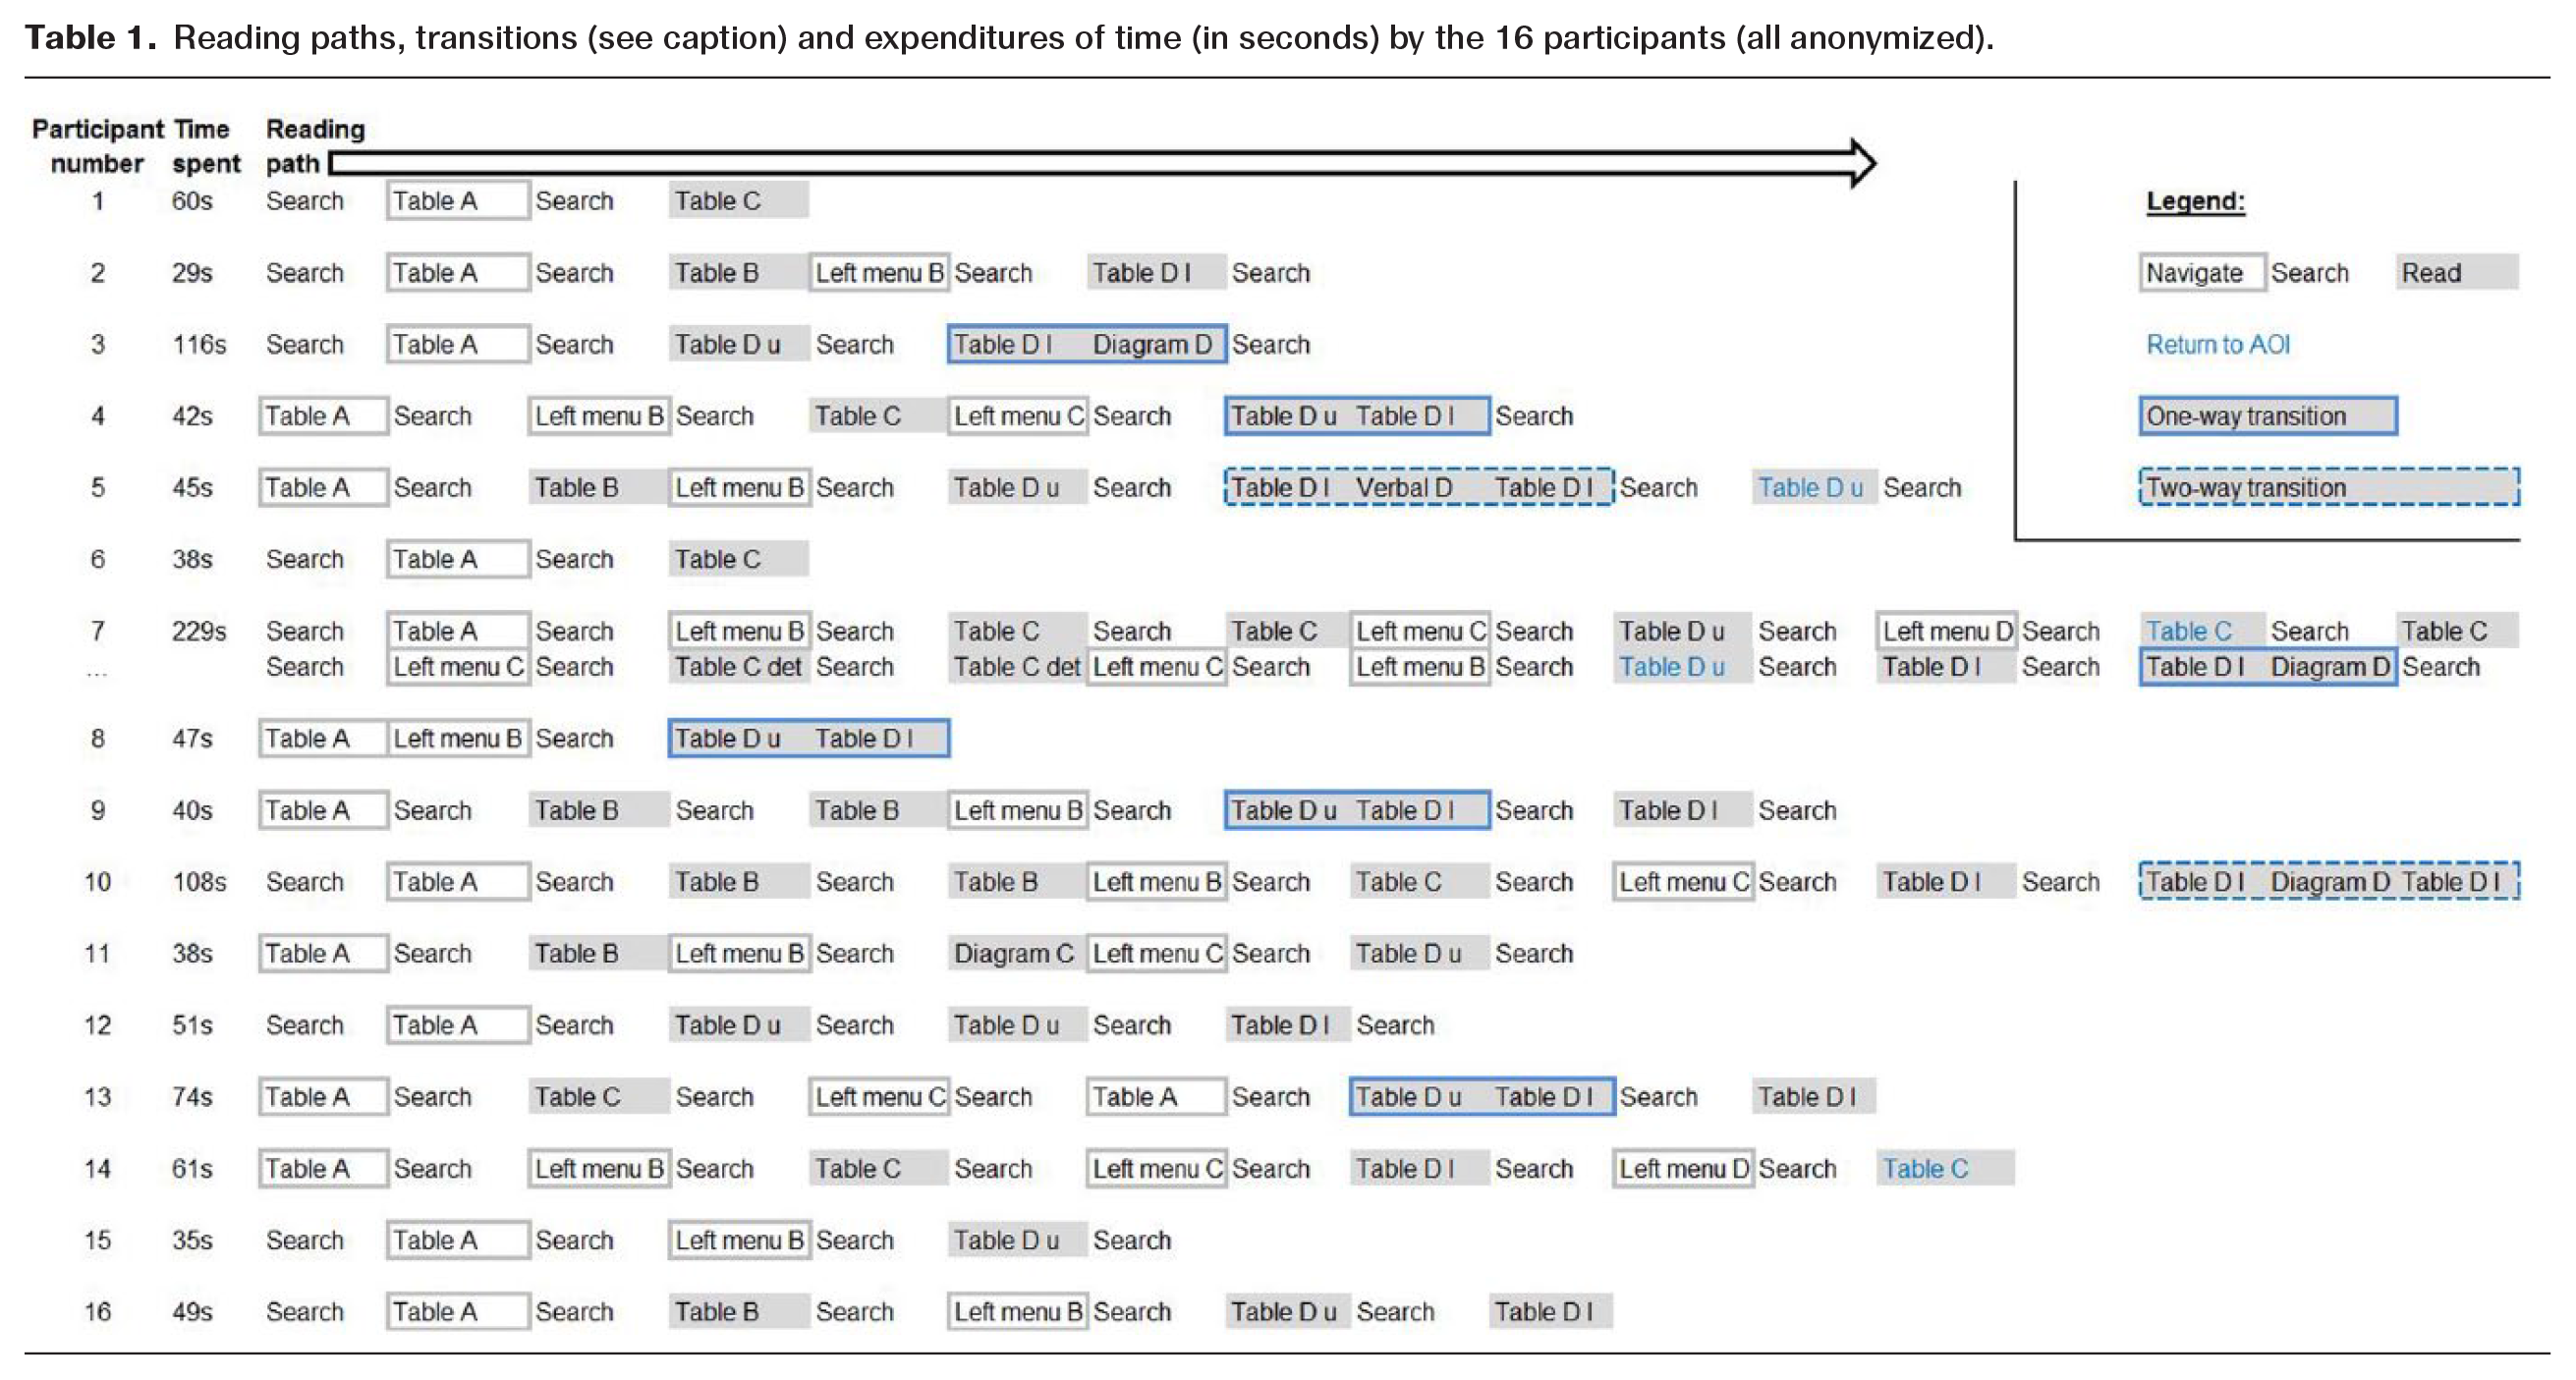
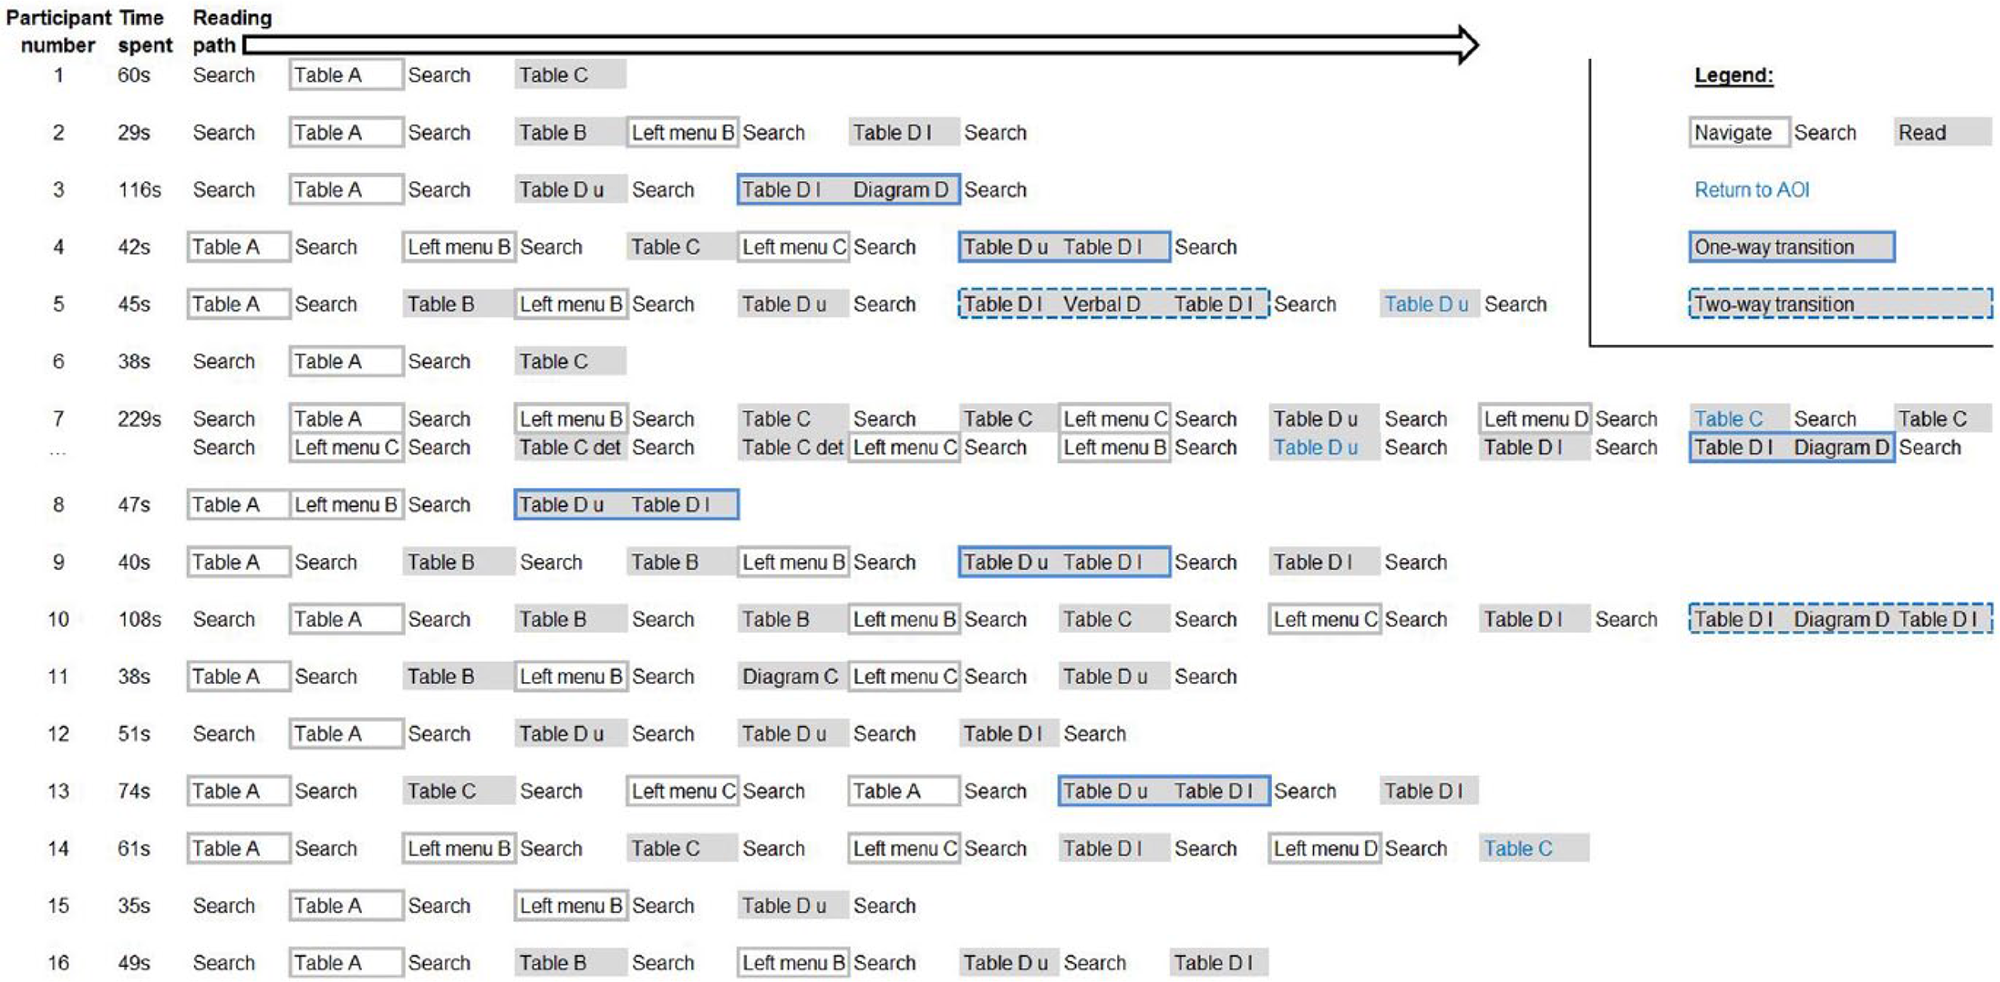
Second, based on the scan paths, the large-grained AOIs (including the sequence and number of fixations) were listed. These lists, together with the previous analysis of the verbal data, formed the basis for identifying the reading paths (Table 1). Registrations of mouse clicks were used to identify which AOIs the participants used for navigation from one page to another. To identify multimodal reading, a reading detector similar to the one described in Holmqvist et al. (2011) was initially applied. However, compared to the verbal data, using three fixations in each AOI to identify reading caused an inconvenient mapping to the verbal data and the identification of reading paths. Therefore, new operationalizations of multimodal reading were explored to better suit the highly multimodal text in this study. It was not possible to set a number of fixations that included all of the AOIs the participants said they read and simultaneously excluded all the AOIs that were not read. The data of eight participants were used to identify the best fit of number of fixations in an AOI to the verbal data and seven was found to be the number that yielded the best correspondence. This threshold was in turn applied to the dataset as a whole. Additional, all other viewed AOIs not identified as reading or navigation were regarded as searching.
Reading paths, transitions (see caption) and expenditures of time (in seconds) by the 16 participants (all anonymized).
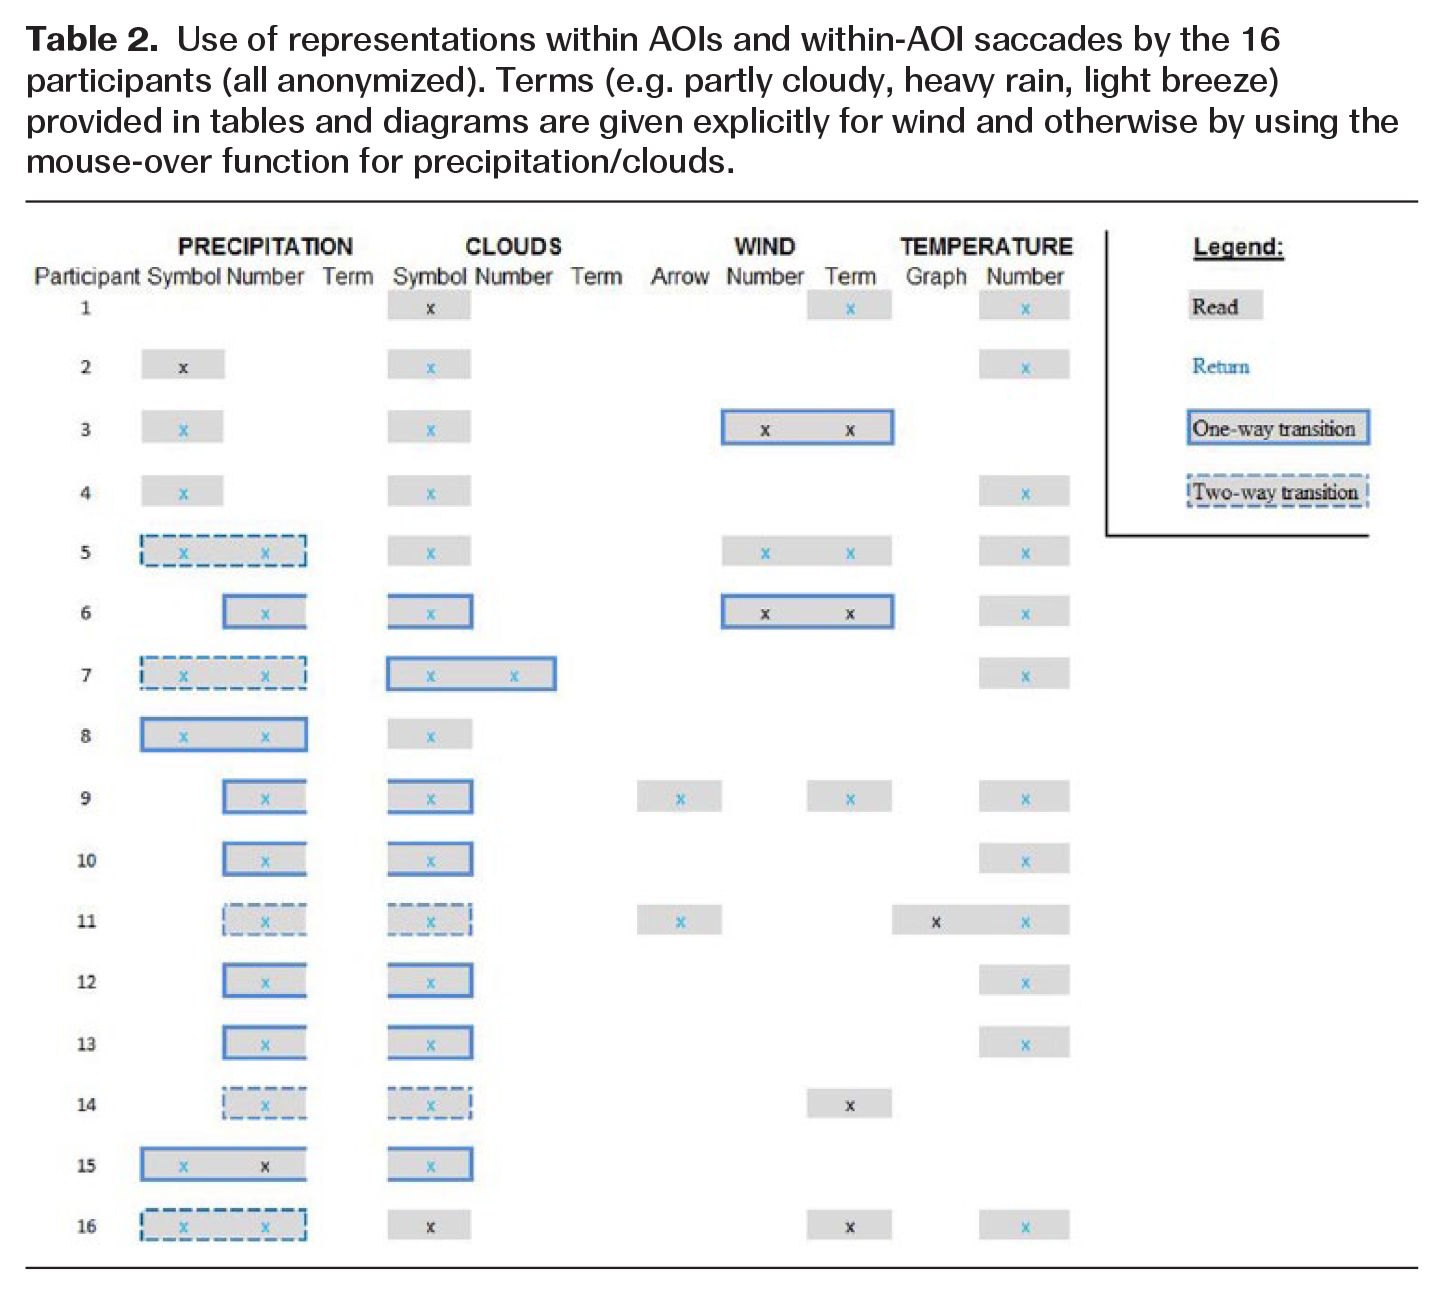
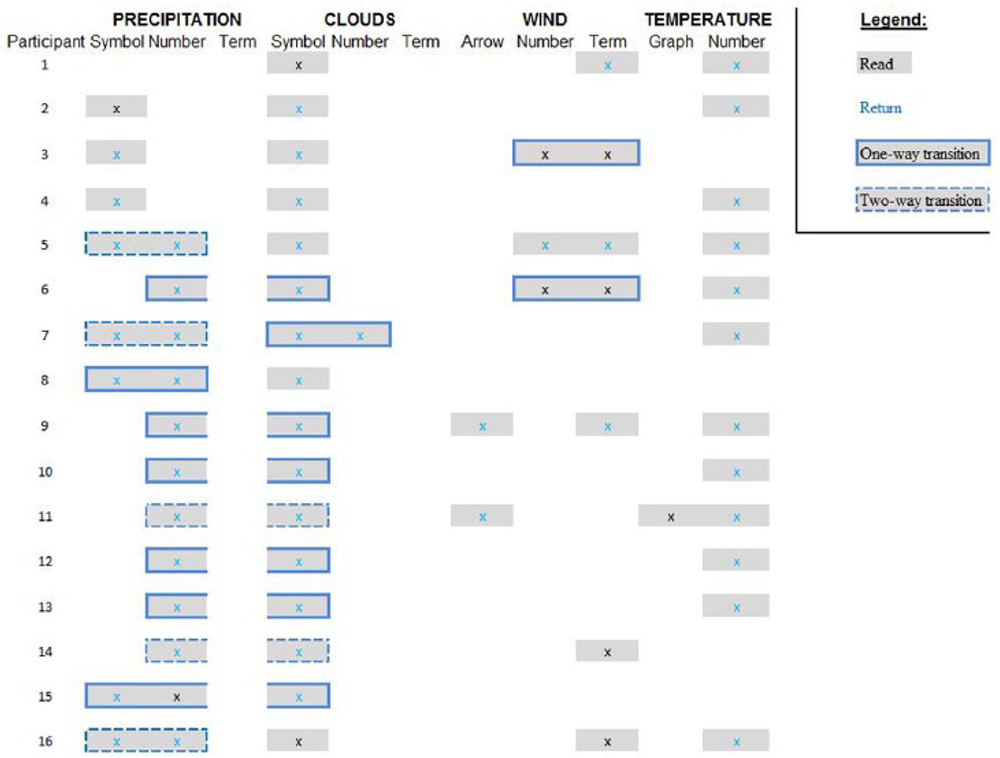
Similarly, fine-grained descriptions of the representations each participant viewed (one fixation) for each phenomenon at the same point of time were provided (Table 2).
Use of representations within AOIs and within-AOI saccades by the 16 participants (all anonymized). Terms (e.g. partly cloudy, heavy rain, light breeze) provided in tables and diagrams are given explicitly for wind and otherwise by using the mouse-over function for precipitation/clouds.
Thereafter, the participants’ reasons for constructing and using certain reading paths were assigned the code name ‘reason path’ plus the reason given.
Third, the reading paths and lists of representations (Tables 1 and 2) were used to identify transitions between representations and within-AOI saccades (for the same phenomenon at the same point in time; Holmqvist et al., 2011). The term ‘transition’ is used in this study as a collective term for the transitions between representations and within-AOI saccades. One-way transitions were defined in this study as a saccade between two read representations, without searches or navigation to a new page in between. A two-way transition was defined as an immediate saccade back to the first representation that was read after a one-way transition. Finally, a return was defined as a revisit to an earlier read representation after searching, navigation, or reading in between (see Figure 2 for examples of transitions).
Hereafter, the first part of a two-way transition is referred to as a one-way transition because the participants expressed similar reasons for making these two transitions. Accordingly, the second part of a two-way transition is referred to as a return.
Thereafter, all utterances in the transcripts concerned with reasons for transitions (based on Tables 1 and 2) were assigned the code name ‘reason transition’ and the expressed reason for the transition. It was not possible for the interviewer to identify all within-AOI saccades during the eye-tracking recording because of the numerous and rapid eye movements, and the unidentified transitions were not possible to discuss.
To check for intra-coder reliability, data for three randomly chosen participants were re-analysed three months after the first analysis. The resulting intra-coder agreement was 83 percent, which is acceptable (Miles and Huberman, 1994). By calculating Cohen’s kappa, agreement due to chance is factored out. The resulting Cohen’s kappa is 0.78 (1.0 denotes complete agreement).
Results and Discussions
The next two subsections present and discuss the results of the analysis, which are summarized in Tables 1 and 2. The two subsections focus on the participants’ reasons for the various reading paths (i.e. RQ1), and reasons for transitions between representations (i.e. RQ2).
Reasons for constructing various reading paths
In a nonlinear and highly visual text such as Yr.no, the reader must decide in what order to read the different parts, which information is relevant to the task at hand and which is superfluous (Hannus and Hyönä, 1999; McTigue and Flowers, 2011). Thus, different reading paths could be expected since Yr.no has on open organization and the 16 participants constructed individual reading paths (Tables 1 and 2). Interestingly, the participants provided three reasons related to decision-making for constructing their reading paths, as exemplified by Frans, Tor and Dag (fictitious names for participants 1, 4 and 7 in Tables 1 and 2, respectively).
Frans used minimal information and made a quick decision: he read only one table while performing the task (see Table 1). Explaining his reasoning, he said: ‘I found an OK forecast for tomorrow. I didn’t consider the forecast for next week, because my friend could paint tomorrow.’ For Frans, this information and the level of detail were good enough to give his friend advice. He also reported having blind faith in the forecast and further assessment of forecast uncertainty was unnecessary for him. Fair weather was forecast for the next day and this might have influenced Frans’ reading path because the weather conditions were suitable for painting.
Tor noted weather conditions similar to those noted by Frans, yet he acquired more information: he read three tables while performing the task. Explaining why he consulted several tables, he said: ‘I don’t think it is good enough to just look at one table; I want more information.’ The task asked for weather at a specific point in time and he knew that predicted weather can change rapidly. For this reason, it was not good enough for him to merely read the first table before providing his advice. He usually assessed forecast uncertainty, but he did not do so on this occasion, he said. Because the weather conditions were similar, there must have been another reason for the different reading paths constructed by these two participants. It appears that Frans and Tor had different decision-making processes when performing the task; that is, the construction of reading paths was related to decision-making processes (Hannus and Hyönä, 1999).
Dag read four tables and tried to read a diagram while performing the task. He also went back and forth several times to compare the forecasts for the following day and the following week. Explaining why he did this, he said: ‘If I were to give a friend advice about painting, I would like to be absolutely sure, double check.’ Dag aimed for an elaborate decision process where he also assessed forecast uncertainty. Thus, meaning-making related to Lemke’s (2005) orientational as well as organizational function influenced his reading path. A small amount of rain was forecast the next day, presenting Dag with a different, more demanding, set of weather conditions. This difference, in addition to the decision-making process, may have affected his reading path. Another study of Yr.no (Sivle & Kolstø, 2016) also found that the amount of information used in weather-related everyday decisions depended on the suitability of the weather conditions, as well as on the importance of the envisaged activity.
Reasons for making transitions to another representation
On the large-grained level, the reading paths consisted of tables, diagrams and verbal text. With effectiveness and ease of finding a specific value emphasized as reasons, all the participants preferred to read at least one of the time-ordered tables while performing the task. Four participants made one-way transitions to a second table (Table 1). The reason they gave for these transitions was to acquire more information and they were looking for more details than were provided in the overview table they first read. Instead of producing a synergistic effect, the tables served a complementary function, thereby providing overviews or details in otherwise similar representations with respect to modal affordances. This indicates that when the information was integrated during one-way transitions between similar representations there was no synergy effect.
What about one-way transitions between different representations? Most of these transitions did not lead to a synergy effect, neither at the large-grained nor at the fine-grained level. Instead, the complementing or constraining functions of the representations was exploited. For example, by looking at the cloud/precipitation symbol, the participants could note whether it would rain or not, and they then obtained complementary information by noting how much it would rain. This finding is consistent with earlier studies that indicated that symbols can be used to obtain information regarding the quantitative aspects of precipitation by noting the number of snowflakes or raindrops in a symbol (National Research Council, 2006; Sivle et al., 2014).
However, the reasons given by three of the participants who made transitions between cloud/precipitation symbols and precipitation numbers (Table 2) indicate that occasionally a synergy effect was achieved. Dag provided an example when discussing cloud forecasts:
Why did you look at the amount of clouds [in percent] in addition to the symbol?
It might vary; they don’t have symbols for everything. The symbols show roughly the kind of weather that is expected. The percentages give me an additional impression; for example, there you have 56 percent and there 80 percent, even though the symbol is the same [partly cloudy].
It appears that Dag read both representations because he had experience with one symbol denoting different amounts of overcast. Using numbers to identify features of an image is a type of intermodal identification that can be used to model the relations that jointly construct presentational meaning (Unsworth and Cléirigh, 2014). Dag could not know by reading one symbol what quantity to expect. Therefore, he had to read both a symbol and a number to control the relationship between them. Similar reasons were expressed by two other participants when they read both the symbol and precipitation numbers. They knew that the same amount of precipitation may be associated with different cloud symbols. These explanations indicate that the integration of numbers and symbols gave these participants more information than they would expect from reading the representations separately, thus multiplying meaning (Lemke, 2005). As a result, they could gradually identify a pattern in which a certain amount of precipitation (numbers) was associated with a certain symbol and thus develop a deeper understanding of the structure of the system, as described by Ainsworth (1999).
Returns had a function different from that of the one-way transitions at both large- and fine-grained levels. Returns were not for the purpose of acquiring more information or to control relationships. Seven participants reported the desire to compare, double-check and ensure that they would remember previously read information as a reason for returning to symbols, numbers and tables. Anja provided an example:
First, I read the forecast for tomorrow, and then I read the forecast for next week. Then, I read them over and over again, to be sure I remembered correctly.
In addition, Marcus explained that an uncertain forecast was the reason he needed to alternate between and compare the two forecasts, to be sure of selecting the best day for painting. It appears that these two participants did not compare information because of the complementing or constraining functions of the representations. Rather, they achieved a synergistic effect by integrating the information. This effect was not providing a deeper understanding of the phenomenon (Ainsworth, 1999) but a higher degree of certainty regarding the understanding of the information, which is related to the orientational function of meaning-making (Lemke, 2005).
General Discussion
Many advantages of multiple representations were not exploited
On the fine-grained level, both symbols and numbers were typically read. However, on the large-grained level, representations other than tables were rarely (on only two occasions) successfully read. According to Holsanova et al. (2009), the spatial layout of information affects readers’ behaviour. A shorter physical distance between representations is supposed to facilitate the integration of information. In this study, many representations were separated by a short distance. Therefore, contrary to the findings, the use of several representations and numerous transitions in between could be expected. In the following, three possible explanations for not using other representations than tables and thus not exploiting advantages of multiple representations are discussed.
First, in this study, a new operationalization of multimodal reading was developed. Thus, it is possible that this method to detect multimodal reading is insufficient and that some of the participants’ transitions were not discovered and further examined. However, the verbal data indicate that most transitions actually were discovered.
Another possible explanation for not making transitions is that the choice of representation(s) depends heavily on the task. The reason the participants expressed for reading the time-ordered tables was the ease of finding information specific to a point in time, which is related to the organizational function of meaning-making (Lemke, 2005). Thus, it is likely that the dominant use of tables at least partly was due to the task; that is, asking for weather at a specific time. The participants consulted the tables as the most suitable representation (for them) for performing the task. Most likely, they preferred tables because they were familiar with the representational system, they knew the processes needed to interpret them and they were able to find information more rapidly. Another task, for example asking participants to find the time of the day with the highest temperature, may have prompted more participants to read the graph in a diagram by focusing on various affordances favouring a different organization. However, the low number of participants who said they sometimes read a diagram makes it less likely to expect a change in behaviour. Moreover, the verbal data indicated that certain participants, as exemplified by Dag, aimed for an elaborate decision process. In these situations, we could expect the use of several representations to develop a broad overview and a deeper understanding. When this was not the case, and only four participants said they occasionally used representations other than tables, it appears to be more likely that the participants preferred to use tables irrespective of the task. This assumption is supported by two studies of textbook reading which also found that diagrams are often ignored by students (Cromley et al., 2010; McTigue and Flowers, 2011). Furthermore, according to Stieff et al. (2011), some studies indicate that students’ ability to interact with multiple representations may be limited by both content knowledge and by representational competence. Coleman et al. (2011) found in their survey of 388 elementary teachers’ use of graphical representations that students were not explicitly taught how to make meaning in science diagrams and other visuals of science. These findings are supported by a finding from the present study; a few participants were unfamiliar with some of the other representations and gave this as a reason for being unable to interpret them. For example, five participants said they did not use a diagram (diagram C) because it was slightly difficult to read the plotted temperature values: ‘In the diagram, you kind of have to search … First you have to find 9 o’clock [on the x-axis], then the temperature [using the graph and its y-axis]’ (Mats). Thus, even though the participants as science students were expected to know the various representations provided at Yr.no, a third possible explanation for not using multiple representations is that their affordances were unknown to the participants. For example, one participant found it easier to search for temperatures above or below certain thresholds (e.g. freezing point) in a diagram (diagram C) than in a table. Examining temperatures in relation to thresholds are relevant when solving the task at hand (outdoor painting); thus, more participants could have taken advantage of using the diagram. McTigue and Flowers (2011) claim that simply having more exposure to multimodal texts does not ensure that people learn to read them. Therefore, the potential advantages of various representations should be explained to readers so that they can be guided and thus make the most of various affordances in situations where they aim for an elaborate decision process.
In situations where users want to fully exploit the advantages of multimodal information, different representations should be used and integrated to achieve a synergy effect. The multimodal website used in this study was complex and included several representations without explicit connections (i.e. no explanations of when and where to read). Hannus and Hyönä (1999) and Holsanova et al. (2009) suggested that readers should be guided through complex information to obtain a deeper understanding of its contents. However, McTigue (2009) found that written cues provided limited benefit for integrating information and scaffolding in another form might be needed. McTigue and Flowers (2011) found that students appreciated ‘a good title’ and ‘helping things’ (the students’ own words) when reading diagrams. Thus, clear, informative labels accompanying each representation could explain what to read and help readers make more frequent transitions. If representations were labelled according to their usefulness for solving specific problems, then readers could select a representation with affordances well suited to their decision-making situation.
Decision-making should be considered when assessing mastery of multimodal reading
When studying the participants’ reading paths, it is important to remember that they were provided with authentic forecasts to perform the task. Although they were given multimodal reading material with the same structure, the content (i.e. the forecasts) changed from day to day. It is likely that the weather predictions on any given day affected their reading paths. Betsch and Glöckner (2010) argue that if the information is coherent (favours one option and speaks against another option) decisions are easier to make. This means that the same participant might have constructed a different reading path some other day with different weather forecasts. However, the participants provided with similar weather forecasts also constructed different (time spent, information included, transitions made) reading paths. The participants also expressed different reasons for constructing different reading paths, which indicate that certain differences were related to different decision-making processes, as noted by Hannus and Hyönä (1999). In turn, these differences relate to Lemke’s (2005) organizational function for meaning-making; that is, which information to include in the reading path. Further, which information to include also depends on the reader’s assessment of forecast uncertainty (the orientational function). Different reading paths may also be viewed as an indication of different levels of reading skill. For instance, Hannus and Hyönä (1999) found that high-ability students carried out more transitions between verbal text and a relevant illustration than low-ability students. In the present study, Tor read more representations than Frans and Dag read more representations than either of them. Dag, furthermore, experienced successful one-way transitions and returns between representations, thereby integrating information and achieving a deeper understanding. Holsanova et al. (2009) reported that reading time, reading order and number of fixations were correlated with reading comprehension. However, this does not mean that Frans is not a skilled reader or does not master multimodal reading. It is important to note that it is not sufficient to use reading time, reading path, transitions and integration of information alone as a measure of reading skill. The reading path also appears to depend on the reader’s decision-making process. It is not very likely that one type of decision-making behaviour is adopted in all situations (Schwartz et al., 2002). Individuals most likely have variations in their information search and processing across different situations, assumed to depend upon environmental, task and personal factors (Betsch and Glöckner, 2010). Thus, in a different context, Frans may have displayed evidence of stronger reading skills by integrating information.
Conclusions and Future Research
The participants in this study made meaning of the multimodal information by first finding a representation that could help them solve the problem. They preferred to read tables with symbols. Their reasoning was that they considered reading tables to be efficient when searching for time-specific data and they knew how to interpret this representational system. The opportunity for acquiring more information and controlling and comparing information to validate their decision was cited as a reason for making transitions between representations. They made such transitions when they considered it to be necessary. However, tables and symbols dominated the reading paths and the possible advantages of multimodality were typically not exploited. The predominance of tables may have been caused by the task but it is also likely that readers in some situations need to be guided through the website to better use and integrate the various representations. The participants’ decision-making processes influenced their reading paths and should be considered when assessing mastery of multimodal reading. Informative labels that clearly explain the usefulness of various representations may improve designs and help readers benefit from multimodal reading material as well as making informed decisions in situations where this suits their needs.
As such, the present study reports multimodal reading of authentic texts in a way that has been called for in the literature. At the same time, the authentic task, involving changing forecasts, poses different limitations concerning generalizability compared to a fixed task. The present design, however, has the potential of producing a variety of results that should be subject to further scrutiny through experimental designs in future studies. From the present study, we suggest five conjectures – or hypotheses – for future research in this specific domain:
One-way transitions between similar representations provide no synergy effect.
A synergy effect is achieved when one-way transitions are used to control relations between different representations.
Returns have a different function from that of the one-way transitions: that is, to compare and double check information.
Tables are preferred over diagrams irrespective of task.
Diagrams are not used because their affordances are unknown.
These tasks for future research are characterized by the search for the most flexible combination of two apparently opposite working parameters: prioritizing the most intuitive mode of representation and the timing and introduction to detailed, specialized information.
The present explorative study provides some contributions to future research but is limited by its small sample size. Future studies of different groups performing several different tasks in a more experimental setting are warranted before a decision can be made regarding the design of (online) multimodal and highly visual information.
Also, in this study, a new operationalization of multimodal reading (seven or more fixations in one AOI) was developed. This should be refined in future studies: one idea is to separate the cognitive process of skimming from reading and searching in order to develop an even better correlation between eye-tracking data and verbal data. In turn, this could help in identifying transitions between representations with greater accuracy and improve the analysis of people’s reasons for these transitions.
Footnotes
Acknowledgements
The eye-tracking equipment used in this study belongs to the Norwegian Reading Centre’s eye movement lab.
Funding
This research received no specific grant from any funding agency in the public, commercial, or not-for-profit sectors and there is no conflict of interest.
Biographical Notes
ANDERS D SIVLE is an operational weather forecaster and researcher at the Norwegian Meteorological Institute. He has a master’s degree in meteorology from the University of Bergen (2005) and teacher education at the Norwegian University of Life Sciences (2011). The present study is a part of Sivle’s PhD degree from the University of Bergen (2016) in the field of Science Education.
Address: The Norwegian Meteorological Institute, Vervarslinga paa Vestlandet, Allègaten 70, 5007 Bergen, Norway. [email:
PER H UPPSTAD is a Professor of Special Education at the Norwegian Reading Centre at the University of Stavanger. He has a PhD degree in the field of general linguistics from the University of Lund (2005) entitled ‘Language and literacy: Some fundamental issues in research on reading and writing’. He is also one of the editors of the Nordic Journal of Literacy Research.
Address: University of Stavanger, Professor Olav Hanssens vei 10, Stavanger 4036, Norway. [email: