
Abstract
In February 2018, after three years of design and development work, the British Broadcasting Corporation (BBC) Weather launched its redesigned service across multiple platforms. The project involved new ways of cross-disciplinary communication design working across broadcast and digital services. This research examines these innovations and considers the transcorporeality of our relationship with weather forecasting.
BBC Weather developed an iconography in the mid-1970s that has been integral to its brand identity and which has survived the changes in television graphics technology from magnetised acrylic symbols to digital systems. Satellite imagery, advanced computer weather modelling, mobile interaction, and weather on the move in realtime, have become integral to presenting different layers of visual sophistication and information that require translation and editing to communicate the weather across multiple platforms and formats.
An ethnographic study of the leading participants in the design project mapped out the creative process and highlighted reflexive points where design practice was modified and adapted by the interdisciplinarity of the team. Their approach to design anthropology and service design approaches are revealed in the context of Design Thinking, and how the domestication of digital services is linked to a relationship to the weather for a UK and Irish audience.
Introduction
In February 2018, the British Broadcasting Corporation (BBC) Weather launched its redesigned service across multiple platforms, following a corporate procurement process and three years of design and development work. This research examines the cross-disciplinary aspect of this communication design project to highlight new ways of working across broadcast and digital services and considers the transcorporeality of our relationship with weather forecasting.
The redesign of BBC Weather was prompted by the demand to keep a commercial advantage in an increasingly competitive market using design innovation that would be future proof and sustainable for at least another eight years. The approach to design aesthetics had to balance technological, semiotic and branding demands.
BBC Weather developed an iconography in the mid-1970s that has been integral to its brand identity and which has survived the changes in television graphics technology from magnetized acrylic symbols to digital systems. Moreover, satellite imagery and advanced computer weather modelling have become integral to presenting different layers of visual sophistication and information that require translation and editing to communicate the weather forecast in an increasingly interactive (and entertaining) presentation for audiences. These are now viewed as site-specific live updates and hourly to week-long forecasts on mobile devices, computers as well as television, both in landscape and portrait formats.
The redesign of BBC Weather was the largest project that the various commissioning editors and creative directors had been involved with to date. The scale was comparable to any national and global broadcaster and many large institutional IT and service design projects. As such the project’s various deliverables and interdisciplinary teams required a fresh approach to one previously employed at the BBC (Grainge, 2011; Macdonald, ).
The scale of the project necessitated the first collaboration of the Broadcast and Digital design services at BBC Weather. Each department came with their own set of user perspectives and research methods. In a reflexive approach, the designers articulated their relationships as practitioners and as users, building an understanding of their different design approaches and domains. This was further complicated by having to work with an external weather data provider that provided a bespoke computer modelling system.
A chief service of the designer is helping clients discover what they want designed (Brooks, 2010), and through a process of design anthropology (Drazin, 2012) discover how audiences interact with digital services. Through a dialogue ‘the process of designing, the problem and the solution develop together’ (Cross, 2011: 10). It calls for Design Thinking (Brown, 2009; Kimbell, 2011).
A British Historical Perspective
Talking about the weather is perceived by many visitors to the UK as a very British trait (Fox, 2014), although it could easily be said of many maritime countries where weather is apparently unpredictable or at the very best changeable on an hourly basis. In America, ‘weather is the soap opera we all watch’, with dramatic twists and turns of plot (Monmonier, 1997: 40). Urban dwellers want a weather prediction to know what to wear, farmers want to know when to sow or harvest and, for those looking to set sail on the sea, they want to ensure their very lives are not in peril.
Not surprising then that a naval officer, Admiral Robert FitzRoy, is celebrated as the founder of the Meteorological Office and pioneer of daily weather predictions. But it was the Victorian polymath Sir Francis Galton who is credited with creating the first diagrammatic weather map after plotting data, such as wind speed and direction, atmospheric pressure, cloud cover and precipitation, from meteorological stations across England in October 1861. He designed a series of symbols and proved that air circulated clockwise around areas of high pressure, thus coining the term ‘anticyclone’. Weather maps began as tools for scientific discovery and theory development, but the advent of telegraph communications allowed timely assembly of dispersed reading stations to form forecasts (Monmonier, 1997).
These weather maps were soon published in newspapers by modifying the pantograph (a tool to copy drawings) to inscribe the map onto a printing block. A visualization of what weather was where was made portable to a public that had access to daily newspapers. As a means of communication, the weather forecast relied on timeliness of delivery (a delay of a day rendered the map useless and defeated the purpose of a weather forecast) and literacy: an educated audience that knew how to interpret the symbols and isobars (lines of equal atmospheric pressure). From that period on, the visual communication of weather forecasts has been inextricably linked to the development of communication technology.
When the BBC began experimenting with television broadcasts of weather forecasts in 1936, then put into practice in 1949, the map filled the entire screen with an off-screen announcer reading the next day’s weather report from the UK Met Office. The maps were drawn by hand on pre-printed maps by meteorologists and couriered across London to the studio from the London Weather Centre. On account of the low resolution of the television picture, these maps were simple and often inaccurate compared to their newspaper rivals. In-vision weather presenters from the Met Office were introduced in 1954 and have since remained an integral part of weather visual communication.
Significant improvements in accuracy and quicker forecasting came in 1962 with the installation of a fax machine and an electronic computer in the Met Office. Satellite photography became available in 1964 but was of such poor quality that the delineation of coastlines had to be enhanced with a felt-tip pen. Almost as a classic example of Moore’s Law (Lundstrom, 2003), by 1973 increased computing power had doubled the accuracy and speed of forecasting. Colour broadcasts and improved television resolution allowed greater graphical detail and drawn maps gave way to symbols stuck to a magnetized map as weather presenters delivered a hand-applied narrative of the movement of weather systems for the coming 24 hours. These symbols had hardly changed since Galton 100 years earlier.
In 1975, the responsibility for the design of the weather icons was taken away from the Met Office and given to BBC Graphic Designers who replaced archaic scientific symbols for easily readable ones, graphic representations of clouds, sun, rain, snow and hail that are still familiar to today’s users of the digital BBC Weather app. These were designed by professionals with an educated understanding of visual communication and semiotics, rather than those educated in meteorological science.
In 1985, the occasionally comic unreliability of the magnetic graphics were replaced by then state-of-the-art computer graphics. However, after 30 years of ‘self-explicit’ weather communication, the on-air televised weather forecasts abandoned these icons in 2005 in favour of a more graphic realism of sunlit/overcast computer-generated ‘satellite’ viewpoints with animating blue masses of rain. The Met Office’s supercomputer calculation speed had increased from 30,000 calculations per second in the 1950s to 200 million calculations per second in the 1980s; by 2014, it was over 10,000 trillion calculations per second (Teague and Gallicchio, 2017: 37).
The most recent redesign of BBC Weather (2017) was, for the first time, a comprehensive and integrated project that went across every BBC visual media platform: broadcast (television) and digital (web and app). Different research methodologies came together and changed the professional practice of broadcast design. ‘While a new technology can exist without thinking much about people, a new design must think about people’ (Drazin, 2012: 252, emphasis in original). The result was a design concept called ‘Window on the Weather’, a portal into a virtual presentation of the weather outside. For the app, it was a ‘pocket presenter interpreting the day’s weather for you’. It provides one example of many mobile applications that developers and designers have created which are now ‘domesticated’ and an ‘accepted part of everyday life’ (Horst, 2012). ‘To design digital objects is to design people’s lives’ (Löwgren and Stolterman, 2004: 1).
Transcorporeality
The pocket weather presenter concept of the BBC app is a near-live service, updated hourly with data and forecasting using the user’s location provided by the handset. The app also provides weather reporting and forecasting across the globe, so users can simultaneously feel connected to relatives or places of interest beyond their immediate physical locality. Does this make the weather feel more part of us, now that it is possible to have a live visual connection beyond experiencing the physical weather moment on our skin? Neimanis and Walker (2014) elevate the concept of human connection to ‘weathering’ as an argument to ‘rethink the temporal narratives of climate change discourse and develop a feminist ethos of responsivity towards climatic phenomena’. In an appeal to awaken a direct recognition of the ‘transcorporeal, intra-active phenomenon’ that human impact has with climatic change, where ‘weathering’ ‘brings humans into relation with more-than-human weather’, they argue for a change of approach. By seeking to separate ourselves from the weather (climate change, in their wider argument) by closing the door, resisting the winds, only maintains ‘a worldview of relating to the earth, rather than worlding with it’ (p. 567, emphasis in original).
Perhaps the BBC Weather app can bring us a closer relationship to the exterior weather, one that we have hitherto done our best to insulate and neutralize ourselves from? ‘How we live in the world is contingent upon how we imagine that world to be’ (Neimanis and Walker, 2014). The ‘window on the weather’ suggests an interior viewpoint looking out to the exterior world, where weather is animated over a photo-real multiplane. The designers’ illusion is to mediate the weather in a new way, which is partly embodied (trying to get closer), and partly doubling down on the virtual. It seems all that is missing from this visual illusion is the condensation from our breath and contact from our fingers. It is limited to an ocular experience of the weather, whereas worlding in the weather is more visceral: temperature experienced through touch, wind physically and aurally. Despite the limits of current immersive mobile app technology, we shall discover how inclusive user needs have been researched taking a ‘thoughtful design’ (Löwgren and Stolterman, 2004) approach within the ethos of public service broadcasting.
With added computing power there is a temptation to add more complexity and functionality (Janlert and Stolterman, 2017a). The mobile and computer screen are bound by physical restrictions and so the ‘window on the weather’ uses depth of field to minimize visual clutter, recognizing the potency of the familiar in human perception in order to communicate quickly and efficiently. For those requiring more detail, swiping left reveals, graphically and numerically, the hourly forecast for the next five hours broken down into sun/cloud, temperature, percentage chance of precipitation, and wind speed and direction. At this point, any illusion of a window on the weather is literally wiped away in place of an interpretation of the day’s weather for the users, presumably then to be returned to their pocket. Similar to the first weather maps printed in Victorian newspapers, another technological revolution advancing visual communication has once again been normalized and taken as a universal entitlement.
Methodology
In order to understand the different sides of the design process, it was essential to hear of the experiences and reflective perspectives from those who were involved (Blomberg et al., 1993). As Rowe (1987: 1) states, ‘there is no such thing as the design process in the restricted sense of an ideal step-by-step technique’ (emphasis in original). An ethnographic methodology to gathering qualitative data was the most appropriate approach (Hammersley and Atkinson, 2019).
Participant selection (Reybold et al., 2012) was influenced by access to the leading designers and other stakeholders. Using existing contacts within the BBC, leading members of the broadcast and digital design teams were approached and agreed to be interviewed. Two on-screen weathercasters were approached for comment and interview but declined, citing contractual limitations that restricted them from participating in external research.
The researcher had been a BBC graphic designer 20 years earlier, and was therefore well informed in the approach to design and production of broadcast television graphics within the context of BBC culture (Born, 2005; Macdonald, 2014). A significant amount of time had lapsed to avoid any direct conflict of interest, but others will gauge whether any unconscious bias has tempered this study and the researcher’s ability to evaluate the design culture with complete detachment (Ellen, 1990).
In a similar methodology to Rowe (1987), this research was undertaken in a long interview with follow-up correspondence with the lead creative director from Broadcast, Simon Hunt, and a leading digital designer Edwina Nolan. Semi-structured interviews (Neuman, 2000) using open-questions were used to uncover an explanation of the process and rationale behind each stage of the project from the different perspectives of the Digital and Broadcast designers. It provided ‘greater insight than might be gained from mere observation of surface activity’ (Rowe, 1987: 2). Hunt’s interview took place at BBC Broadcasting House in the vicinity of the weather studio and designers’ workstations, which are in a multi-floored open-plan studio. Nolan’s interview was face-to-face via the internet from her home.
A topic guide for the second interview was adapted to uncover more about how audience user behaviour was researched and how it influenced the communication and service design process (Spradley, 2016[1979]). In addition, online BBC blogs from the Head of Weather provided qualitative data from another key stakeholder: the client.
The interviews were recorded, transcribed and coded to find similarities and check any differences in the narrative of the design process, and then to group responses according to key phases of their design practice (Hammersley and Atkinson, 2019).
BBC Weather Project
Procurement
In 2014, BBC Procurement began the process of tendering a new contract for the delivery of the BBC Weather service as the existing contract with the UK Meteorological Office was nearing an end. It provided a potential change of provider for the graphic generation and weather data provision, two different contracts that could be combined in one service provider to the benefit of the organization and management of BBC Weather. As such, it was an opportunity to revamp the graphic design presentation across all delivery platforms: broadcast, online and mobile phone. Given the time cycle for procurement, the approach to the visual design and technology specification had to be future-proof for at least 8 to 10 years.
We have worked hard in recent years to create new products for our audiences to satisfy an ever-increasing appetite for information . . . A quarter of all people now check the weather from us on their mobiles and we’ll carry on innovating. (Charters, 2016)
The first step was to illuminate the problem (Lindberg et al., 2010). In the briefing document, the supplier had to ensure information security as well as meteorology, technology and design. There were over 100 requirements for the graphics alone. In the pitch, the difficult decision was to decide how to break away from what was familiar and established. Within the year, a shortlist of five tenders was focused on three final bids after a two-day presentation of software and early visual ideas at BBC Caversham, the Research and Development site for BBC Monitoring.
In 2016, procurement Project Director Nigel Charters gave reasons for awarding the contract to MeteoGroup, and not the incumbent government-funded Met Office:
MeteoGroup will be putting their multiple sources of meteorological data into providing more comprehensive and detailed forecasts at the heart of our award-winning weather app and TV or online weather graphics . . . We’ll also be using MeteoGroup’s graphics system so that our brilliant weather presenters can easily design and manage content themselves creating great images for TV and online. (Charters, 2016)
Once the procurement process, was concluded the design phase could begin in earnest.
Service design and wider design ecology
The scale of the project demanded the setting up of the first joint Digital and Broadcast design team in order to produce an integrated broadcast and online design. A team of six was comprised of a creative director and two designers from each Digital and Broadcast Design group. Within the BBC, different design groups have existed to deliver projects and day-to-day graphics across the two platforms, which have their own specific media demands for production by the BBC presenters and producers, and consumption by the audience. A coherent brand identity and media-focused utility necessitated a collaborative design approach. This was the first time an internal BBC interdisciplinary design team had come together to work on a holistic service design project across all media platforms. It ensured that there was a consistency of branded and interactive delivery of weather information to audiences across multiple platforms. This integrated design approach is an example of the new concept of ‘branded interaction aesthetics’ (Roto et al., 2018b: 393). The Design Team also recognized the critical involvement of the presenters and production team before prototypes could be tested with audience research groups across the UK regions. Designers could be the interpreters, the ‘glue’ that bound different cultures of working and problem solving, as well as the creators of a new cultural form (Kimbell, 2011).
BBC Weather’s digital design process lies at the nexus of a series of overlapping discourses and practices, not just between Digital and Broadcast Design. These overlaps are heavily contested, more in the professional community where consultants seek to carve out their own niche, than perhaps amongst academics. UX, Experience Design, Interaction Design are disciplines, and Service Design an approach that is related yet distinct (see Figure 1). UX Designers are concerned about the what, how and why of a digital interaction; Service Design is concerned about everything and everyone that touches upon the delivery of a service; Design Thinking is the mindset and the set of tools that we use to understand our particular users (Roto et al., 2018a).
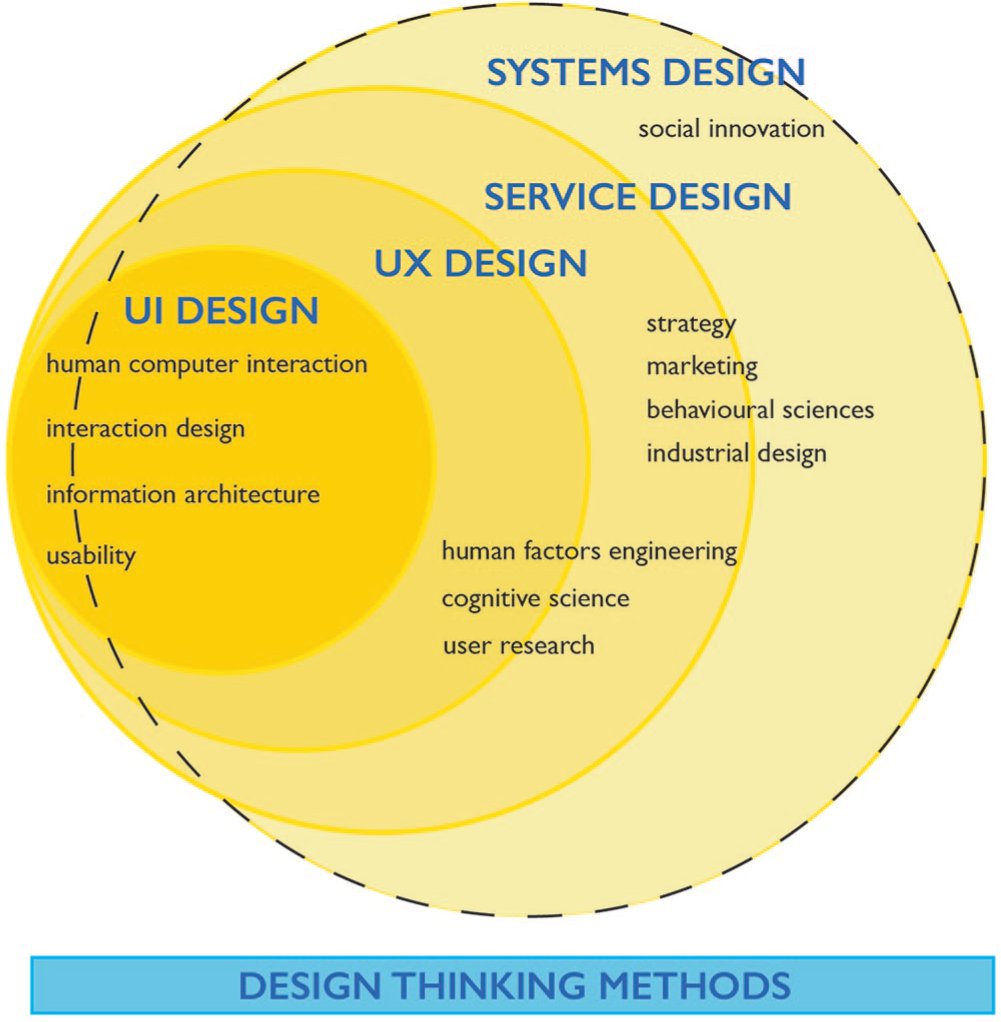
Design Systems map. Source: author.
Research
Following Service Design Thinking (Stickdorn and Schneider, 2010) the first step was to design the research process of the workshops. The Design Team led by Simon Hunt began with workshops to examine the core values of the BBC Weather brand, the what and the why.
We brought examples of design and brands that we thought worked well. We analysed what worked and why, nothing to do with weather, and then we picked them apart and identified what values were the same for BBC Weather . . . are we the Marks & Spencers of Weather or Paul Smith? (Hunt interview, 2018)
After some reflection within the Design Team, the workshops were repeated with the Production Team, taking on personas of imagined BBC Weather dinner party guests. ‘Who would you invite? What would be on the menu? Would it be safe for everyone to enjoy or a risky kind of dish?’ (Hunt interview, 2018). This creative role-play enabled a deeper understanding of the ‘personality’ of BBC Weather to be explored and articulated, and it was fun. ‘We tried to carry those elements all the way through the process, but it wasn’t always easy’ (Hunt interview, 2018).
Simultaneously, the Digital Design team worked with two external agencies to research into audience needs for website and app. ‘There was not a deep knowledge of people’s needs from a digital point of view’ (Nolan interview, 2019). The need to understand how people use and engage with digital products and services has developed new thinking in anthropology. ‘If you ask questions about what kind of “experience” happened around a mobile device, you should recognize that experience has been intended in the product design because of anthropology’ (Drazin, 2012: 249). This was essential research if the Digital Service was to meet the ambitions of the Head of Weather who announced:
. . . audiences can expect to see a more personalized website with clearer and more searchable graphics and more information on screen and on air. We are already planning to upgrade our app, which has been downloaded around 15.5m times or roughly once every 10 seconds, using this enhanced data service to bring even more science and forecasting detail too. (Charters, 2016)
Then, further workshops with weather presenters from all of the UK regions in the BBC network provided different questions at the optimum point in the Design Process. Hunt (interview, 2018) asserts that ‘the presenters’ input has been essential’, and his mission is to understand the weather and how presenters work. Digital Designer Nolan agrees:
The weather presenters were important stakeholders and had they not had confidence the app could accurately communicate weather forecast they would not sign off on the design. They were convinced that Design needed their time to help write the brief for the correct imagery according to weather conditions. They looked at cloud formations that accurately represented the seasonal conditions, time of day and position in a weather front. (Nolan interview, 2019)
Usability testing
Audience research from an earlier document provided some useful context at the start but, as the designs progressed, it was important to test them beyond the user–designer/presenter/producer groups (Fallman, 2003). Usability testing to attitudes to weather occurred every month or two weeks, depending on the stage of the Design Process, including notifications, the function of each button. These were face-to-face interviews with six people over a day, an hour each session, with some questions and a survey by Marketing & Audiences using a panel of BBC users on their database, which gave a broader base. The interviews were held at different times and places, such as a research laboratory in London, and for broader questions such as notifications, in Northern England and Scotland, acknowledging criticism of London bias. Age groups were also diverse, reflecting different life stages: under 18, 20–30, 40–50, retired and different accessibility needs. These groups might change depending on what they were researching, whether it be accessibility for the aged, or under 35s, under-served females or ethnic minorities.
The weather is very changeable in the South West because it is surrounded by sea, so the forecast ‘means a lot to people’ (Hunt interview, 2018), the Midlands also had different attitudes and weather needs; being geographically further from a recognizable and referencing coastline, it presents a different graphic problem. The Northern Isles presented a particular problem of map projection because of the geographical distance that separates Shetland from mainland Scotland. Many atlases avoid this by placing Shetland in a boxed area over the North Sea, but this so ‘irks’ Shetlanders and other sympathetic geographers and mariners that, in 2018, the Scottish Parliament passed a law banning public bodies from this ‘geographical mistake’. To compensate for the large body of sea between the Northern Isles, the BBC Weather Design Team experimented with different map projections before finding agreement with an orthographic projection for Scotland, and Mercator for the UK to prevent foreshortening of the northern half of the country that had previously displeased audiences (see Figure 2).
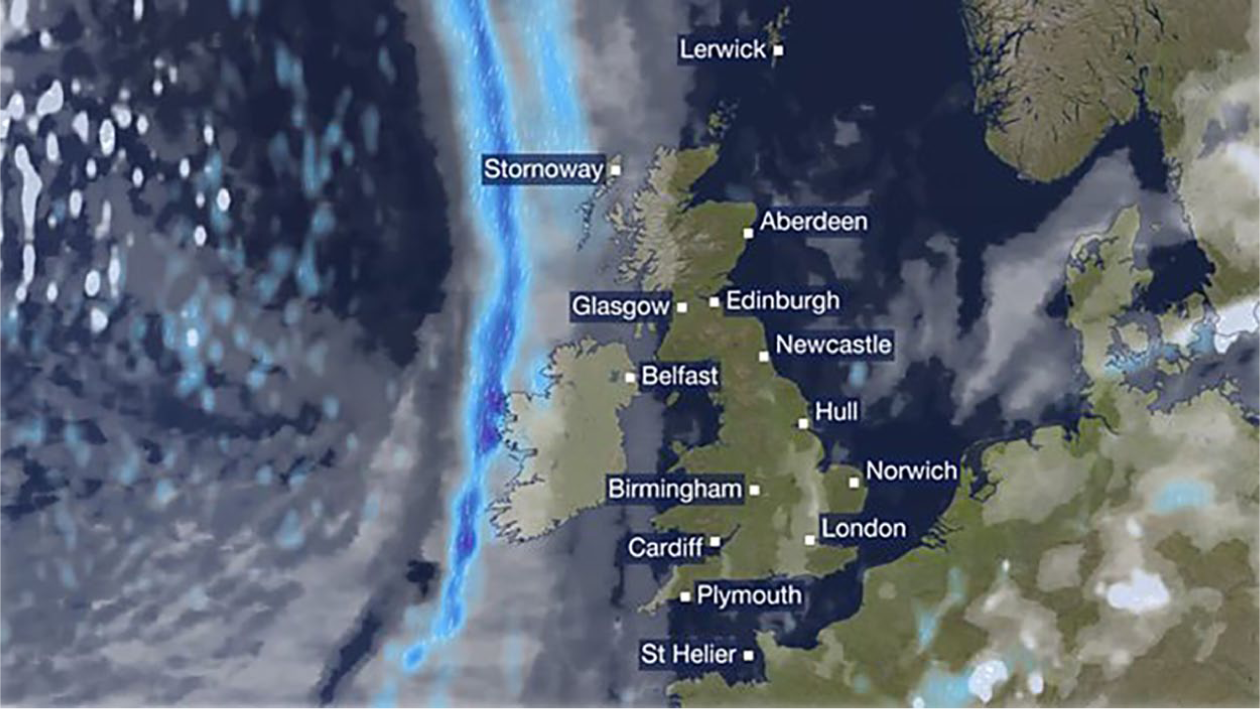
© BBC Weather. Map, February 2018. Reproduced with permission.
The design process gave Hunt an enhanced appreciation of the audience because he had benefited from more contact with the end-user. ‘News is reactive, a more methodical approach has come with having time to engage with audience feedback responses’ (Hunt interview, 2018). He attributes the Service Design Thinking to his colleagues from Digital Design where ‘touchpoints for a teacher, sailor, farmer and a commuter’ could be considered and visualized. Throughout the process, consultation and stakeholder involvement was key to keeping everyone on board and ‘happy’ with the design as the project developed, so that it would be accepted and workable across the regions. The Design Process is a dialogue (Li, 2002; Schön, 1992) but the communication skills of the designer are broader than interpreter (Kimbell, 2011), they also have to be able to sell (Brown, 2009).
Design concept
The top-level design concept for BBC Weather was ‘window on the weather’. It has four principles, ‘as if the viewer had just opened the curtains to the world outside’ (Hunt interview, 2018):
Always have an image in the background.
Show the weather photographically, for example, a scene in sunshine.
Mid-ground shows the surface of a ‘window’ with a hint of the weather on it, for example, frost or water drops.
Foreground, inside the ‘window sill’, present the weather graphics, the title strap and headline.
Within that concept, it allows for regional variation and specificity of place and weather. The ambition was to enable each broadcast to be individually constructed within editorial and design guidelines. The Design Team created pre-set templates to assist the presenters, who were given special training to use the computer graphic and editing interface that was developed with MeteoGroup. Each bulletin has a pre-set duration and format depending on its broadcast slot, such as the 10 O’Clock News, Breakfast or regional news. In the compact studio spaces for television broadcasts, the camera and lights are mounted on computer-controlled rigs that allow the presenters to personalize to their own pre-set positions. A user-focused design approach ensured that the presenters could reduce stress and save time in constructing and delivering their bulletins. The inclusive approach by the Design Team understood that not one person had all the answers (Brown, 2009).
Presenters can edit and add their own choice of background images (see Figure 3), usually supplied by a viewer, and also the amount of graphical information on the screen. Hunt’s mantra to the presenters is ‘less is more’, having frequently to police their initial ‘tendency to throw all the tricks at the screen’. While the presenters were clearly excited and enthusiastic to use all the new functions and imagery available to them, the Creative Director’s role was to inform them of valuable empirical evidence that proved audiences cannot read instantaneously more than five icons at a time (Shneiderman, 2010).
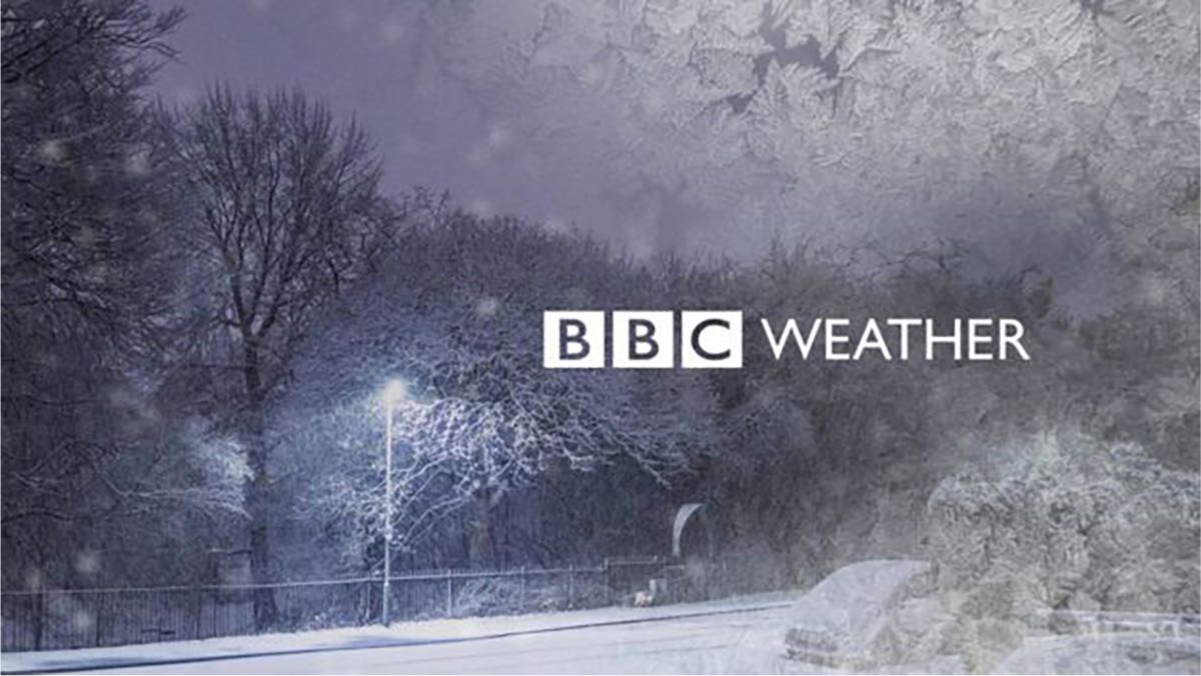
© BBC Weather. Window on the Weather. Reproduced with permission.
More computing power, more realism
‘There is an expectation from both the audience and clients for more sophisticated visuals’ (Nolan interview, 2019). Not only were map projections tested but also different levels of surface terrain detail and colours that were available from MeteoGroup, the new image and data provider. The BBC Broadcast map had been flatter and was now more textured in a move toward realism. On the Digital platforms, technology and software had allowed for schemorphic visualization (where an interface copies physical objects) in a live presentation that was previously impossible. However, similar to broadcast, audience testing found that satellite photographic realism and lush terrains were overwhelming with too much information, and visually too busy under the graphics. Too much ‘frenetic 3D imagery can leave viewers bedazzled but perplexed, still just wanting to know whether it’ll rain tomorrow’ (Henson, 2013: 5). Cartographers and researchers in psychology argue that ‘a map that simplifies the world and communicates only a small fraction of its real complexity may actually provide the map reader with subtle reassurance’ (Goodchild, 1997: 63). A gestalt principle comes into play: designers have learned that a maximum of five icons on the screen at one time is the optimum capacity for reading information, due to the transient nature of moving image graphics.
The BBC Weather icons that were established in the mid-1970s as comparably primitive magnetized acrylic symbols survived the re-design and a new icon for drizzle was added to the portfolio. All the stakeholders recognized the brand value of these icons that had been elegantly updated digitally by BBC Graphic Designer Liz Varrall in 1990. Drizzle was a new symbol and remains controversial. A lot of research was done to see if audiences understood its meaning, research that is still ongoing (Nolan interview, 2019). Research found that drizzle is sometimes misread as hailstones. On digital platforms, when it is sized down, drizzle can be harder to interpret for people with poor eyesight. ‘Drizzle means different things to different people – how does it affect people’s hair, or is it rain or not, do I need an umbrella or not?’ (Nolan interview, 2019).
In Hunt’s opinion in his (2018) interview, the icons are particularly effective for the summary Outlook of the week ahead with weather and temperature bars that rise and descend (see Figure 4). A lot of time was spent on defining the colours and tone of the icons, particularly the appearance of white clouds to ensure they read on white online backgrounds compared to those used for broadcast. On the mobile application, the icons animate and the use of photographic depth of field, or focus, is clearly evident to separate background from foreground. ‘On the app screen, the icon, numerical information, wind, an algorithm of text perfectly encapsulates that people understand different things, some look at an icon and read it, others look at the numbers first. People digest information in different ways’ (Nolan interview, 2019).
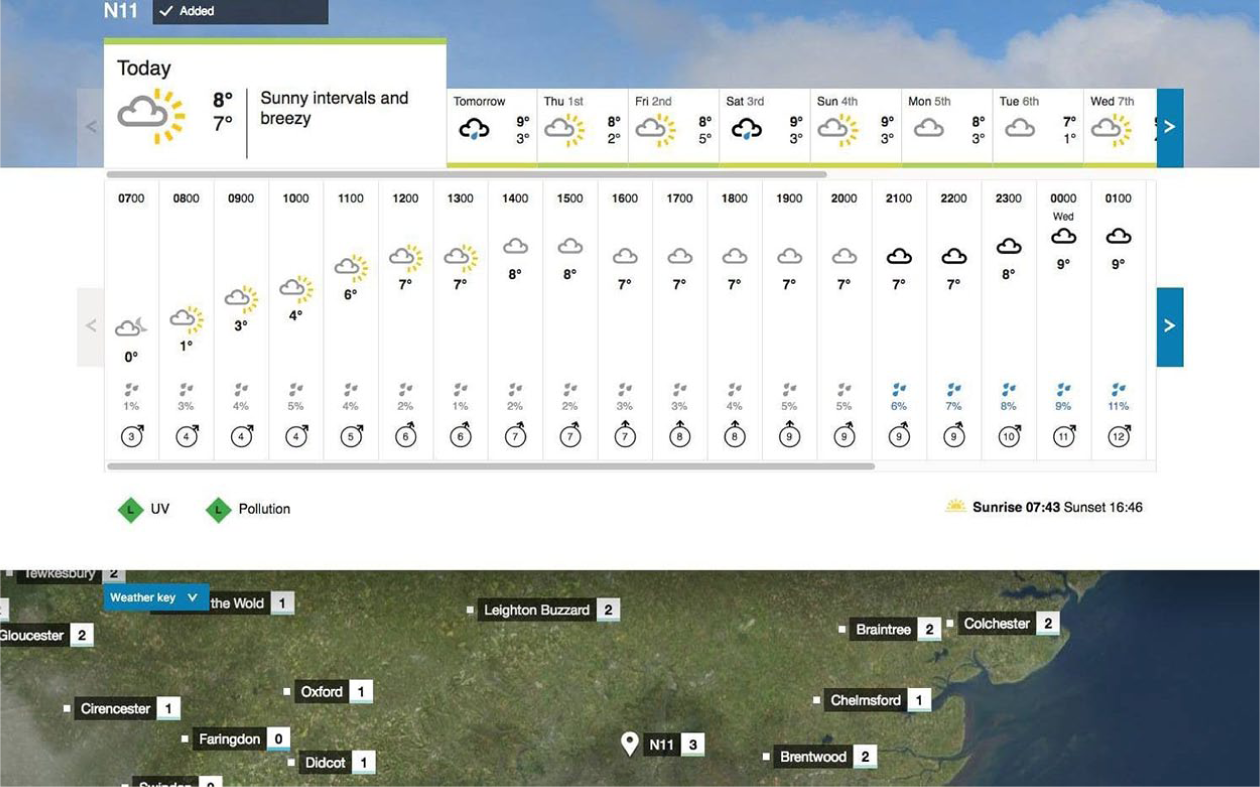
© BBC Weather. Outlook. Reproduced with permission.
Digital and interactivity
The design across different platforms was dependent on technical constraints and usability of design, but there was no divergence of top-level design identity. ‘Window on the Weather’ had opening frames in broadcast reports, beautiful images and an animating BBC Weather logo, it had had to change to integrate better with the mobile app. Digital Designer, Edwina Nolan, found her previous experience in art direction and theatre, using tricks of the eye with lighting effects, helped with a similar modular approach to designing the app layers.
Previously, the mobile phone app was more graphically stylized rather than realistic, and tastes had moved on. There were weather conditions in the corner of the screen, ‘a hint, not necessarily on everything. Now it’s on everything: rain drops and snow across all layers. Thunderstorms and thundery showers are the same for day and night because they are not as frequent’ (Nolan interview, 2019). The graphics on the app are built in a modular way, layered up like those on broadcast weather forecasts:
Ambient background skies and clouds combined
Atmospheric layer, e.g. animated rain
Window pane
App information
The ‘ambiances’ are localized images in the background layer. They were an existing design feature on the app, but the team wanted to update them as they felt dated and needed to integrate better into the concept of ‘Window on the Weather’. Forty-four different ambiences were created, some images were recycled: for example, sleet is a combination of a little snow between falling rain. But new imagery needed to be sourced. Stock imagery was considered, including photographs from weather-watchers and the general public that Broadcast continued to use, but for the mobile app these images were not necessarily on brief and there was now a technical requirement for 600dpi (not 72dpi) for high resolution screens that necessitated commissioning a professional photographer.
It would be easier to avoid ambiances and motion, but the design demands it. Not everything has to be delightful, but it gives a good understanding. We limited motion to the opening, otherwise it would be nauseating. Not having little quirky things is a nice constraint, it disciplines the design approach. But what affect will it have on the user? It is almost crippling, as you don’t know what experience comes into play. (Nolan interview, 2019)
Visual communication and the weather
The BBC Weather website is a dynamic and constantly updated platform, not only providing current live data, but also under continuous testing of functionality for the developers and production team. Every quarter there is a review of the design, and this is informed by the tools used by developers to report the user data on what as many as 7 million people are looking at and to help the Design Team to understand what weather information to show at what time and in what bite-sized amounts. The Design Process becomes an ‘intersection between making and using’ as an unfolding, dynamic ‘fluid assemblage’, where designer and user are ‘closer to a more symmetric set-up: we are quickly becoming as much part of the doings of things as they are a part of ours’ (Redström and Wiltse, 2018: 7).
An example is when the map has been given extensions that allow the user to turn on and off layers of graphical information: for example, displaying areas of frost or rain. ‘A key part of the Digital offering was to put the power into the hands of the user’ (Hunt interview, 2018). Viewers can zoom into the maps to reveal more information from cloud and rain satellite imagery, but also more topographic detail, such as key roads and urban areas. This mediated complexity goes some way to address the ‘scarcity of “screen real-estate”’ (Janlert and Stolterman, 2017a: 9) and overcome an ‘interface bottleneck’ that comes from an availability of big data on a finite screen size.
Weather means different things to different people. As discussed earlier, the transcorporeality of weathering and bringing a personal ‘worlding with’ could have positive benefits to awakening society to the effects of climate change (Neimanis and Walker, 2014), not just meeting users’ immediate needs. ‘We are connected to our weather environment, if it is windy and you have angina you will not want to go out, it is so personal’ (Nolan interview, 2019). The task of the Designers was to understand how weather affects a diverse audience across the UK. Whether it was a simple action of opening the app to know what to wear in the morning, or the tide times for beach walks or access, or looking at weather in holiday destinations, ‘it’s part of connecting, particularly a British and Irish thing in a country where weather is unpredictable . . . It is strange to have that much influence on people’s lives, helping them make daily decisions’ (Nolan interview, 2019).
The designers worked in close collaboration with the developers, those who write the code and build the system of delivery. Creative ideas were freely aired and explored, there was a shared desire to work to the same aim, they were ‘lucky, because Weather developers go beyond to achieve what designers are trying to do, unlike in some other companies where developers dictate’ (Nolan interview, 2019). This is important at the outset as a lot of work has to be done up front to get budget approval. Low-fidelity prototypes allow ideas to fail faster and smarter (Stickdorn and Schneider, 2010). ‘Better to come up with pencil scamps, research to get feedback then to go to finished designs, developers can say if you’ve gone too far. Then followed up by wireframes when Process is signed off and green lit’ (Nolan interview, 2019).
In 2019, the BBC Weather developers are now an all-female team in a skills sector that has been predominantly male (Forbes, 2012). The Weather Design team has an equal male/female gender balance and Nolan attributes this to the ‘BBC Graduate Scheme that has helped make a difference by supporting smart and grounded young women in the workforce . . . UX as a profession requires a lot of empathy, which could be considered a feminine trait’ (Nolan interview, 2019). Elizabeth Churchill, Director of User Experience at Google, argues that this gendered trope is gradually being eroded as enlightened leaders in the UX industry recognize that empathy is genderless (Teixeira, 2018).
The Design and UX teams are small with a flat management structure and so are agile and able to make quick decisions, a characteristic of companies that need to cope with a constantly evolving digital landscape (Ghezzi and Cavallo, 2018; Sjödin et al., 2020). It is also a team with diverse experience and background. ‘Life experience has helped to give me strength to stand back and look at it dispassionately. For day-to-day decisions, a research maturity enables a designer to understand users without having to check and test every step’ (Nolan interview, 2019). Nolan expresses a reflexive design approach that has insight into her own ability and recognizes the value of the various skills that her colleagues can employ within the Design Process: a‘thoughtful designer’ (Löwgren and Stolterman, 2004: 171).
‘It feels intimate strangely, to be in their homes and pockets. I take it seriously: accessibility needs, language diversity, negotiating and prioritizing visuals while allowing for business and commercial needs’ (Nolan interview, 2019). Design research has only recently begun to investigate digital objects for their potential for playing new roles in people’s lives when they are ‘networked, dynamic, and contextually configured’ (Redström and Wiltse, 2018: 2).
Digital Design Age
‘New technological developments require new ways of making sense of them’ (Redström and Wiltse, 2019: 373). Mobile phone applications are the manifestation of postindustrial systems, and amongst the public and general user ‘it should be somewhat disturbing to realise how little is known about such designing’ (Tonkinwise, 2016: 598). ‘There are compelling reasons not to take things for granted’ (Redström and Wiltse, 2018: 17). New conceptual tools are required ‘to improve designers’ ability to meet the challenge . . . to understand the technological development, new interactive modes and styles, to imagine future interactive artifacts, systems, and environments’ (Janlert and Stolterman, 2017b: 133).
The concept of ‘fluid assemblages’ proposed by Redström and Wiltse (2019: 374) is ‘the development of a design philosophy that can form and inform contemporary design practice in the domain of digital, networked, and as a result hugely complex systems, media, and artefacts’. The BBC Weather app, like the weather, never remains static for long; as is common for mobile applications, it exists in a ‘beta’ state, monitored through user data analytics as a living laboratory, and updated frequently in response to that feedback and changing environment. As a fluid assemblage, it is a fitting example of ‘transforming the relations between production and consumption, between design and use’ (Redström and Wiltse, 2018: 17).
There is an acceptance that they are never finished, always working towards perfection, in a sense a ‘wicked problem’ (Lindberg et al., 2010; Rittel, 1972), yet being able to meet a deadline for launch on budget to a brief that represents a milestone on that road, rather than a destination. The change from things to fluid assemblages is a fundamental challenge to the way we understand what things are. The modernist maxim derived from the Bauhaus that ‘form follows function’ has been disrupted as a myth by postindustrialist designing: digital devices and their interfaces by their multi-app nature defiantly display ‘that there is no true form to be attained through design’ (Tonkinwise, 2016: 615).
We expect our things to work, ‘we have a predilection for the ideal rather than the quotidianly materialistic’ (p. 601). We quickly assimilate what is useful into our daily lives and take them for granted until they break or are removed. ‘We focus on our objectives with the understanding that objects will be reliably there for us in the background’ (p. 602) or in the BBC Weather app, in our pocket. A Window on the Weather is a further mediated experience of ‘worlding with’ weather (Neimanis and Walker, 2014), it cannot reflect or generate the embodied transcorporeal, non-visual experience of the individual, despite increased access to more rapidly updated weather data. While the weather may be fickle, it is central to the ethos of the BBC Weather service across all media that it is ‘accurate, authoritative, and reliable’ (BBC, 2005). It is the designer’s expertise to understand that real usefulness is able to be configured in scriptable code and how to present that in an increasingly competitive market for our attention (Janlert and Stolterman, 2017b). But this can only come about with continuous study by design anthropologists of human–computer interactions to work through the artifacts and functions that fail or are used in unpredictable and even creative ways (Drazin, 2012).
This study revealed that the participants had reflected on their practice during the design project (Löwgren and Stolterman, 2004; Schön, 1992). Design is a dialogue (Schön, 1992), and it is also optimization (Tripp, 1991). ‘Optimised design places complete understanding prior to a solution attempt in order to find the best description of the problem . . . Dialogical design usually embeds uncertainty, uniqueness and conflict’ (Li, 2002: 210). Banathy (1996) argues that systems thinking accepts complexity and looks at the interactions between system and environment, ‘we should shift from anticipating, predicting and controlling the human world to understanding the uncertainty and complexity of the environment’ (Li, 2002: 213).
Conclusion
As traditional broadcasters have expanded onto digital platforms, they have had to reassess their branding strategies and service delivery in a more holistic way. BBC Weather is an example of how discrete uni-media Design Teams are working collaboratively in new multidisciplinary teams. The ambitious scale of the Weather project across digital, mobile and broadcast platforms necessitated the collaboration of two different cultures of practice: Broadcast Design and Digital Design. Through reflexive workshops that have come from Design Thinking principles, the team of disparate approaches became a functioning unit, learning from each other and developing a common language of practice.
The branding dominance of Broadcast Design (Grainge, 2011) has shifted to one where Digital Designers have at least an equal role. It appears that the relatively new concept of Service and UX Design has brought new life into the more established design practices of Broadcast Design, bringing new research methodologies such as Design Anthropology into play to understand and respond to user needs and behaviours. It is the necessary response to the interactive nature of digital services over the passive consumption of broadcasting.
The gathered user-data of human–computer interactions is part of the constant feedback loop that maintains the ongoing development and reconstruction of the digital service. The fluidity and dynamic nature of the platform is as apt as its subject matter. The pocket presenter that interprets the day’s weather for over 7 million users is an authoritative and assimilated necessity of modern life. Perversely, its reliability is as guaranteed as the UK weather’s unreliability. It provides an intimate relationship with the weather anywhere in the world, without having to leave the comfort of indoors or travelling to another destination.
In the competitive market of weather forecasting for a public audience, having an established presence on all media, access to the most accurate weather data and a world-renowned and trusted brand such as the BBC, brings a huge advantage. It also comes with an inherently political dimension as a publicly funded body that is bound to a commitment to inclusion, and as an authoritative communication service across all sectors of UK society and geography. As such, it has to behave differently to many of its commercial and global competitors. Nevertheless, it is clear in this study that the Design Teams are highly motivated by public service and the values of public broadcasting that define the BBC.
Footnotes
Funding
The author received no financial support for the research, authorship and publication of this article, and there is no conflict of interest.
Biographical Note
IAIN MACDONALD is one of the growing number of practice-based research academics working in the developing field of motion graphics and broadcast visual communication. He has over 25 years of creative industry experience as an award-winning television graphic designer at BBC Television, and as a film and commercials director at The Moving Picture Company. He is Associate Professor and Head of Design Innovation at Maynooth University, Ireland.
Address: Maynooth University, North Campus, Maynooth, Kildare W23 F2H6, Ireland. [email: