
Abstract
The aim of this study is to introduce a Consumer-Based Brand Performance Model (CBBPM) to measure brand success. The CBBPM consists of four critical constructs—brand equity, brand trust, brand satisfaction, and brand loyalty—and is applied across different product categories and brands. In total, 881 consumers participated in the survey, and a structural equation modeling approach was employed to test the research hypotheses. The findings of the study suggest that the CBBPM is valid and reliable. Brand equity is positively associated with brand satisfaction, brand trust, and brand loyalty. The positive effects of brand trust and brand satisfaction on brand loyalty are supported. The study suggests that the CBBPM should be used as a strategic brand management tool to track brand performance and to compare them with competing brands.
Introduction
Business performance is the actual work or output produced by a specific unit or entity in an organization. The term “measurable performance” refers to the ability and processes used to quantify and control specific activities and events (Morgan, 2004). Business performance measurement is one of the most important topics in the field of management because performance measurement systems are useful for assessing a firm’s ability to exploit its resources and achieve the targets set for it by its owners, investors, and customers. Performance measurement tools enable managers to set and monitor targets and achieve the desired performance levels (Simons, 2000). As stated by De Chernatony, Harris, and Christodoulides (2004) “business performance is strongly dependent on brand performance” (p. 28). Brand performance is a relative measure of brand success (Ehrenberg, Uncles, & Goodhardt, 2004). Moreover, brand performance measures enable brand managers to understand brand value and compare brand success across different markets (Chapman, 1993).
As marketing practitioners are under pressure to demonstrate how marketing expenditure creates shareholder value, previous studies have used various financial and market-oriented brand performance metrics (e.g., sales growth, market share, return on investment, price premiums; Doyle, 2000). There is therefore no single measure that captures the depth and breadth of brand performance (De Chernatony et al., 2004). The consumer-oriented brand performance models employ measures related to consumer attitude and consumer opinion, and the financially oriented approaches use tangible assets, past revenues, and future earnings, which usually suffer from a significant margin of error. When brand managers compare the performance of their own brands with the performance of their competitors’ brands, they have to estimate the competitors’ financial performance values, and therefore the estimation is not always reliable. Therefore, some researchers have advocated the greater convenience of consumer-based brand performance measures (e.g., Johansson, Dimofte, & Mazvancheryl, 2012; Rust, Ambler, Carpenter, Kumar, & Srivastava, 2004).
The aim of this study is twofold. First, it introduces a Consumer-Based Brand Performance Model (CBBPM) consisting of four distinct measures: (a) brand equity, (b) brand trust, (c) brand satisfaction, and (d) brand loyalty. This is important because previous research acknowledges the importance of consumer-based performance measures for assessing brand success and brand valuation, but there is no agreement on performance criteria and their relationship with brand loyalty. Second, it assesses the applicability of the CBBPM across Global Brands (GBs) and Private Labels (PLs) in the apparel and sportswear retail industries. Hence, the study contributes to the branding literature by advancing understanding of consumer-oriented performance measures.
First, the study introduces a review of the literature on brand performance measurement. This is followed by the research method and the study findings. The final section discusses the theoretical and managerial implications of the study.
Theoretical background
Brand performance measurements
The brand management field has flourished over the last decades and today appears rich in related measurement scales (Zarantonello & Pauwels-Delassus, 2016). Particularly, marketing academics have developed a wide range of brand performance measures. For example, Romero and Yagüe (2015) highlight the interaction between brand equity and consumer-based brand equity (CBBE) to assess the overall productivity of marketing. Ehrenberg et al. (2004) introduce three brand performance indicators: (a) measures related to brand size (market share and market penetration), (b) measures related to loyalty (e.g., purchasing per buyer, percentage buying, and percentage category purchases), and (c) measures related to switching behavior. De Chernatony et al. (2004) recommend three brand performance indicators in the financial services industry: (a) brand loyalty, (b) consumer satisfaction, and (c) brand reputation. Oliveira-Castro et al. (2008) suggest that the effect of brand marketing should be assessed by mixed methods using financial and consumer-oriented measures. These two types of measures are interrelated because consumer-oriented measures (e.g., CBBE) are positively associated with financial performance measures (e.g., brand market share and revenue). Lee, Park, Baek, and Lee (2008) support two types of brand performance measures: (a) financial performance measures (e.g., sales growth, margin, market share, and return on investment) and (b) customer-based performance measures (e.g., customer acquisition, customer maintenance, customer satisfaction, and brand awareness). Dawes (2009) suggests three consumer-based brand performance metrics: (a) brand loyalty, (b) brand switching, and (c) brand share. Huang and Sarigöllü (2014) recommend two types of brand performance measures: (a) customer-oriented measures (brand knowledge) and (b) product market performance measures (revenue premium). Luxton, Reid, and Mavondo (2015) show that brand marketing communication indirectly influences the brand’s market-based performance and financial performance. The market performance measure includes five variables—quality, price premium, channel support, brand loyalty, and market penetration—and the brand financial performance measure includes average annual growth rate including sales value, market share, gross margin, return on investment, and return on assets. Coleman, De Chernatony, and Christodoulides (2015) suggest that service brand performance should be assessed by three internal and external measures: (a) customers (loyalty, relative satisfaction, awareness, and reputation), (b) finance (revenue-based market share and net profit), and (c) employees (employee satisfaction and employee loyalty).
In addition to the brand performance measures introduced by academics, commercial research organizations have developed brand performance and brand valuation models based on financial metrics and market-oriented and/or consumer-oriented measures. For example, Forbes employs financial performance measures such as revenue and return on investment (Badenhausen, 2017). Others, such as Interbrand, BrandZ, Global Top 100 Brand Corporations and Brand Finance Global 500, utilize financial metrics as well as expert panels, consumer surveys, comparative market analyses, and marketing budgets (e.g., EquiTrend, BrandAsset Valuator, Global Brand Simplicity Index and FutureBrand). Brand performance models using consumer-oriented measures employ a wide range of variables such as brand equity, brand loyalty, brand purpose, brand experience, brand strength, and brand simplicity (see Appendix 1).
Among the different approaches that can be used to measure brand performance, some researchers highlight the effectiveness of consumer-based brand measures, especially when comparing a brand with its competitors, because it may be more accurate to get the consumers’ opinion about a brand than to obtain the financial data associated with that brand. For example, Johansson et al. (2012) show that CBBE performed better than financially based brand performance measures in assessing the performance of GBs in the 2008 financial crisis. Financial metrics have proved to be inadequate for understanding marketing productivity, leading to the development and increasing use of nonfinancial metrics (Rust et al., 2004). Moreover, several authors have found that consumer-based brand performance measures (e.g., brand equity and brand loyalty) are associated with financial performance (e.g., Chaudhuri & Holbrook, 2001; Tsai, Cheung, & Lo, 2010). In addition, the use of surveys for current and potential customers allows companies to make comparative brand performance assessments between their own and their competitors’ brands to identify the strengths and weaknesses of their brands and inform their brand positioning strategies (Chapman, 1993; De Chernatony et al., 2004).
Therefore, academic studies (e.g., Christodoulides & De Chernatony, 2010; Çifci et al., 2016; Dawes, 2009; De Chernatony et al., 2004) and commercial research organizations (e.g., BrandAsset Valuator, EquiTrend, the FutureBrand, and the Global Brand Simplicity Index) advocate consumer-based brand performance measures. Brand loyalty, brand equity, brand satisfaction, and brand trust are the main drivers for consumer-based brand performance. Brand loyalty is the key construct because it is positively associated with the firm’s financial performance measures (Coleman et al., 2015; Lee et al., 2008; Luxton et al., 2015) of market share, relative price (Chaudhuri & Holbrook, 2001), sustainability of demand, and future profits (Interbrand, 2016). Previous research suggests that brand loyalty is strongly influenced by brand equity, brand trust, and brand satisfaction (Chaudhuri & Holbrook, 2001; Çifci et al., 2016; Gecti & Zengin, 2013; Lam & Shankar, 2014; Nam, Ekinci, & Whyatt, 2011). Accordingly, this study proposes that the CBBPM should include four key measures: (a) CBBE, (b) brand trust, (c) brand satisfaction, and (d) brand loyalty.
GBs and PLs
GBs are brands “that have widespread regional/global awareness, availability, acceptance, and demand and are often found under the same name with consistent positioning, personality, look, and feel in major markets enabled by centrally coordinated marketing strategies and programs” (Özsomer & Altaras, 2008, p. 1). Essentially, GBs are a manufacturer’s own brands distributed through its own outlets (e.g., Adidas retail stores) or other retail outlets (e.g., Foot Locker). In the apparel and sportswear market, there are many GBs in operation, such as Zara, Ralph Lauren, Chanel, Burberry, Abercrombie & Fitch, Levi’s, Lacoste, Nike, and Adidas. As GBs are an essential part of the apparel and sportswear business assets, high performing brands contribute to corporate business success and brand valuation (Aaker, 1991; Lee et al., 2008). For example, Zara, which belongs to Indidex, a Spanish multinational clothing company, was listed as one of the best GBs in 2017, with an 11% increase in brand valuation to US$18,573m (Interbrand, 2017).
Along with GBs, PLs have been developed rapidly in the apparel and sportswear retail sectors in recent years (d’Astous & Saint-Louis, 2005; Herstein, Gilboa, & Gamliel, 2013; Izquierdo-Yusta, Labajo, Jiménez-Zarco, & Martínez-Ruiz, 2016; Molinillo, Ekinci, Whyatt, Occhiocupo, & Stone, 2016). PLs are a retailer’s own brands and allow the retailer to differentiate its offerings from those of competing brands and retailers (Molinillo et al., 2016). Many retail chains, such as Walmart (with labels such as George, NOBO, Simply Basic, Faded Glory), Carrefour (Tex), Decathlon (Quechua, Domyos, Kalenji), El Corte Inglés (Emidio Tucci, Green Coast, Easy Wear), Macy’s (Charter Club, Club Room, Giani Bernini), and Tesco (F&F), sell their PLs in their own retail stores.
According to Izquierdo-Yusta et al. (2016), the performance of GBs has suffered increasingly due to competition from PLs, due to the growing internationalization of retailers, upstream vertical integration, and the increasing number of retail chains. Retailers create fashion PLs to control their supply chain, increase their brand portfolio, and improve their brand image (Khan, Christopher, & Creazza, 2012; McColl & Moore, 2011). Consumers choose global fashion brands to express their self-image or social identity. Also, consumers feel that purchasing GBs creates a lower social risk (i.e., acceptance by peer groups) than purchasing PLs (Liljander et al., 2009). Therefore, retailers try to convince consumers that premium PLs offer better quality products than traditional PLs and have a similar quality to GBs (d’Astous & Saint-Louis, 2005; Herstein et al., 2013). For example, Decathlon highlights its product innovation, Walmart includes organically manufactured clothing in its portfolio, and Macy’s states that its goal is to deliver exceptional value. Although there are not yet any empirical studies to explain why consumers choose PLs over GBs, PLs are used to differentiate retail stores and improve store loyalty (Corstjens & Lal, 2000; McColl & Moore, 2011).
Despite the growing market share of PLs, research on their performance is limited. Moreover, González-Benito, Martos-Partal, and Fustinoni-Venturini (2015) state that the magnitude of the performance factors is likely to differ between GBs and PLs. However, to the best of our knowledge, there is no study comparing the performance of GBs and PLs from the consumers’ point of view in the apparel and sportswear retail sectors.
Development of hypotheses
CBBE receives significant attention from researchers and marketing managers because brand equity is positively associated with company equity and brand success. Christodoulides and De Chernatony (2010) refer to CBBE as “a set of perceptions, attitudes, knowledge, and behaviours on the part of consumers that results in increased utility and allows a brand to earn greater volume or greater margins than it could without the brand name” (p. 48). In this study, we treat overall CBBE as a value-oriented, image-based entity that includes key variables such as perceived quality, brand personality, brand awareness, brand identification, self-congruence, and lifestyle-congruence (Çifci et al., 2016). Bloemer and Kasper (1995) define brand satisfaction as “the outcome of the subjective evaluation that the chosen brand meets or exceeds the expectations” (p. 314). Brand trust is defined as the willingness of the average customer to rely on the brand’s ability to perform its function (Chaudhuri & Holbrook, 2001).
Oliver (1999) defines brand loyalty as a “deeply held commitment to rebuy or re-patronize a preferred product/service consistently in the future, thereby causing repetitive same-brand or same brand-set purchasing, despite situational influences and marketing efforts having the potential to cause switching behaviour” (p. 34). In this research, we treat brand loyalty as an attitudinal construct that captures the consumers’ intention to purchase or recommend behavior.
As can be seen from Figure 1, the CBBPM proposes that overall brand equity is positively associated with brand satisfaction (H1), brand trust (H2), and brand loyalty (H3). The relationship between brand equity and brand loyalty is indirect. Hence, brand trust and brand satisfaction mediate the effect of brand equity on brand loyalty. Furthermore, brand satisfaction (H4) and brand trust (H5) are positively related to brand loyalty. Figure 1 shows the CBBPM and the relationships between the four constructs.
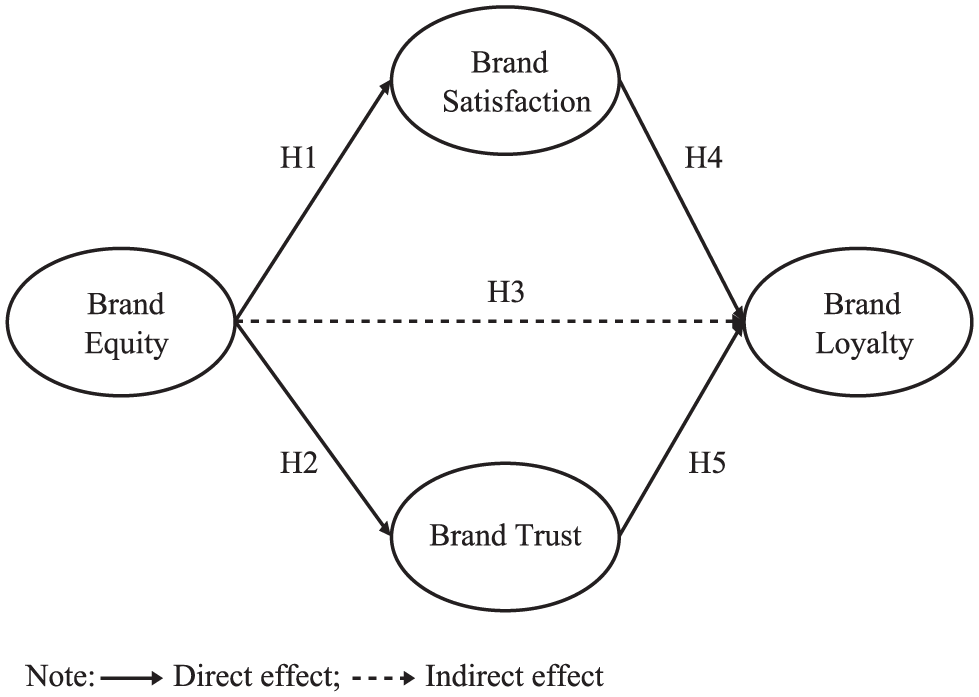
The consumer-based brand performance model (CBBPM).
CBBE is essential for assessing brand performance and gaining competitive advantage in the marketplace (Lassar, Mittal, & Sharma, 1995). Building from Aaker’s (1991) and Keller’s (1993) models of brand equity, Nam et al. (2011) argue that brand loyalty is one of the components of brand equity, but that it is also an outcome of other brand equity concepts. Brand equity is a conceptually broader concept and encompasses perceived quality, brand personality, brand awareness, brand identification, self-congruence, and lifestyle-congruence, while brand loyalty is formed of behavioral intentions (e.g., intention to repurchase, intention to recommend). This position is consistent with that of Keller (1998), who argues that stronger brand loyalty is one of the characteristics of a brand possessing strong brand equity. Furthermore, several researchers acknowledge a positive relationship between brand equity and brand loyalty (Molinillo, Ekinci, & Japutra, 2015).
Previous studies suggest that brand equity has a positive influence on brand satisfaction and brand trust. Consumers’ satisfaction with a brand is dependent on functional benefits (e.g., perceived quality, service employee competence) and symbolic benefits (e.g., brand identification, self-congruence; Nam et al., 2011). Brand equity reflects the overall benefits that the consumer associates with the brand, and it has positive effects on consumers’ satisfaction with the brand experience (Ekinci, Dawes, & Massey, 2008; Nam et al., 2011).
Brand trust represents consumers’ feeling of security and emotional connection with a brand (Delgado-Ballester & Luis Munuera-Alemán, 2001). Previous research indicates that brand equity directly influences brand trust. For example, Kim (2014) finds that service quality is positively related to brand trust. Han, Nguyen, and Lee (2015) show that brand affect, brand awareness, and self-congruence are antecedents to brand trust. Phan and Ghantous (2013) show that brand trust strongly mediates the impact of brand association on loyalty in the banking industry. Hence, we propose as follows:
H1. Brand equity has a positive relationship with brand satisfaction.
H2. Brand equity has a positive relationship with brand trust.
H3. Brand equity has a positive relationship with brand loyalty.
Brand loyalty is positively affected by brand satisfaction (Nam et al., 2011). Overall, there is a positive relationship between customer satisfaction and loyalty intentions (Kumar, Pozza, & Ganesh, 2013). Satisfied consumers generally want to continue using the same brand in the future. Previous studies support the existence of a positive relationship between brand satisfaction and brand loyalty in service industries. Nam et al. (2011) show the positive effects of consumer satisfaction on brand loyalty in the hotel and restaurant industry. Miquel-Romero, Caplliure-Giner, and Adame-Sánchez (2014) find that PL satisfaction has a direct, positive impact on PL loyalty in convenience goods. Çifci et al. (2016) demonstrate the positive effect of brand satisfaction on brand loyalty in the fashion retail industry in Turkey and Spain. Further empirical evidence for the positive relationship between brand satisfaction and brand loyalty can be found in Ekinci et al. (2008) and Kuikka and Laukkanen (2012), among others.
However, brand satisfaction is not enough to explain loyalty (Kumar et al., 2013; Oliver, 1999). Brand trust is another important antecedent of brand loyalty (Chaudhuri & Holbrook, 2001; Lam & Shankar, 2014). A customer trusts a brand when the brand meets the customer’s expectations. The continuing fulfillment of promises is one of the most important motivations in developing a long-term relationship with a brand (Delgado-Ballester & Luis Munuera-Alemán, 2001). Scholars have empirically demonstrated the positive influences of brand trust on brand loyalty. For example, Lam and Shankar (2014) show that consumers’ brand loyalty for smartphones strongly depends on brand trust. Kuikka and Laukkanen (2012) find that brand trust is a significant factor for brand attitudinal loyalty within the chocolate market. Gecti and Zengin (2013) demonstrate that brand trust is positively related to both attitudinal loyalty and behavioral loyalty to sports shoes. The positive influence of brand trust on brand loyalty has also been found to be significant in a business-to-business context (Alwi, Nguyen, Melewar, Loh, & Liu, 2016). Accordingly, the model proposes two research hypotheses with regards to the relationships between brand loyalty, brand satisfaction, and brand trust:
H4. Brand satisfaction has a positive relationship with brand loyalty.
H5. Brand trust has a positive relationship with brand loyalty.
Method
Two surveys were conducted in Spain, where a Spanish marketing research company helped collect the data. In total, 435 respondents participated in the GBs survey and 446 respondents participated in the PLs survey. At the beginning, respondents were asked to think about brands in either the fashion or the sportswear category. Afterwards, in each survey, the respondents were given a list of 30 different fashion/sportswear GBs and PLs. These brands were chosen taking into account international brand rankings such as Interbrand Best Global Brand, Interbrand Best Retail Brand, L2 Digital IQ Index of Fashion, and L2 Digital IQ Index of Sportswear (L2, 2016), as well as the presence of the brands in the Spanish market. The respondents were asked to choose from the list a brand with which they were familiar. The brand performance measures were adapted from previous studies. Details of the indicators and factor loadings can be seen in Appendix 2.
For the GBs survey, most of the respondents were females (56.8%) and under 45 years of age (55.2%). Their level of education was mostly an undergraduate degree (40.7%). For the PLs survey, most of the respondents were females (52.9%) and under 45 years of age (52.9%). Their level of education was mostly an undergraduate degree (38.2%).
Findings
Normality tests were conducted based on the skewness and kurtosis values of each item. The distribution of the data is normal since the skewness and kurtosis values were around the absolute values of −1 and +1 (Hair, Black, Babin, & Anderson, 2006). After checking for normality, the data were checked to discover whether or not common-method variance posed a threat. This was done using Harman’s single-factor test (Podsakoff, MacKenzie, Lee, & Podsakoff, 2003). Common-method variance poses a threat if a single unrotated factor solution appears from the exploratory factor analysis test or if one general factor accounts for the majority of the covariance among the measures. The GBs data revealed three factors with Eigen values greater than 1, accounting for 72.17% of the total variance, whereas the PLs data also revealed three factors with Eigen values greater than 1, accounting for 61.59% of the total variance. These results suggest that common-method variance does not pose a significant threat. Next, two measurement models were created. Table 1 displays the fit statistics of both measurement models.
Model fit statistics for the measurement models.
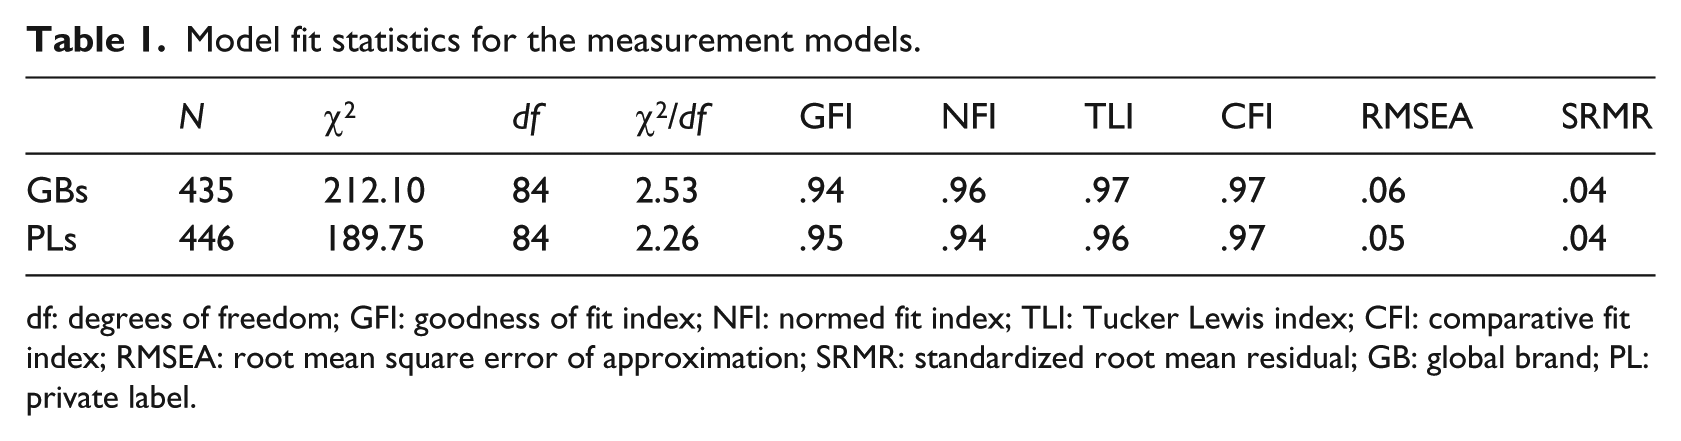
df: degrees of freedom; GFI: goodness of fit index; NFI: normed fit index; TLI: Tucker Lewis index; CFI: comparative fit index; RMSEA: root mean square error of approximation; SRMR: standardized root mean residual; GB: global brand; PL: private label.
Based on the results, both the measurement models produced a good fit. After confirming the model fit, the validity and reliability of the constructs were checked. Table 2 displays the Cronbach’s alpha (α) values, the average variance extracted (AVE) values, and the correlations.
Correlations, reliability, and validity of the measures.
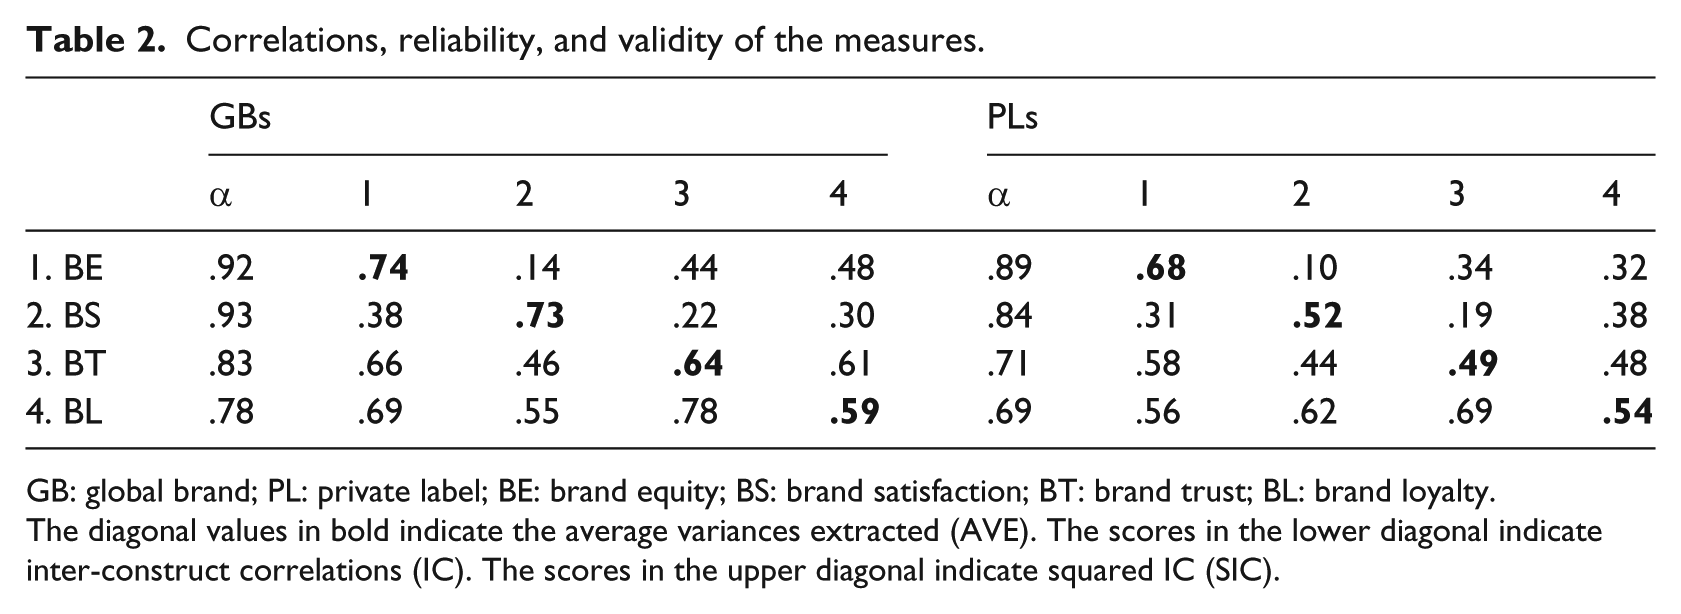
GB: global brand; PL: private label; BE: brand equity; BS: brand satisfaction; BT: brand trust; BL: brand loyalty.
The diagonal values in bold indicate the average variances extracted (AVE). The scores in the lower diagonal indicate inter-construct correlations (IC). The scores in the upper diagonal indicate squared IC (SIC).
As can be seen from Table 2, all of the constructs are reliable since the α values are above the .70 threshold (Malhotra, 2010). Following Fornell and Larcker (1981), from the AVE values, it can be concluded that these constructs achieve discriminant validity, since the AVE values are above the squared inter-correlations. To test the research hypotheses, two structural models were created. Table 3 displays the fit statistics of the structural models.
Model fit statistics of the structural models.
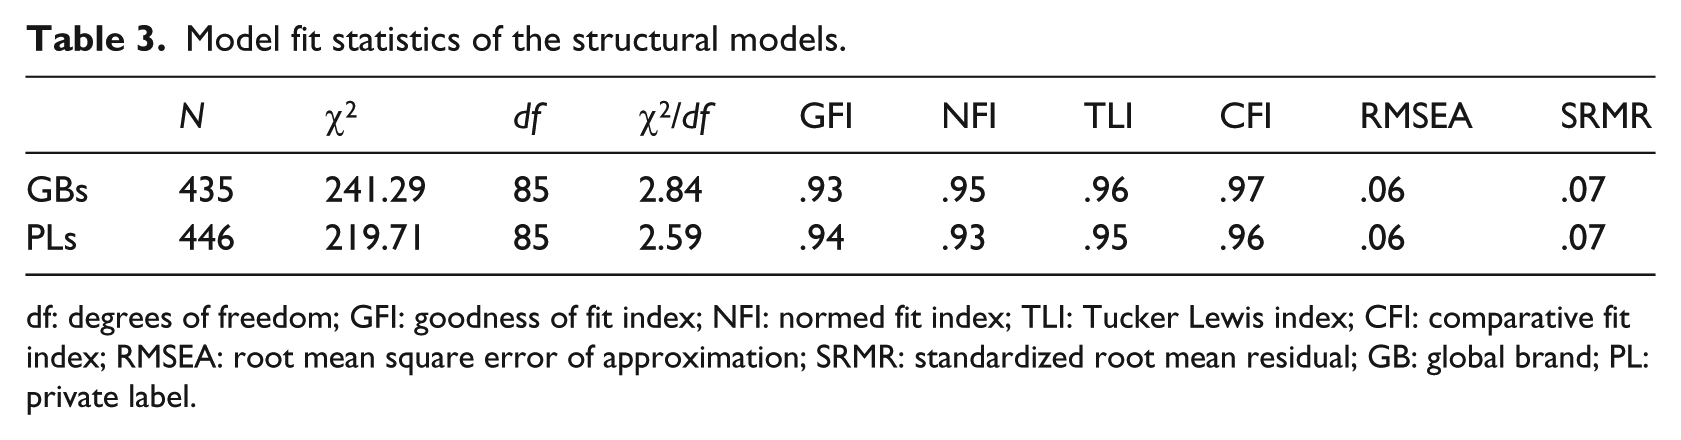
df: degrees of freedom; GFI: goodness of fit index; NFI: normed fit index; TLI: Tucker Lewis index; CFI: comparative fit index; RMSEA: root mean square error of approximation; SRMR: standardized root mean residual; GB: global brand; PL: private label.
The results of the fit statistics show that the two structural models produced a good fit. Afterwards, the research hypotheses were tested. In addition, the data were categorized into sportswear and apparel brands for both GBs and PLs. For GBs, the brands that were categorized as sportswear were: Adidas, Camper, Levi’s, New Balance, Nike, Puma, Quiksilver, Reebok, The North Face, Timberland, and Vans. For PLs, the brands that were categorized as sportswear were: Artengo, Boomerang, Domyos, Kalenji, Kipsta, Polinesia, Quechua, Tenth, Tribord, and Wed’ze. Table 4 displays the results of the testing of the hypotheses.
Result of structural equation analyses for the research model.
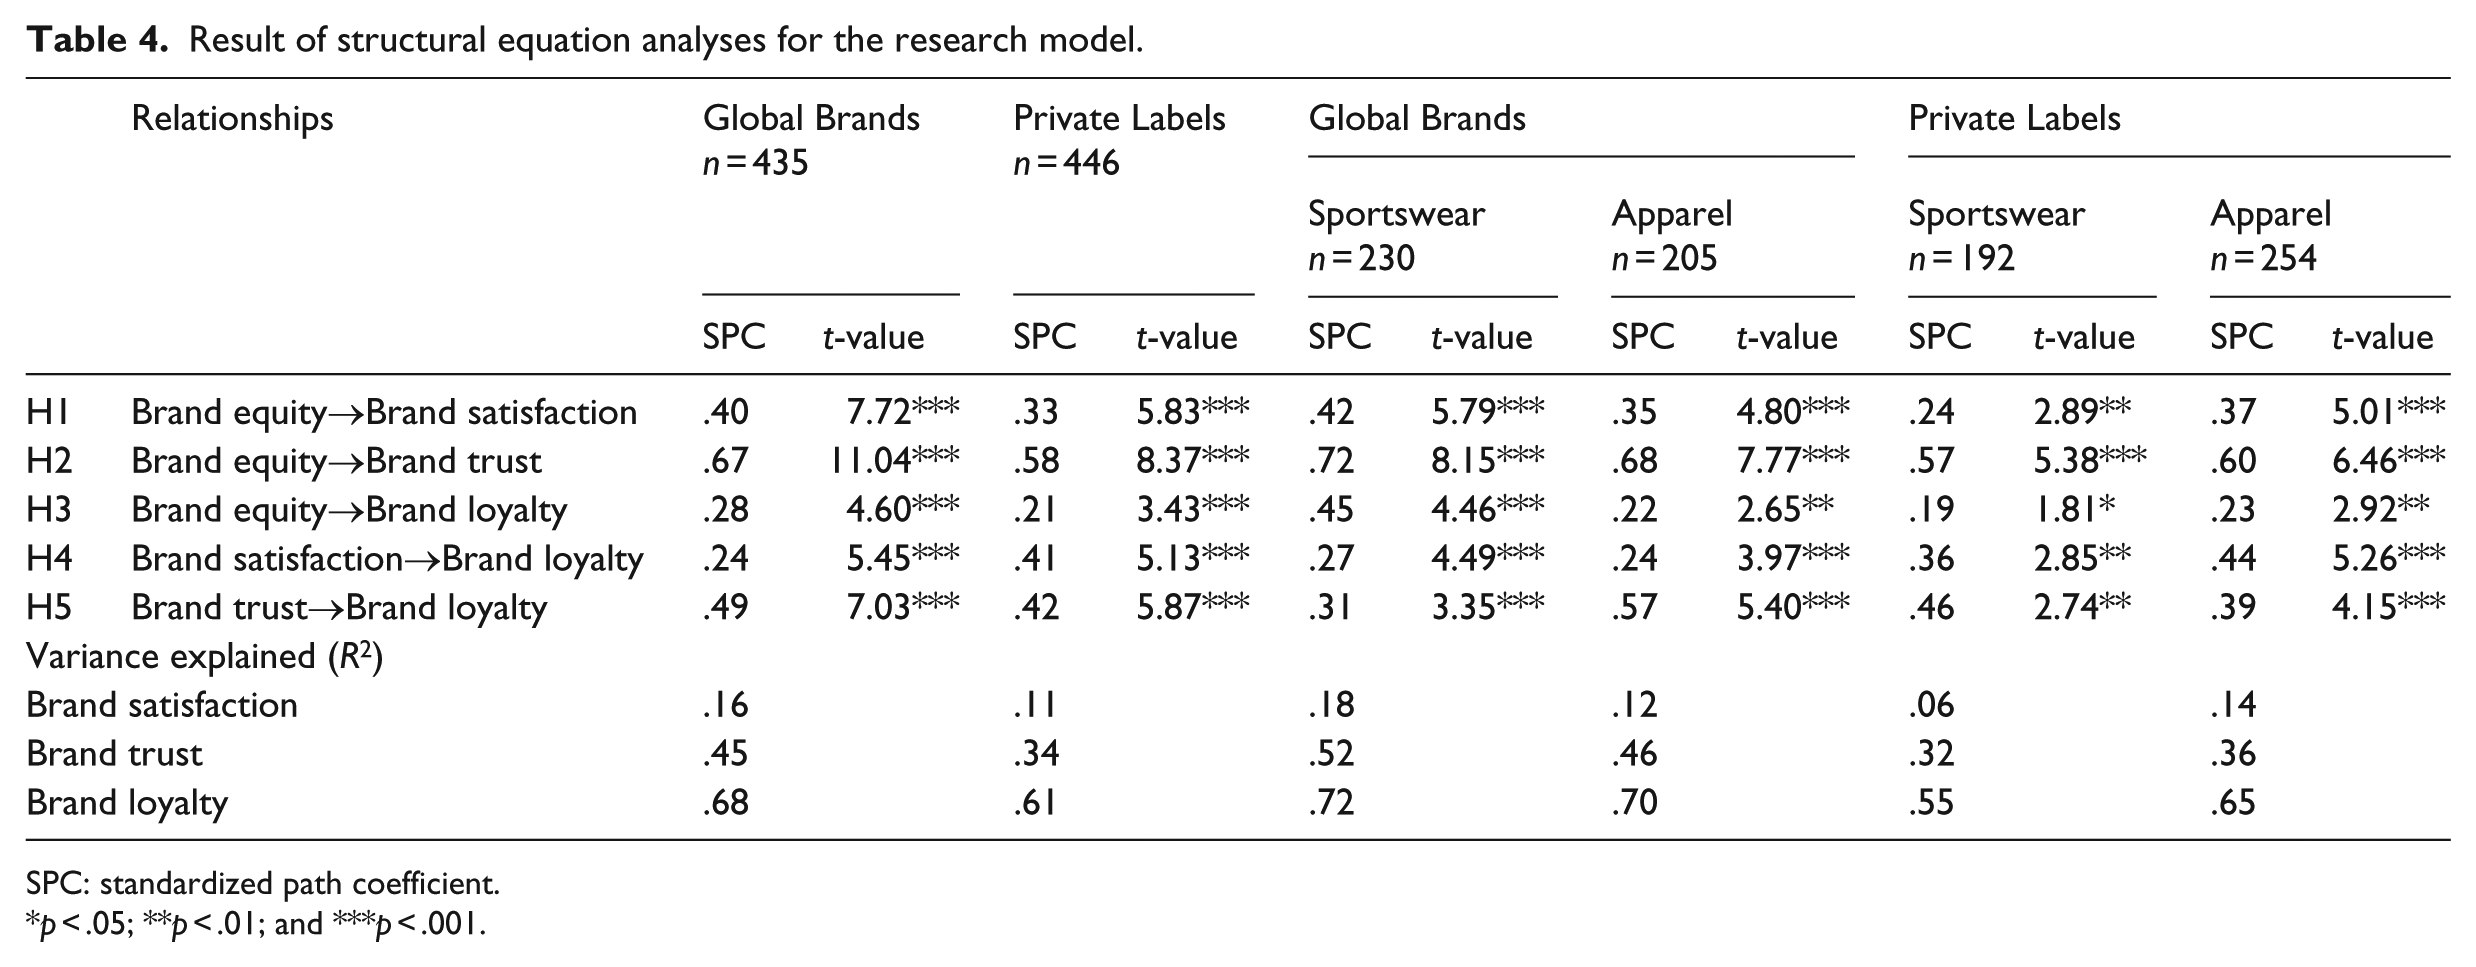
SPC: standardized path coefficient.
p < .05; **p < .01; and ***p < .001.
Based on the results from testing the hypotheses, all five of the research hypotheses were supported. Hence, CBBE has a positive influence on brand satisfaction (H1), brand trust (H2), and brand loyalty (H3). Brand satisfaction and brand trust positively influence brand loyalty (H4 and H5), as expected. However, it should be acknowledged that the Standardized Path Coefficients (SPCs) of the GBs data were greater than the SPCs of the PLs data, except for the link between brand satisfaction and brand loyalty, where the SPC was greater for the PLs data.
Next, the research hypotheses for GBs and PLs data were tested for each category (i.e., sportswear and apparel). For GBs, all the research hypotheses were supported. However, it should be acknowledged that the SPCs for the sportswear data were greater than the SPCs for the apparel data, except with respect to the link between brand trust and brand loyalty. For PLs, all the research hypotheses were supported. By contrast, for PLs, the SPCs for the apparel data were greater than the SPCs for the sportswear data, except with respect to the link between brand trust and brand loyalty.
To confirm whether there are significant differences between the constructs for GBs and PLs, an independent samples t-test was conducted. The scores of each of the constructs were summed. Table 5 displays the results of the independent samples t-test.
Mean scores of Global Brands and Private Labels.
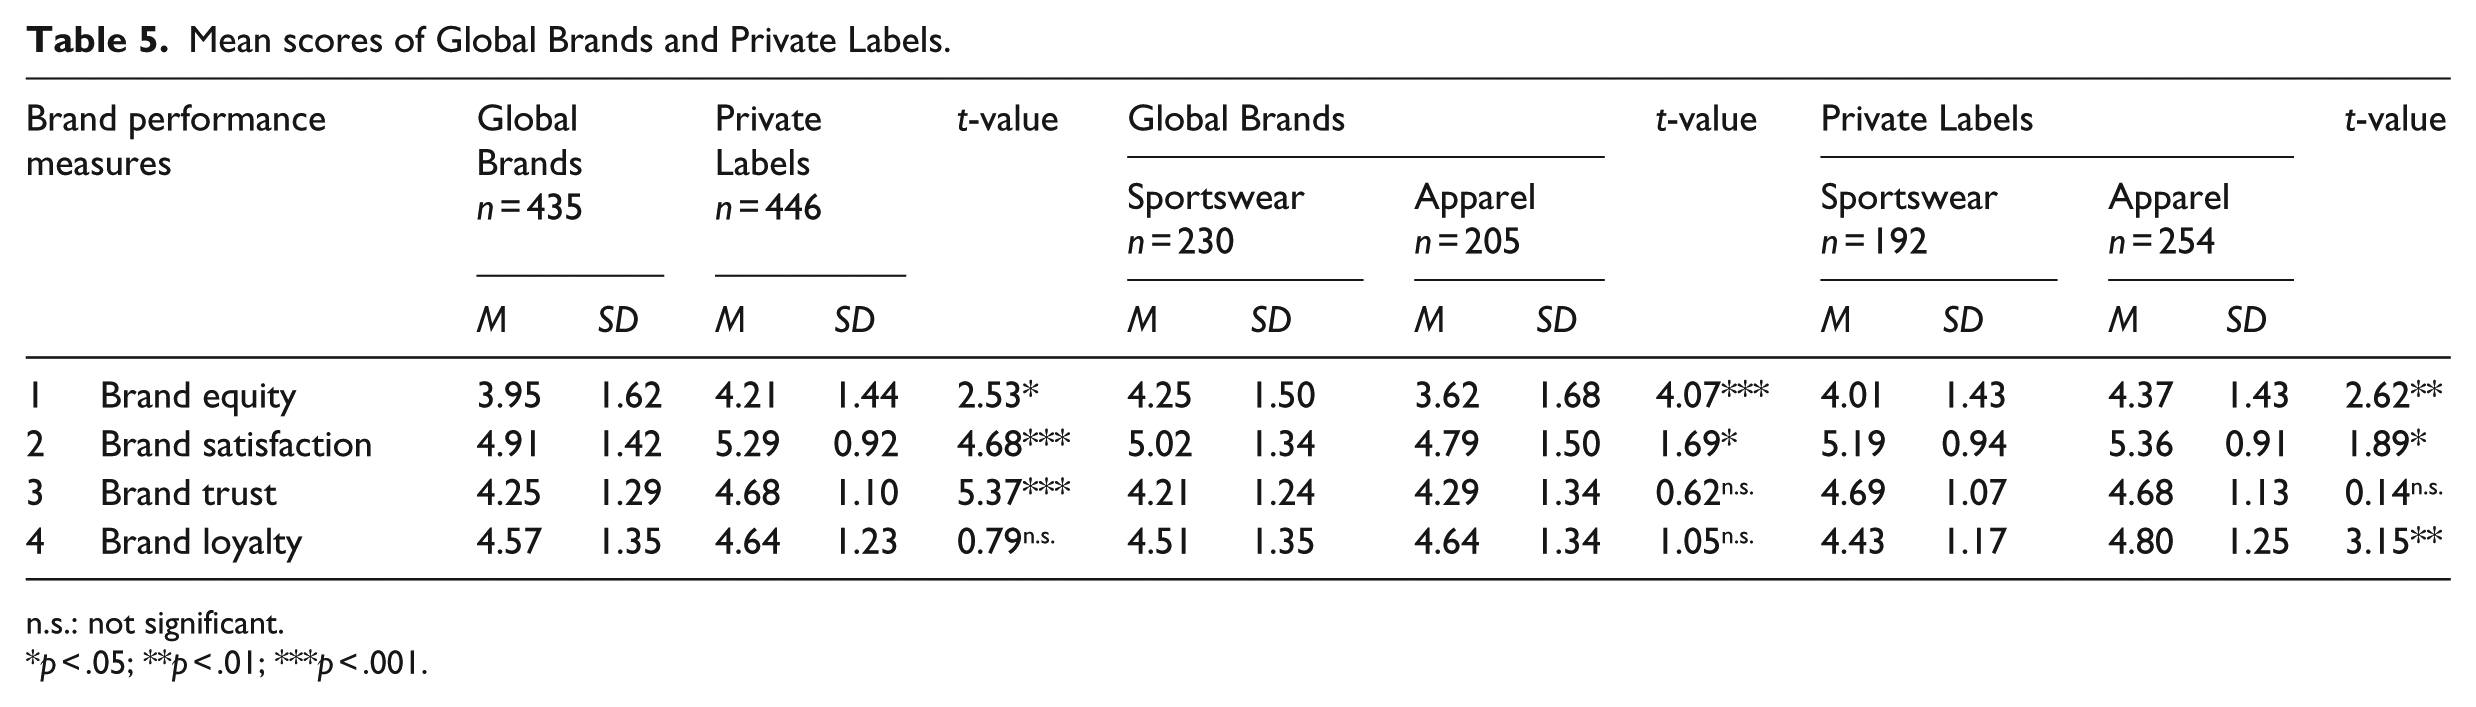
n.s.: not significant.
p < .05; **p < .01; ***p < .001.
Interestingly, the results show that PLs perform better than GBs on our brand performance model, particularly for brand equity, brand satisfaction, and brand trust. However, we did not find any differences in terms of consumers’ brand loyalty between GBs and PLs data.
The differences between sportswear and apparel were then analyzed for each of GBs and PLs data. For GBs, the sportswear category performs better than the apparel category in terms of brand equity and brand satisfaction. We did not find any differences between the two categories in terms of brand trust and brand loyalty. For PLs, the apparel category performs better than the sportswear category on each construct (brand equity, brand satisfaction, and brand loyalty), except brand trust. We did not find any differences between the two categories in terms of brand trust.
Conclusion
This study introduces a CBBPM to measure brand success. The results of the study show that brand equity, brand satisfaction, and brand trust are prominent variables in explaining brand loyalty—an important construct for a firm’s success (e.g., Coleman et al., 2015; Ekinci et al., 2008; Luxton et al., 2015; Nam et al., 2011). These three constructs explain 68% (GBs) and 61% (PLs) of the variance in brand loyalty.
The CBBPM is interesting for researchers and practitioners beyond the apparel and sportswear industries. First, in comparison to other brand performance measures, it has the advantages of a parsimonious model with only four constructs, which are among the brand-related variables with most consumer behavior predictive power (Zarantonello & Pauwels-Delassus, 2016). Brand equity reflects the importance, value, and incremental utility that brands have for consumers. This concept has been validated by the literature and applied to products of different natures (e.g., food, beverages, household equipment, luxury goods, transport services, catering and accommodation, tourist destinations). Brand satisfaction represents the result of consumers’ experiences with the brand in both functional and symbolic dimensions. Therefore, it plays an important role in the construction of strong brands in the long-term, regardless of the product category. Similarly, brand trust is a key variable for building long-term relationships between consumers and brands, and its positive influence has been found to cross product categories and brands in previous studies. Finally, the achievement of strong brand loyalty is one of the best outcomes to which a brand in any industry might aspire. Loyalty reflects the positive attitude of the consumer to continue purchasing and recommending a brand. It is a key construct that has been used in recent decades to show the success of brands in all product categories. Therefore, if all model variables have been positively associated with brand performance across product categories and brands, we can assert that the model presented in this study has a wide scope, which extends beyond the industries in which it has been validated.
Second, although the CBBPM has only been validated in two industries (i.e., apparel and sportswear retailing), we argue that it also has relevance in other contexts. These days, it is common to see global fashion brands expand into other categories. For example, we see that Zara created Zara Home, which focuses on houseware. Armani, an Italian fashion brand, created Armani/Dolci, which sells chocolates, jams, jellies, pralines, and so on. On the other hand, other brand categories have also branched out into the fashion industry. For example, Porsche created Porsche Design that is not only in the fashion business but also deals in categories such as electronics. These examples show that brands are focused on the consumers’ lifestyle, supporting the generalizability of our CBBPM.
Moreover, previous research states that brand performance in consumer markets tends to be evenly distributed (e.g., Dawes, 2009; Fennell, Allenby, Yang, & Edwards, 2003). The argument that supports this notion is that the buyers of one brand also buy other brands (Dawes, 2008). For example, one could argue that the people who purchase Gucci are the same people who purchase Ferrari and/or Cartier. Dawes (2009) shows that consumer brands exhibit polygamous loyalty, with the sharing of customer purchases with other brands fairly in line with the market share of those other competitor brands, and approximately equal performance levels among demographic subgroups.
Regarding the comparison of GBs and PLs brand performance, we find that for GBs, brand trust and brand equity are more important in building brand loyalty, whereas for PLs, brand trust and brand satisfaction are more important. Looking at the mean scores of this study, PLs perform better than GBs on the three brand performance measures. Hence, our study confirms that even after the recent time of economic hardship has passed, PLs perform better than GBs. These findings support Deloitte’s (2015) study, which states that consumers see PLs as genuine alternatives to GBs. This result might be explained by the fact that PLs have improved their perceived image of quality through premium product lines (ter Braak, Geyskens, & Dekimpe, 2014). GB managers should pay attention to this development as PLs could seriously challenge their market share.
Managerial implications
By tracking the performance of their brands, managers can prioritize their efforts and allocate their resources more efficiently to improve brand loyalty over time (Zarantonello & Pauwels-Delassus, 2016). Using our CBBPM, we argue that managers could track the development of their brands and evaluate their long-term performance. To implement CBBPM, brand managers should focus on brand equity, brand trust, and brand satisfaction to increase brand loyalty. Given the simplicity of the measures, managers might easily integrate this model into tracking studies (e.g., online surveys, computer-assisted interviewing, panel data) to monitor brand performance. They could develop internal and external benchmarks to assess and track brand performance over time or over a specific period. Managers could also use our measures to evaluate the position of their brands relative to their competitors, as well as to compare brand performance. Managers will be able to evaluate the efficacy of marketing programs by determining which activities contribute to building or harming brand performance and thus be able to decide whether they should be discontinued. Moreover, its predictive capability allows managers to evaluate the brand not only in terms of the customer-brand relationship but also in financial terms by estimating repurchasing intention and therefore financial return.
Focusing on the CBBPM measures, the overall CBBE construct makes the model more useful, for example, in the assessment of the impact on brand performance of strategies such as brand extension or co-branding by measuring the equity of the co-brands and the parent brand before and after the brand extension. The model could also be used, for example, to assess the impact of a negative event or an unexpected problem, which might harm brand credibility, on the brand’s performance in sectors as diverse as food or automotive. It seems that consumers these days are more interested in whether brands are trustworthy, pay attention to their interests, and do not take advantage of them. Thus, brand managers should put more effort into developing affective relationships between brands and consumers. For example, brand managers could develop online brand communities, foster social networking practices, or organize events that cater for the hobbies or interests of their target markets. Subsequently, managers could focus on their brand’s transparency and social responsibility. According to Kang and Hustvedt (2014), increasing consumers’ perception of transparency and social responsibility leads to higher trust in the company. Brand managers should invest more in creating sustainable business practices. Companies should communicate that they care not only for their consumers but also for their employees, the community, and the ecological and social environment. In regard to brand satisfaction, managers should encourage customers to closely evaluate their brands because, if the results manifest satisfaction, the effect on brand loyalty will be positive.
The results imply that to enjoy the substantial competitive and economic advantages provided by a loyal customer base (e.g., low price sensitivity, brand advocacy, better revenue forecasting), managers should focus on CBBE, brand satisfaction, and brand trust. Truly loyal customers perceive good brand value, are manifestly satisfied with the brand, and rely on it. Through brand loyalty, the CBBPM can also be useful to assess the value of the brand for licensing or sales purposes, or to evaluate the impact of marketing activities such as communications campaigns.
Finally, regarding the comparison of GBs and PLs, although for GBs brand equity is more important than brand satisfaction in building brand loyalty, and the opposite is true for PLs, brand equity and brand satisfaction are key measures for improving brand loyalty. Thus, it is always good for managers to increase brand equity by focusing on the brand’s functional (i.e., quality) and symbolic (i.e., brand personality) features. Brands could offer a longer warranty to increase perceived quality. As for brand satisfaction, brand managers should understand that this is not always related to the tangible aspects of the brand but is also related to the service that surrounds the brand. For example, brands should make sure that they deliver the brand in time as promised. Brands could also increase the value of their products by cooperating with other organizations of interest to their consumers. For example, if consumers purchase training shoes from Nike, they might be entitled to a discount when they visit a recreational park.
This study introduces a CBBPM based on data from two different surveys. It has some limitations. The respondents had similar demographic profiles and hence it would be worthwhile to compare the performance of GBs and PLs with the same respondents. It would also be interesting to measure and track the performance of GBs and PLs over a period of time. A longitudinal study would help explain whether the performance of PLs is, in fact, better than the performance of GBs. To increase the value of the CBBPM, future studies should investigate the relationships between it and marketing performance matrices (e.g., profitability). Another limitation is that this study was conducted with only two categories (i.e., apparel and sportswear). Although previous research argues that brand performance in consumer markets is evenly distributed (e.g., Dawes, 2009; Fennell et al., 2003), further study should test the CBBPM in other contexts to increase its generalizability. Finally, it would be interesting to include some moderating variables into the analysis, such as retailer loyalty and price sensitivity.
Footnotes
Appendix
Measurement scales.
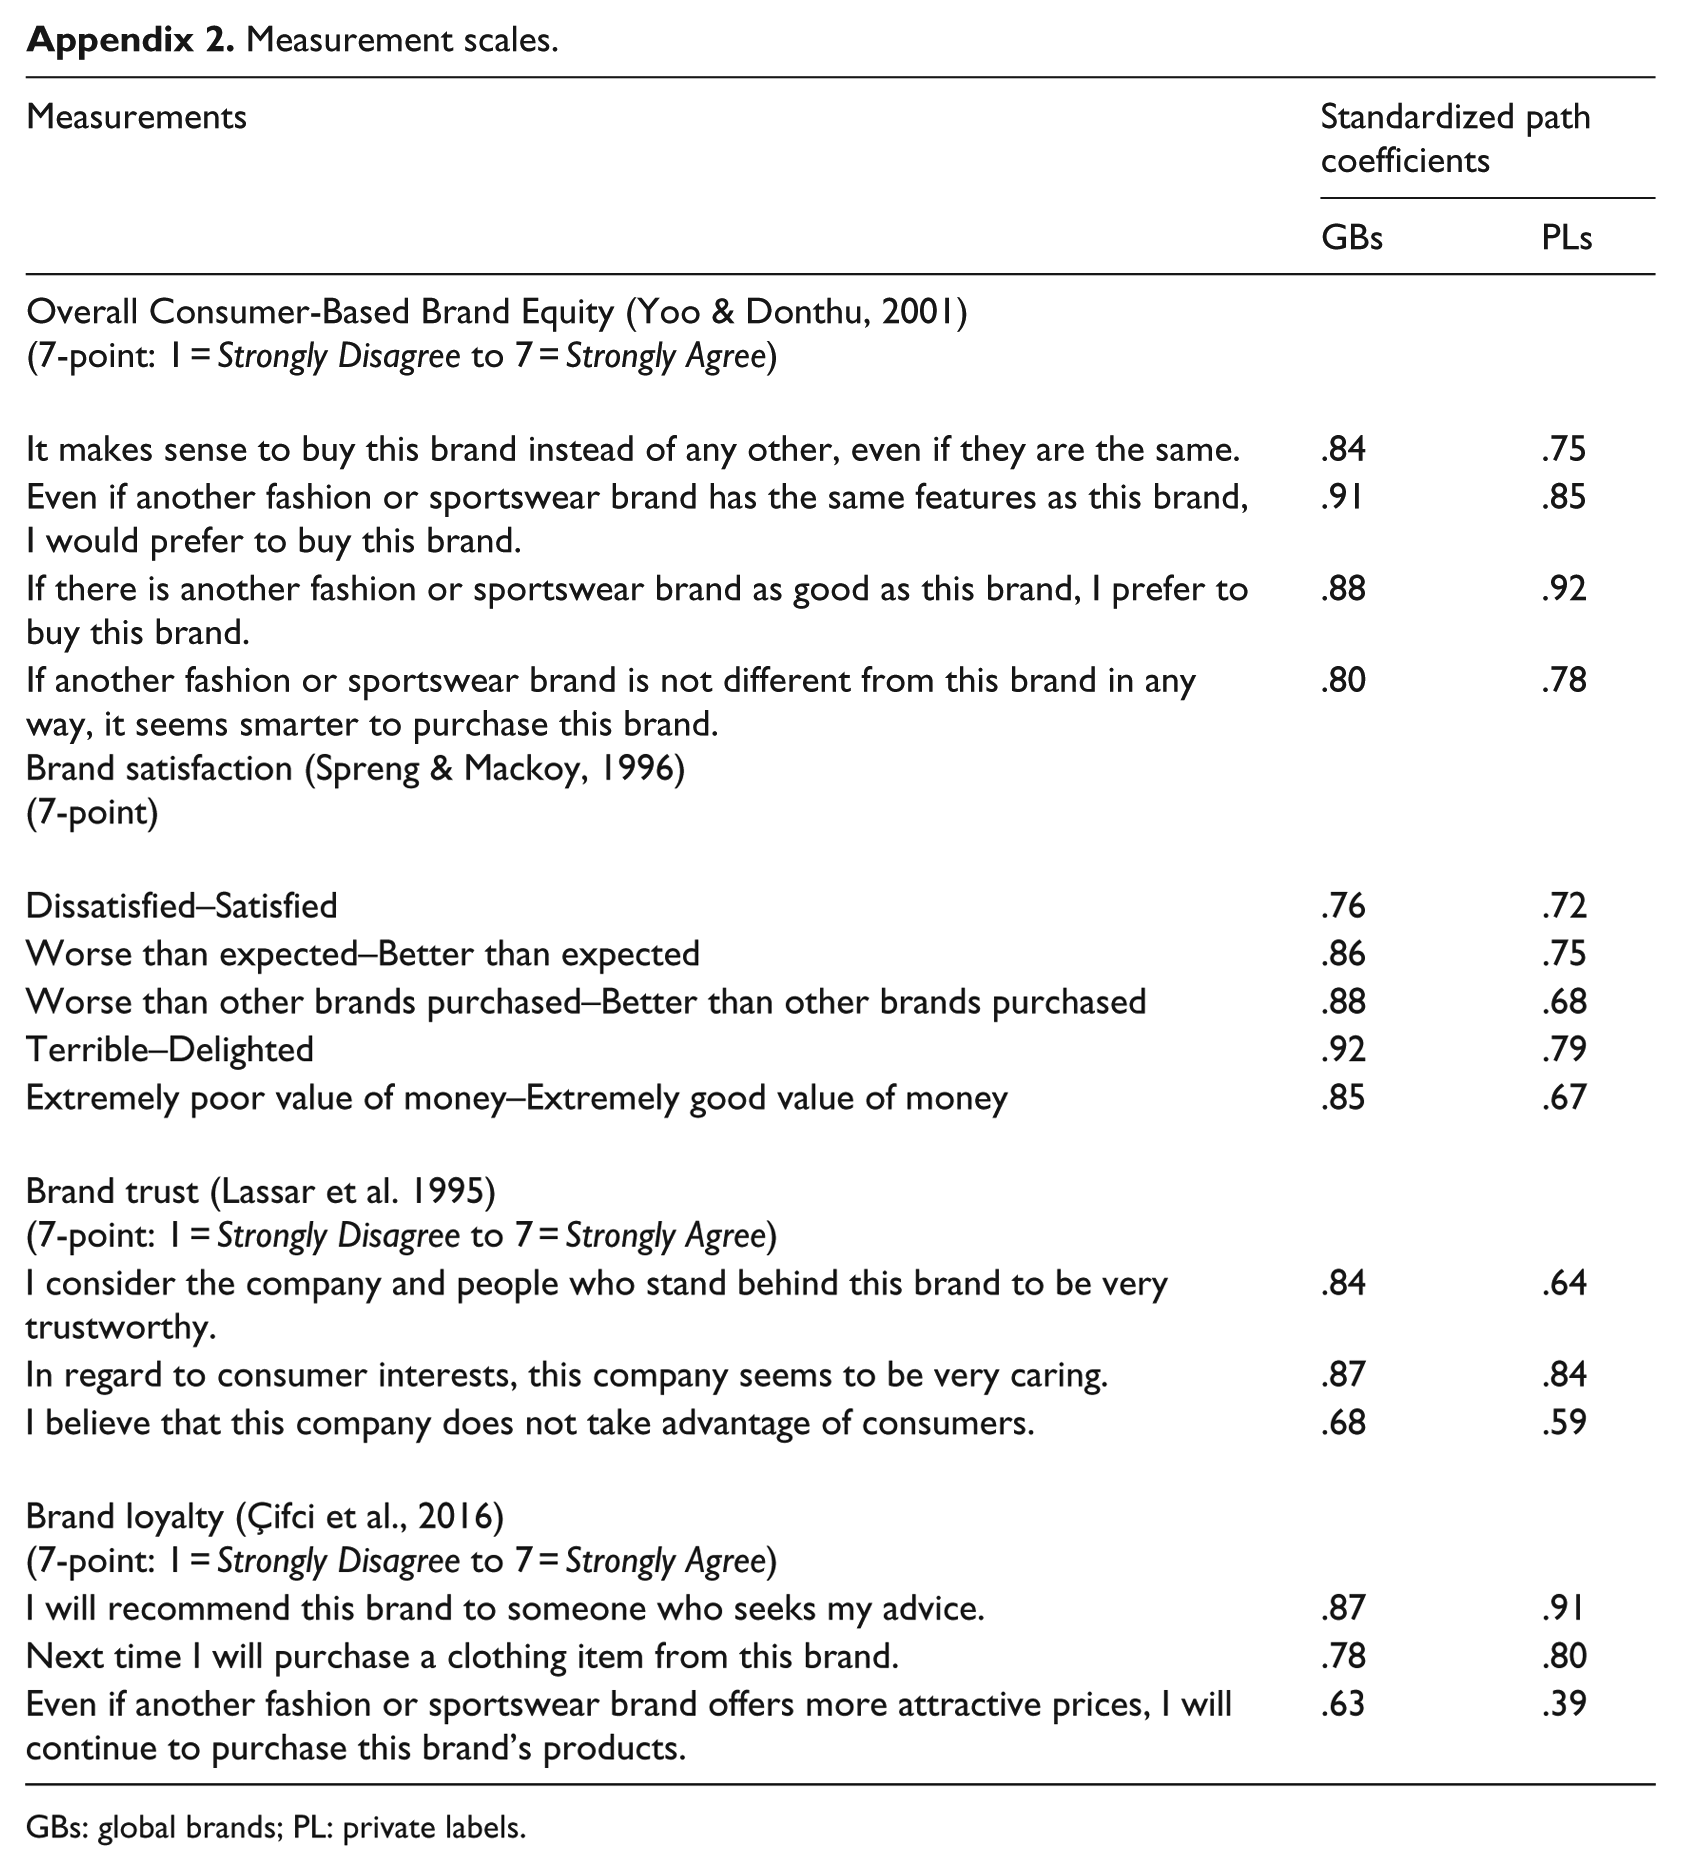
|
Measurements |
Standardized path coefficients | |
|---|---|---|
| GBs | PLs | |
| Overall Consumer-Based Brand Equity (Yoo & Donthu, 2001) (7-point: 1 = Strongly Disagree to 7 = Strongly Agree) |
||
| It makes sense to buy this brand instead of any other, even if they are the same. | .84 | .75 |
| Even if another fashion or sportswear brand has the same features as this brand, I would prefer to buy this brand. | .91 | .85 |
| If there is another fashion or sportswear brand as good as this brand, I prefer to buy this brand. | .88 | .92 |
| If another fashion or sportswear brand is not different from this brand in any way, it seems smarter to purchase this brand. | .80 | .78 |
| Brand satisfaction (Spreng & Mackoy, 1996) |
||
| Dissatisfied–Satisfied | .76 | .72 |
| Worse than expected–Better than expected | .86 | .75 |
| Worse than other brands purchased–Better than other brands purchased | .88 | .68 |
| Terrible–Delighted | .92 | .79 |
| Extremely poor value of money–Extremely good value of money | .85 | .67 |
| Brand trust (Lassar et al. 1995) |
||
| I consider the company and people who stand behind this brand to be very trustworthy. | .84 | .64 |
| In regard to consumer interests, this company seems to be very caring. | .87 | .84 |
| I believe that this company does not take advantage of consumers. | .68 | .59 |
| Brand loyalty (Çifci et al., 2016) |
||
| I will recommend this brand to someone who seeks my advice. | .87 | .91 |
| Next time I will purchase a clothing item from this brand. | .78 | .80 |
| Even if another fashion or sportswear brand offers more attractive prices, I will continue to purchase this brand’s products. | .63 | .39 |
GBs: global brands; PL: private labels.
Funding
The author(s) disclosed receipt of the following financial support for the research, authorship, and/or publication of this article: The work presented in this paper was partly supported by a research grant funded by the Universidad de Málaga, Andalucía Tech (Spain).