
Abstract
In recent years, the number of surveys, especially online surveys, has increased dramatically. Due to the absence of interviewers in this survey mode (who can motivate the respondents to continue answering), some researchers and practitioners argue that online surveys should not be longer than 20 min. However, so far, there has been little research investigating how long respondents think that online surveys should or could be. In this study, we therefore asked respondents of two online panels in Germany (one probability-based panel and one nonprobability panel) about their opinions on the ideal and maximum lengths of surveys. We also investigated whether socio-demographic, personality-related, and survey-related variables were associated with the ideal and maximum lengths reported by respondents. Finally, we compared the stated and observed survey lengths to evaluate the extent to which respondents are able to accurately estimate survey length. Our results suggest that the ideal length of an online survey is between 10 and 15 min and the maximum length is between 20 and 28 min, depending on the measure of central tendency (mean or median) used and the panel. Moreover, we found significant effects of socio-demographics (gender, age, education, and number of persons in household), of personality traits, and survey-related questions (whether the respondents liked the survey, found it easy, and answered from a PC) on at least one of the dependent variables (ideal or maximum lengths). Finally, we found only small differences (less than two min) between stated and observed lengths.
Introduction
Previous research suggests that comparatively long surveys are associated with several negative effects, especially in the case of online surveys. For instance, Crawford et al. (2001) and Marcus et al. (2007) found that a longer announced survey length reduced response rates. Deutskens et al. (2004) found that longer online surveys lead to higher proportions of “don’t know” answers and higher break-off rates. Galesic and Bosnjak (2009) found that questions close to the end had higher item non-response rates, shorter answers to open-ended questions, and less variability in answers to grid questions. Overall, this suggests that shorter online surveys should be preferred but provides no suggestions regarding how long they should or could be.
Revilla and Ochoa (2017) asked respondents of an opt-in online panel in Mexico what they consider to be the ideal and maximum survey length and examined how responses varied with socio-demographic characteristics and survey-related attitudes. They found a median ideal length of 10 min and a median maximum length of 20 min. Moreover, the ideal and maximum lengths were significantly associated with how much respondents liked answering the survey and how much trust they had that their data would be treated confidentially. However, the socio-demographic characteristics did not have a significant impact on either measure, except age in the case of maximum length.
In this research note, we build on the study by Revilla and Ochoa (2017), addressing three aspects that the authors recommended for future research (p. 564):
Using a probability-based online panel. We used data from the probability-based German Internet Panel (GIP) and the nonprobability Respondi panel (Germany).
Considering more countries. While Revilla and Ochoa (2017) conducted their study in Mexico, we conducted our study in Germany.
Using further explanatory variables. We additionally include the “Big Five” personality traits: agreeableness, conscientiousness, extraversion, neuroticism, and openness (measured with the BFI-10 [10 Item Big Five Inventory], as proposed by Rammstedt et al. (2013).
Moreover, even though Revilla and Ochoa (2017) were interested in respondents’ opinions on online surveys, the questions they used only mentioned the word “surveys.” We therefore tested whether mentioning online surveys instead of surveys affects the outcome, by randomly assigning respondents to a similar question formulation as the one used by Revilla and Ochoa (2017) or a question formulation that explicitly stated “online surveys.”
Method
Data collection
German Internet Panel (GIP)
The GIP is a probability-based online panel, which aims to represent the German population aged 16 to 75. We use data from Wave 42 in July 2019 (Blom et al., 2020). Respondents could answer through the device type of their choice (i.e., PC, smartphone, or tablet). The GIP collects paradata, such as response time. While 4,714 panelists started this wave, 79 broke off before being asked any study-relevant questions, leaving 4,635 panelists for analyses. Supplemental Appendix 1 provides information about the sample composition.
Respondi
Respondi is a nonprobability panel in Germany (www.respondi.com). In this study, the target population was the German population aged 18 to 70. Cross-quotas for age and gender were used to represent the German population. Paradata, such as response times were collected using “Embedded Client Side Paradata (ECSP)” (Schlosser & Höhne, 2018). The goal was to obtain 3,000 panelists completing the entire survey: 1,500 through a PC and 1,500 through a smartphone. Panelists were randomly assigned to a device type when invited to the survey. If they entered the survey with a wrong device type (detected through the user-agent-strings), they were blocked and asked to switch to the correct device type. Data were collected in July/August 2019. In total, 3,407 respondents started the survey, but 177 did not answer any of the three main study-relevant questions (see Section ‘Surveys and experimental designs’), leaving 3,230 respondents for analyses. Supplemental Appendix 1 provides information about the sample composition.
Surveys and experimental designs
Both online surveys were about 20-min long. They included a variety of political and social topics.
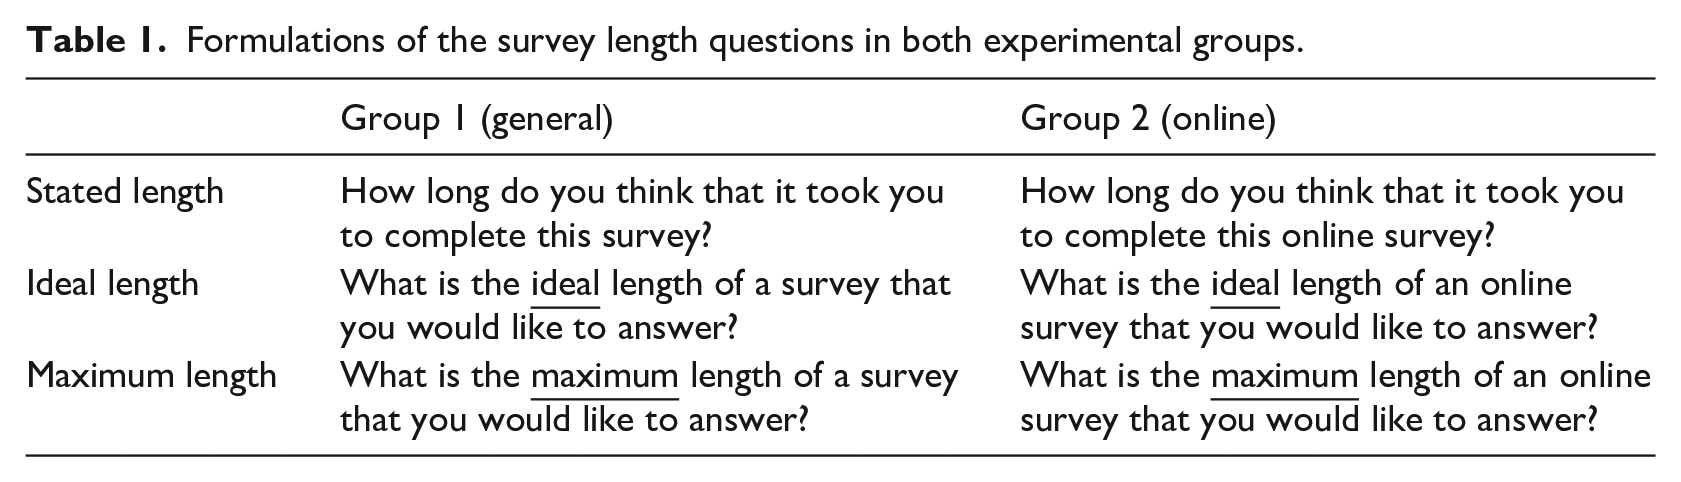
We were mainly interested in three questions placed close to the end of the surveys. For these questions, in each panel, respondents were randomly assigned to one of two experimental groups. Group 1 received a German translation of the question formulations used by Revilla and Ochoa (2017). Group 2 received identical question formulations, with the addition of the word “online.” Table 1 provides the formulations of the questions in each group. Respondents were always asked to enter numbers in an open-answer field to express the length in min.
Formulations of the survey length questions in both experimental groups.
We were also interested in how responses varied across key socio-demographics (gender, age, education, and number of persons in the household) and personality traits (measured with the 10 Item Big Five Inventory by Rammstedt et al., 2013). Furthermore, we used two questions to measure the survey satisfaction: the first asked how much respondents liked answering the survey and the second how easy or difficult respondents found answering the survey. The exact question wording slightly differed across panels (see Supplemental Appendix 2).
Analyses
The analyses were kept as similar as possible to those of Revilla and Ochoa (2017) to facilitate the comparison of the results obtained in both studies.
Ideal and maximum lengths
First, we report the following descriptive statistics for ideal and maximum lengths: minimum, maximum, mean, and median per experimental group and panel. We test for significant differences between experimental groups using t-tests for means and K-tests for medians. However, we do not test for significant differences between panels because they differ in key characteristics. Thus, the two panels serve only as case studies, allowing us to investigate whether we would observe similar trends in different contexts.
Then, we run for each panel ordinary least squares (OLS) regressions with ideal and maximum lengths as continuous dependent variables. Following Revilla and Ochoa (2017), we include the following independent variables: men (1 = men, 0 = women), age (14 ascending categories), education level (low and high levels with middle as reference), number of persons in the household (five ascending categories; only available for the GIP), whether the respondent liked answering the survey (five ascending categories for the GIP and seven for Respondi), the easiness of answering the survey (four ascending categories for the GIP and seven for Respondi), and whether the respondent used a PC to answer the survey (1 = PC, 0 = smartphone or tablet in the GIP and 0 = smartphone in the Respondi panel).
In addition, we included the five personality traits of agreeableness, conscientiousness, extraversion, neuroticism, and openness (nine ascending categories each). Each trait was measured with two questions, the responses to which we sum to produce each respondent’s final score across each trait. All questions were coded such that a higher value indicates a higher level of the respective personality trait. We also control for the experimental group by including a dummy variable (1 = online group, 0 = general group).
To deal with outliers in ideal length in the regressions, we excluded respondents who reported an ideal length longer than 60 min, resulting in two exclusions in the GIP and four in the Respondi panel. For the regressions of maximum length, we excluded respondents who reported a maximum length longer than 180 min, resulting in 11 exclusions in the Respondi panel (see Supplemental Appendix 3 for robustness checks).
Stated and observed lengths
Following Revilla and Ochoa (2017), we report the minimum, maximum, mean, and median for stated (reported by respondents) and observed (determined using paradata) lengths as well as the (absolute) difference between the two measures. We test for significant differences between experimental groups using t-tests for means and K-tests for medians.
Due to multitasking behavior and/or interruptions during the survey, the observed length is very long for some respondents. We used the highest value of stated length as the threshold to define outliers in observed length and excluded these outliers from the analyses.
Main results
Ideal and maximum lengths: descriptive statistics
Table 2 presents the descriptive statistics for the ideal and maximum lengths for each experimental group and each panel.
Descriptive statistics for ideal and maximum lengths in minutes.
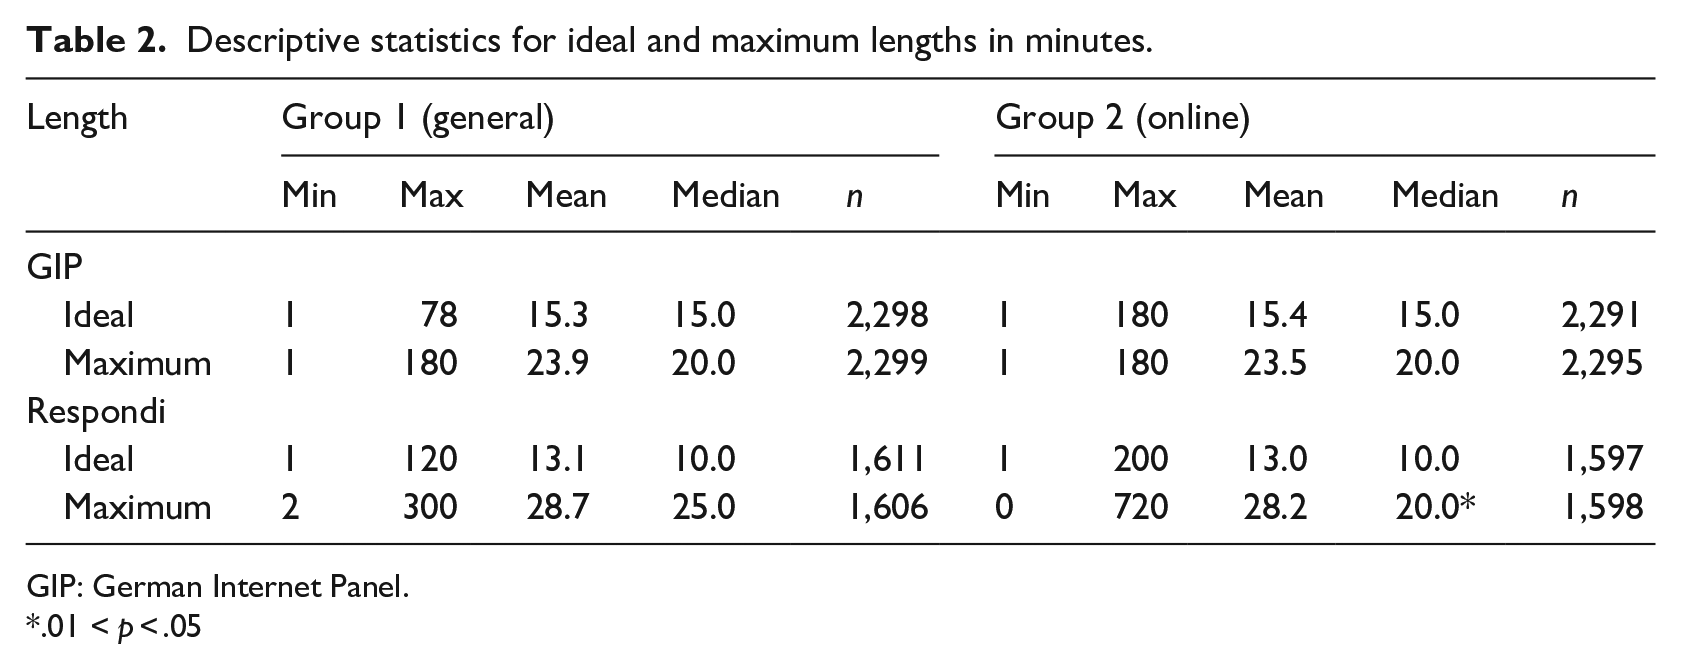
GIP: German Internet Panel.
.01 < p < .05
First, the mean ideal length is between 13.0 and 15.4 min and the median ideal length is between 10 and 15 min (depending on the group and panel). In contrast, the mean maximum length is between 23.5 and 28.7 min and the median maximum length is between 20.0 and 25.0 min. These results are quite similar to those of Revilla and Ochoa (2017, p. 560, Table 1) with slightly longer ideal and maximum lengths in this study. For ideal length, they reported a mean of 12.6 min and a median of 10.0 min. For maximum length, they reported a mean of 22.7 min and a median of 20.0 min.
Second, there are no significant differences between experimental groups, except for maximum length (median) in the Respondi panel. Thus, adding the word “online” in the question, in general, does not affect the reported ideal and maximum lengths.
However, there are some variations across the panels. In terms of ideal length, the GIP respondents have higher means (about 2 min longer) and medians (about 5 min longer) than the Respondi respondents in both experimental groups. Regarding maximum length, in contrast, the GIP respondents have lower means (about 5 min shorter, in both experimental groups) and lower medians (about 5 min shorter, in the first experimental group).
Furthermore, there is a lot of variations within experimental groups and panels. For instance, in Group 2 in the Respondi panel, the ideal length varies from 1 to 200 min and the maximum length varies from 0 to 720 min.
Ideal and maximum lengths: regressions analyses
Next, we investigate the variables that affect ideal and maximum lengths using regression analyses. Table 3 presents the results.
Regression analyses of ideal and maximum lengths.
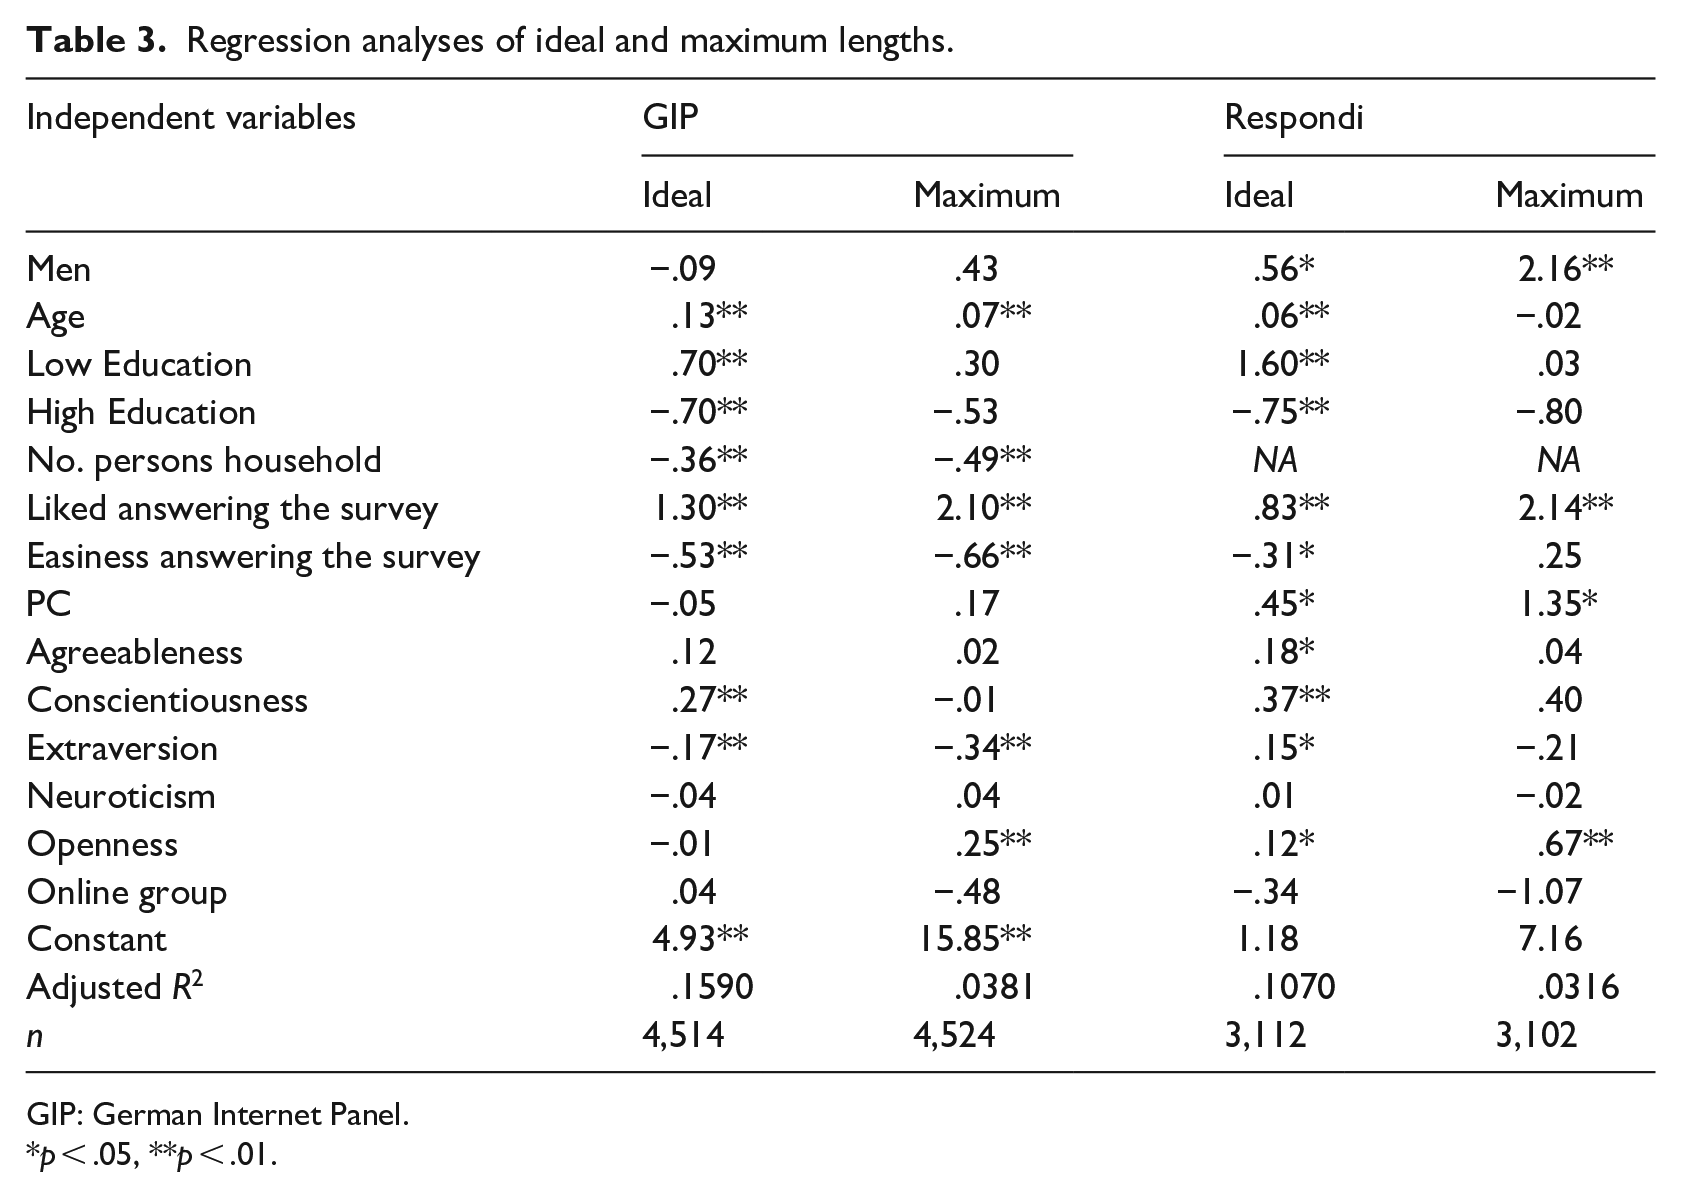
GIP: German Internet Panel.
p < .05, **p < .01.
In the ideal length models, the effects of the variables men (Respondi), age (GIP and Respondi), education (GIP and Respondi), and number of persons in the household (GIP) are statistically significant. In the maximum length models, the effects of the variables men (Respondi), age (GIP), and number of persons in the household (GIP) are statistically significant. This suggests that the ideal and maximum lengths are more strongly related to respondents’ main socio-demographic characteristics than was found by Revilla and Ochoa (2017), where the only significant effect was that of age in the maximum length model.
Regarding the survey-related variables, similar to the findings in Revilla and Ochoa (2017), the more respondents liked answering the survey, the longer the ideal and maximum lengths were. Moreover, the easier respondents found the survey, the shorter the reported ideal (GIP and Respondi) and maximum (GIP) lengths were.
While we did not find a significant effect of PC use in the GIP, 1 we found a significant positive effect of PC use on both ideal and maximum lengths in the Respondi panel. To put it differently, respondents answering with a PC tended to state longer ideal and maximum lengths, whereas respondents answering with a smartphone tended to state shorter ideal and maximum lengths. The difference between both panels might be due to the device randomization in the Respondi panel.
Furthermore, we found some significant effects of the personality traits on ideal and maximum lengths, except for neuroticism. Finally, we did not find significant effects for the experimental group on the ideal or maximum lengths.
Stated length versus observed length
Following Revilla and Ochoa (2017), we also compare the stated and observed survey lengths. Table 4 presents the results.
Descriptive statistics for stated length, observed length, and their (absolute) difference in minutes.

Results are reported for those who answered the stated length question and for those paradata were available to determine observed length. “Difference” is computed for each respondent as observed minus stated lengths. “Absolute Difference” is computed for each respondent by taking the absolute value of the difference observed minus stated lengths. GIP: German Internet Panel.
First, we did not expect differences between the experimental groups since respondents were asked the same question on estimating the length of the current survey. This is supported by the analyses.
Second, there are differences between panels and between respondents within each panel. In the GIP, the means and medians of the stated and observed lengths are similar. In the Respondi panel, the observed length is slightly shorter than the stated length. However, the mean and median differences are quite small (up to 1.2 and 2.2 min, respectively). In general, these findings suggest that respondents’ length estimations are quite close to what is observed using paradata.
Discussion
This study suggests that the ideal length of an online survey is between 10 and 15 min and the maximum length between 20 and 28 min, depending on the measure of central tendency used and the panel examined. These findings are in line with those reported by Revilla and Ochoa (2017) for a nonprobability panel in Mexico, even though if we obtained somewhat longer ideal and maximum lengths.
Adding the word “online” did not affect the overall results. This could be because respondents have similar opinions about survey length, irrespective of the data collection mode, or because they expected that the questions refer to online surveys, even though this was not stated explicitly. In our opinion, the second explanation is more plausible, because respondents were members of online panels. Furthermore, the first question on stated length specifically asked about the current survey, which, in turn, may have shifted respondents’ interpretive framework of the next questions to a framework centered on online surveys.
Moreover, we found some large differences in what respondents consider to be the ideal and maximum survey lengths, suggesting that some respondents can be more receptive to receiving longer online surveys. In the regression analyses, we found significant effects of the main socio-demographics and survey-related questions available in our study (except neuroticism and the experimental group) on at least one of the four dependent variables.
Furthermore, there are only minor discrepancies between the stated and observed lengths.
This study has some limitations that represent avenues for future research. First, several of the variables were not measured in the same way across panels. Second, we only used data from one country (Germany). Thus, no cross-national conclusions can be drawn. Third, even though we controlled for the device type (i.e., PC or mobile device) in the regressions, since mobile device participation is of high interest for many researchers, it would be interesting to focus more specifically on survey length for mobile respondents in future studies (e.g., looking at descriptive analyses depending on the device type). Finally, it would be useful to use a more comprehensive set of paradata, such as browser tab and window switching, to control for multitasking behavior and/or interruptions during the survey that artificially inflate the observed length. Otherwise, differences between stated and observed lengths could be due to imprecise time measures and not due to respondents being unable to properly estimate survey length.
Overall, this study provides important information helping researchers and practitioners to decide about the length of online surveys. In general, 10–15 min seem to be the ideal length, whereas more than 30 min seems too long. Nevertheless, there are large variations between respondents. Depending on the population of interest, fielding surveys of different lengths might be appropriate.
Supplemental Material
Appendices – Supplemental material for How long do respondents think online surveys should be? New evidence from two online panels in Germany
Supplemental material, Appendices for How long do respondents think online surveys should be? New evidence from two online panels in Germany by Melanie Revilla and Jan Karem Höhne in International Journal of Market Research
Footnotes
Acknowledgements
The authors would like to thank Tobias Rettig (University of Mannheim) for his support in conducting this research.
Declaration of conflicting interests
The author(s) declared no potential conflicts of interest with respect to the research, authorship, and/or publication of this article.
Funding
The author(s) disclosed receipt of the following financial support for the research, authorship, and/or publication of this article: The authors acknowledge financial support by the German Science Foundation through the Collaborative Research Center 884 “Political Economy of Reforms” at the University of Mannheim (Grant Number: 139943784).
Supplemental material
Supplemental material for this article is available online.
Notes
References
Supplementary Material
Please find the following supplemental material available below.
For Open Access articles published under a Creative Commons License, all supplemental material carries the same license as the article it is associated with.
For non-Open Access articles published, all supplemental material carries a non-exclusive license, and permission requests for re-use of supplemental material or any part of supplemental material shall be sent directly to the copyright owner as specified in the copyright notice associated with the article.