






Abstract
Brand equity (BE) and customer equity (CE) are the two crucial and closely linked concepts in marketing research. This research outlines a new conceptual framework to explore the relationship between the critical elements of BE and CE. Furthermore, using marketing activities, the study quantifies the effect of these activities on CE. The value of CE is computed based on a customer lifetime value (CLV) model in which linear, logistic, and beta regression are used to predict BE, customer acquisition, and customer share of wallet, respectively. We conducted an empirical analysis through questionnaires in an elevator company. The results reveal that brand knowledge and brand differentiation positively relate to customer acquisition. Also, for both existing customers and prospects, brand differentiation plays an important role in the share of wallet. The findings also show that marketing activities have a positive and significant impact on brand knowledge and brand differentiation, and consequently, through the mediating role of BE between marketing activities and CE, on customer acquisition and share of wallet.
Keywords
Introduction
In recent years, customer equity (CE) has emerged in the marketing area as a key metric of Customer Relationship Management (CRM) performance. Some studies (Berger et al., 2006; Gupta et al., 2004; Rust, Lemon, & Zeithaml, 2004; Srivastava et al., 1998; Wiesel & Skiera, 2005) have focused on CE as a comprehensive tool for measuring and managing marketing success. Blattberg and Deighton (1996) defined CE as the total discounted customer lifetime values (CLVs) summed over all of the firm’s customers. The notion of CLV has been well accepted by both researchers and business practitioners. Gupta et al. (2006) defined CLV as the present value of all future profits obtained from a specific customer over the life of his or her relationship with the firm. Moreover, Brand Equity (BE) started to draw attention from academics during the early 1990s, focused on its conceptualization, measurement, and management (Chu & Keh, 2006; Keller, 1993).
CE and BE are the two key marketing concepts which have a crucial role in marketing research (Chun et al., 2013; Kim, 2015; Kim & Brandon, 2010; Leone et al., 2006; Segarra-Moliner & Moliner-Tena, 2016; Stahl et al., 2012; Yang et al., 2014; Zhang et al., 2010). According to several authors, who have attempted to define the critical elements of CE, BE is one of the most important ones (Chae et al., 2015; Leone et al., 2006; Rust et al., 2004). Brands are the necessary touchpoint by which firms have to connect with their customers, meaning that customers ensure the success of brands (Leone et al., 2006). Marketing managers need a practical model for linking BE, long-term shareholder value, and marketing investments. Yet, in the related literature, there seems to be no clear definition of the relationship between BE and CE.
The present study aims to address this research gap. It presents a conceptual framework to examine the relationship between the critical elements of BE from Young and Rubicam’s brand asset valuator (BAV) and CE or CLV. To the best of our knowledge, this is the first model that can quantify CE using BE. However, a recent review of the literature on this topic shows that the relationship between them has been investigated widely by the researchers, there is still no numerical model for this critical issue. Besides, using marketing activities, the study quantifies the effect of these activities on CE (Ailawadi et al., 2003; Blattberg et al., 2009; Chun et al., 2013; Huang & Sarigollu, 2012; Kim, 2015; Kim & Brandon, 2010; Leone et al., 2006; Raithel et al., 2016; Segarra-Moliner & Moliner-Tena, 2016; Srinivasan et al., 2005; Stahl et al., 2012; Venkatesan & Kumar, 2004; Yang et al., 2014; Zhang et al., 2010).
This article is organized as follows. The “Theoretical background” section gives a literature review about CE and BE. In the “Hypotheses development and methodology” section, conceptual model, research hypotheses, and methodology are presented. The results analysis and discussions are reported in section “Results and discussion.” Finally, the last section provides conclusions and managerial implications.
Theoretical background
CE refers to the total discounted lifetime values of all firm’s customers (Rust et al., 2010). Due to the technological advances in marketing, the concept has been receiving much attention (Berger & Nasr, 1998; Dwyer, 1997; Kim et al., 2012; Kim & Ko, 2012).
BE is generally defined as the added value of a brand that forms the part of a product created in the minds of consumers in response to past investments in brand marketing (Keller, 1998). Aaker (1995) defined BE as a set of five categories of the brand assets and liabilities linked to a brand, its name, and symbol that add to or subtract from the value provided by a product or service to a firm or to that firm’s customer, or both.
Leone et al. (2006) explain the linkage between BE and CE as there are no brands without customers and no customers without brands. If the brand wins the hearts and minds of customers, then it is easier to retain/acquire customers (Leone et al., 2006; Peppers & Rogers, 2004; Rust et al., 2000). Unfortunately, there has been relatively little attention paid to reconcile the relationship between BE and CE. Leone et al. (2006) suggested a modeling approach that could be used to investigate the linkage between BE and CE, as well as a modeling approach to determine the value of supplier–retailer interactions. The main downside of this research is that it neglects to explain the relationship between BE components and CE components. Besides, a significant criticism of the model is that it has not been empirically tested with real data. Stahl et al. (2012) presented an empirical examination of the relationship between BE and customer acquisition, retention, and profit margin using statistical analyses. However, this research did not address the impact of marketing activities on BE components and CE components. Gani and Grobler (2014) conceptualized the linkage between BE and CE explicitly in a system dynamics model, which provides insights on how these two concepts interact with each other, and thus improves the marketing management decision-making process. They did this using AIDA 1 and ATR 2 chain models. However, a serious drawback with this approach is that AIDA and ATR models do not explain the relationship between brand and customer. Also, models are postulated in a non-competitive environment.
The two concepts can have an interactive effect such that marketing actions can improve CE, which improves BE and vice versa (Keiningham et al., 2005). Marketing activities such as advertising, price promotion, and new products drive both BE and CE (Stahl et al., 2012). Research shows how marketing activities are associated with BE (Ailawadi et al., 2003; Huang & Sarigollu, 2012; Raithel et al., 2016; Srinivasan et al., 2005). Other research also shows how marketing activities are associated with CE (Blattberg et al., 2009; Venkatesan & Kumar, 2004). It has been widely demonstrated that marketing mix variables could affect customer acquisition and retention (Ailawadi et al., 2003; Ataman et al., 2009; Pauwels et al., 2004; Slotegraaf & Pauwels, 2008).
However, the relationship between CE, BE, and marketing activities have been considered in previous studies separately, there is still a need for an integrated model. Therefore, we propose a conceptual framework to examine the relationship between the critical elements of BE and CE, as well as the impact of marketing activities on both BE and CE elements. Table 1 summarizes the studies of the relationship between BE and CE.
Studies of the relationship between BE and CE.
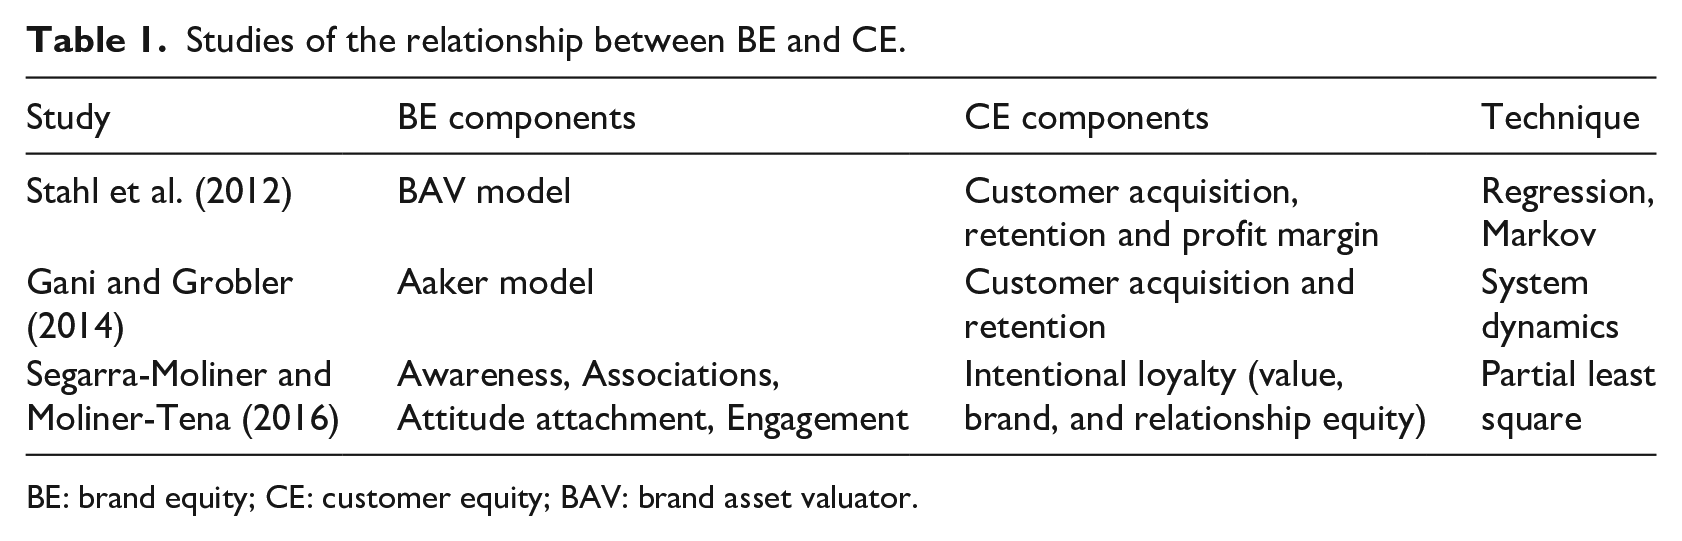
BE: brand equity; CE: customer equity; BAV: brand asset valuator.
Hypotheses development and methodology
In this section, research model, research hypotheses, sampling and data collection, and data analysis are presented.
Research model
To examine the relationship between BE, CE, and marketing activities, this study proposes two research models based on related literature review, as illustrated in Figures 1 and 2. Our frameworks bear a close resemblance to the ones offered by Keller and Lehmann (2003), Gupta and Lehmann (2006), and Lehmann and Reibstein (2006). Figure 1 shows the relationship between BE and CE elements, which compromises the first phase of this research. Figure 2 shows the impact of marketing activities on BE and CE elements, which compromises the second phase of this research. Comparing several models that have been developed to measure BE at the customer mind-set level, Young and Rubicam’s BAV is among the most visible (Mizik & Jacobson, 2008). BAV is an extensive research program on global branding and has been called one of the most ambitious efforts to measure BE across products (Aaker, 1996; Keller, 2008). One strength of BAV is its widespread use both in the business world and by academic researchers (Aaker, 2004; Mizik & Jacobson, 2008). Furthermore, BAV is one of the very few measures available over 10 years for all the relevant brands of primary industry. As a result, because the case study of this research is part of the B2B market, Young and Rubicam’s industrial model has been used with the four critical elements which comprise the BAV model—knowledge, relevance, esteem, and differentiation. Moreover, in this study, we estimate CE using CLV and its critical elements (acquisition, the share of wallet, discount rate, and profit margin). Based on these research models, hypotheses are presented in the next section.

Research model (the relationship between BE and CE).
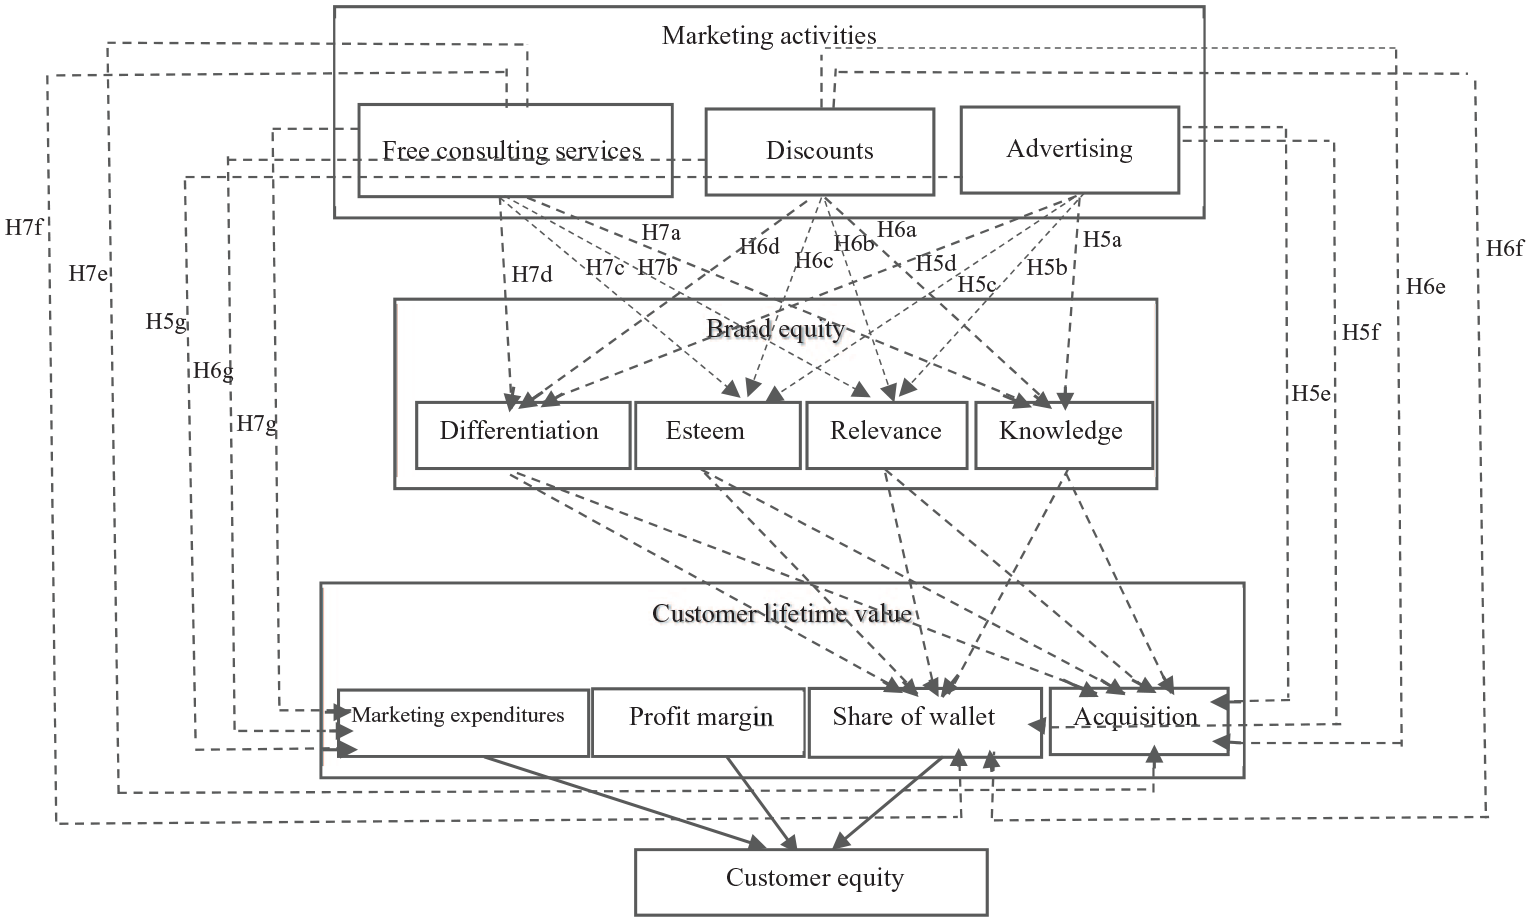
Research model (the impact of marketing activities on BE and CE).
Research hypotheses
Brand knowledge is a core element of BE, not only because of the specific characteristics of the brand but also because of the uniqueness, strength, and the favorability of associations (Keller, 1993). Customers know, understand, and appreciate strong brands (Lehmann et al., 2008). Consumers who are familiar with certain brands are less likely to change their attitudes because there is a lower risk of not meeting their requirements (Esch et al., 2012). Similarly, well-known brands do not have to pay customers a risk premium in the form of lower prices. Therefore, knowledge of a brand should have a positive impact on acquisition. In terms of share of wallet, current customers will have adapted to a product and thus learned to value its attributes (Carpenter & Nakamoto, 1989). They also will be more confident in product judgments, leading to them being more satisfied when considering the mean and variance of alternatives in future decisions (Carpenter & Nakamoto, 1989).
H1a: Knowledge is positively related to customer acquisition.
H1b: Knowledge is positively related to customer share of wallet.
Relevance is consistent with most mind-set models of BE, and BAV includes a measure of needs fulfillment, which is captured by relevance. Products can provide utility by functional, experiential, or symbolic benefits (Park et al., 1986). As the importance of these benefits differs across individual customer and changes over time (Keller, 1993), brands that fulfill the core needs of customers are likely to be considered for purchase (Punj & Brooks, 2002), and consequently produce higher acquisition and share of wallet rates.
H2a: Relevance is positively related to customer acquisition.
H2b: Relevance is positively related to customer share of wallet.
Higher esteem means that brand quality and reliability are favorably judged. Brand quality and reliability are defined as the overall performance of a brand in comparison with its rivals (Aaker, 1996). Esteem is the evidence of the promised features in a product that creates satisfaction and dissatisfaction among consumers (Agbor, 2011). Differently, brand esteem and respect would be related to favorable appraisals of essential attributes (Ajzen & Fishbein, 1980; MacKenzie, 1986). Therefore, brands, which satisfy important consumption goals, could be able to achieve higher customer acquisition and share of wallet.
H3a: Esteem is positively related to customer acquisition.
H3b: Esteem is positively related to customer share of wallet.
Differentiation has long been the mantra of marketing, and hence, one might expect it is also positively associated with all the components of CLV (Day & Wensley, 1988). However, when a brand becomes more differentiated, its target market generally shrinks, which makes it more challenging to attract customers. Moreover, the distinction makes the needs of specific customers more precise (Romaniuk et al., 2007). Consuming a unique and distinctive product would be expected to attract public attention, and engendered public scrutiny has been associated with a variety-seeking (Levav & Areily, 2000; Ratner & Kahn, 2002). Therefore, the more differentiated a brand becomes, the more challenging share of customers it will have.
H4a: Differentiation will be associated with customer acquisition.
H4b: Differentiation will be associated with customer share of wallet.
Marketing activities such as advertising, competitive pricing, discounts, promotions, and new products affect both BE and CE. Researchers (such as Ailawadi et al., 2003; Huang & Sarigollu, 2012; Srinivasan et al., 2005) indicated that marketing activities are related to BE. Others (such as Blattberg et al., 2009; Venkatesan & Kumar, 2004) also noted that marketing activities are associated with CE or CLV. In addition, it has been shown that these types of marketing activities are associated with CE affecting customer acquisition and retention (Ailawadi et al., 2003; Ataman et al., 2009; Pauwels et al., 2004; Slotegraaf & Pauwels, 2008).
Advertising is a marketing communication that employs an openly sponsored, non-personal message to promote or sell a product, service, or idea through mass media (Keller, 2009). It has been shown that spending on advertising results in brand recall and brand recognition, which consequently increases brand awareness (Bravo et al., 2007; Chu & Keh, 2006; Keller, 2007; Yoo et al., 2000). Brand awareness is a factor by which the purchasing attitude of a consumer changes about any good or service (Shabbir et al., 2010; Abiodun, 2011; Gunjan et al., 2012). In addition, many researchers found that higher brand awareness leads to higher perceived quality, meaning that higher esteem is directly related to repurchase intentions and willingness to recommend (Lin, 2006; Lo, 2002; Monroe, 1990). Therefore, the higher advertising spends, the higher levels of awareness, and esteem are likely to arise.
Moreover, targeted informative advertisements make the customer’s decision-making process easier because it informs consumers of products and brand which are in line with their goal and requirements, increasing brand relevance (Murphy & Dweck, 2016). Finally, advertising helps the business to differentiate its product from those of competitors and communicate its features and advantages to the target audience. As differentiation increases, the substitutability of one brand for another decreases, and consumers become less price elastic (Boulding et al., 1994; Chakravarti & Janiszewski, 2004).
H5a: Advertising is positively related to knowledge.
H5b: Advertising is positively related to relevance.
H5c: Advertising is positively related to esteem.
H5d: Advertising is positively related to differentiation.
H5e: Advertising is positively related to customer acquisition.
H5f: Advertising is positively related to customer share of wallet.
H5g: Advertising is positively related to marketing expenditures.
There is a large body of literature, which has examined the consumers’ responses to sales promotions (Abril & Rodriguez-Cánovas, 2016; Bawa & Shoemaker, 1987, 1989; Blattberg & Neslin, 1990; Buil et al., 2013; Gupta, 1988, 1993; Huff & Alden, 1998; Huang & Sarigöllü, 2014; Krishna & Zhang, 1999; Leone & Srinivasan, 1996). Also, there are different sales promotions, among which discounts are the most widely used promotional tools. Even though it has been shown that brand knowledge ensures that many consumers continue to buy it, even loyal brand consumers begin to see the discounts as their first choice, leading to fewer opportunities for brand manufacturers to reach consumers (Steenkamp, 2014). There are apparent benefits to entering discounts such as additional sales and the increasing number of consumers, as well as there are potential risks at the same time (Dhar & Wertenbroch, 2000). Although there is no agreement among researchers that sales promotions could lead to repeat purchases, it is agreed that price promotions can result in a short-term increase in sales and customer satisfaction (Banks & Moorthy, 1999; Bansal et al., 2014; Bawa & Shoemaker, 1987; Diamond, 1992; Gupta & Cooper, 1992; Kopalle et al., 1999; Smith & Sinha, 2000). Also, studies of price promotions show that customers who take advantage of a price promotion are likely to return to their favorite brands (Shamout, 2016; Ehrenberg et al., 1994).
Prior literature has shown that overprice promotions (50%) would harm consumer’s perceived quality and purchase intention (Moore & Olshavsky, 1989). Also, it has been shown that when consumers associate price promotion with worse product quality, the expected sales volume will be offset by price promotion (Raghubir, 1998). Although sales promotions may inspire consumers’ purchase intention, it may also bring customer negative signals: lousy product quality and high perceived risk (Garretson & Clow, 1999).
In addition, from the manufacturers’ perspective, there are two other crucial concerns. First, if sales in the new channel come mostly from consumers who already buy the brand (store switchers), incremental benefits will be limited. Another critical concern is that lower prices hurt margins (especially if other retailers strive to match discounter prices), reputation, and CE (Ailawadi et al., 2003; Andrews et al., 2014).
However, initial works in this field focused primarily on the detrimental effects of promotions on the health of brands (Dodson et al., 1978; Strang et al., 1975); later studies began to question this result. Strang et al. (1975), Shoemaker and Shoaf (1977), and Dodson et al. (1978) found empirical evidence that promotions have a negative long-term effect. Block and Totten (1987) and Neslin and Shoemaker (1989) did not see a negative long-term impact. Boulding et al. (1994) found that the long-term effects of promotions can be negative or positive. A recent review of the literature on this topic found that the effect of sales promotions on BE differs according to the type of promotional tool used. Monetary promotions (i.e., price discounts) have a negative impact on perceived quality. In contrast, non-monetary promotions (i.e., gifts) have a positive effect on perceived quality and brand associations (Buil et al., 2013). Alenazi et al. (2015) showed that store brands are negatively affected by price promotion.
H6a: Discounts are related to knowledge.
H6b: Discounts are related to relevance.
H6c: Discounts are related to esteem.
H6d: Discounts are related to differentiation.
H6e: Discounts are related to customer acquisition.
H6f: Discounts are related to customer share of wallet.
H6g: Discounts are related to marketing expenditures.
A free service trial may be defined as an offer to the consumer at no monetary cost. These trials have been seen as a promotional technique for reducing risks inherent in a new purchase, which can increase brand awareness (Mitchell & Greatorex, 1993). In other words, offering a free service trial can facilitate brand recognition and brand recall for future purchases. As an extra amount is given for free, consumers may be persuaded to buy the product if they feel it represents a fair deal that is good value for money and meets their requirements. The consumer must compare and evaluate the additional quantity received with respect to any costs that may be incurred. For instance, the extra number may be inconvenient to the consumer due to a lack of storage space, resulting in a weak ability to convince the consumer to purchase (Gilbert & Jackaria, 2002).
H7a: Free consulting services are related to knowledge.
H7b: Free consulting services are related to relevance.
H7c: Free consulting services are related to esteem.
H7d: Free consulting services are related to differentiation.
H7e: Free consulting services are related to customer acquisition.
H7f: Free consulting services are related to customer share of wallet.
H7g: Free consulting services are related to marketing expenditures.
Sample and data collection
The original questionnaire is, to some extent, based on Stahl et al. (2012) research. We developed the final questionnaire based on a pretest which was carried out with 30 customers. We used 5-point Likert-type scales, ranging from 1 (strongly disagree) to 5 (strongly agree). Researchers collected a customer purchase data set from 2015 to 2018 to estimate customer acquisition and share of wallet. This research was conducted at one of the most well-known elevator companies in Iran. In this study, two groups of existing customers and prospects were studied.
According to Bartlett and Ik (2001) research, Cochran’s sample size formula for continuous data is as follows
where t = value for a selected alpha level of .025 in each tail = 1.96; s = estimate of standard deviation in the population = 0.83 (estimate of variance deviation for 5-point scale calculated using 5 [inclusive range of scale] divided by 6 [number of standard deviations that include approximately 98% of the possible values in the range]); d = acceptable margin of error for mean being estimated = 0.15 (number of points on primary scale × acceptable margin of error; points on primary scale = 0.03 [error researcher is willing to accept]). In this study, for a population of 300, the required sample size is 118. However, because this sample size exceeds 5% of the population (300 × 0.05 = 15), Cochran’s (1977) correction formula should calculate the final sample size. This calculation is as follows
Therefore, 85 questionnaires were completed for each group of existing customers and prospects to investigate the effect of BE components on CLV components, as well as marketing activities.
Data analysis
Statistical significance was analyzed by using IBM SPSS version 24.0 (for linear and logistic regression) and R statistical software (for beta regression). Linear regression has been used to estimate BE through the BAV model with the four critical elements—knowledge, relevance, esteem, and differentiation. We estimate customer acquisition and customer share of wallet using logistic regression and beta regression, respectively.
Linear regression is a powerful tool for investigating the relationship among multiple variables by relating one variable (dependent variable) to a set of variables (independent variables). It can identify the effect of one variable while adjusting for other observable differences. Let y denote the dependent variable linearly related to k independent variables X1, X2, . . ., Xk through the parameters
where
Reliability statistics of scales (relationship between BE and CE).

Logistic regression is an increasingly popular statistical technique used to model the probability of binary outcomes. The logistic regression model can be written in several ways. Assuming that Y stands for a dichotomous variable with values 1, for the occurrence of the event we are interested in (success), and 0, for the opposite case (failure). The logistic regression model is described by Equation (4), in which
where pi is the probability of an event occurring. In this research, we applied logistic regression to calculate customer acquisition. We determined the best cut-off point (.5) to minimize errors, classifying prospective customers as “active” or “inactive” (Reinartz & Kumar, 2000). In this model, knowledge, relevance, esteem, differentiation, technical skills, and managers’ authority are independent variables.
Ferrari and Cribari-Neto (2004) introduced the beta regression for proportion and percentage outcomes. This model is useful for situations where the variable of interest is continuous and restricted to the interval (0, 1) and is related to other variables through a regression structure. The regression parameters of the beta regression model are interpretable in terms of the mean of the response. The beta regression model is based on the assumption that the response is beta distributed. The beta distribution is very flexible for modeling proportions because its density can have quite different shapes depending on the values of the two parameters that index the distribution. The beta density is given by
where
Beta regression was applied to estimate customer share of wallet. We estimate share of wallet for existing customers and prospects using the six variables—knowledge, relevance, esteem, differentiation, technical skills, and managers’ authority. At first, the beta regression model was fitted to the whole data, following which we perform diagnostic analyses to check the estimated model goodness-of-fit. So for this purpose, we use graphical tools for detecting homogeneity of variance, influential observations (Cook’s D Bar Plot), and normality of residuals.
Finally, to estimate the value of CLV, the following equations were used for existing customers and prospects, respectively
where
Results and discussion
Here, we tend to present validity, reliability, and the results of analyses and hypotheses testing.
Validity and reliability
Fayers and Hand (2002) defined content validity as the extent to which items of a scale ultimately measure the relevant concepts without additional features. In this research, we used a questionnaire based on Stahl et al. (2012) and customized it to suit all requirements employing expert comments. Moreover, according to the knowledge of experts, who have a broad and deep knowledge, skill, and experience through practice and education in this particular field (elevator), technical skills and managers’ authority are the two other influential elements in predicting BE and CE. Technical skills refer to the ability and the knowledge to perform practical tasks that require the use of certain equip. Managers’ authority is defined as the organizational power of leaders, personal popularity, and reputation.
Reliability refers to the degree of the consistency of results and the extent to which the measurements are free from random and unstable errors (Cooper & Schindler, 2003). DeCoster (2005) recommended Cronbach’s alpha and split-half method as the most useful estimations of reliability. The results of Cronbach’s alpha are presented in Tables 2 and 3.
Reliability statistics of scales (effect of marketing activities on BE and CE).

Correlation of BE and its dimensions
Pearson’s correlation coefficient (r) is calculated to identify the relationship, direction, and strength of the linear relationship between BE and its dimensions. Correlation analysis indicated the significant relationship between overall BE and BE dimensions (Table 4). Multicollinearity is a common problem when estimating linear or generalized linear models. It occurs when there are high correlations among predictor variables, leading to unreliable and unstable estimates of regression coefficients. In general, an absolute correlation coefficient of >.7 among two or more predictors indicates multicollinearity (Booth et al., 1994; Tabachnick et al., 2007). Table 4 reveals that the correlation of differentiation with relevance and esteem was .743 and .850, respectively. These figures are substantially high, causing problems when you fit the model and interpret the results.
Pearson’s correlation coefficients for brand equity and brand equity dimensions.

Moreover, this is reflected in the fact that multicollinearity is acknowledged in about more than a third of the Journal of International Business Studies (JIBS) articles available online as of January 2019, in which authors compute variance inflation factors (VIFs) to determine whether a variable introduces “too much” multicollinearity into a regression analysis (Lindner et al., 2019). Just how much collinearity in terms of VIFs is too much varies from a high of 20 (Greene, 2003; Judge et al., 1988), to over 10 (Wooldridge, 2014), to as low as 5 (Rogerson, 2019) or even 3 (Read & Read, 2004). In addition to there being no agreement about just what is too much collinearity, there is a wide range of strategies to deal with it. One of the most frequent (Meyer & Sinani, 2009; Muethel & Bond, 2013; Zhao et al., 2014) excludes variables that have high partial correlations with other variables. So in this research, we exclude relevance and esteem, which have the highest correlation coefficient with differentiation.
The results show that among the four key components which comprise Young and Rubicam’s BAV model—knowledge, relevance, esteem, and differentiation—brand knowledge and brand differentiation have a positive and significant impact on BE. One way to measure multicollinearity is the VIF, which assesses how much the variance of an estimated regression coefficient increases if your predictors are correlated. The VIF is equal to 1.523, which indicates some correlation, but not enough to be overly concerned. In addition, Brand differentiation with the most significant standardized regression coefficient, 0.547, emerged as the variable with the most statistically significant influence on overall BE. The coefficient of determination (R2) is a measure of the percentage of the total variation in the dependent variable that is accounted for by the independent variable (Hamilton et al., 2015). According to Hair et al. (2011), R 2 values of .75, .50, or .25 for endogenous latent variables in the structural model can be described as substantial, moderate, or weak, respectively. In this research, the R2 value of BE (.471) is considered moderate, which suggests that about 50% of the dependent variable is predicted by the independent variables. Moreover, in some fields, it is entirely expected that your R2 values will be low. For example, studies that try to explain human behavior generally have R2 values of less than 50%. People are just harder to predict than things like physical processes (Baguley, 2009). In addition, the correlation between the variables is much higher than the average (about 70%), indicating that the linear regression model can effectively use for prediction (see Tables 4 and 5).
Linear regression coefficients for brand equity.
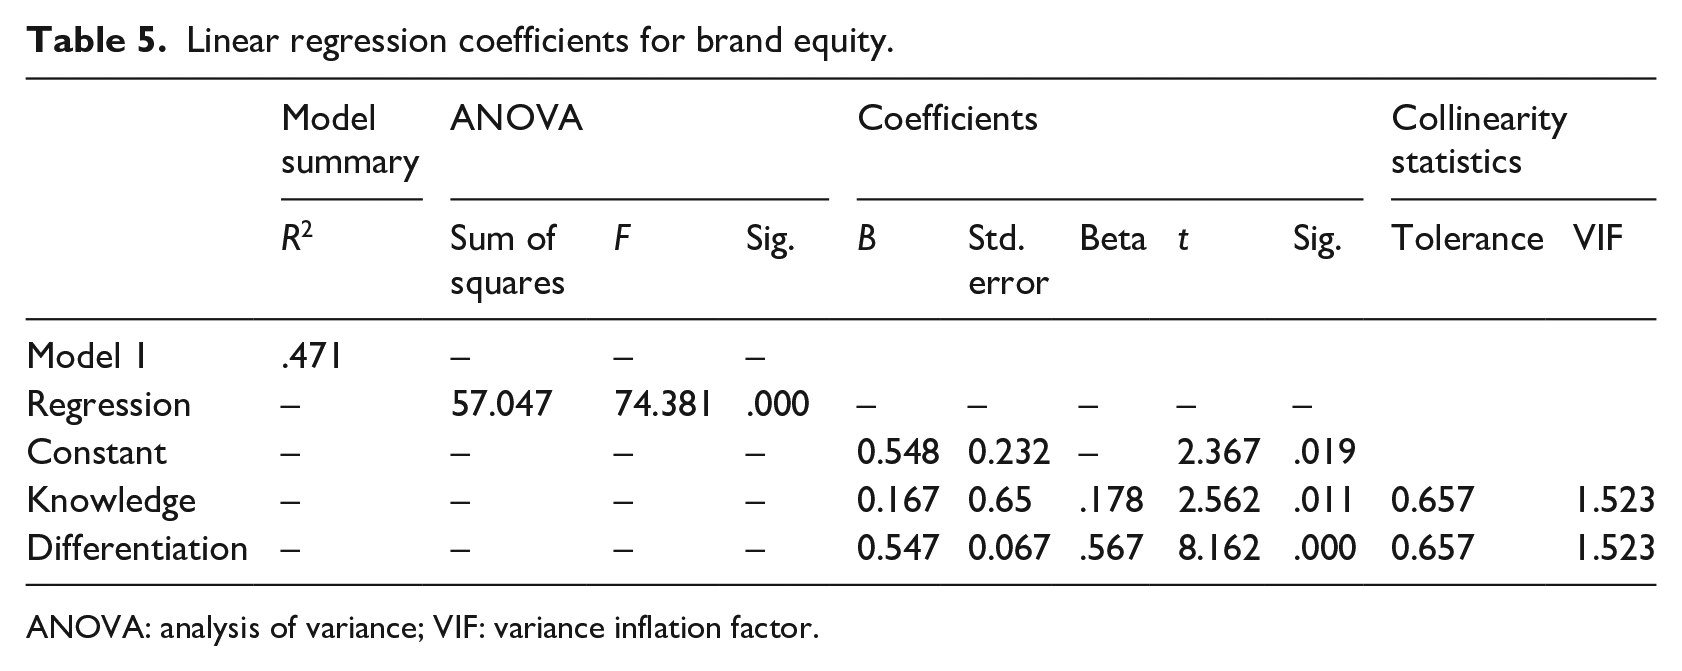
ANOVA: analysis of variance; VIF: variance inflation factor.
Hypotheses testing
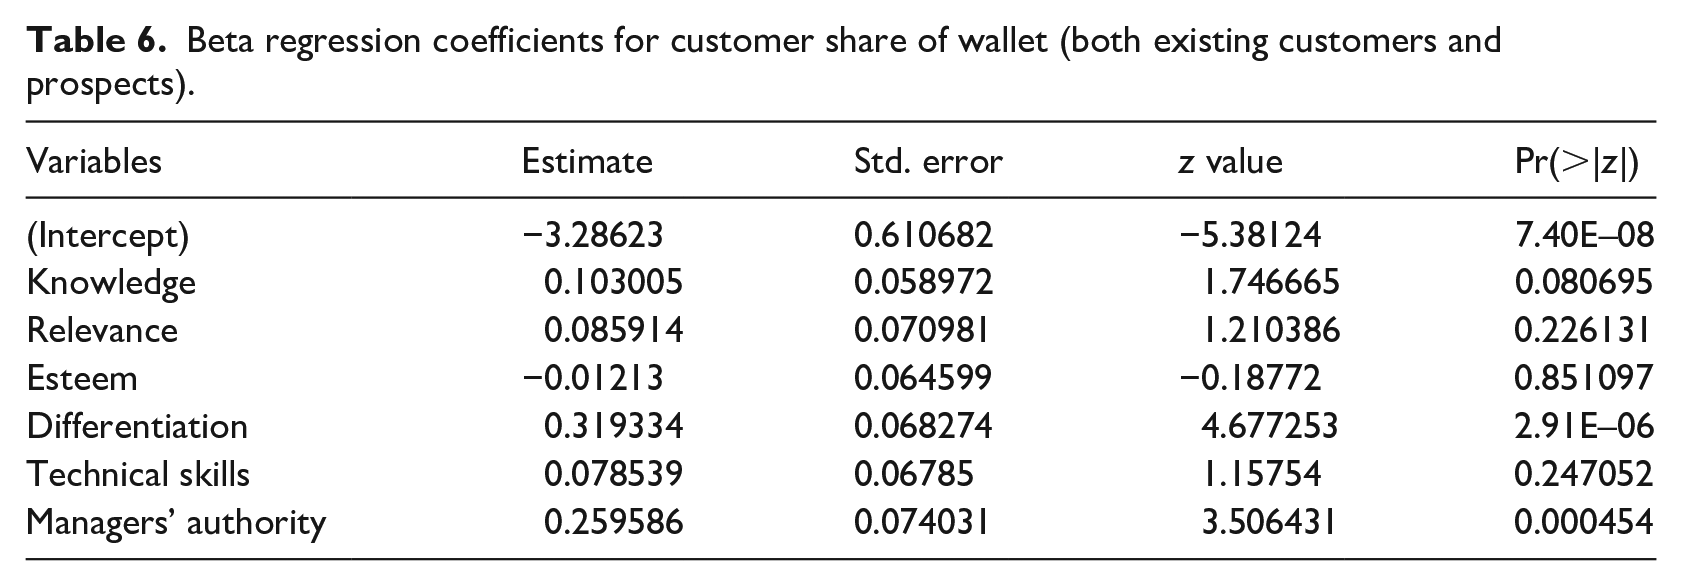
H1b, H2b, H3b, and H4b, respectively, depict that brand knowledge, relevance, esteem, and differentiation are related to customer share of wallet. We estimate share of wallet for existing customers and prospects using the six variables—knowledge, relevance, esteem, differentiation, technical skills, and managers’ authority (Table 6). At first, the beta regression model fitted to the whole data, following which we perform diagnostic analyses to check the estimated model goodness-of-fit. So for this purpose, we use graphical tools for detecting homogeneity of variance, influential observations (Cook’s D Bar Plot), and normality of residuals (see Figures 3–5, respectively).
Beta regression coefficients for customer share of wallet (both existing customers and prospects).
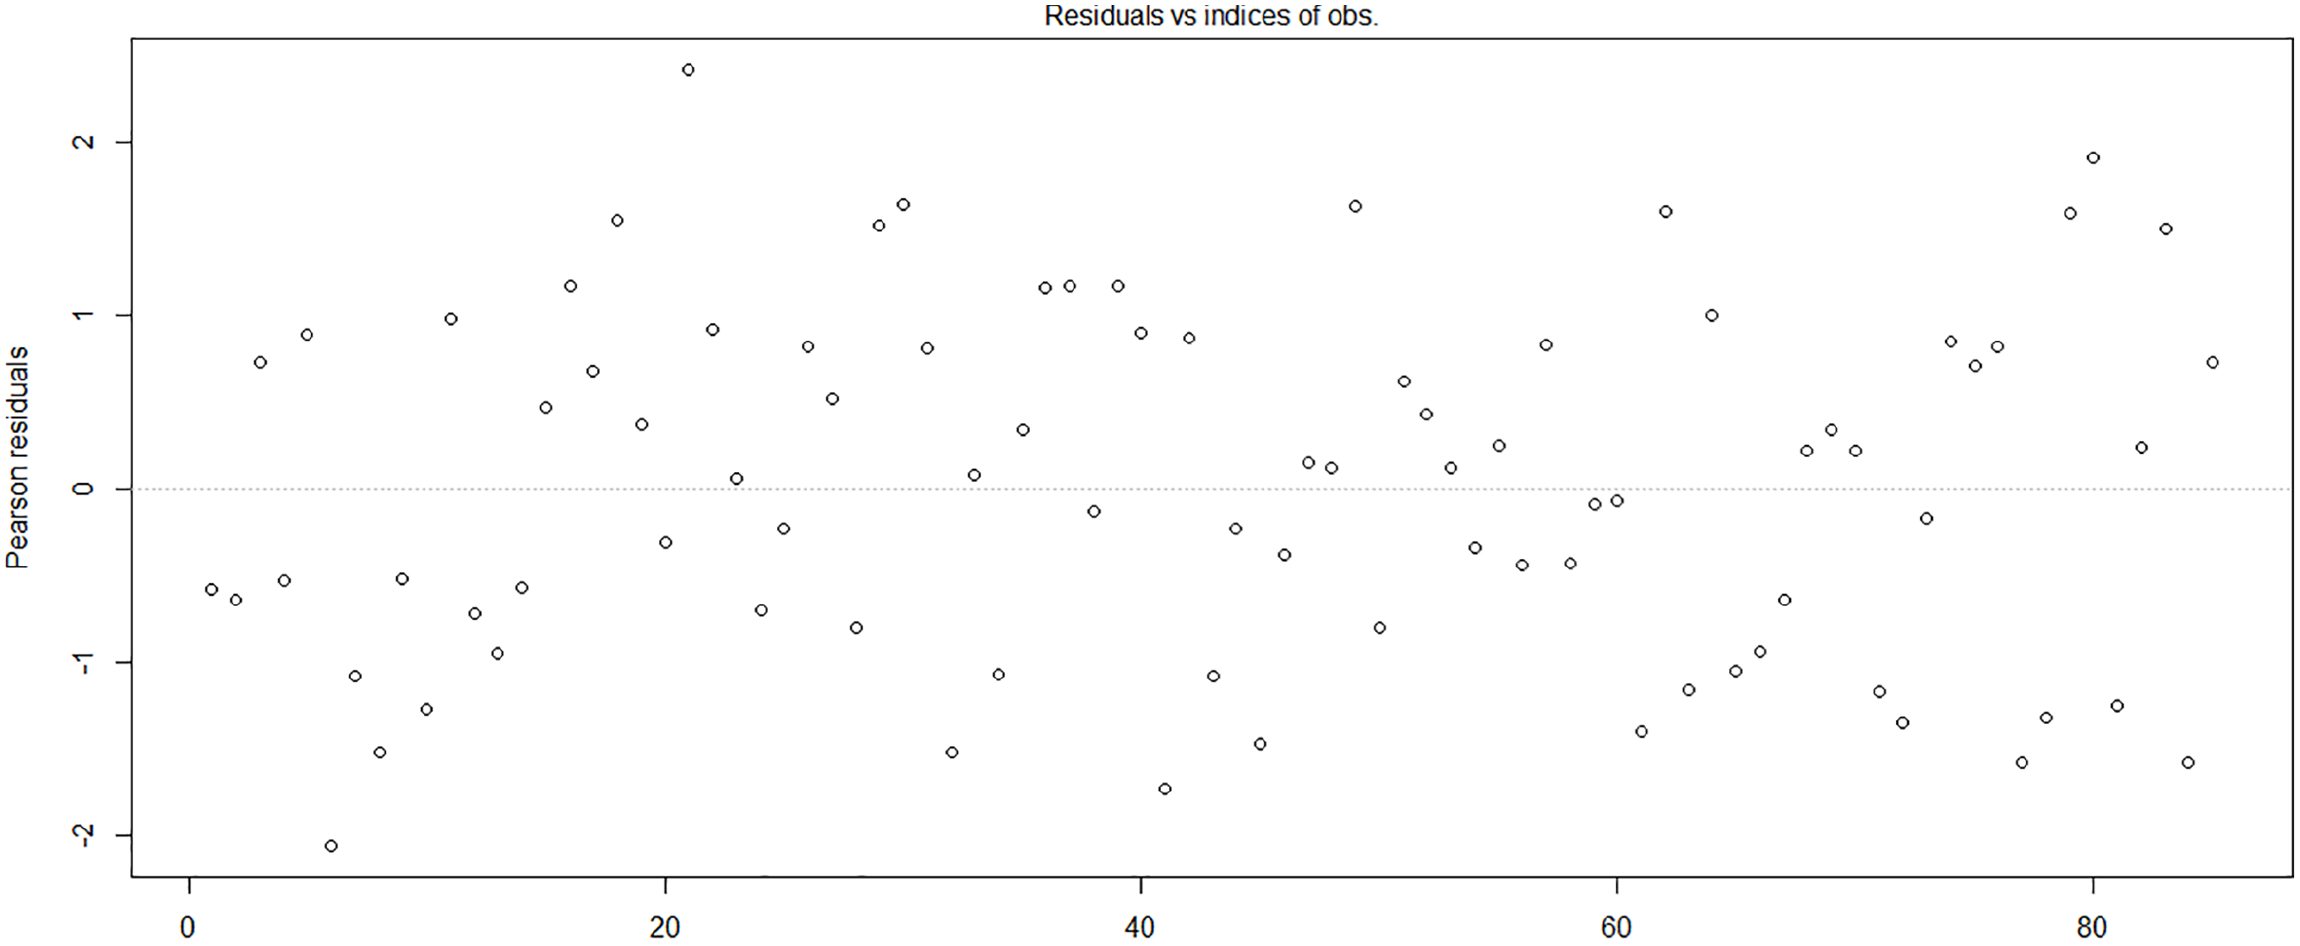
Diagnostic plot (homogeneity of variance).

Diagnostic plot (influential observations).

Diagnostic plot (normality of residuals).
As can be seen in Figure 3, the variance of the residuals is homogeneous because there is no clear pattern. Figure 4 shows that according to Cook’s measures, the 21st observation is the most influential. According to Bollen and Jackman (1985), we should compare it with a threshold of F0.05 (8.77) = 0.334. Finally, the results indicate that none of the observations are influential, and thus they have no difficulty in the fitting. Moreover, Figure 5 illustrates that this model has almost normal residuals. This model was then validated by leave-one-out validation on the existing customers’ data. The prediction error value equals 0.0168, which shows an excellent prediction as it is close to zero. According to Table 7, the correlation coefficient is .243, meaning that there is a statistically significant relationship between the estimated values and the actual values quoted by the customers. Finally, just H4b was supported. According to the related literature (Levav & Ariely, 2000; Ratner & Kahn, 2002; Stahl et al., 2012), it was expected that brand differentiation is positively responsible for the share of wallet for existing customers and prospects.
Spearman’s correlation coefficient between estimated amount of share of wallet by model and amount stated by customer.

Correlation is significant at the .05 level (two-tailed).
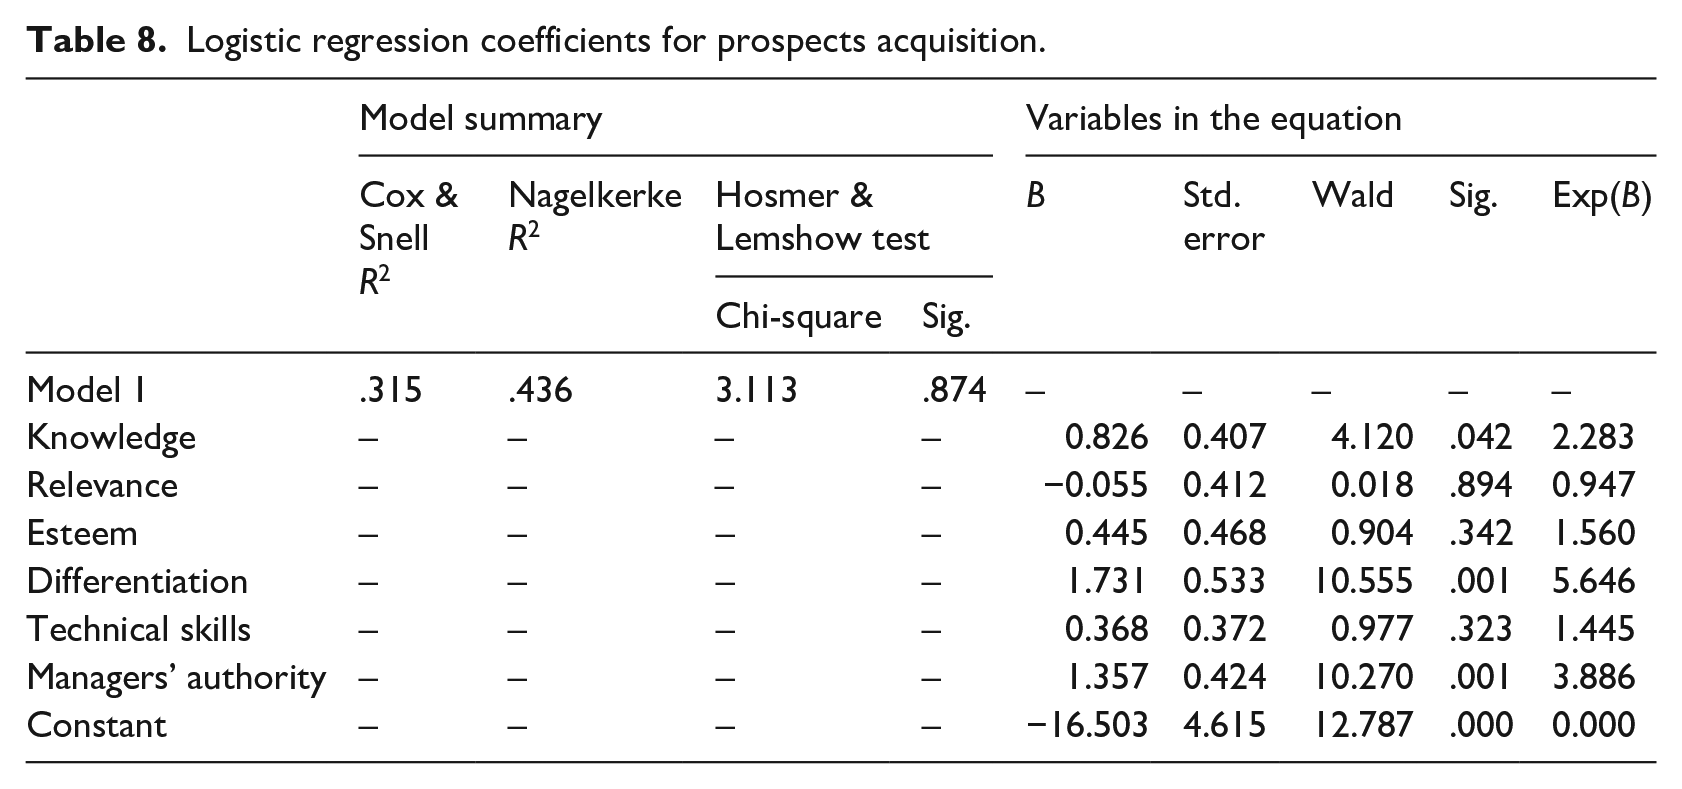
H1a, H2a, H3a, and H4a, respectively, illustrate that brand knowledge, relevance, esteem, and differentiation are related to customer acquisition. According to the results, H1a and H4a were supported. Based on the related literature (Carpenter & Nakamoto, 1989; Romaniuk et al., 2007), it was expected that brand knowledge and brand differentiation positively account for prospects acquisition. Regarding the model summary (Table 8), Cox–Snell and Nigel–Kirk coefficients were about 32% and 44%, respectively, which indicate the amount of variation in the dependent variable explained by the model. The Hosmer–Lemeshow test of the goodness of fit suggests that the model is a good fit for the data as p = .874 (>.05), meaning that the null hypothesis not rejected. The exponentiation of the B coefficient, Exp(B), known as an odds ratio, indicates the probability of occurrence of an event to its failure. If the B coefficient is less than 1, it means that by increasing the independent variable, the probability of occurrence of the event decreases. If the B coefficient is more than 1, it means that by increasing the independent variable, the probability of occurrence of the event increases. Table 8 reveals that Exp(B) for all significant variables of the logistic regression model applied in this research was more than 1, meaning that an increase in the level of knowledge, differentiation, and managers’ authority increases the level of prospects acquisition.
Logistic regression coefficients for prospects acquisition.
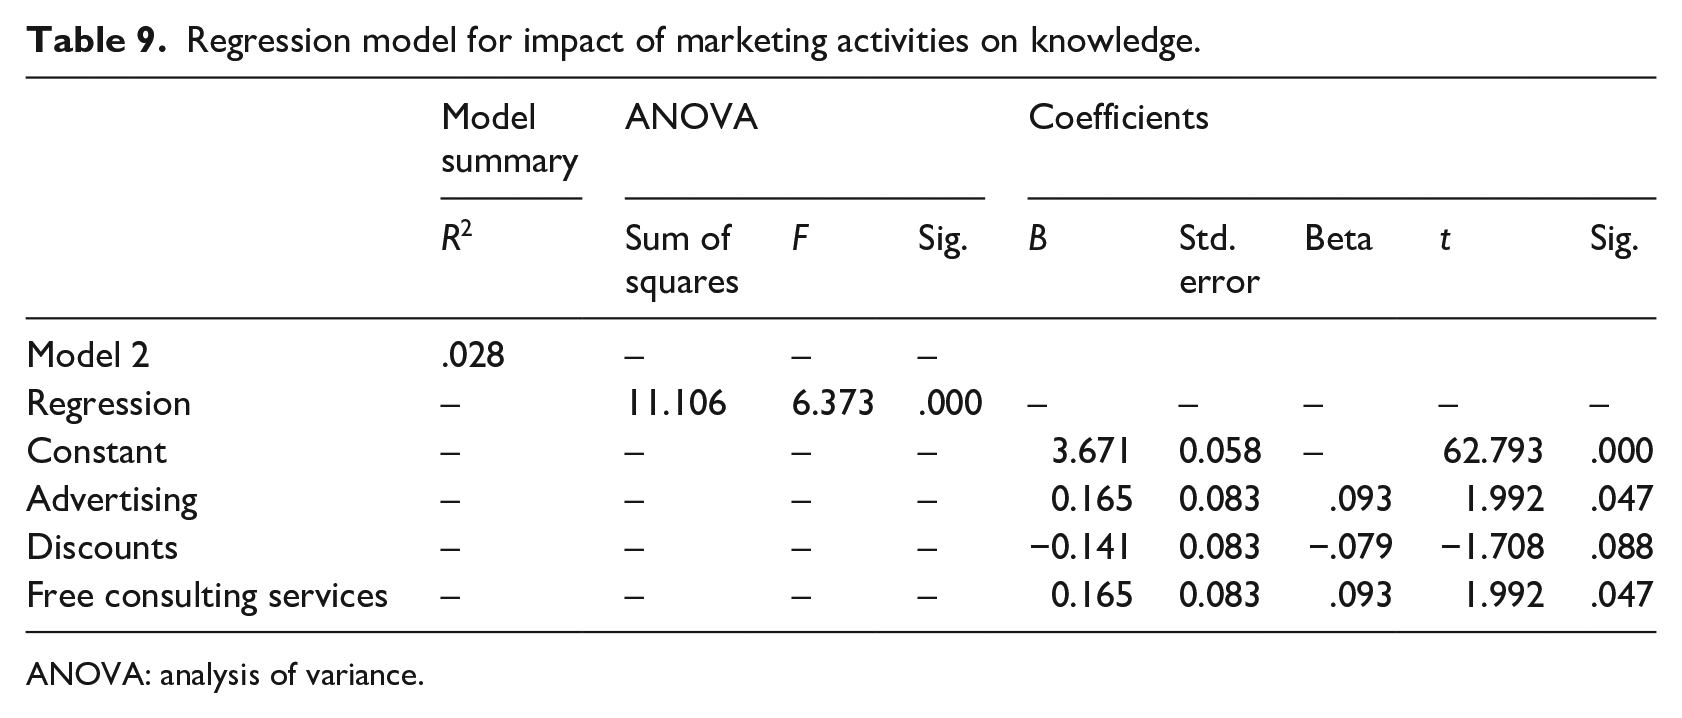
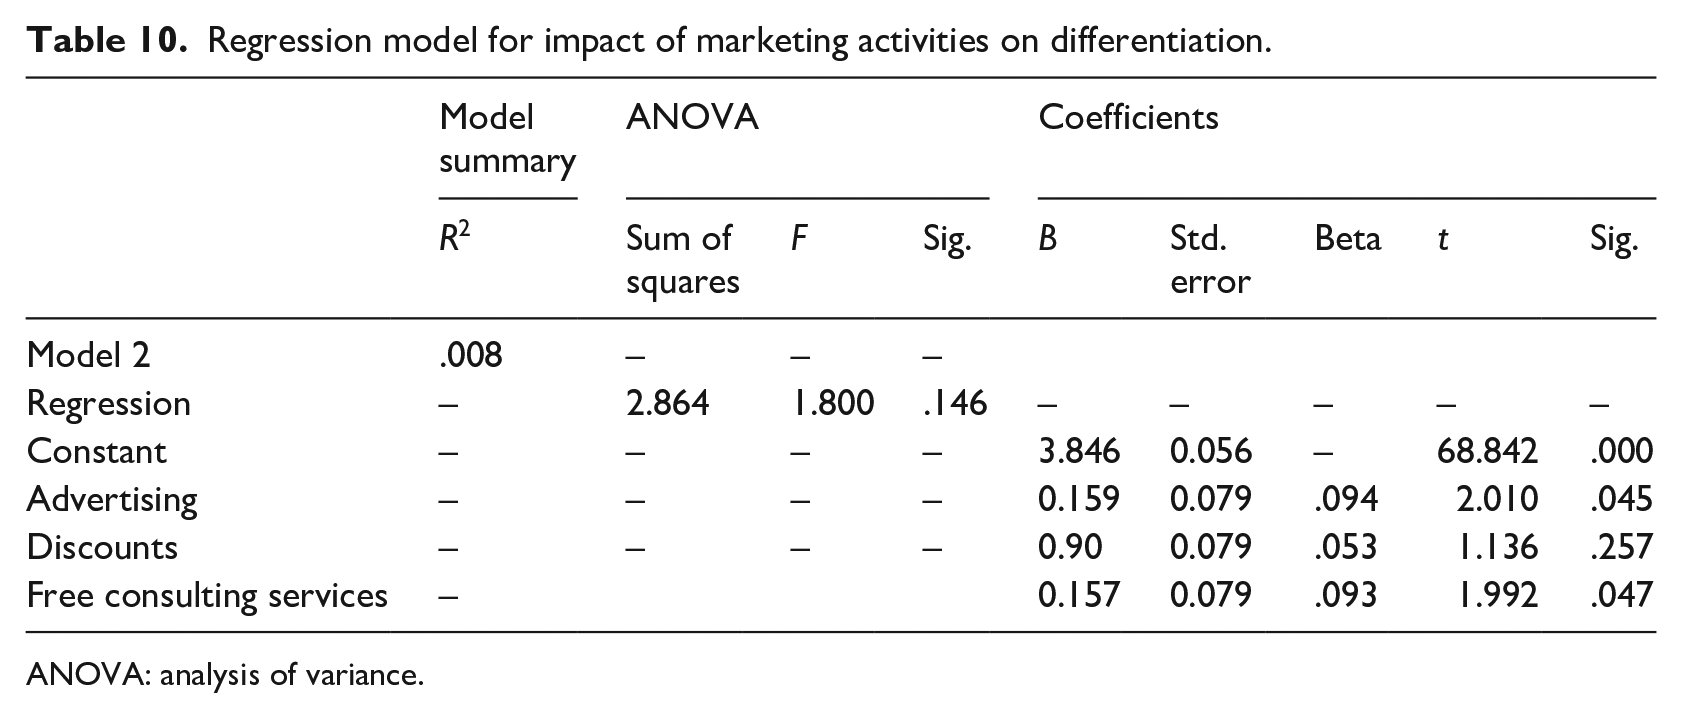
In H5a, H5b, H5c, H5d, H5e, H5f, H5g, respectively, we argued that advertising is related to brand knowledge, brand relevance, brand esteem, brand differentiation (the four critical elements of BE), customer acquisition, customer share of wallet, and marketing expenditures. Indeed, according to our research findings, knowledge (H1a) and differentiation (H4a) have a positive and significant impact on customer acquisition. Also, differentiation (H4b) has a positive and significant effect on customer share of wallet. As mentioned earlier, we excluded relevance and esteem due to their highest correlation coefficient with differentiation. Therefore, not only advertising increases the level of brand knowledge and brand differentiation significantly, but also it could indirectly increase customer acquisition and customer share of wallet through the mediating role of BE between marketing activities and CE. Finally, H5a, H5d, H5e, H5f, and H5g were supported, and H5b and H5c were not (see Tables 9 and 10).
Regression model for impact of marketing activities on knowledge.
ANOVA: analysis of variance.
Regression model for impact of marketing activities on differentiation.
ANOVA: analysis of variance.
In H6a, H6b, H6c, H6d, H6e, H6f, H6g, respectively, we argued that advertising is related to brand knowledge, brand relevance, brand esteem, brand differentiation (the four critical elements of BE), customer acquisition, customer share of wallet, and marketing expenditures. According to the results, H6a, H6b, H6c, H6d, H6e, and H6f were not supported, and H6g was supported. Surprisingly, unlike related literature review, in this specific industry (elevator), discounts have no significant impact on BE and CE elements (see Tables 9 and 10). Here, this is due to some significant codes addressing safety in design, construction, installation, operation, inspection, testing, maintenance, alteration, and repair of elevators, meaning that discount is not a proper marketing activity in this specific industry than those with seasonal products.
In H7a, H7b, H7c, H7d, H7e, H7f, H7g, respectively, we argued that advertising is related to brand knowledge, brand relevance, brand esteem, brand differentiation (the four critical elements of BE), customer acquisition, customer share of wallet, and marketing expenditures. According to our research findings, knowledge (H1a) and differentiation (H4a) have a positive and significant impact on customer acquisition. Also, differentiation (H4b) has a positive and significant effect on customer share of wallet. As mentioned earlier, we excluded relevance and esteem due to their highest correlation coefficient with differentiation. So, not only free consulting services increase the level of brand knowledge and brand differentiation significantly, but also it could indirectly increase customer acquisition and customer share of wallet through the mediating role of BE between marketing activities and CE. Finally, H7a, H7d, H7e, H7f, and H7g were supported, as well as H7b and H7c were not supported (see Tables 9 and 10).
Finally, the values of CLV for both existing customers and prospects were estimated using the equations outlined in the “Hypotheses development and methodology” section, customers share of wallet, and prospects acquisition values. CE was calculated using the

CLV cumulative values for existing customers.

CLV cumulative values for prospects.
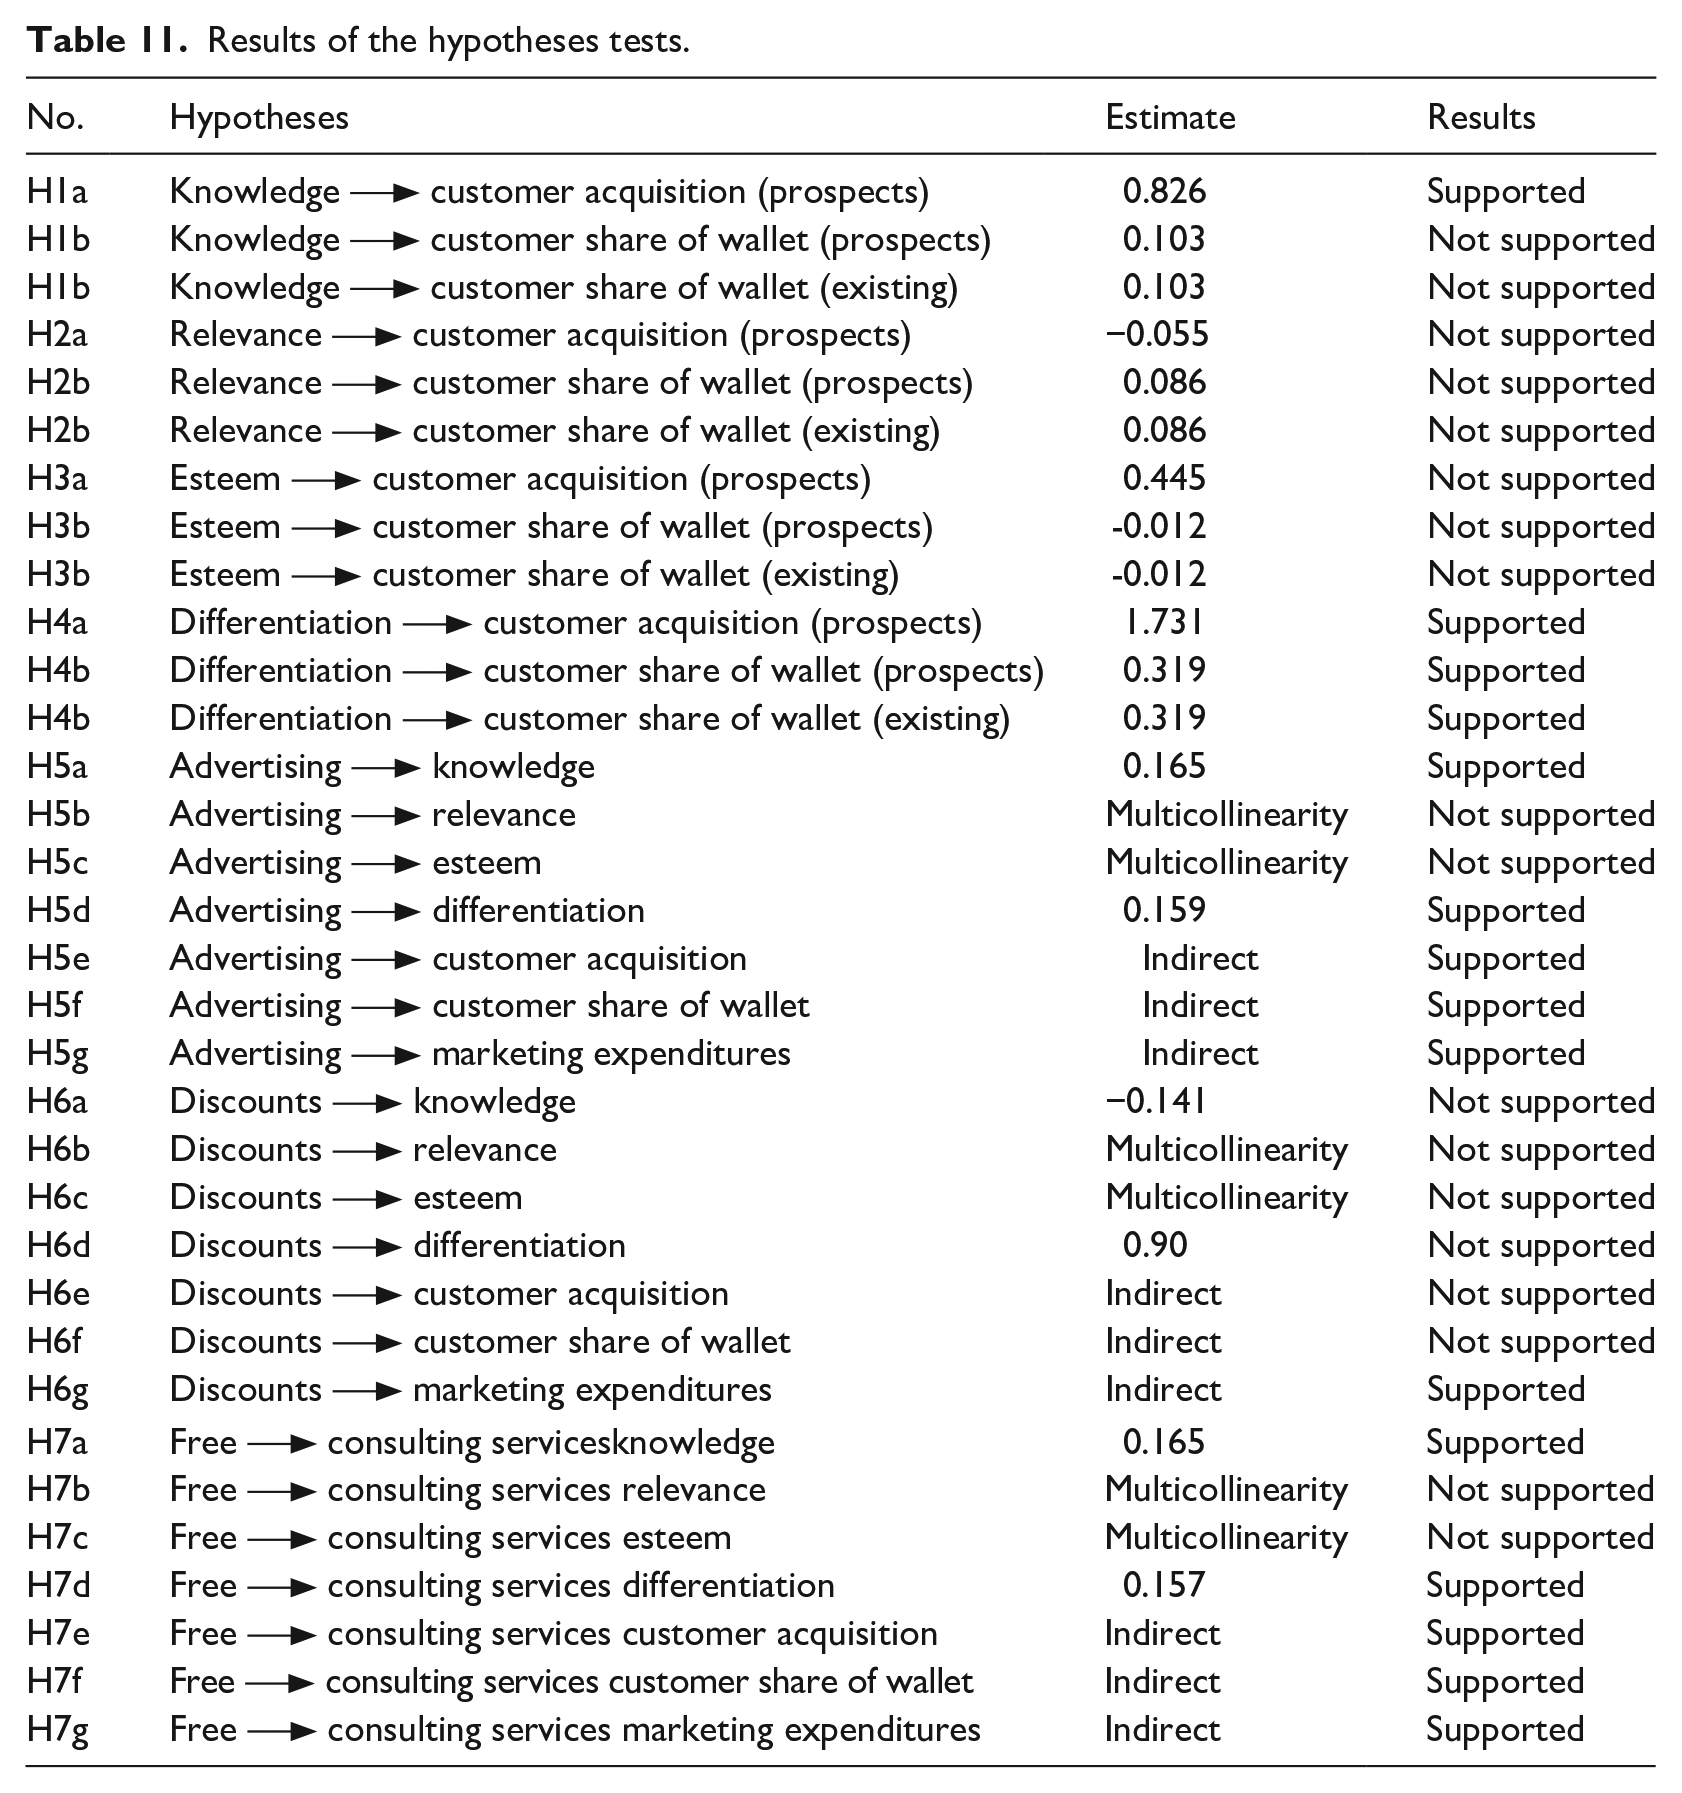
We summarized the results of the hypotheses tests in Table 11 and presented final research models based on the study results in Figures 8 and 9.
Results of the hypotheses tests.

Final research model (the relationship between BE and CE).

Final research model (impact of marketing activities on BE and CE).
Practical implications
This research demonstrates an integrated model for CE based on BE and estimates the effect of marketing activities on CE. Companies might consider marketing activities as useful tools to stimulate sales or market share in the short term. Also, it provides valuable managerial and practical implications for international branding strategies and marketing communication and practices.
The findings suggest that brand knowledge and brand differentiation can generate positive customer responses by improving CE elements through BE in this specific industry. We show that brand knowledge and brand differentiation not only have direct effects on BE but also an indirect impact on CE elements (acquisition and share of wallet), as suggested by Leone et al. (2006) and Stahl et al. (2012). Moreover, the correlation of differentiation with relevance and esteem was substantially high, meaning that brand differentiation is a good predictor for brand relevance and brand esteem. Also, the results of the current study are consistent with earlier studies regarding the effects of BE elements on CE, revealing that the four BE elements (brand knowledge, brand relevance, brand esteem, and brand differentiation) are critical components of BE that influence branding effectiveness and customer responses (Aaker, 1996; Gani & Grobler, 2014; Keller, 2003; Keller & Lehmann, 2006; Leone et al., 2006; Peppers & Rogers 2004; Rust et al., 2000; Stahl et al., 2012).
One can discern several implications for the existing theory. First, the results of the current study are consistent with those revealed in business-to-consumer research, confirming that brand knowledge is a significant element of BE (Keller & Lehmann, 2006; Stahl et al., 2012). Similarly, consistent with studies on service branding in business-to-business research, the current research shows that brand knowledge is imperative in driving BE (Davis et al., 2008). Results also indicate a significant and direct effect of brand knowledge on customer acquisition, meaning that enhancing customers’ brand awareness and strengthening customers’ perception of brand market performance can directly increase customer acquisition and consequently increase CE.
Second, results provide possible explanations to reconcile conflicting observations regarding brand differentiation and encourage additional investigation of the role of brand differentiation in industrial brands (Stahl et al., 2012). The current study shows that brand differentiation is imperative in driving BE. Results also indicate a significant and direct effect of brand differentiation on customer acquisition and customer share of wallet, which is consistent with studies on BE and CE (Day & Wensley, 1988; Levav & Ariely, 2000; Ratner & Kahn, 2002; Romaniuk et al., 2007; Stahl et al., 2012). Although the current study’s results reveal a non-significant direct effect of brand relevance and brand esteem on BE and CE, these two BE elements indirectly affect both BE and CE through the high correlation of differentiation with relevance and esteem.
Another contribution to the literature is the effect of marketing activities on each of the elements of BE and CE. The current study’s results indicate that advertising and free consulting services directly affect BE elements, meaning that they indirectly affect CE elements (acquisition and share of wallet) through increasing brand knowledge and differentiation significantly. In other words, advertising spends on a brand can increase the scope and the frequency of brand appearance, and consequently, brand awareness (Chu & Keh, 2006; Keller, 2007). As differentiation increases, the substitutability of one brand for another decreases, and consumers become less price elastic (Boulding et al., 1994; Chakravarti & Janiszewski, 2004).
Although Dhar and Wertenbroch (2000) and Stahl et al. (2012) indicate a significant and direct effect of discounts on BE and CE elements, the current study’s results reveal a direct non-significant impact of discounts on BE and CE elements, which is consistent with earlier studies (Dodson et al., 1978; Shoemaker & Shoaf, 1977; Strang et al., 1975). Discounts hurt CLV through both reduction in BE and average revenue. On the direct impact, it was expected that monetary promotions would have a negative impact on perceived quality and brand associations. Price is one of the essential cues used by consumers to infer a product (Agarwal & Teas, 2002; Dodds et al., 1991; Milgrom & Roberts, 1986; Rao & Monroe, 1989). Price promotions may reduce reference prices, which can lead to unfavorable quality evaluations (DelVecchio et al., 2006; Mela et al., 1998; Raghubir & Corfman, 1999; Suri et al., 2000). Similarly, monetary promotions can erode brand associations. According to Montaner and Pina (2008), these types of promotions harm the brand image. In addition, these campaigns are not long enough to establish long-term brand associations and can create uncertainty about brand quality (Nikabadi et al., 2015; Selvakumar & Vikkraman, 2011; Valette-Florence et al., 2011; Winer, 1986), which results in more negative brand perceptions. Also, the frequent use of price promotions has a negative impact on perceived quality and brand association dimensions because this tool leads consumers to think primarily about price and not about the brand (Yoo et al., 2000). Another critical concern is the price. Lower prices hurt margins (especially if other retailers strive to match discounter prices), reputation, and CE (Ailawadi et al., 2003; Andrews et al., 2014; Wiesel et al., 2008). So, our results substantiate previous findings in the literature.
Conclusion
This study provides an in-depth investigation of the relationship between BE and CE, as well as calculates the effect of marketing activities on CE, a scarcely researched topic, and makes two contributions. First, it provides an integrated model for CE estimation based on BE. Second, this research offers valuable managerial and practical implications for international branding strategies and marketing communication and practices.
This study provides evidence of BE and CE’s importance in influencing customer responses for industrial brands beyond the commonly discussed product brands. This research investigates the effects of BE and marketing activities (advertising, discounts, and free consulting services) on CE, conducting multiple regression, beta regression, and logistic regression analyses.
To the best of our knowledge, this is the first model that can quantify CE using BE. However, a recent review of the literature on this topic shows that the relationship between them has been investigated widely by the researchers, there was still no numerical model for this critical issue. In addition, by having the marketing activities in the proposed model, we were able to calculate the effect of these activities on CE in a numerical form (Ailawadi et al., 2003; Blattberg et al., 2009; Chun et al., 2013; Huang & Sarigollu, 2012; Kim, 2015; Kim & Brandon, 2010; Leone et al., 2006; Raithel et al., 2016; Segarra-Moliner & Moliner-Tena, 2016; Srinivasan et al., 2005; Stahl et al., 2012; Venkatesan & Kumar, 2004; Yang et al., 2014; Zhang et al., 2010).
In conclusion, results provide practical guidelines for managers and marketers in the elevator industry to balance their resources and efforts in marketing activities to improve marketing effectiveness. The mediating role of BE between marketing activities and CE could help managers understand marketing activities’ role in consumers’ evaluation and decision-making processes. Managers should provide more accurate estimations of marketing efforts and organize information input in a more integrated manner to facilitate message processing and attitude accessibility results in increased behavior intention.
Footnotes
Declaration of conflicting interests
The author(s) declared no potential conflicts of interest with respect to the research, authorship, and/or publication of this article.
Funding
The author(s) received no financial support for the research, authorship, and/or publication of this article.
