
Abstract
In this study, we aimed to understand and reduce the difference between self-report in a survey and the actual behavior. Thus, we investigated whether such a difference was caused by participants who engaged in insufficient effort responding (IER), which has been receiving increasing research attention. We collected and analyzed data of actual and self-reported smartphone game usage from behavior logs and survey responses including the items associated with the IER scale, respectively. The results confirmed a strong tendency of overreporting and low correlations between the behavior log and survey responses for IER participants. Although the distributions of survey responses differed between IER participants and others, those of the behavior log did not. In conclusion, when IER participants are excluded, the difference between the behavior log and survey responses reduces, but the distribution of the actual behavior remains the same without selection bias.
Introduction
Due to the high applicability, questionnaire-based surveys are widely used not only for practical marketing research and social surveys but also for academic research—mainly in the social sciences such as economics, business administration, psychology, sociology, environmentology, and pedagogy. However, differences between self-reports and the actual behavior have been widely confirmed in prior studies (e.g., Araujo et al., 2017; Collopy, 1996; De Reuver & Bouwman, 2015; Junco, 2013; Lee et al., 2000; Prior, 2009; Vanden Abeele et al., 2013). When survey responses do not accurately reflect actual behaviors, the survey results are biased, and their validity is reduced. This can lead to erroneous conclusions, such as identifying the wrong behaviors or predictors through research.
Meanwhile, various studies on the improvement of survey accuracy have also been conducted, such as those related with response styles, data collection, and data quality in the marketing field (e.g., Baumgartner & Steenkamp, 2001; Brosnan et al., 2019; Goodman & Paolacci, 2017; Kees et al., 2017; Liu & Wronski, 2018; Meyvis & van Osselaer, 2018; Paas et al., 2018; Weijters & Baumgartner, 2012). In addition, in recent years, with the widespread implementation of both surveys and experiments online, more attention has been paid to studies that identify or explain the careless, inconsistent, or random responses by some participants who are not motivated or willing to answer appropriately (e.g., Bowling et al., 2016; Curran, 2016; Huang et al., 2012, 2015; Meade & Craig, 2012; Paas et al., 2018; Special Issue in 2018 on Applied Psychology: An International Review).
These inappropriate responses due to insufficient motivation are called Insufficient Effort Responding (IER), and many methodologies have been proposed to distinguish whether a participant is engaging in IER (e.g., Curran, 2016; Huang et al., 2012, 2015; Johnson, 2005; Meade & Craig, 2012; Oppenheimer et al., 2009). Although some of these studies deal with them by, for example, increasing participants’ internal motivation (Maniaci & Rogge, 2014) or assigning them personally identifiable surveys (Meade & Craig, 2012), many studies mention the exclusion or screening of IER participants as a realistic approach (e.g., DeSimone & Harms, 2018; Dunn et al., 2018; Jia et al., 2018; Meade & Craig, 2012; Ward & Pond, 2015). In fact, many empirical marketing studies also employ these identification techniques to exclude a defective sample (e.g., Beck et al., 2020; Bond et al., 2019; Consiglio & van Osselaer, 2019; Fernandes et al., 2016; Jung et al., 2022; Klein et al., 2019; Laran et al., 2019; Yang et al., 2018).
However, the extent to which IER actually causes the differences between survey responses and actual behavior is yet to be clarified. Therefore, (1) we investigate the extent of the impact of IER participants—who are identified using the IER technique—on the difference between survey responses and actual behavior and the validity, compared to that of other participants; (2) Although IER participants are generally excluded from analyses, we examine whether such exclusions cause selection bias and result in a loss of representativeness. This study aims to improve the accuracy of marketing research and its empirical methods by understanding and reducing the difference between self-report and the actual behavior in surveys.
The rest of the paper is organized as follows. In the next section, we describe the research questions of this study, based on the prior studies related with IER and the comparison of self-reported and objective facts. Subsequently, we present an overview of the behavior log and survey responses data, respectively. Further, we compare responses with the actual behavior and clarifies the associations between IER and the discrepancies. In addition, we examine whether the distributions of behavior logs differ between participants with and without IER and explore the possibility of excluding those who engage in IER from the analysis. Finally, we sum up the results and discuss the implications and limitations of this study.
Background
A Comparison Between Self-Reports and Objective Facts
As the widespread use of the Internet and digital devices has made it possible to collecting large-scale data from consumers, combining survey responses and behavior log data has received attention (e.g., Groves, 2011; Kreuter et al., 2020; Stier et al., 2020). Combining them, e.g., enables studies that capture both actual behavior and psychological attributes from behavior log and survey responses, respectively (e.g., Kosinski et al., 2013; Nakano & Kondo, 2018; Stopczynski et al., 2014), or that compare actual behavior and self-reports in communication studies.
In fact, by comparing these data, many studies have demonstrated a discrepancy between self-reports and the actual behavior. Such comparative studies have been actively conducted in communication-related fields, such as web browsing (Araujo et al., 2017; Scharkow, 2016), use of mobile devices (Boase & Ling, 2013; De Reuver & Bouwman, 2015; Deng et al., 2019; Vanden Abeele et al., 2013), and TV-watching (Nenycz-Thiel et al., 2013; Prior, 2009). As a critical implication, those studies indicate that self-report falls into overreporting, compared to actual behavior. (e.g., Araujo et al., 2017; Boase & Ling, 2013; Deng et al., 2019; Prior, 2009; Scharkow, 2016). For instance, Deng et al. (2019) compared self-report with the behavior log for smartphone usage, and found that the use time is widely overestimated both in many individual categories of smartphone apps and the total use time. In De Reuver and Bouwman (2015) as well, some or total overestimations were found in categories such as games, maps, online music, and news. Further, many studies in the communication field have reported only weak-to-moderate correlations between self-reports and actual behavior (Araujo et al., 2017; Boase & Ling, 2013; De Reuver & Bouwman, 2015; Scharkow, 2016); i.e., the validity of survey responses is not high.
In addition to the combination of behavioral log and survey responses, in educational studies, self-reported and the actual grades (e.g., GPA, school records) or entrance exam scores have long been compared, showing that self-reported scores are higher than actual ones and that there is a relatively high positive correlation between them (e.g., Cole & Gonyea, 2010; Dunnette, 1952; Kirk & Sereda, 1969; Kuncel et al., 2005; Mayer et al., 2007; Perry, 1940). In environmental studies, self-report and objective facts are compared as well (e.g., Corral-Verdugo, 1997; Corral-Verdugo & Figueredo, 1999; Corral-Verdugo et al., 2003; Delley & Brunner, 2018; Elimelech et al., 2019; Moore & Rutherfurd, 2020). A meta-analysis of existing studies in proenvironmental behavior by Kormos and Gifford (2014) found that self-report could not explain 79% of the variance in objective behaviors and that some overreporting occurred.
As a background of these systematic biases such as overreporting, the impact of social desirability, including maintaining pride or self-esteem, is often discussed in educational or environmental studies (e.g., Cole & Gonyea, 2010; Kormos & Gifford, 2014; Kuncel et al., 2005; Moore & Rutherfurd, 2020). However, even in such situations, participants do not always overreport their behavior. They report their behaviors and attitudes by distorting them as socially desired, which results in overreporting or underreporting. In fact, in proenvironmental behavioral studies, Delley and Brunner (2018) found that a substantial level of underreporting in food waste behaviors may be occured. Likewise, in communication studies, participants should be highly motivated to engage in underreporting since the excessive use of smartphones or the Internet is not a socially desirable behavior in terms that they are pointed out to be related with addiction (e.g., Chou et al., 2005; Lin et al., 2014, 2015). Therefore, the reason for the lower validity and consequent overreporting in such responses may involve IER, as discussed below.
Insufficient Effort Responding and Response Behavior
A definition of IER is “a response set in which the respondent answers a survey measure with low or little motivation to comply with survey instructions, correctly interpret item content, and provide accurate responses” (Huang et al., 2012, p. 100). Participants who engage in IER may give not only truly random responses but also non-random, careless, or inconsistent ones. Non-random responses here indicate not random but meaningless response patterns, such as straightlining (Herzog & Bachman, 1981), in which participants give identical responses for each item in the scale. In addition, the occasional careless response in some parts of a survey could lead to inconsistencies throughout the survey (Meade & Craig, 2012); these responses lead to the discrepancy between the actual and reported behavior. Such inappropriate responses not only contaminate the data quality but could also improperly capture the construct in which researchers and practitioners are interested. Regarding the survey error, satisficing (Krosnick, 1991; Simon, 1956) has been studied as well, which is almost synonymous with IER, and some treat it as a similar concept (e.g., Baumgartner & Weijters, 2019; Steedle et al., 2019; Ward & Pond, 2015). 1
These factors cause participants’ carelessness since they essentially affect the motivation toward a survey, which is related to participants’ attitudes of whether they respond to the survey with sufficient effort, including deliberation. Therefore, inappropriate responses such as IER occur when participants are not sufficiently motivated. As evidence, they have been shown to complete the survey with a shorter response time (Wise & Kong, 2005). In other words, survey error by IER differs from that by socially desirable responding in which participants read questions and items carefully and give self-disguised answers in order to give a better impression to others (Grau et al., 2019).
The measurement error stemming from IER might harm the validity of the survey (e.g., AlQuraan, 2019; Oppenheimer et al., 2009; Silber et al., 2019) and cause systematic errors. Systematic errors, in particular, have been pointed out to be a risk for overreporting in the results (e.g., Merckelbach et al., 2017; Meyer et al., 2013). Meyer et al. (2013) investigated the impact by dividing the participants into three groups: those who responded cooperatively, those who responded inattentively, and those who responded randomly. They found that the means of the scale scores related to Internet use in the inattentive and random groups were significantly higher than those in the cooperative group.
Thus, IER may have an undesirable impact on survey results, and detection methods can be broadly divided into two types: inserting specific scales or items in the survey and using post-hoc analysis on obtained responses (Huang et al., 2012). The former includes Instructional Manipulation Check (IMC; Oppenheimer et al., 2009; Paas et al., 2018), which detects inappropriate responses by examining whether participants follow the specified instructions; bogus items (Meade & Craig, 2012) and an IER scale (Huang et al., 2015), which obtain responses to items that are obvious or obviously untrue; and self-reports on response quality (Meade & Craig, 2012), asking participants to evaluate the quality of their responses.
The latter includes LongString (Huang et al., 2012; Meade & Craig, 2012), which counts straightlining responses in a scale; a short response time (Huang et al., 2012; Meade & Craig, 2012), which identifies participants who quickly finish the survey by measuring their response time; and consistency indices (Meade & Craig, 2012), which indicate within-person consistency of responses by measuring the correlations among items that are expected to have high similarity. Consistency indices have variations depending on how the items are grouped, such as psychometric antonym (Johnson, 2005; Meade & Craig, 2012), which computes correlation coefficients among negatively related items, and even-odd consistency (Johnson, 2005; Meade & Craig, 2012), which computes among subscales formed by even-odd splits of the scale.
Some researches imply how IER should be addressed. For instance, some approaches, such as changing surveys from an anonymous to non-anonymous format (Meade & Craig, 2012), increasing participants’ internal motivation (Maniaci & Rogge, 2014), presenting warning instructions (Huang et al., 2012; Ward & Pond, 2015), and combining a display of survey administrators such as a virtual human and warning instructions (Ward & Pond, 2015), have been found to reduce IER. These methods are useful in that any of them basically aim to increase participants’ motivations or sense of responsibility, which can be the cause of IER; however, they are, in fact, relatively less feasible for the following reasons. First, signed questionnaires are not used for privacy reasons. Second, market research companies recruit survey participants by providing external incentives, so it is difficult to use internal motivations based on personal interests. Furthermore, Paas et al. (2018) found that cautions or warnings issued at the beginning of a survey, compared to no warnings, reduce the IMC failure rate that investigates whether participants follow the instructions; however, the effect could be lost with repeated surveys.
Research Questions
Based on the research background, we focus on the difference between self-reports in surveys and the actual behavior. This study aims to answer two main research questions (RQs) by focusing on IER as a cause of this discrepancy and a measure to reduce it.
Since this RQ has, to the best of our knowledge, yet to be clarified, both the validity and the extent of systematic bias should be investigated depending on whether the participants engage in IER or not, respectively. The reason IER participants give careless or inconsistent answers in the first place is that they have little interest in the survey or little internal motivation to do so (e.g., Huang et al., 2012, 2015; Meade & Craig, 2012). In this case, since they have little incentive to provide adequate and factual responses, the responses should be more random and inconsistent than those of non-IER participants. Therefore, regarding the survey validity, the following hypothesis is established.
When comparing survey responses and the actual behavior, the correlation coefficient for the IER participant group would be lower than that for the non-IER one. Second, although it has already been pointed out that IER as a systematic bias may affect overreporting (Meyer et al., 2013), this result is solely based on a comparison of mean values of the scale between the experimental conditions. Therefore, it is important to compare and verify the survey responses and actual behavior. Comparisons between survey responses and the actual behavior in prior studies show the general tendency of overreporting (e.g., Araujo et al., 2017; Boase & Ling, 2013; Deng et al., 2019; Prior, 2009; Scharkow, 2016). Since the response can be infinite upward while zero-bounded downward (Lee et al., 2000), responses with low validity, such as IER, may have a larger effect on overreporting. Therefore, regarding the extent of systematic bias, another hypothesis is established.
When comparing survey responses and the actual behavior, the IER participant group would engage in overreporting more than those in the non-IER group. Although participants identified as using IER are actually excluded from the sample in marketing studies, it is doubtful that they can be easily excluded. Excluding participants from the data can cause selection bias (Lu et al., 2019) or violate the assumption of random sampling (Ward & Pond, 2015) and result in the severe problem of losing the representativeness of the results. Therefore, we build another RQ as follows.
To answer these RQs and hypotheses, we collected two kinds of comparable data of survey responses and the actual behavior, compared them, and examined the relationship with and possibility of excluding IER. For comparisons, we obtained both the behavioral log data of smartphone game applications and survey response data, including the time spent using game applications and the IER scale (Huang et al., 2015), and compared their correlations, means, and distributions. Moreover, this study administered two comparisons in different survey periods to demonstrate that the scale was robust enough to capture inadequate responses.
In addition to the verification above, in case IER is associated with a discrepancy between survey responses and the actual behavior and the exclusion does not cause selection bias, IER should be the explanatory factor for the survey response but not for the behavior log. Lu et al. (2019) argue that exclusion involves selection bias risk since intention or individual attribution differs depending on whether participants engage in IER or not. However, what they actually show in the study is only a difference in survey responses between IER and non-IER, which has yet to be validated using the behavioral log. In other words, the survey accuracy remains unclear, especially for IER participants. Therefore, this study investigates whether IER can explain the usage duration both for the behavior log and survey responses under demographics controlled and aims to provide additional evidence that IER is not related with the actual behavior.
Method and Procedures
An Overview of Data Collection
We acquired two datasets: behavior log and survey response data. Both datasets were collected with the single-source panel (INTAGE Single Source Panel, i-SSP) administered by INTAGE Inc, one of the largest market research firms in Japan. This panel consists of residents in Japan aged 15–69 years, and the market representativeness is ensured by sampling the participants along with the demographic statistics of Internet users in Japan (Nakano & Kondo, 2018).
It should be noted that we were not involved with the management of the survey panel. Although we acquired the common IDs to merge the behavioral log and survey responses in accordance with the company’s privacy policy, no personally identifiable information was obtained. 2
Behavior Log Data
First, regarding the behavior log data, participants in the i-SSP who provided their consent in advance to data collection installed an app on their smartphones so that the usage log could be automatically collected. When participants operate their smartphones, the app name and the launch and termination time are recorded so that we can capture what apps, when, and how long participants launch. In this study, as described below, we were provided with the behavior log data for all game apps for each of the three months from February to April 2018 (Term I) and November 2018 to January 2019 (Term II) for 803 participants. However, the log does not contain apps that operate in the background, regardless of the intention of the participants.
Survey Response Data
Second, regarding the survey response data, two online surveys were conducted during May 17–21, 2018 (corresponding to Term I) and during February 1–5, 2019 (Term II). The number of participants who consented, participated the survey, and can be merged with the behavior log was 803 (504 male and 299 female). By age groups and survey periods, the twenties and under are 153 (Term I), 124 (Term II); the thirties are 197, 201; the forties are 197, 201; the fifties are 170, 177; and the sixties are 139, 149, respectively.
In the first survey, in May 2018, participants were asked to declare their average daily use (in minutes to the first decimal place) of smartphone game apps over the last three months, 3 corresponding to Term I. “Never” was selected if participants had never played the game apps in the period. Participants completed the survey by answering additional questions about the game apps that are not related to this study. In the second survey, in February 2019, the same participants as in the previous survey answered the same questions about the game app as in Term I and four additional items from the IER scale (Huang et al., 2015). The IER-related questions were interspersed among the unrelated items.
Variable Description
Average Daily Duration and the Difference Between Datasets
To investigate the difference between the actual and reported usage in each term, we calculated the respective usage durations from the behavior log and survey responses. First, we obtained the actual usage by averaging the total duration per day in minutes for each participant and each term of log data for all the apps categorized as a game. Second, we employed the survey responses as self-reported usage in each term of the respective surveys (“Never” was replaced with zero). Finally, the difference was calculated for each term as the subtraction of the actual usage from the self-reported one.
The IER Scale
IER is sometimes identified with multiple indices (e.g., Meade & Craig, 2012); however, it is unfeasible to employ too many methods or to accommodate a too-long scale in the actual survey. Huang et al. (2015) showed that the IER scale, which does not contain many items, is an efficient and suitable index associated with other indices such as psychometric antonym, self-report, and response time and that it triggers fewer negative reactions. 4 In particular, since participants may engage in multiple surveys or experiments offered by various clients, the fact that the scale prompts few negative emotions is quite important for market research firms or crowd-sourcing such as Amazon MTurk. In addition, a pilot study by Huang et al. (2015) shows that the IER scale is hardly related to social desirability. Therefore, since the IER scale is expected to have high feasibility and consideration for social desirability, our study focused on and adopted it to measure IER.
The IER scale (Huang et al., 2015) is used to investigate participants’ degree of fit to an unfeasible activity from their responses. In other words, it evaluates whether they engage in IER based on to what extent the answers are applicable to unfeasible contents. The second survey administers four items (“I have never used a computer”; “I work twenty-eight hours in a typical work day”; “I am interested in pursuing a degree in managemental genetics”;
5
and “I can run 3 km in 2 min”)
6
on a 7-point Likert scale (from “Strongly agree” to “Strongly disagree”).
7
Cronbach’s
Demographic Variables
In this study, for the analysis in Table 3, we employed sex, age groups, annual household income, and occupations as demographic variables. In each survey, the marketing research firm provided demographic data for each term. We excluded three participants in the first survey and one participant in the second survey who did not provide annual household income from the analysis.
Results and Discussion
Difference Between Survey Responses and Log Data
In this section, regarding RQ1, we verify H1 with correlation coefficients between survey responses and the behavior log and H2 with means and a scatter diagram including regression lines. It should be noted that, to satisfy the normality assumption, we use adding 1 and logarithmic-transformed values for both actual and self-reported durations.
Correlation coefficients of survey responses and the behavior log.
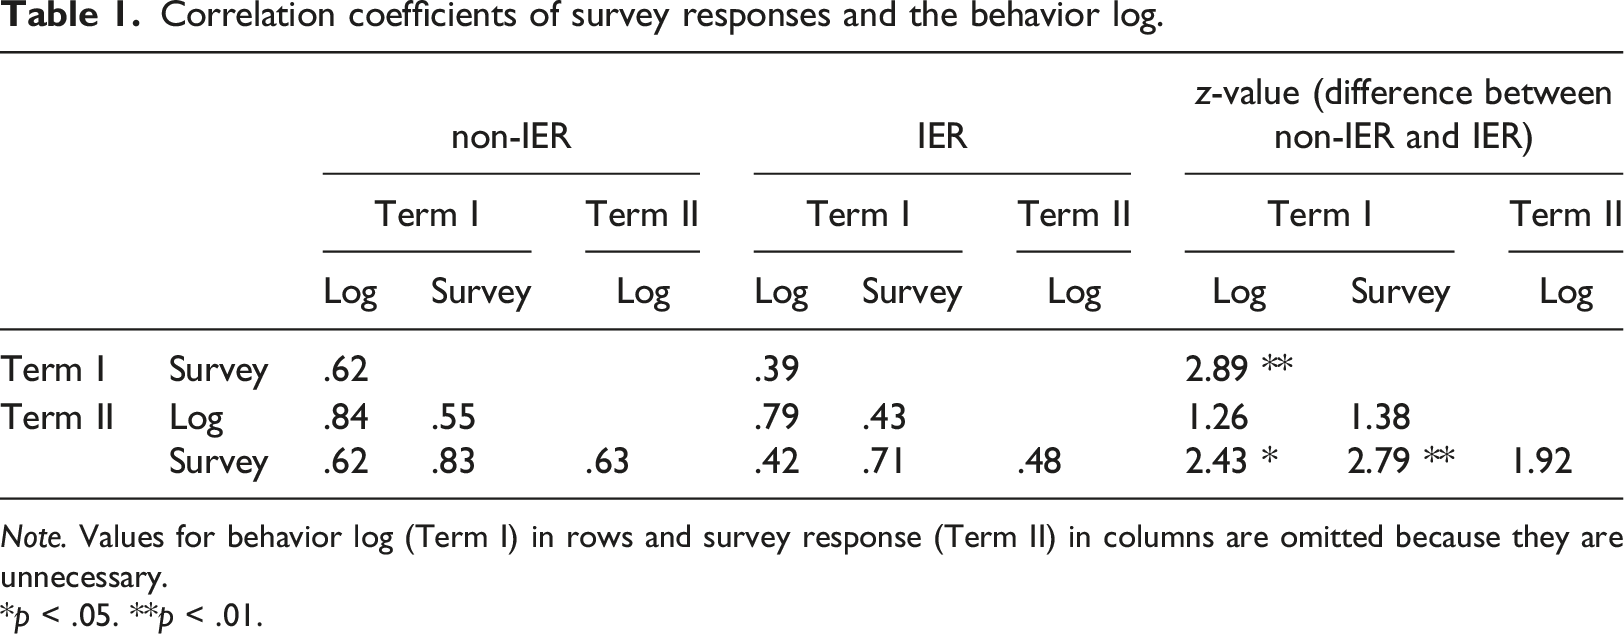
Note. Values for behavior log (Term I) in rows and survey response (Term II) in columns are omitted because they are unnecessary.
*p < .05. **p < .01.
Second, Figure 1, the scatter diagram, shows the relationship between survey responses and the actual behavior. The figure includes censored regression lines with a lower bound of 0, by overall, IER, and non-IER groups, showing that both IER and non-IER participants had an overreporting tendency. While the inclination of the regression line is almost 1 for the non-IER sample (Term I: β
nonIER
= 1.01, z = 18.25, p < .01; Term II: β
nonIER
= 1.06, z = 19.07, p < .01), that for the IER sample is substantially less than 1 (Term I: β
IER
= .66, z = 6.84, p < .01; Term II: β
IER
= .81, z = 8.07, p < .01), which indicates that the extent of overreporting tends to be larger with the longer play time for participants who engage in IER. Scatter diagram of survey responses and the behavior log (logarithm-converted min).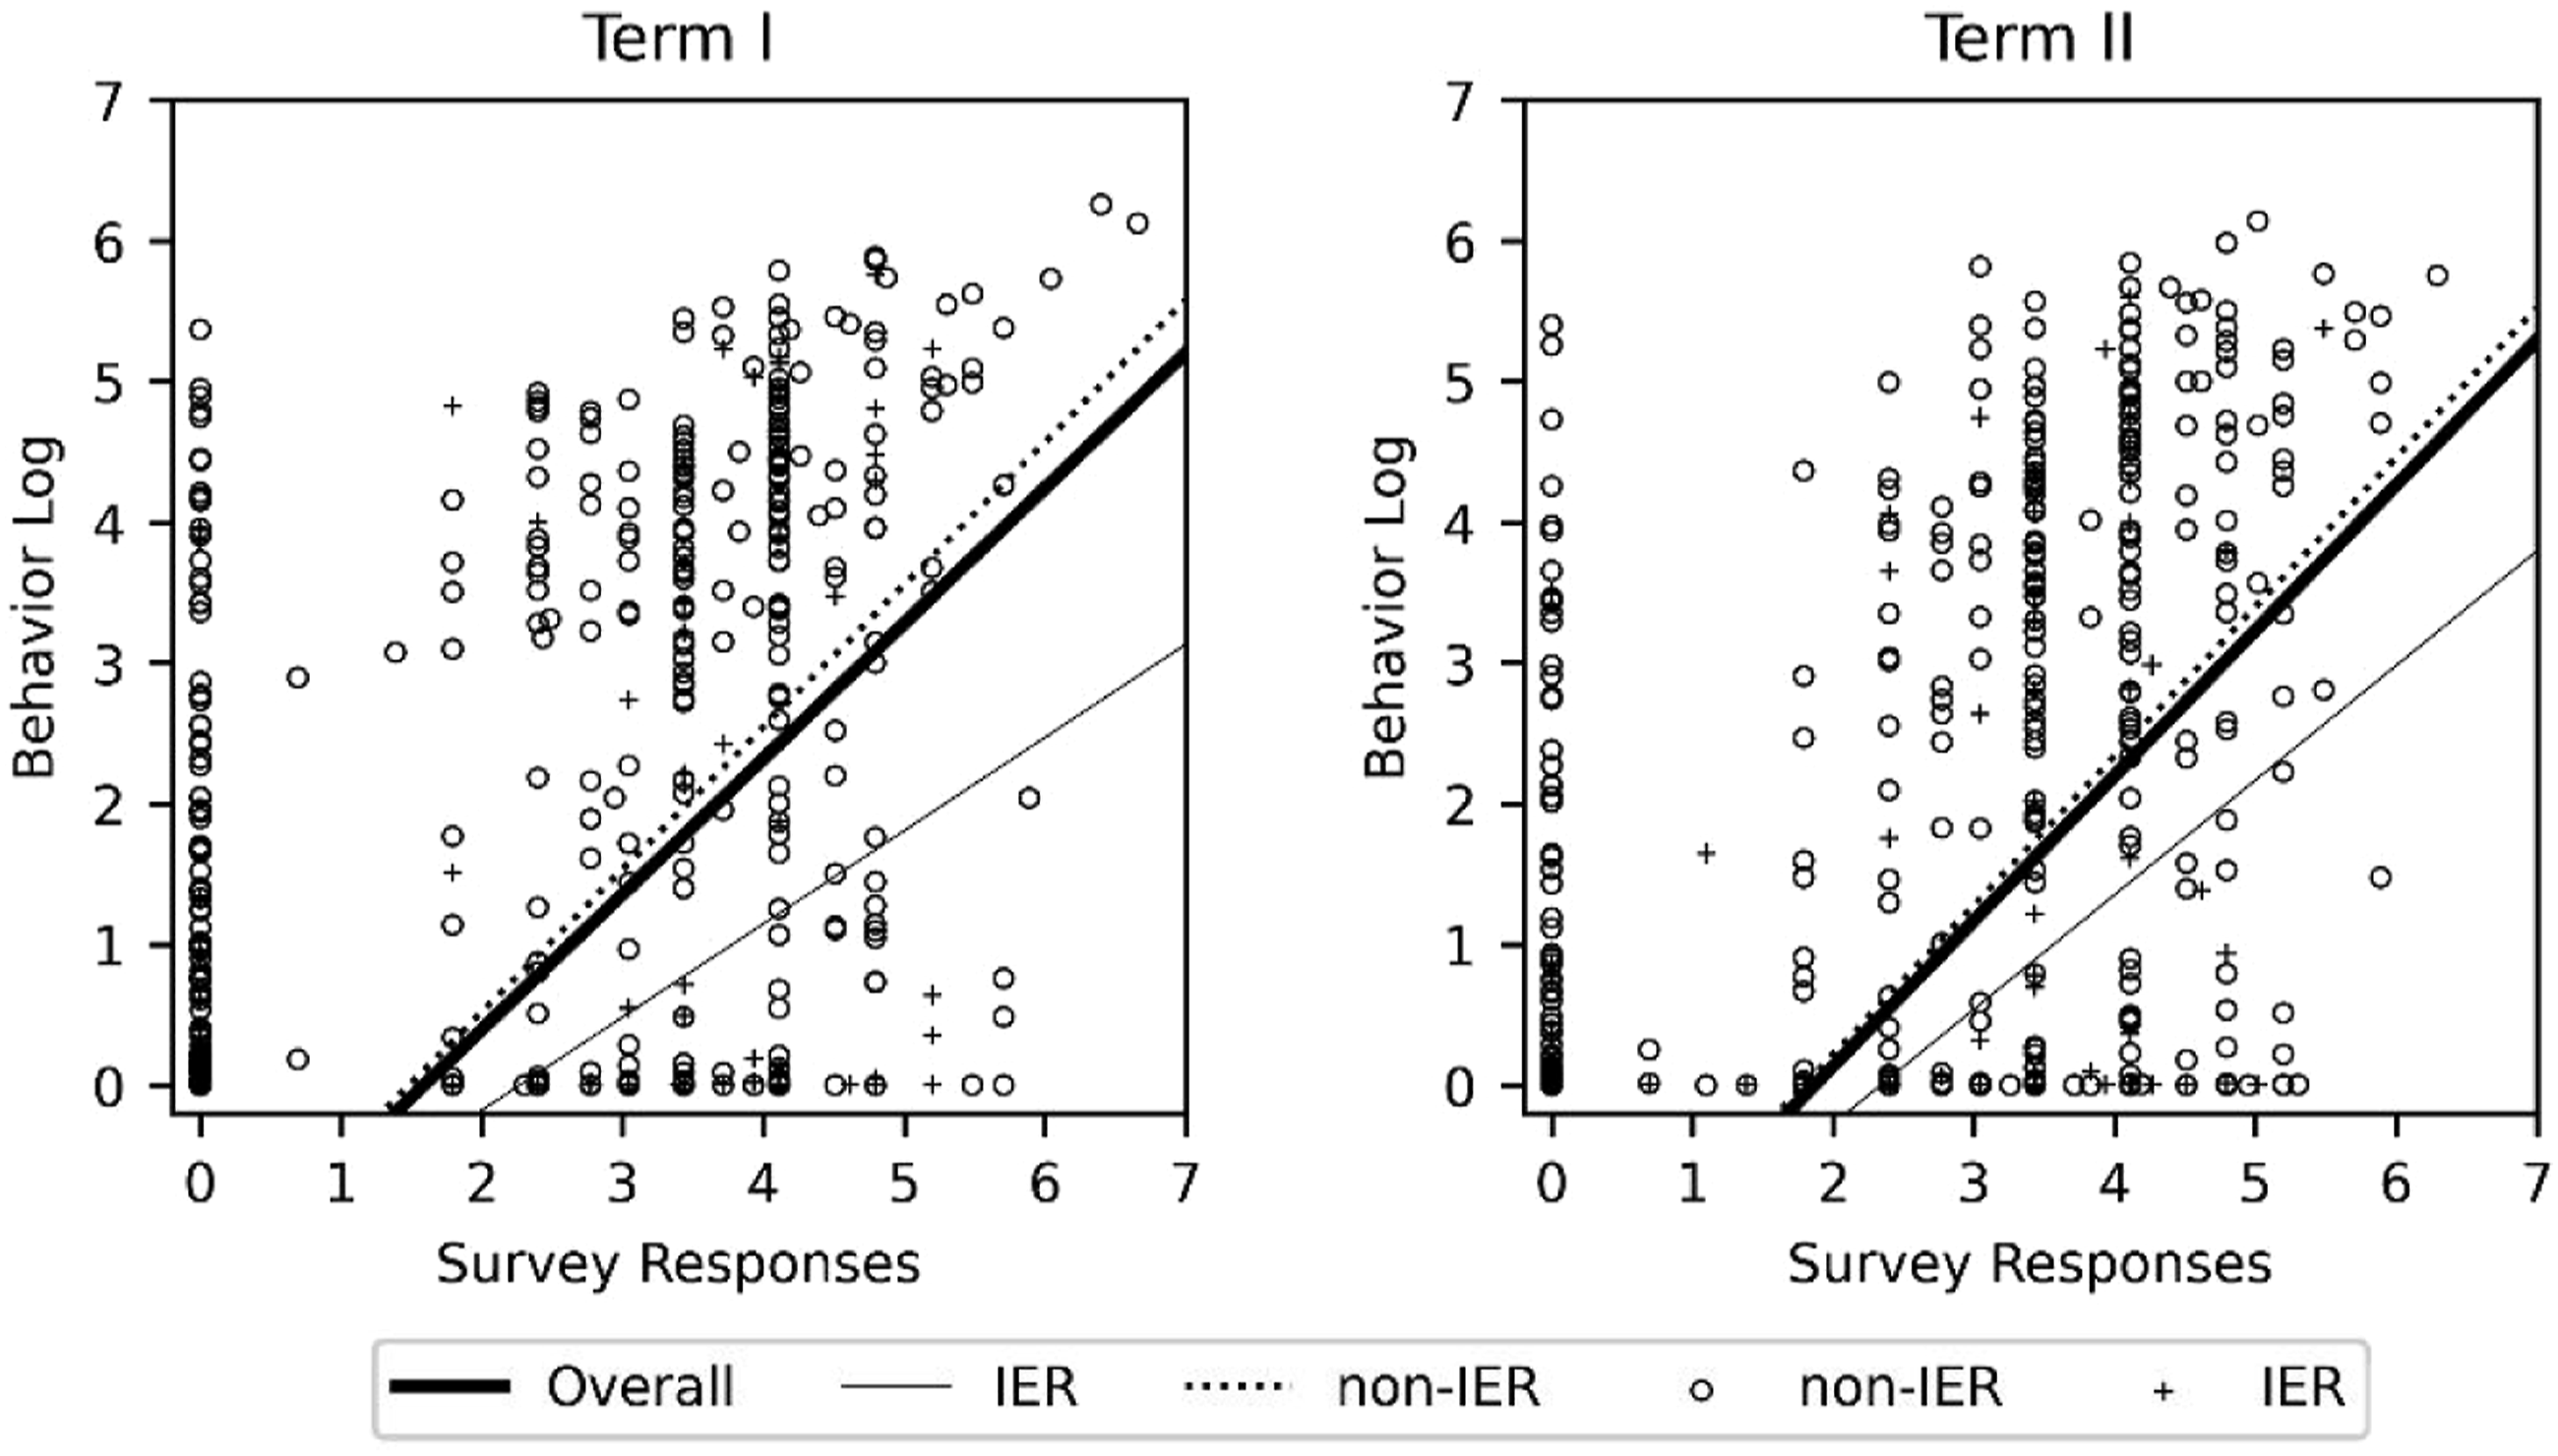
Comparison Between Survey Responses and the Behavior Log (min).
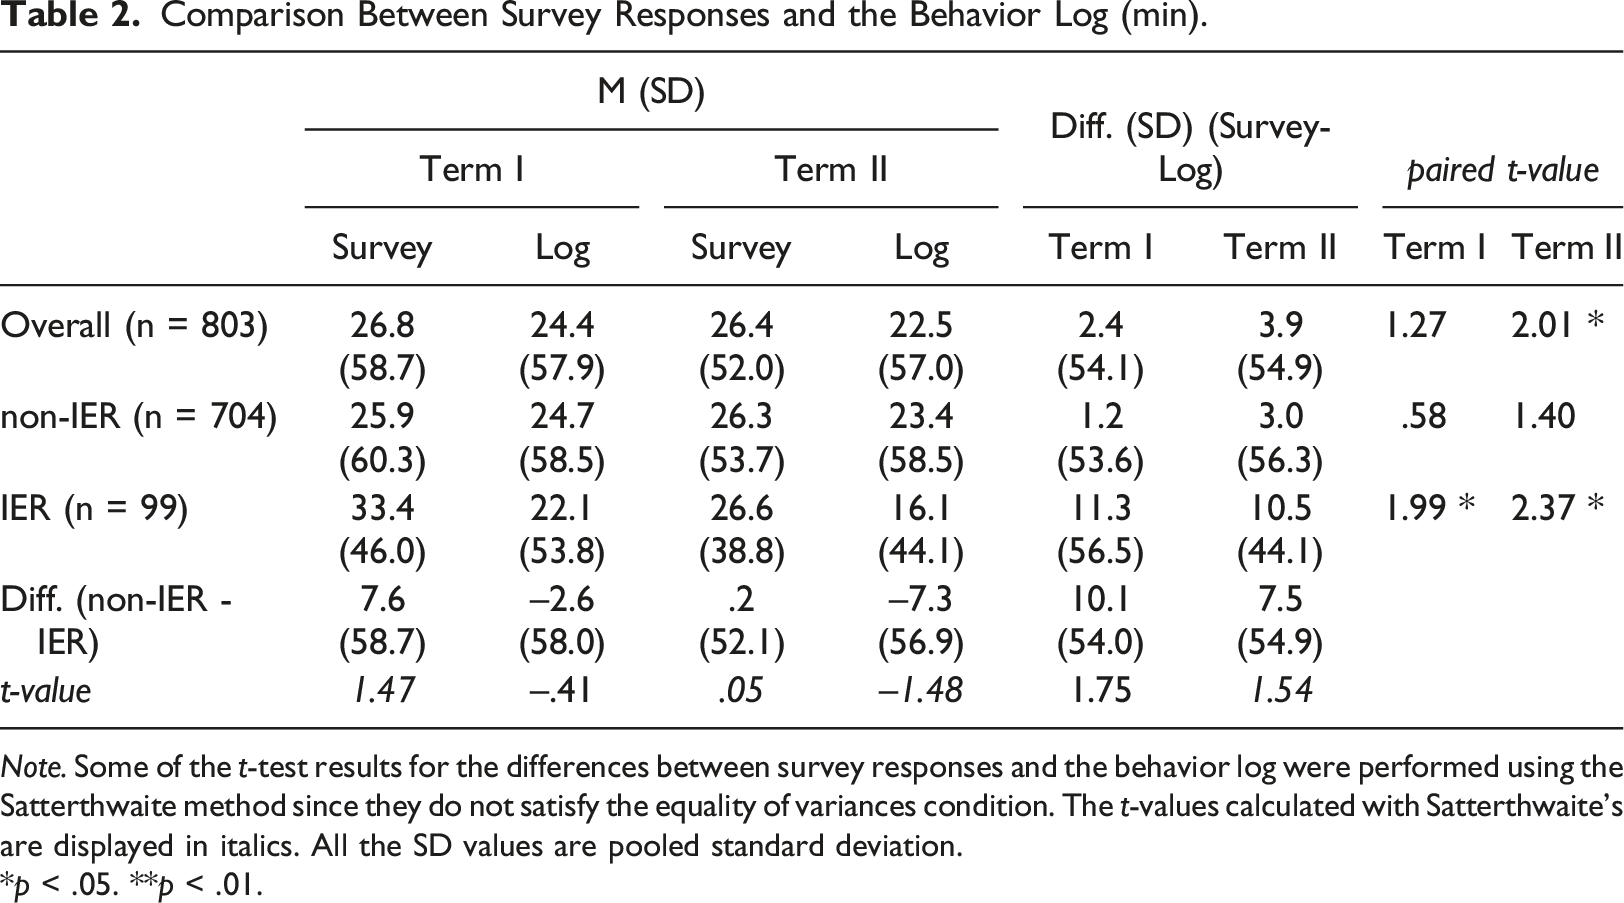
Note. Some of the t-test results for the differences between survey responses and the behavior log were performed using the Satterthwaite method since they do not satisfy the equality of variances condition. The t-values calculated with Satterthwaite’s are displayed in italics. All the SD values are pooled standard deviation.
*p < .05. **p < .01.
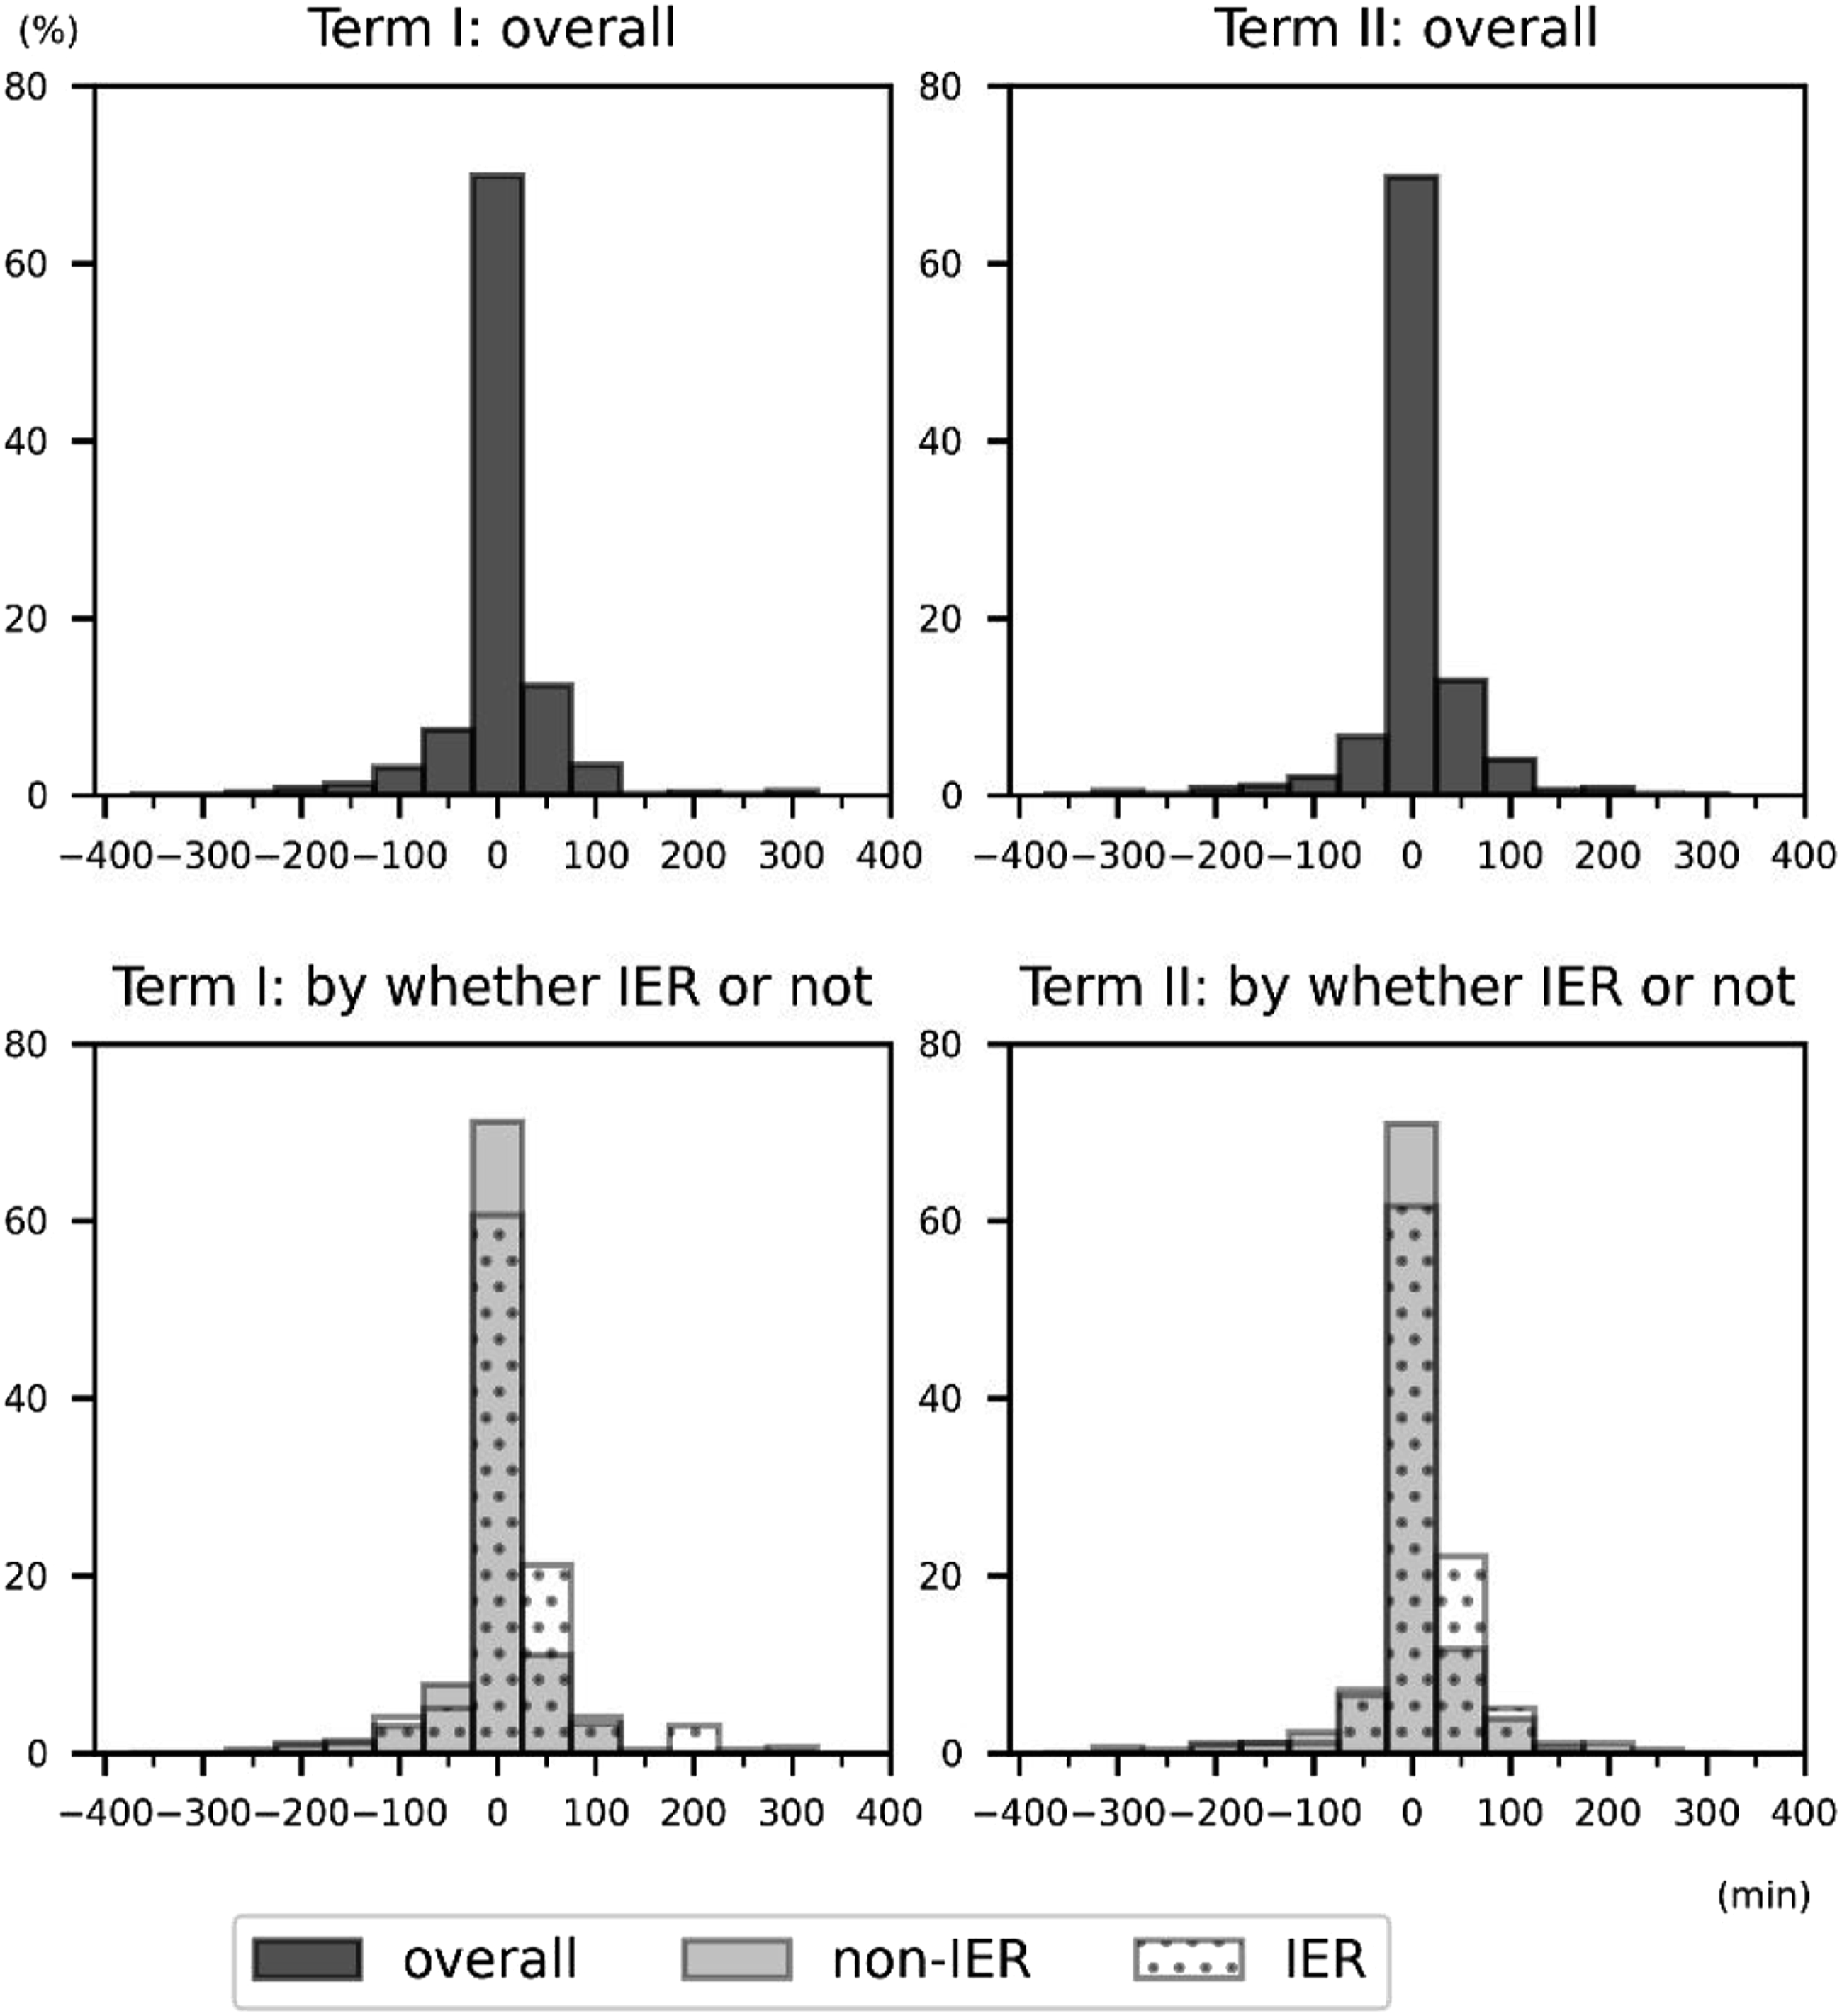
Histograms of the difference (survey responses minus behavior log).
Difference Within Each Datum: Impact of IER
First, we focus on survey responses and investigate the difference depending on whether participants engaged in IER. According to Table 2, within survey responses, IER made a difference by 7.6 min (Term I) and .2 min (Term II), which is not significant. However, upon closer examination (Figure 3, upper), Term I, in particular, shows the tendency of overreporting for IER participants than that for non-IER ones. The result is also confirmed using the Kolmogorov–Smirnov test (Term I: D = .1701, p < .05. Term II: D = .1354, p > .05). Cumulative distributions of the behavior log and survey response by IER status.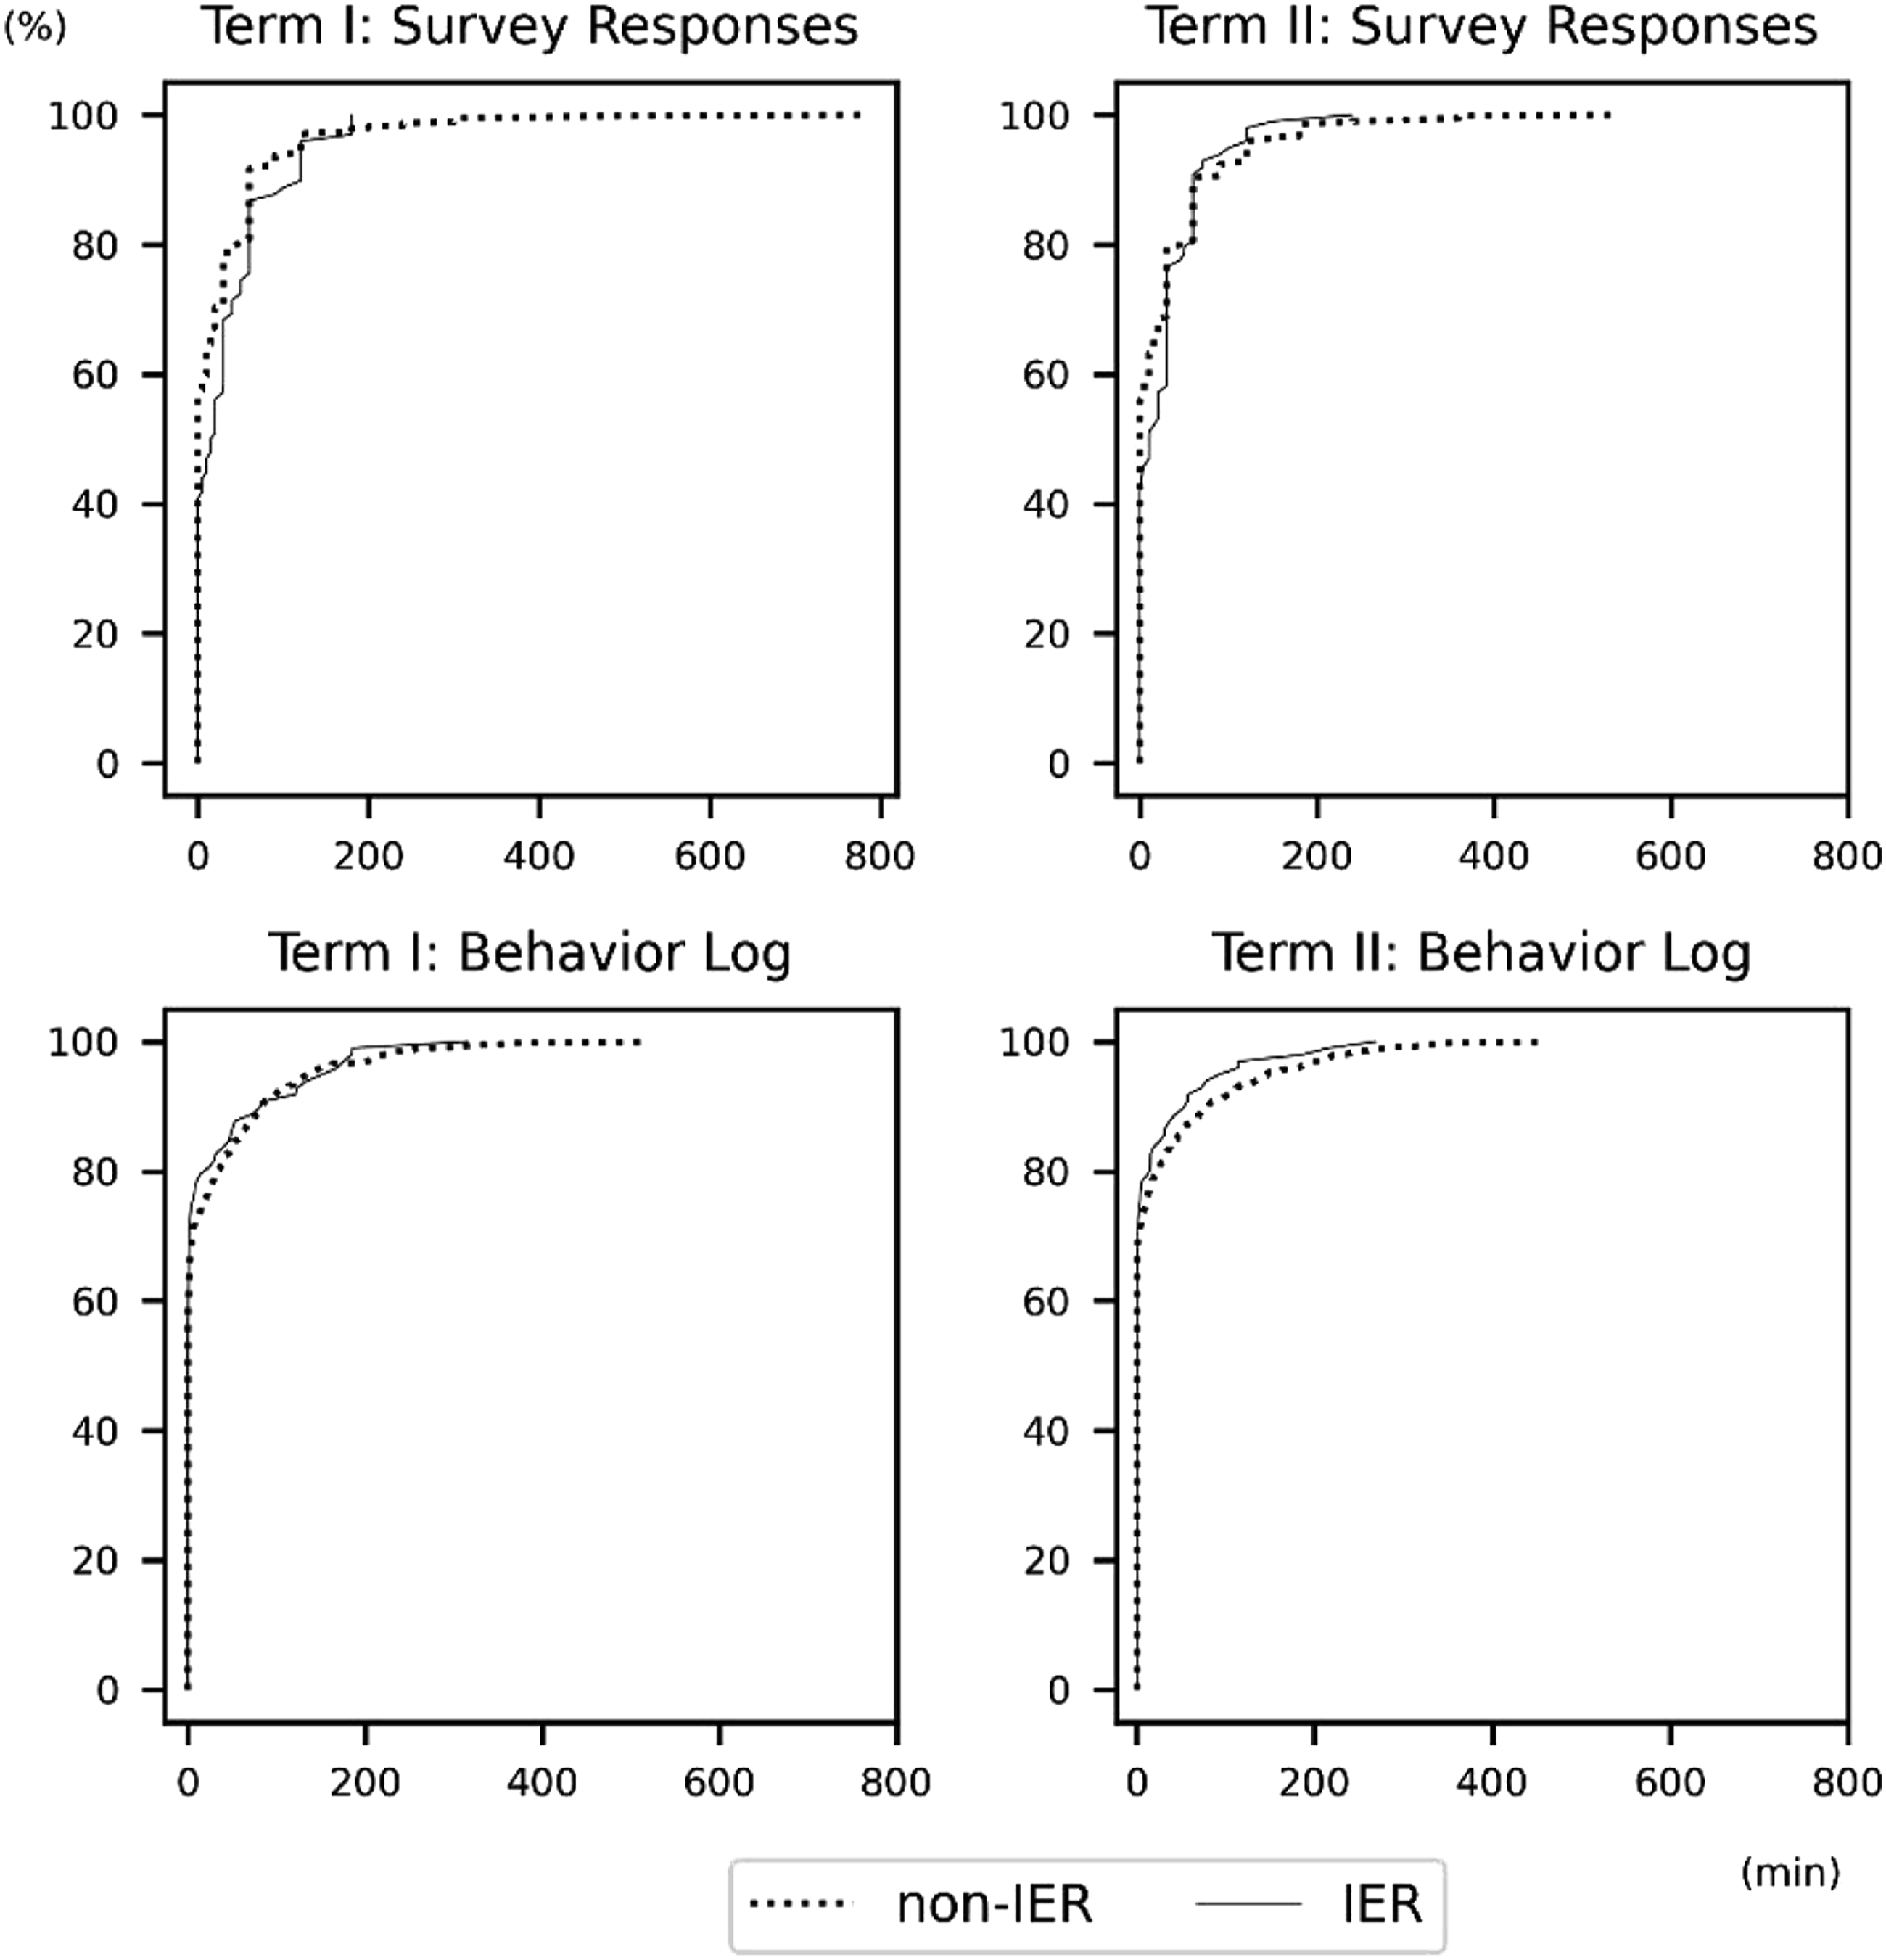
Next, we investigated whether the distributions of actual behavior differ between IER and non-IER participants. The mean difference between the groups is not significant (Table 2), and the distributions also remain similar (Figure 3, bottom; Term I: D = .0795, p > .05. Term II: D = .0604, p > .05). Based on these two results, in conclusion, although actual smartphone game usage differs little depending on whether participants engage in IER or not, self-reported usage could be different. Thus, this is the supportive result for H2.
Exclusion of IER and Its Effect
Our findings so far strongly motivate us to exclude IER participants from the analysis. However, even though the distribution of actual behavior is not significantly affected by IER, it still cannot be denied that simply excluding IER participants from the data without much consideration may lead to selection bias and cause deviations of means or distributions. Therefore, in this subsection, we verify RQ2 and, in case the exclusion is not problematic, show the extent to what the exclusion can approximate the responses to actual behavior.
Figure 4 shows the effect of exclusion by comparing the cumulative distributions of actual duration per day for non-IER and overall participants. Both groups have similar distributions in both terms, even with the exclusion of 99 IER-identified participants. The difference is also validated by the Kolmogorov–Smirnov test with bootstrap (resampling 1000 times) since the statistics are not independent, and it is not significant based on whether IER is included in the sample (Term I: D = .0098, p > .05; Term II: D = .0075, p > .05). Therefore, from the results, we can hardly conclude that excluding IER distorts the actual distribution because of selection bias. Comparison of the cumulative distributions of actual duration per day between overall and non-IER responses. Note. The two lines of overall and non-IER groups almost overlap since they have similar distributions in both terms.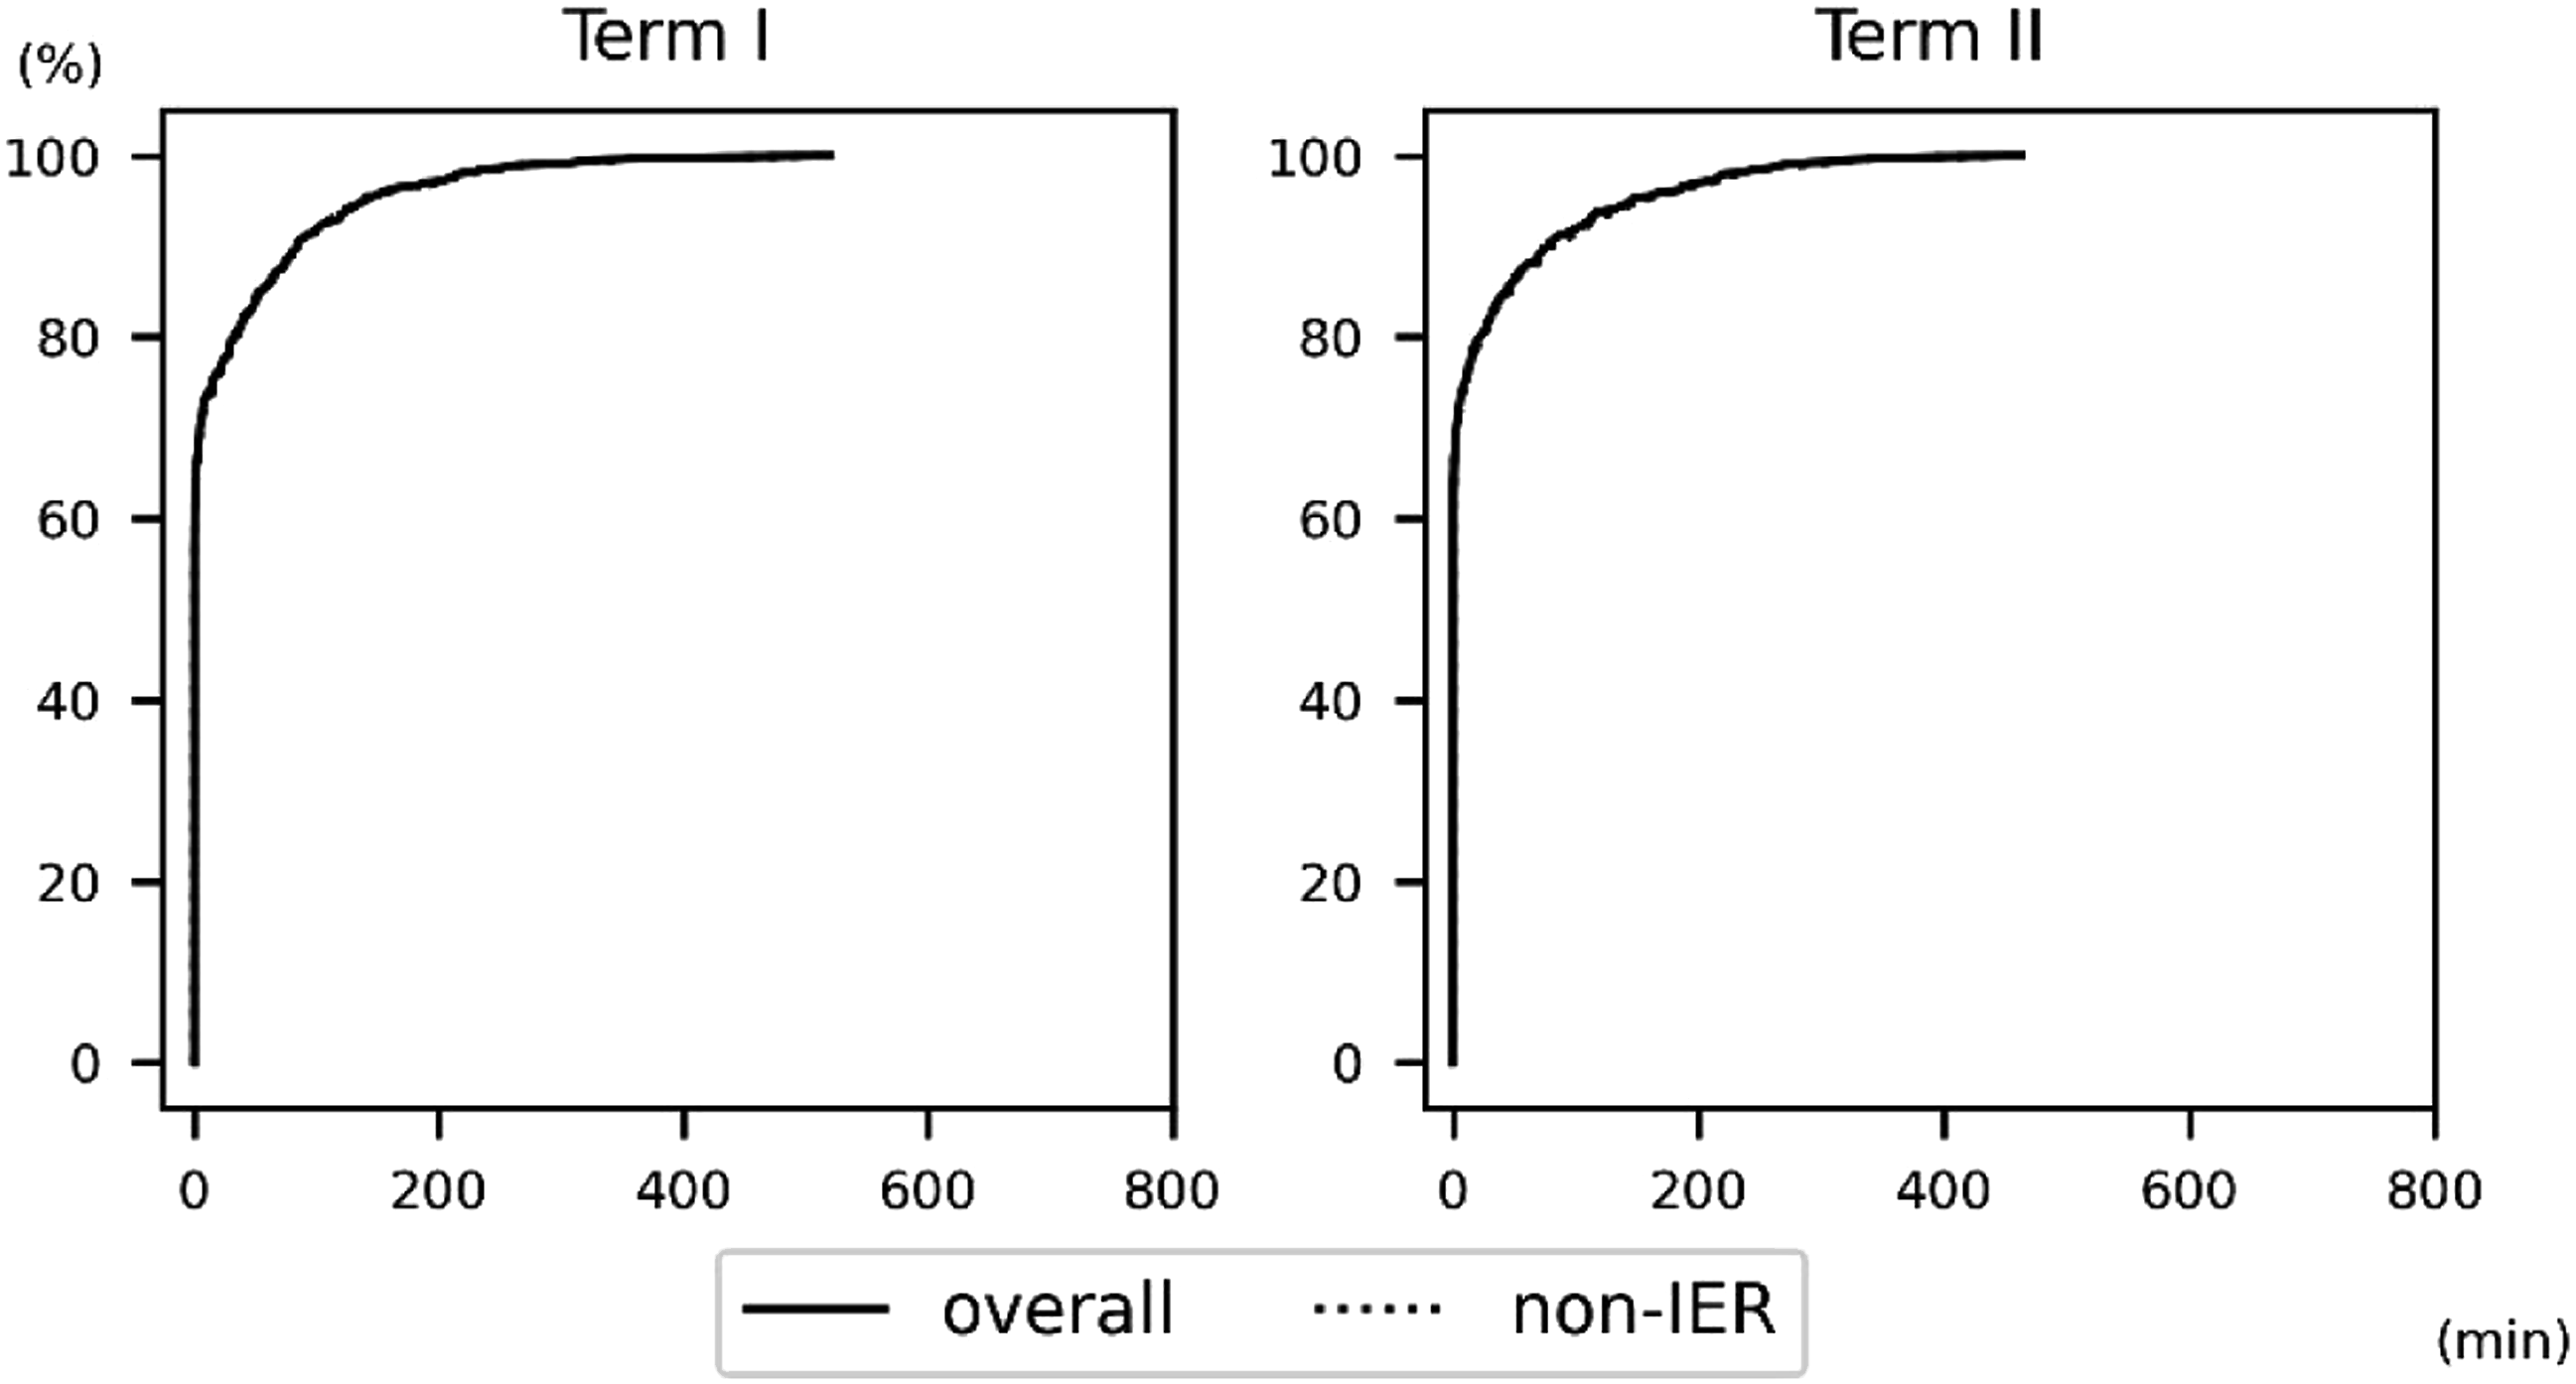
Next, we show the effect of exclusion. In Table 2, the response error for the overall sample is overreporting in 2.4 min (Term I) and in 3.9 min (Term II); however, that without IER is overreporting in 1.2 min (Term I) and 3.0 min (Term II). By the exclusion of IER, overreporting is reduced by 25%–50% and approximates survey responses to actual behaviors.
Additional Verifications on the Exclusion of IER Participants
Comparison Between Survey Responses and the Behavior Log (logarithm-converted min).
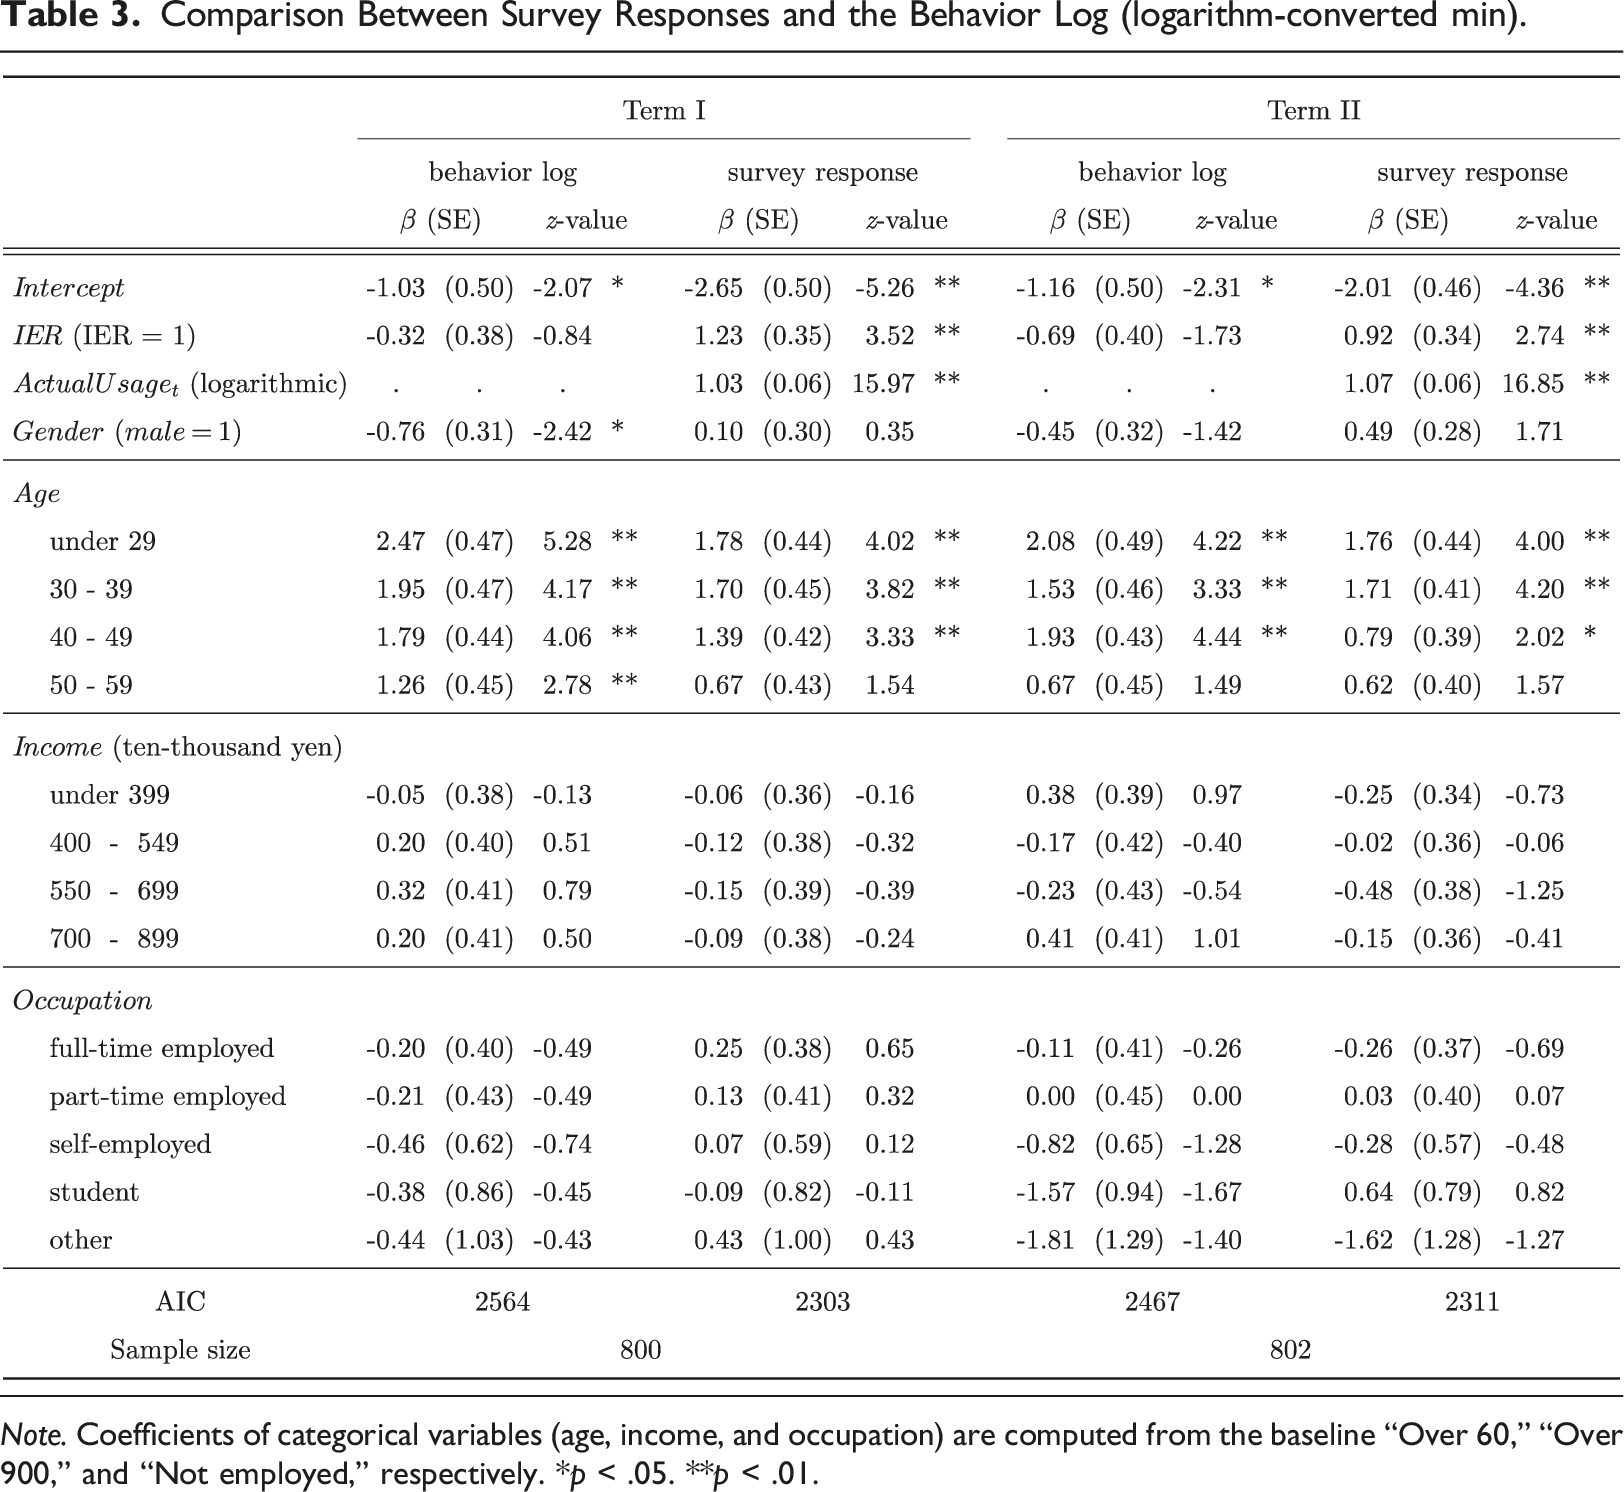
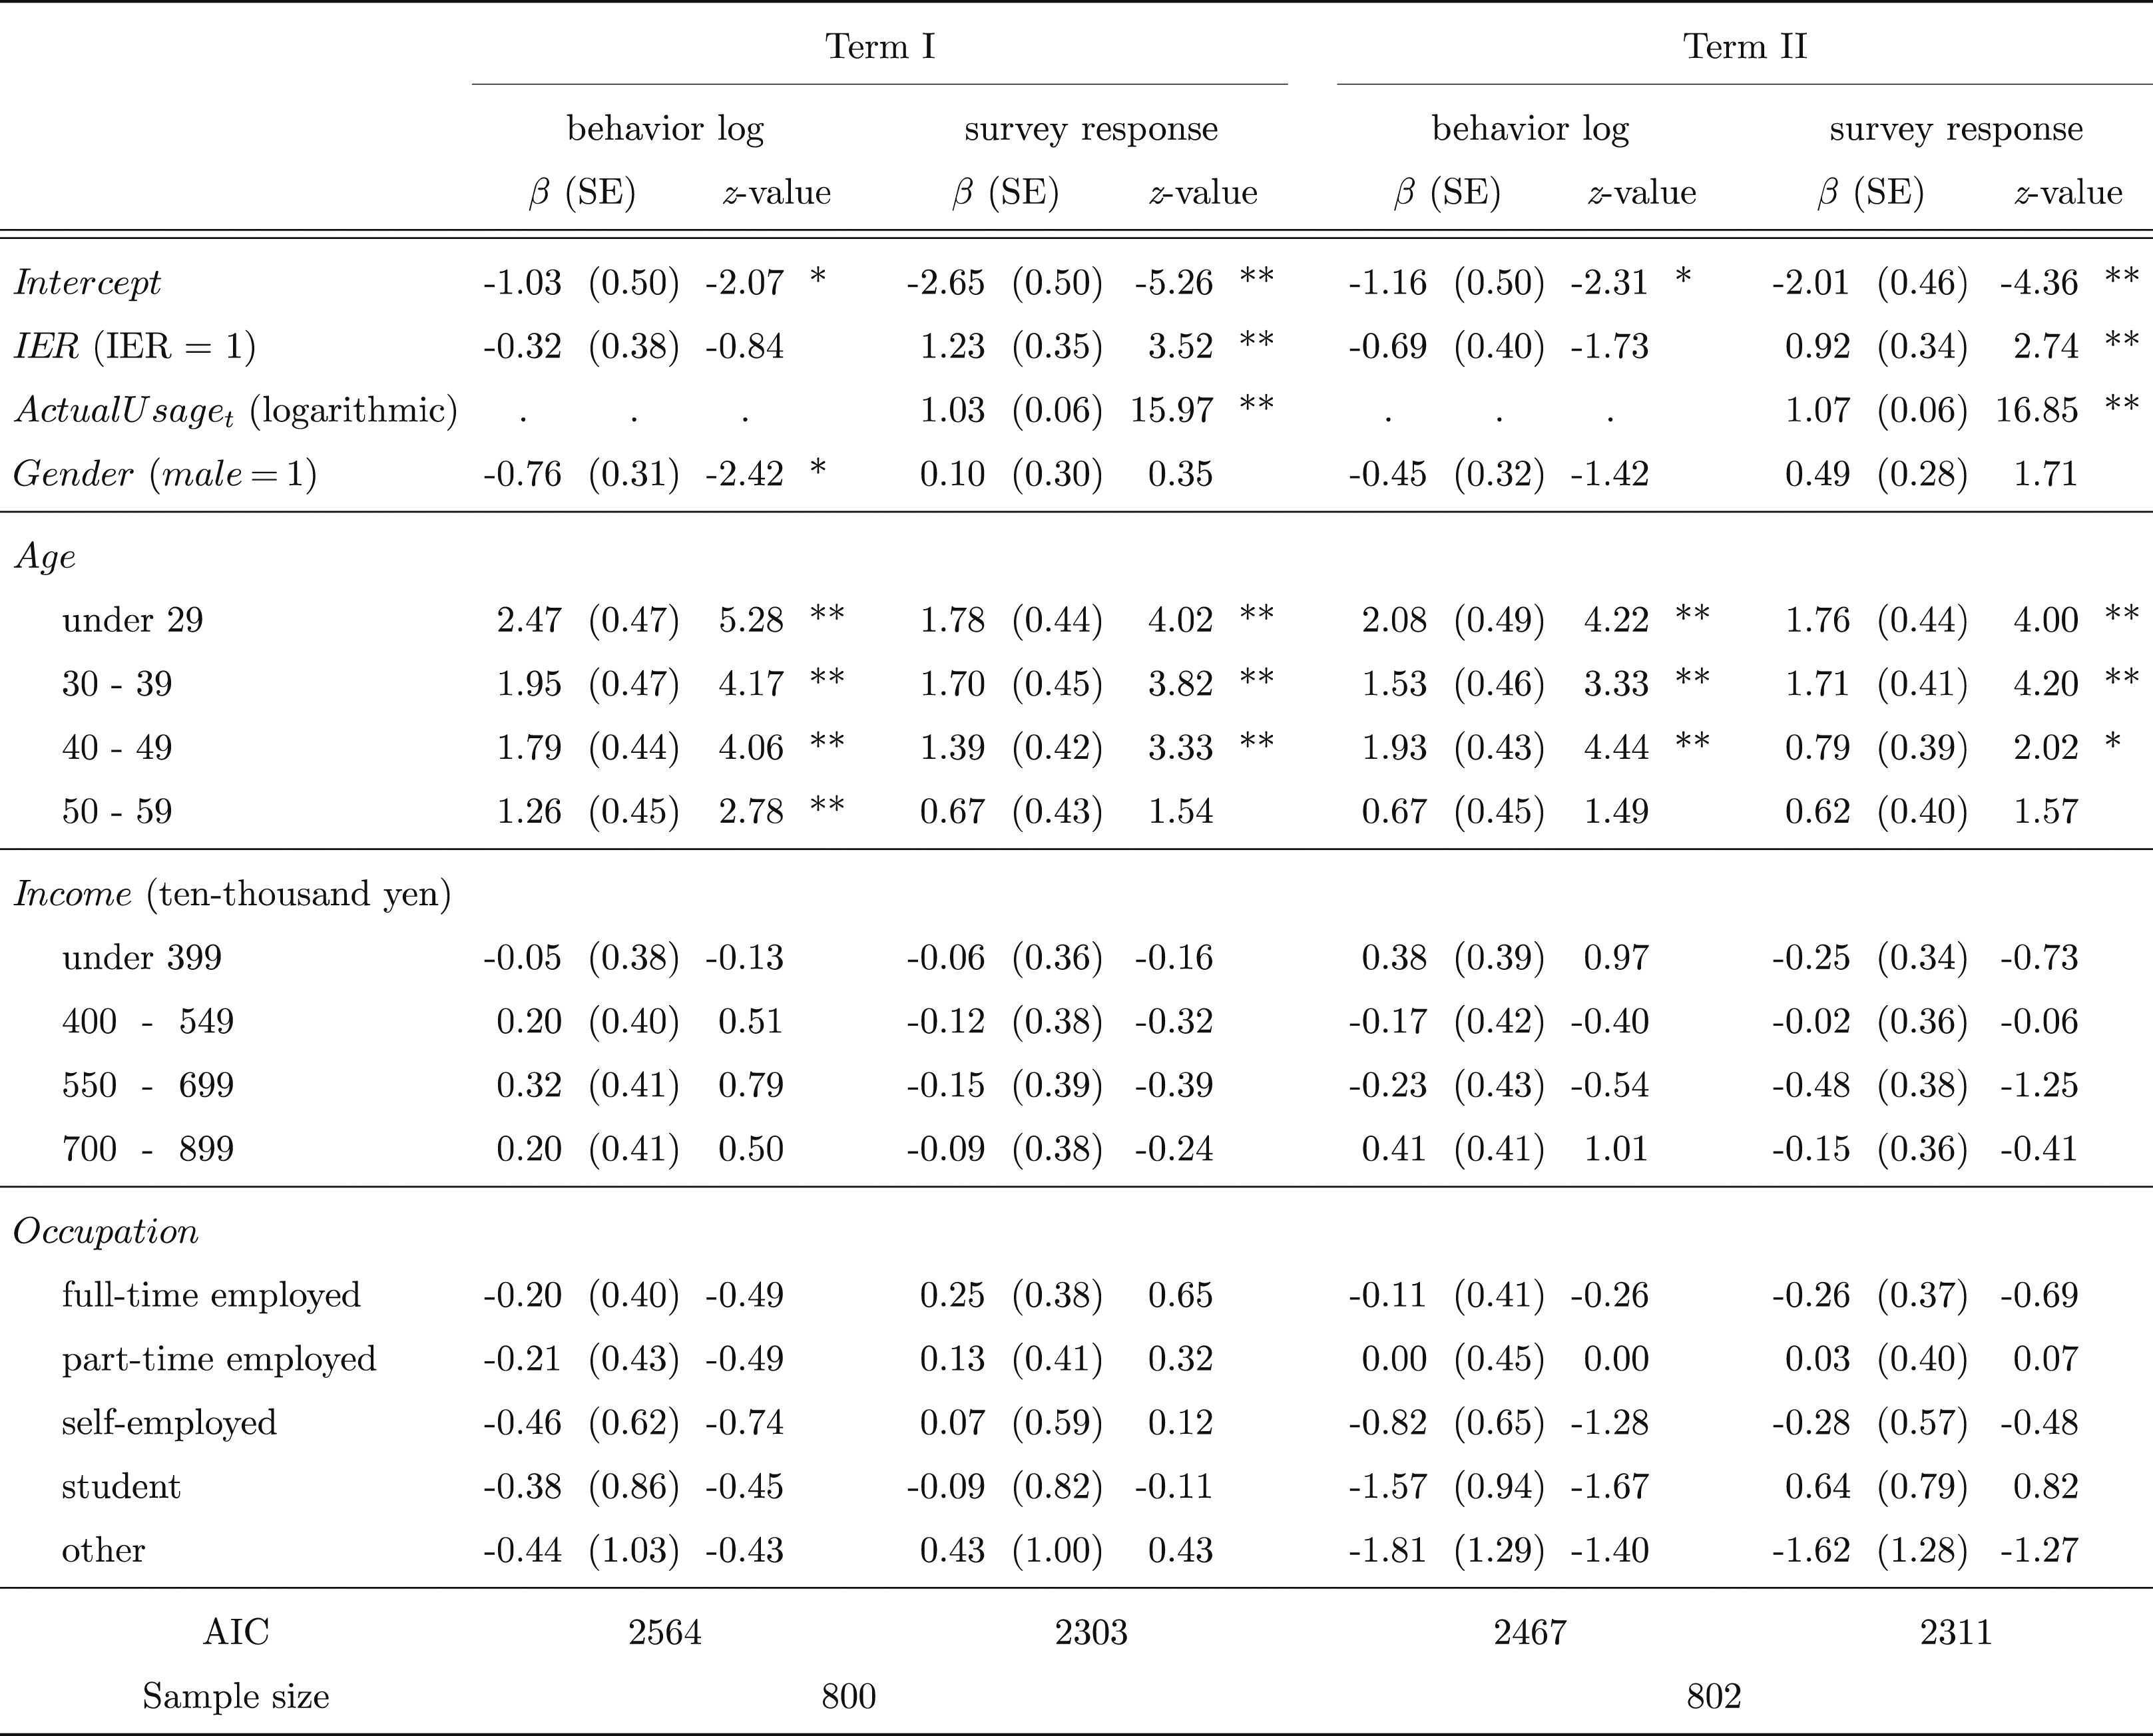
Note. Coefficients of categorical variables (age, income, and occupation) are computed from the baseline “Over 60,” “Over 900,” and “Not employed,” respectively. *p < .05. **p < .01.
Conclusions
In this study, we focus on the difference between survey responses and the actual behavior and the associations with IER. By comparing the differences, we found some interesting results associated with IER and the possibility of excluding such participants. To the best of our knowledge, this is the first study to verify whether the extent of the difference between the behavior log and survey responses changes depending on participants’ IER; hence, this study will be a bridge between two research fields: the difference between surveys and log data and IER.
Based on the findings of this study, in case the behavior log is unavailable for the survey period, we recommend identifying and excluding participants who engage in IER with using indices such as the IER scale (e.g., Huang et al., 2015). This is because, in the first place, participants tend to overreport in survey responses. In details, the tendency of overreporting deteriorates, especially for IER-identified participants; furthermore, the validity problem, meaning that the correlation between survey responses and the actual behavior decreases for such participants compared to those for non-IER ones, is confirmed. However, even if the distribution of survey responses differs depending on IER, that of the behavior log remains the same. In addition, even if the distribution of the behavior log remains constant before and after the exclusion and IER can be the explanatory factor for the deviation of survey responses, it cannot be the explanatory factor for that of actual behavior. These can be additional evidence for us to comprehend that the selection bias stemming from IER does not distort the actual behavior.
Theoretical Implications
This study has several academic implications. First, prior studies comparing self-reports and the actual behavior in web and mobile use have mainly reported either overreporting or moderate correlations or both (e.g., Araujo et al., 2017; Boase & Ling, 2013; De Reuver & Bouwman, 2015; Deng et al., 2019; Scharkow, 2016). Our findings on mobile games are not only consistent with such results but also extend them by identifying IER as a cause of bias and low validity. Regarding the possibility of social desirability influencing the results, in the first place, it has been pointed out that excessive game playing may lead to addiction and mental disorder (American Psychiatric Association, 2013; WHO, 2021); for this reason, underreporting would be rather expected in terms of social desirability. In addition, since social desirability bias is different from IER in that participants respond after carefully reading the questions (Grau et al., 2019), it is unlikely that the IER scale captures it. Since the response can be infinite upward while zero-bounded downward (Lee et al., 2000), such overreporting can stem rather from responses with low validity, such as IER. In fact, IER does not distort the responses and behaviors in a specific direction based on beliefs or characteristics, but it rather disrupts responses randomly due to the lack of incentives to answer accurately, and it is not associated with actual behavior. Our result that the exclusion of IER does not cause selection bias may stem from these reasons.
Second, although prior IER-related studies have proposed or compared methods (e.g., Huang et al., 2015; Maniaci & Rogge, 2014; Meade & Craig, 2012), they generally have not shown the extent to which the survey responses by the participants engaging in IER are distorted against actual behavior because they have not conducted validation using behavior log data. Our finding that the IER scale (Huang et al., 2015), which is associated with many IER indices, captures the participants who give responses that deviate from their actual behavior strongly supports the validity of the extant literature dealing with IER.
Third, although many methods to reduce IER have been proposed (e.g., Maniaci & Rogge, 2014; Meade & Craig, 2012; Paas et al., 2018; Ward & Pond, 2015), there remain problems in that some are difficult to implement while, as Paas et al. (2018) mentioned, others lose their effectiveness with repeated surveys. Therefore, many studies in marketing or consumer behavior studies have attempted to exclude or screen IER from their analyses as the most practical approach (e.g., Beck et al., 2020; Bond et al., 2019; Consiglio & van Osselaer, 2019; Fernandes et al., 2016; Jung et al., 2022; Klein et al., 2019; Laran et al., 2019; Yang et al., 2018); in fact, it has been pointed out that the results lose their statistical representativeness because of selection bias (e.g., Lu et al., 2019; Ward & Pond, 2015). However, our findings that the behavior log distribution remains constant with the exclusion of IER participants and that the actual behaviors do not change even though survey responses do, depending on IER (e.g., Lu et al., 2019), increases the validity of such survey studies by easing the concerns over excluding IER participants.
Practical Implications
We also propose several implications for practical marketing research and social surveys. First, regarding the survey, it goes without saying that ensuring data quality must be one of the vital matters of concern. However, if IER participants should occur, excluding them without much consideration would imply selection bias, while not doing so would mean the acceptance of possible data distortion. However, the utility of excluding them ensured by this study should alleviate such problems, including selection bias.
Second, when the operational company or researchers conduct the survey or the experiment, they often commission the contractors, such as market research firms and crowd-sourcing. Market research firms are engaged in various initiatives to maintain and improve quality on a daily basis in order, for instance, to ensure the market representativeness. In contrast, crowd-sourcing, which has been widely utilized in academic research, recruits workers intending to outsource various tasks not limited to the survey and the experiment. The IER scale, whose usefulness was found in this study, may be able to be utilized in further efforts in quality management. For example, in case of conducting independent surveys or surveys intended for quality control, IER participants can be identified in advance by adding the IER scale. Based on the responses of the scale, they can suspend requesting the survey to such participants, provide such responses merged with survey data collected at the request of researchers and operational companies, and provide the survey data with selectively excluded such participants. In addition, these efforts would lead to preventing survey participants from repeatedly answering IER-related questions in many surveys (In fact, many empirical studies using the means such as crowd-sourcing adopt the questions intended to identify inappropriate responses). This could lighten the workload of answering the IER-related questions many times.
Finally, regarding the operational company, in case of directly conducting a survey involving own customers or members, it would be preferable for marketers to create a survey including the IER scale (the same is required for the entities that conduct social surveys as well). If a concern arises on data quality, such as that the results differ depending on whether participants engage in IER or not, they can decide to exclude IER participants.
Limitations and Future Research
Our study has a few limitations. First, the results presented are dependent on the IER scale. Although we chose a comprehensive scale (Huang et al., 2015) associated with many other IER indices, the differences between survey responses and actual behavior or the extent of the bias due to IER exclusion might change if applied to other methods. In the future, continuous examinations using other key IER indices are needed to investigate the differences and the possibility of excluding IER.
Second, IER in this study mainly captures overreporting. We discussed the possibility of overreporting due to insufficient motivation and willingness to provide accurate answers among IER participants. However, it is also possible that low-motivation participants processed information with insufficient memory retrieval or availability heuristics. In that case, IER may reflect “creation,” in which participants create imaginary facts (e.g., participants mistakingly answer other people’s game use or their own non-mobile game use for their proper use), or “telescoping” (Malhotra, 2009), in which participants recognize out-of-period behavior as in-period. In contrast, behaviors such as “forgetting” or “omission,” which lead to under-reporting, might not have been captured with the IER in this study. These effects of memory and information-processing systems on IER and response errors must be further investigated. Finally, although this study compares behavior log data and survey responses, we focus on smartphone game use. Therefore, future studies need to explore the impact of excluding IER in other fields, for example, by comparing purchase logs, such as scanner panel data that compile entire purchase records, with survey responses.
Footnotes
Acknowledgments
We were provided behavioral log data (i-SSP) from INTAGE Inc.
Declaration of Conflicting Interests
The author(s) declared no potential conflicts of interest with respect to the research, authorship, and/or publication of this article.
Funding
The author(s) disclosed receipt of the following financial support for the research, authorship, and/or publication of this article: This work was supported by the JSPS KAKENHI Grant Numbers JP18H03209, JP19K13826, JP20H01545, JP22K13495.