
Abstract
This paper investigates the impact of including or omitting an explicit “don’t know (DK)/no opinion (NO)” option in survey questionnaires. Three consecutive annual surveys were conducted using identical questionnaires, with variations in the inclusion of the DK/NO option. The study compares responses from the 2019 survey, which lacked a DK/NO option, to responses from the 2020 and 2021 surveys, which included this option. Utilizing a 7-point Likert scale, respondents were asked to indicate their opinions, with options ranging from extreme disagreement to extreme agreement, with a neutral midpoint. Statistical analysis, employing Two Sample Z-tests Between Proportions, assessed differences in the proportion of neutral responses between the surveys. Findings reveal that the inclusion of the DK/NO option did not significantly alter the proportion of neutral responses compared to surveys without this option. These results challenge the prevailing notion that explicit DK/NO options improve data quality.
Keywords
Introduction
To examine the impact of including or omitting an explicit “don’t know (DK)/no opinion (NO)” option, three annual waves of identical questionnaires were fielded to explore voter attitudes concerning current political and economic issues in the US. The question responses were collected from quota samples of roughly 200 people using an email invitation to an online survey using vendor panels to invite potential respondents to complete the interview. Conducting a study in this manner is referred to as ‘fielding’ the survey.
The 2019 and 2020 waves were fielded by the same company (vendor A) that has a “narrow” panel of primarily medical patients who have a wide variety of conditions. The 2021 wave was fielded by a different company (vendor B) who has a broader based panel of “consumers.” Using two different vendors adds variability to the research, but if the results are similar it will demonstrate the robustness of the results. The original survey contains 16 questions. Due to slight wording changes each year, there are 14 identical questions in each of the three surveys.
The 2019 survey was completed by 203 respondents. The 2020 and 2021 surveys both contain 200 respondents. The 2019 data is the basis for comparison between the 2020 and 2021 studies. The 2019 and 2020 survey data are from the same vendor but different panel members. The 2019 (fielded by vendor A) and 2021 (fielded by vendor B) survey data creates a more challenging experiment. Respondents in all three surveys mirror the U.S. population with respect to age, gender, and race.
Choices made that were closer to 1 or 7 indicated opinions closer to one extreme, while those closer to 4 indicated either neutrality on an issue or a lack of opinion. In the 2019 wave, respondents could answer ‘4’, but they were not provided a DK option. In the 2020 and 2021 waves, in addition to the 1–7 interval of answer choices, respondents were also given a checkbox option labeled “Don’t Know.” The data from the three waves are analyzed to determine whether or not providing the explicit option influenced the percentage of people who expressed an ambivalent or neutral opinion.
The literature is mixed on the importance of including an explicit DK/NO option. From the perspective of response rates, Nora and Presser (2003) observed that including an explicit DK option substantially lowered the number of respondents offering opinions. The typical attitude item implicitly assumes the respondent holds an opinion and therefore may communicate the expectation that a position should be chosen. Experiments have shown that “quasi filter’” which explicitly mention “no opinion” as a response option, can substantially lower the number of respondents offering opinions. Moreover, “full filters,” which initially ask an entirely separate item about whether one has an opinion, reduce the proportion offering opinions even more.
While Anna DeCastellarnau (2018), in her extensive literature review of scale characteristics found some authors demonstrated little need while others found that including an explicit option does affect data quality and response rates. However, many authors argue that when the “don’t know” is provided this leads to incomplete, less valid and less informative data. Whether providing explicitly or implicitly a “don’t know” option impacts data quality is not clear: some authors show that providing it explicitly impacts data quality. while others conclude that there is no support towards this impact.
Specifically focusing on data quality, Frank Andrews (1984) found that the inclusion of the DK option was associated with better data quality. … the second most important survey characteristic is whether the answer categories include an explicit “Don’t know” option. The effect of this design matter is clear and consistent: Inclusion of an explicit “Don’t know” category was associated with better data-higher validity, lower method effects, and lower residual error.
There is no firm conclusion on this issue. The focus of this research is solely on data quality. Our research is not able to address the issue of “completion rates” since the response rates were not provided by the vendors. The contract was to obtain approximately 200 completed surveys, reasonably matching the U.S. population on key demographics.
Analysis and results
Statistical comparison of the 14 opinion questions.
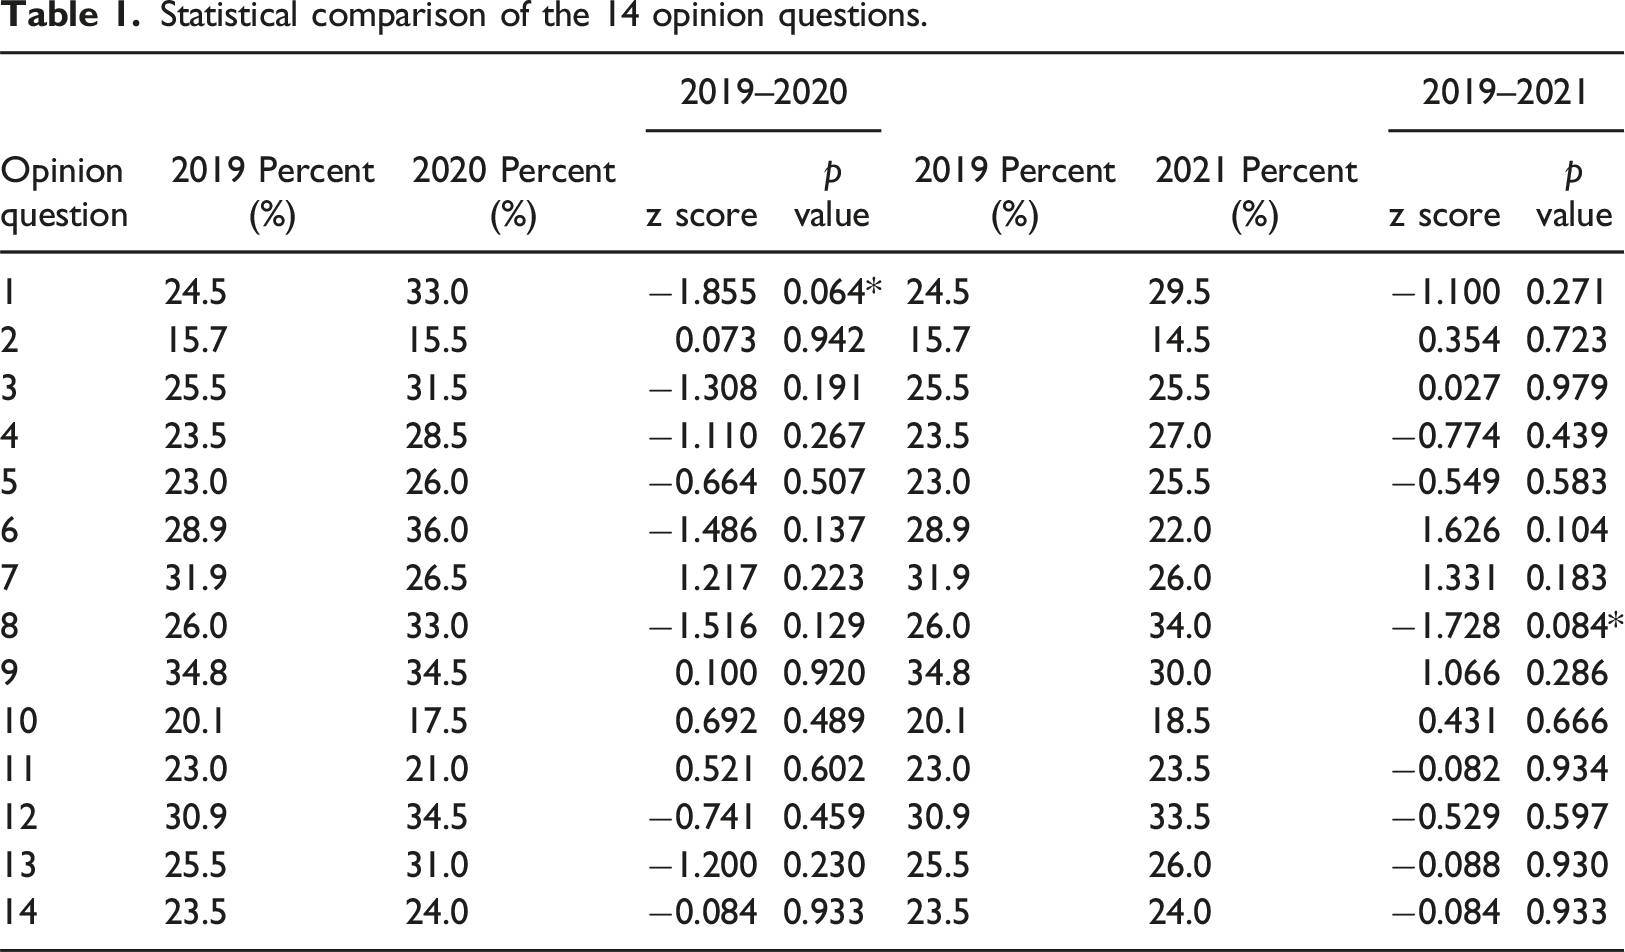
The z-scores and p-values for each question in both groups are shown below. The null hypothesis is that the proportion of respondents between 2019 and 2020 waves and the 2019 and 2021 waves are equal. As shown, all p-values are not significant at p ≤ .05, indicating that the null hypothesis cannot be rejected. The statistical evidence clearly indicates there is no need for a “don’t know/no opinion” checkbox when using a 7-point Likert scale.
There are two cases marked with an asterisk however, where the p-values are less than 0.10 which indicate directional significance at the 90% confidence level. Nevertheless, one would expect at least one of the comparisons to be significant since in this analysis there is no control for the “over all tests” p-value.
Conclusions
The results of this research demonstrate that 4 (the middle pick) + DK checkbox (where there is a DK option) is equal to 4 where there is no DK checkbox, further confirming that when people are not given a DK option, they go to the middle, as the only option given that says “I don’t know.” This research does not support the findings of Andrews (1984), specifically, “Inclusion of an explicit ‘Don’t know’ category was associated with better data-higher validity” For the three waves analyzed for this research, the attitudes expressed by the respondents were generally consistent between all three waves.
This implies that the “4” option in the middle of the seven-point scale functions effectively as a DK/NO option, and that there is no need to add an explicit option which takes up more space on the questionnaire and perhaps lengthen the time for completion by providing an unnecessary option. There may be special cases where a researcher wants to distinguish between those respondents who are truly ‘neutral’ while others really DK or have NO as stated by Albaum et al., 2011. Providing PNA (‘prefer not to answer’) – or ‘don’t know’ (DK) or ‘no opinion’ (NO) – options may alleviate frustration and provide respondents with a greater sense of control, resulting in greater completion rates… Indeed, research on these response options indicates that respondents tend to use them for a variety of reasons, not all of which are purely what the response is designed to represent.
While there is evidence from the literature that the DK/NO options improve response rates for various reason, the focus of this research is on the quality of the responses. The findings detailed in this research demonstrate that the quality of the responses are not affected by omitting the check box when using the seven-point Likert scale. It seems reasonable to assume that a five-point Likert scale would provide similar results. Therefore, the middle response effectively provides a DK or NO option for the respondent.
Footnotes
Declaration of conflicting interests
The author(s) declared no potential conflicts of interest with respect to the research, authorship, and/or publication of this article.
Funding
The author(s) received no financial support for the research, authorship, and/or publication of this article.