
Abstract
Necessary condition analysis (NCA) is a recent methodological advancement that is quickly being adopted by researchers. Whereas most path modeling techniques (multiple regression, PLS-SEM, CB-SEM, etc.) assume an additive or sufficiency logic, NCA employs a necessity logic, where it examines an independent variable’s level of performance necessary to achieve a certain level in the dependent variable. As a result, NCA is designed to identify must have levels of performance for independent variables. While NCA can be used on its own, most researchers recommend employing NCA as a complementary analysis tool. In this article, we propose that NCA can be a useful complement to the Kano model, key driver analysis, and importance-performance analysis. This article examines how NCA can be used in conjunction with these research methods and puts forth a call to action for future research.
Keywords
Introduction
Since its inception, necessary condition analysis (NCA) has been quickly adopted across a wide variety of academic disciplines (Dul, 2016; Dul et al., 2023). Most regression-based statistical techniques assume an additive or sufficiency logic, where a higher/lower level of an independent variable would lead to a higher/lower level of a dependent variable (Hair et al., 2022). In contrast, NCA assumes a necessity logic, where it examines an independent variable’s level of performance necessary to achieve a certain level in the dependent variable (Dul, 2016). Employing this logic, the level in the dependent variable will only occur if an independent variable’s level of performance is met (Dul, 2016). As a result, NCA is well suited for identifying must have levels of performance for independent variables.
While NCA can be used on its own, researchers recommend employing NCA as a complementary analysis tool (Hair et al., 2022). To date, most NCA research has been employed in academic research articles where NCA is employed as a complementary analysis to test academic theory, yet it’s use with research practitioners has been limited and its applications have been narrow in scope. The purpose of this article is to examine how NCA can be a useful complement to the Kano model, key driver analysis, and importance-performance analysis and to put forth a call to action for future research in these areas. We propose that NCA is a useful complement to these research tools without the need for additional survey questions.
Literature review
Necessary condition analysis (NCA)
NCA employs a necessity logic, meaning that the analysis focuses on the level of performance in an independent variable that is necessary to achieve a certain level in the dependent variable (Dul, 2016). With NCA, if an independent variable’s necessary level of performance is not achieved, then the dependent variable’s level of performance will not occur. NCA has a non-compensatory nature, suggesting that if a necessary condition (i.e., an independent variable’s level of performance) is not met, then another independent variable cannot make up the difference to achieve the dependent variable. NCA is a bi-variate technique, thus multicollinearity is not a concern when implementing NCA.
In contrast to a necessity logic, most regression-based statistical techniques assume an additive, sufficiency logic (Hair et al., 2022). In the sufficiency logic, independent variables lead to a dependent variable, where a higher/lower level of an independent variable leads to a higher/lower level of a dependent variable. These techniques have a compensatory nature, whereas low levels of performance in one independent variable can be overcome by higher levels of performance in another independent variable. Multicollinearity is a key limitation of many regression-based statistical tools (Garver & Williams, 2020).
Most applications of NCA have been employed as a complement to regression-based statistical techniques (Hair et al., 2022; Hauff et al., 2024; Sarstedt et al., 2024). Results from these studies suggest that an independent variable can be a significant predictor yet not a necessary condition (Hair et al., 2022). In contrast, results also suggest that an independent variable may be an insignificant predictor, yet a significant necessary condition (Sarstedt et al., 2024). Implementing NCA as a complement to regression-based statistical techniques provides a more holistic perspective of an independent variable’s influence on a dependent variable. NCA can utilized with both continuous and discrete dependent variables, yet our discussion here will focus on continuous dependent variables, as this aligns more with the purpose of this article.
NCA calculations
Regression-based techniques plot a straight line through the center of data points in a scatterplot. For continuous data, NCA utilizes this same scatterplot, yet it plots a ceiling line which runs through the top of the data points. Dul (2016 p. 22) states, “In the two-dimensional Euclidian space (XY-plane), the expression X is necessary but not sufficient for Y is graphically represented by the ceiling line Y =
The ceiling line identifies constraints, also known as bottlenecks. In bottleneck tables, researchers can examine different levels of the dependent variable and the corresponding necessary condition for each independent variable. The bottleneck table identifies the independent variable’s level of performance that is necessary to obtain a certain level of performance in the dependent variable. For example, if researchers are employing NPS as the dependent variable and the desired level of NPS performance is 9 (i.e., promoter), then NCA would determine which independent variables are necessary to achieve this level of NPS.
How do we know if the necessary condition (i.e., the empty space above the ceiling line) is large enough to matter? To answer this question, we need to calculate effect sizes of the necessary condition. Dull (2016 p. 29) states, “The effect (constraint) is strong if the ceiling zone is larger. Hence, the effect size of a necessary condition can be represented by the size of the ceiling zone compared to the size of the entire area that can have observations. This potential area with observation is called the scope (S). The larger the ceiling zone compared to the scope, the lower the ceiling, the larger the ceiling effect, the larger the constraint, and therefore the larger the effect size of the necessary condition. The effect size can be expressed as follows: d = C/S, where d is the effect size, C is the size of the ceiling zone, and S is the scope. Hence, d is the proportion of the scope above the ceiling.” Effect sizes range from 0 to 1. To evaluate if a necessary condition is present for an independent variable, effects sizes and their corresponding p value should be evaluated. Effect sizes over .3 are considered a large effect size, while effect sizes from .1 to .3 are considered medium effect sizes (Hair et al., 2022).
NCA is a powerful statistical tool, yet it is not without its limitations. Similar to other statistical tools, NCA cannot overcome problems with measurement error or sampling problems. In addition, it cannot provide evidence for causality. Furthermore, NCA can only predict the absence of an outcome and not the presence of an outcome. It should also be noted that NCA is a bi-variate technique.
NCA can use dichotomous data for either the independent or dependent variables (Dul, 2024). Likewise, interval data (i.e., from few to many levels) can be implemented for either the independent or dependent variables. If the independent variables use the same scale (i.e., 1–7), then unstandardized scores can be implemented, which makes interpreting the results straight forward (Hair et al., 2022). If the independent variables use different scales (i.e., one variable uses a 1 to 7 scale, while another variable uses 1 to 5 scale), then standardized scores should be implemented, which makes the interpreting the results less intuitive.
NCA may be utilized within R or SmartPLS 4 (Hair et al., 2022). For current users of either R or SmartPLS 4, being familiar with and having experience with these software programs will likely drive their implementation of NCA. A benefit of SmartPLS 4 is the easy-to-use graphical interface and the ability to use construct scores from PLS, yet the software is not free. Within SmartPLS4, NCA is in the multiple regression models. Once the model is specified, the researcher would then choose NCA as the calculation method. Within R, a free and open-source statistical software, the NCA add-on package can be accessed from the following websites: https://cran.r-project.org/web/packages/NCA/index.html or at https://www.erim.eur.nl/necessary-condition-analysis/software-and-calculator/. While the NCA add-on package in R is a complete and comprehensive package, the ERIM website also offers a free, easy to use NCA online calculator.
The discussion will now turn to NCA as a complementary analysis to the Kano model, key driver analysis, and importance-performance analysis. These techniques refer to independent variables as attributes, thus the label “attribute” will be used for the remainder of this article.
The Kano model
The Kano model is popular with researchers and puts forth five different relationships between attributes and overall customer satisfaction, which include: (1) Must have quality, (2) attractive quality, (3) one dimensional quality, (4) indifferent quality, and (5) reverse quality (Slevitch, 2024). The original Kano model proposed a series of survey questions to classify attributes to the above categories, yet most researchers focus on must have quality, attractive quality, and one dimensional quality attributes (Slevitch, 2024). For this article, we focus on must have quality, which is defined as those attributes which are necessary prerequisites (or level of performance) to achieve a certain level of overall customer satisfaction.
While the Kano model is intuitively appealing, researchers have identified a number of research issues (Slevitch, 2024). For example, the Kano model assumes the presence or absence of an attribute, yet in most applications, attributes have varying levels of performance beyond its presence or absence (Slevitch, 2024). Additionally, the Kano model assumes mutually exclusive relationships, but it is entirely possible and even likely, that attributes may possess more than one category. For example, research suggests that it is possible for attributes to be both must have as well as one dimensional attributes (Hair et al., 2022). Additionally, many researchers find the survey questions to be time consuming, cumbersome, and confusing to survey respondents (Furlan & Corradetti, 2010; Violante & Vezzetti, 2017). Finally, researchers suggest that the Kano model puts forth qualitative descriptions of attributes and suggest that quantitative analysis is needed to better classify attributes (Violante & Vezzetti, 2017).
NCA can help overcome these issues and allow researchers to more accurately identify must have attributes, without asking additional survey questions. NCA is not the only alternative statistical solution to achieve this purpose (Furlan & Corradetti, 2010). For example, R-sw software with Kano Driver Analysis (https://www.rsw-software.com/r-sw-drivers/kano-driver-analysis/) also identifies different attribute classifications from the Kano model without asking additional questions. Similar to NCA, it also classifies attributes by their level of performance. While the Kano model survey questions can only identify must have attributes by their presence or absence, NCA can identify must have attributes by their presence or absence as well as their levels of performance. In addition, the Kano model assumes mutually exclusive attributes, yet NCA does not make this assumption. Finally, NCA is a quantitative method that requires no additional survey questions.
NCA process for the Kano model
To implement NCA with the Kano model, researchers would collect traditional CX data centered on measuring customer satisfaction or performance on a number of attributes predicting a relevant dependent variable, such as the American Customer Satisfaction Index (ACSI) or the Net Promoter Score (NPS). It is not necessary to ask the Kano model survey questions.
Examining NCA results, researchers would focus on effect sizes and their associated statistical significance to determine if attributes are categorized as a must have attributes. We recommend identifying must have attributes as those with large effect sizes (over .3) with statistically significant relationships. Because the Kano model is often implemented with quality function deployment (Slevitch, 2024), we recommend researchers also focus on the actual level of performance (i.e., the necessary condition), which will likely be different for each attribute.
Key driver analysis (KDA)
KDA is implemented by researchers to statistically infer the importance of attributes that drive or influence a dependent variable, such as overall customer satisfaction or NPS (Garver & Williams, 2020). KDA results are important because they influence the allocation of resources and help guide strategic and tactical decision-making (Bansal & Duverger, 2013).
There are several research issues associated with KDA, yet most of these research issues focus on statistical tools that are best able to deal with a large number of attributes that possess high levels of multicollinearity (Garver & Williams, 2024). Multicollinearity occurs when two or more attributes are highly correlated, which is very common when conducting KDA (Bansal & Duverger, 2013). Multicollinearity is a critical limitation when implementing KDA because it can severely bias the results (Bansal & Duverger, 2013; Hair et al., 2022).
The literature is starting to find consensus that the most valid and accurate statistical methods for conducting KDA in the presence of multicollinearity is either relative weight analysis (RWA) or dominance analysis (Lebreton et al., 2004). While RWA and dominance analysis are appropriate statistical tools for KDA, both techniques assume a
NCA process for KDA - necessity and sufficiency attribute importance index (NSAII)
To implement NCA with KDA, researchers would collect traditional CX data centered on measuring customer satisfaction or performance on a number of attributes predicting a relevant dependent variable, such as the ACSI or NPS. To implement KDA, we recommend utilizing RWA to regress attributes against the dependent variable. To implement NCA with KDA, researchers would focus on an attribute’s effect size utilizing guidelines discussed previously.
Necessity & sufficiency attribute importance index (NSAII).
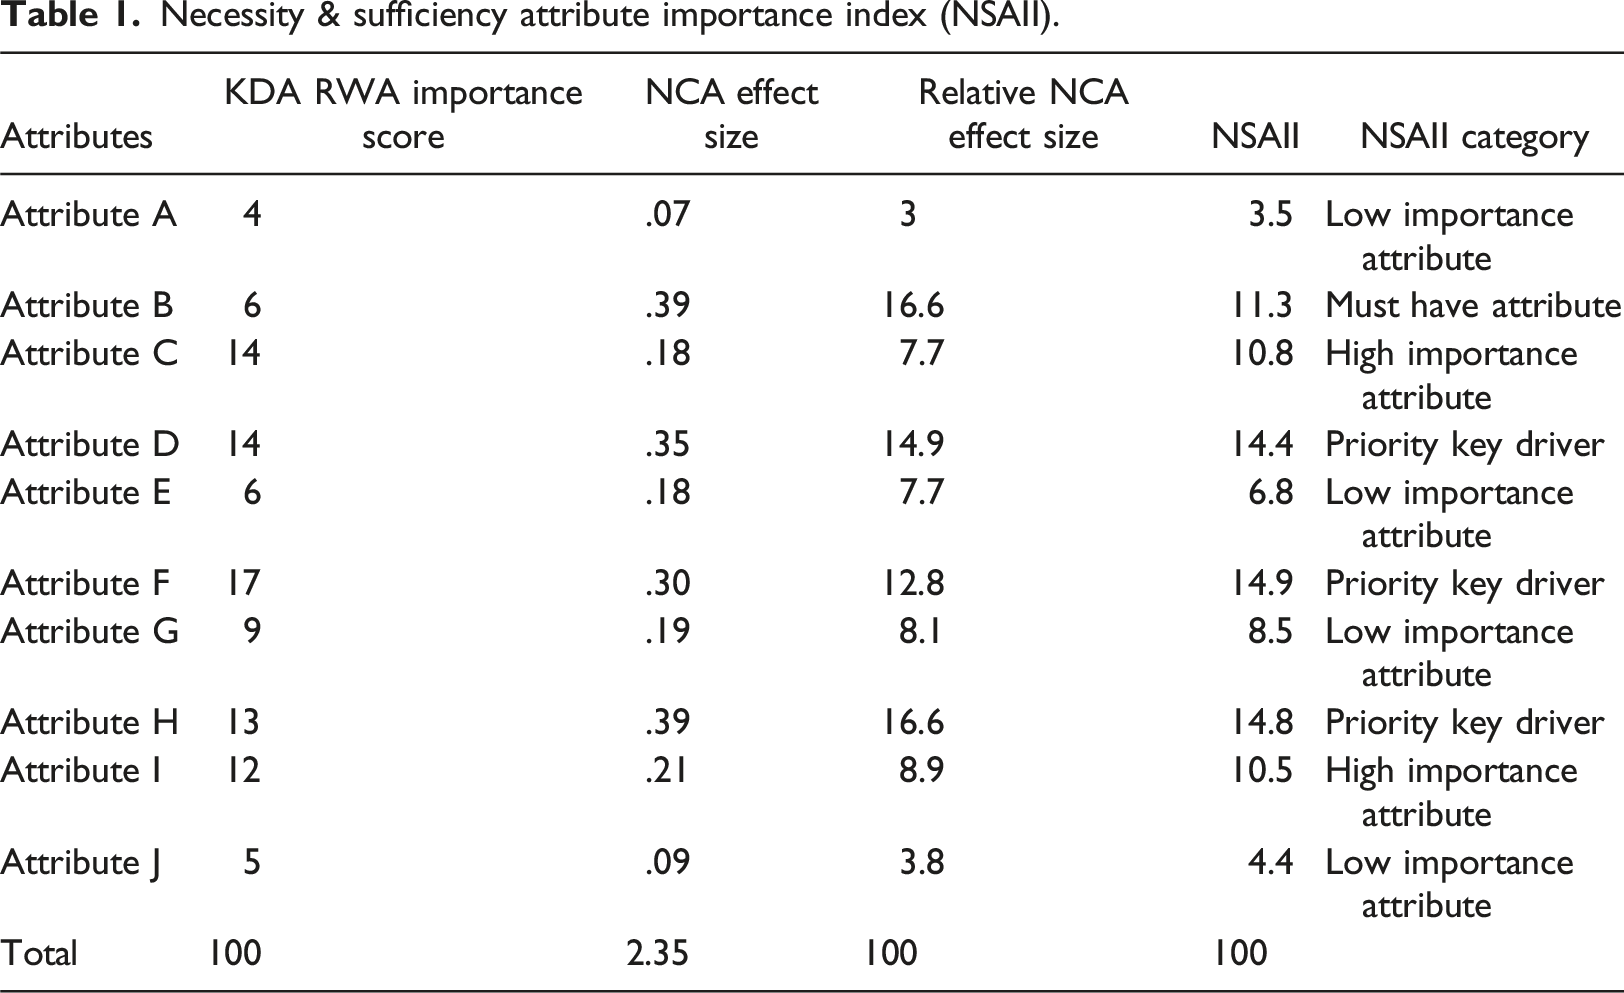
To better understand each attribute’s impact, it is important to classify attributes by their input scores to the NSAII. For example, attributes that are high in importance and are classified as must have (i.e., large NCA effect scores) would be labeled as “priority key drivers.” Attributes that are high in importance but not classified as must have would be labeled as “high importance attribute.” Attributes that are low in importance and classified as must have (i.e., large NCA effect scores) would be labeled as “must have attribute.” Attributes that are low in importance and not classified as must have would be labeled as “low importance attribute.”
To classify the attributes (priority key driver, etc.), researchers need to create a scatterplot of the attributes’ KDA RWA importance scores and their relative NCA effect sizes (Table 1). In this example (see Figure 1), the crossbar for KDA RWA importance is placed at the mean score, which for this example is 10, with a range from 0 to 20. The crossbar for the relative NCA effect size needs to be placed at a “large effect” size that would classify an attribute as must have. Because we are utilizing relative effect sizes, researchers must calculate the equivalent relative effect size that equates to a large NCA effect size (.3 or higher). In our example, this equates to the crossbar being placed at 12.8 for the relative NCA effect size. Necessity and sufficiency attribute importance index (NSAII).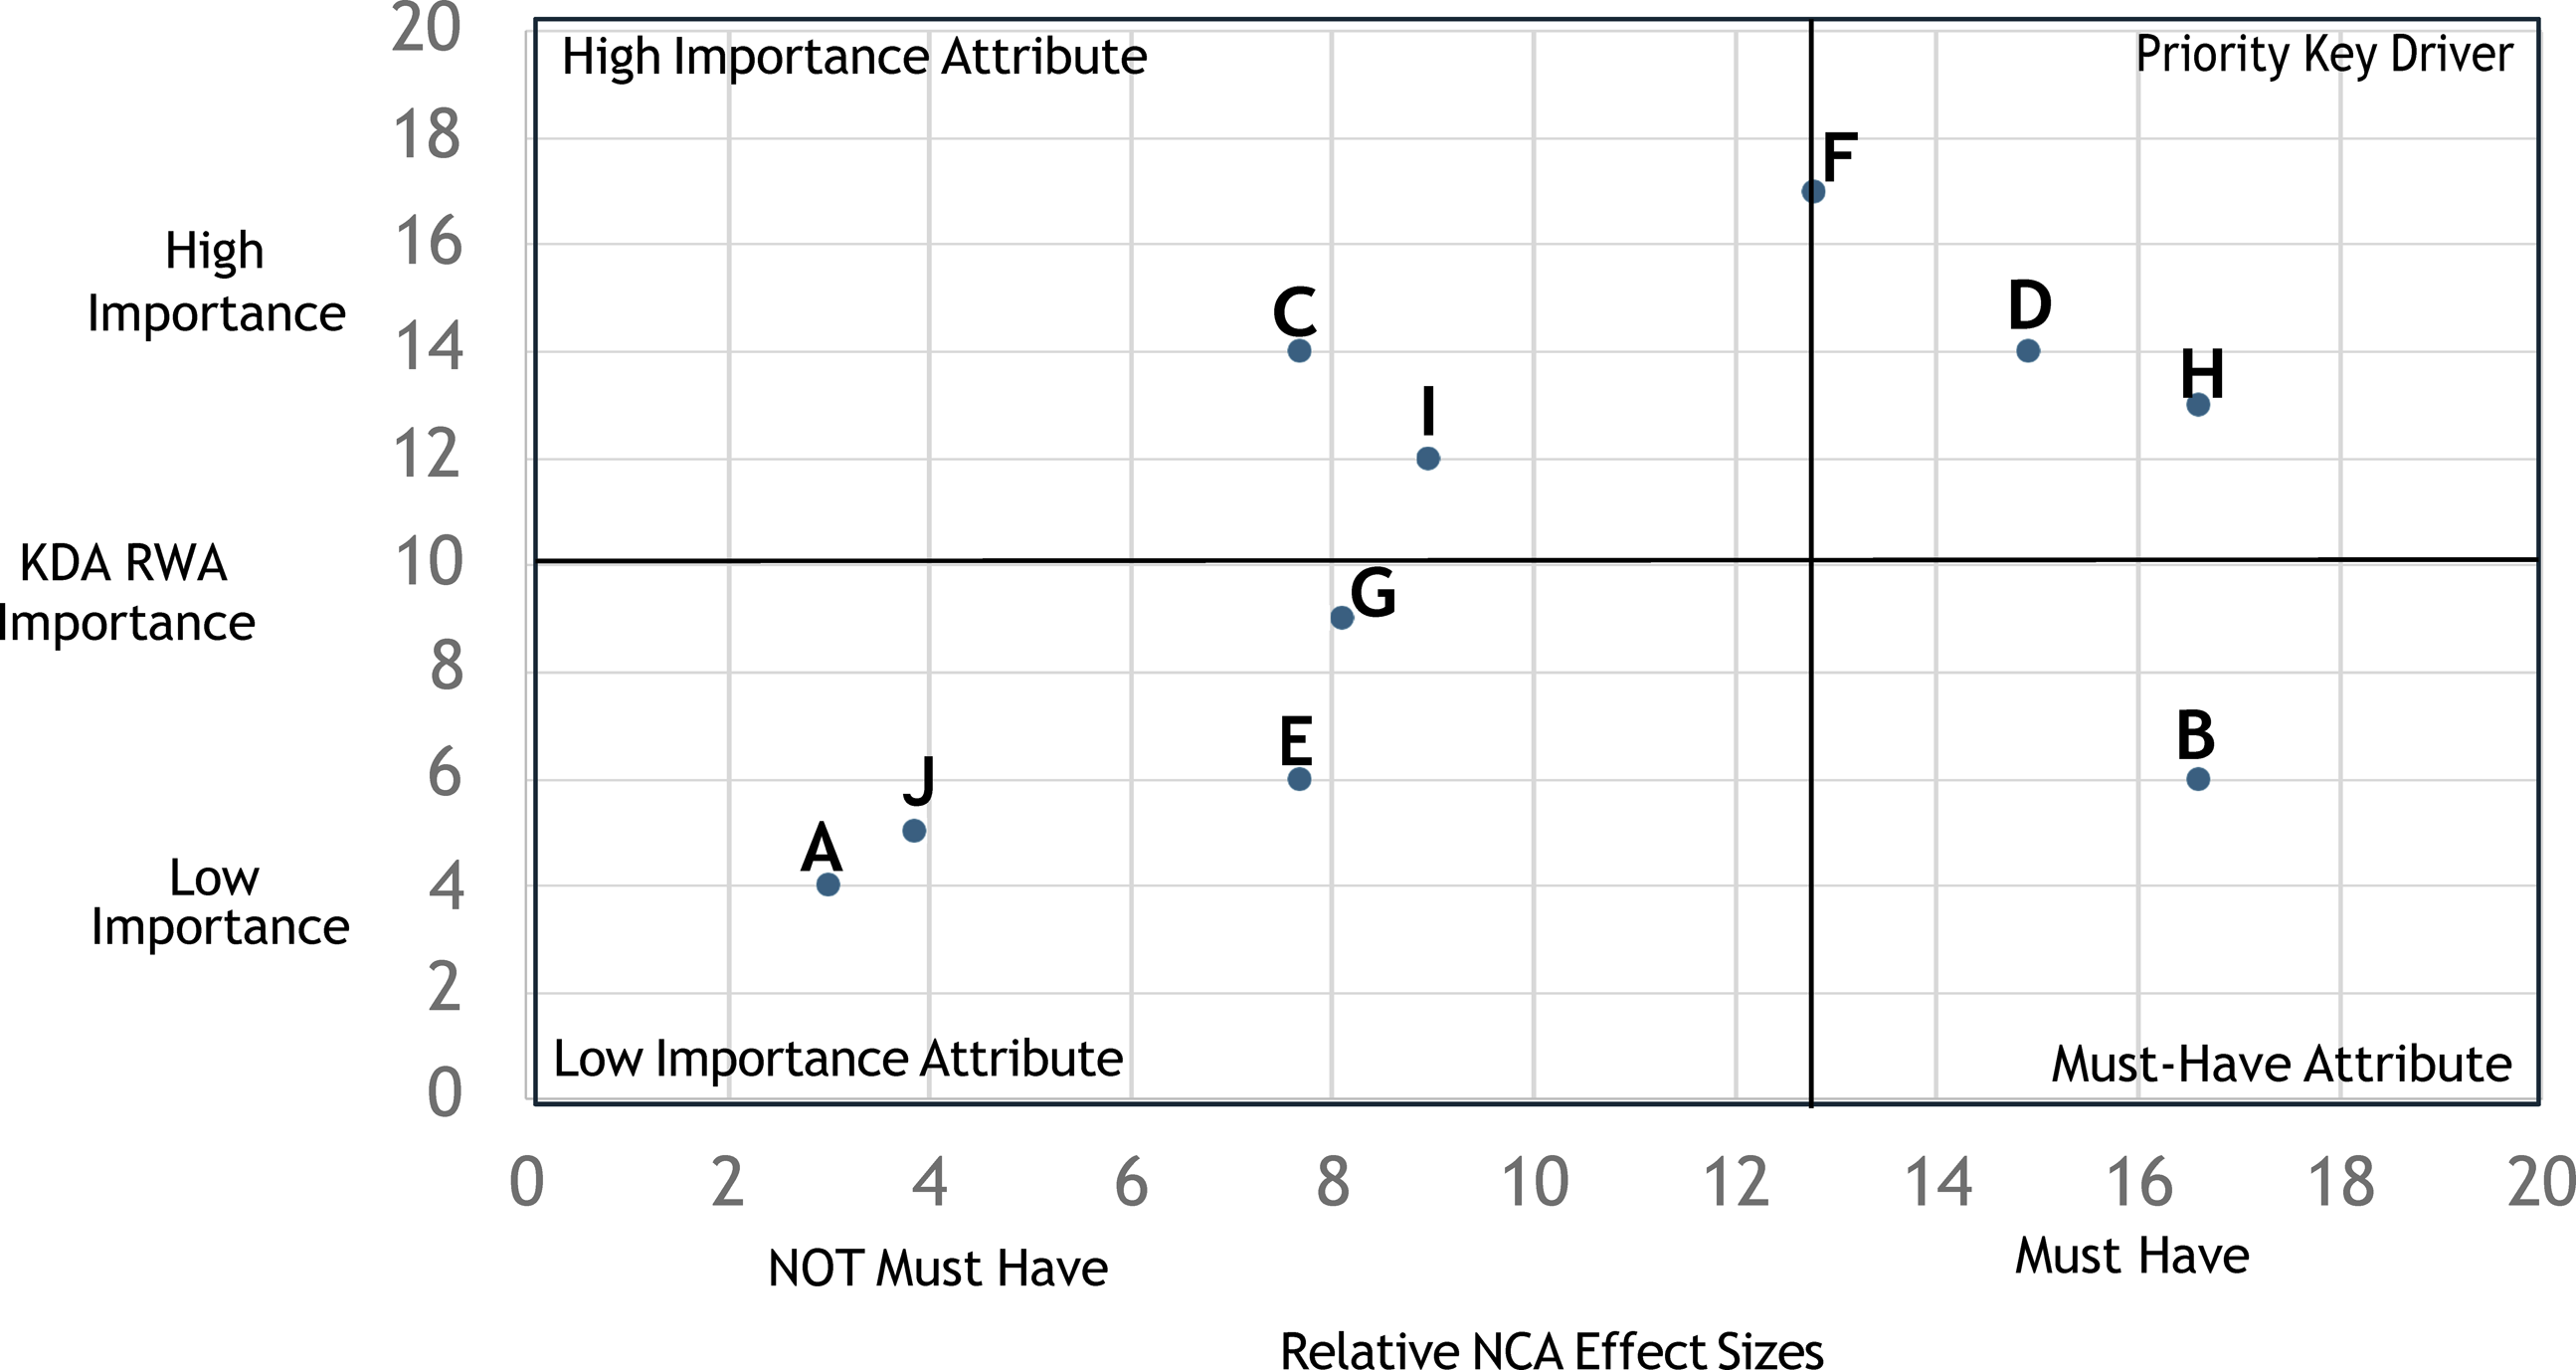
Examining Figure 1, attributes F, D, and H are classified as
Attributes F and G represent potential interpretation issues, because these attributes are close to the crossbars. For example, attribute F is directly on the relative NCA effect score crossbar, and a small change in its value would result in a major difference in its classification. Likewise, attribute G is close to the KDA RWA importance crossbar, and a small change in its value would result in a major difference in its classification. This underscores the importance of placing crossbars at the most appropriate place on scatterplots. Future research should investigate best practices for the placement of crossbars in this analysis. These issues also highlight the value of the NSAII. Classifying attributes is important because it will help practitioners conceptualize the necessity and sufficiency of different attributes, yet the NSAII delivers a more precise index of attribute importance that will not be influenced by the placement of crossbars.
Importance-performance analysis (IPA)
Martilla and James (1977) put forth importance-performance analysis (IPA) as an important graphing tool to help researchers identify attribute strengths, weaknesses, and improvement opportunities. To implement IPA, researchers create a scatterplot where the axes are attribute performance and importance. Crossbars are typically placed at the mean score of attribute satisfaction and importance, which then divide the scatterplot into four quadrants (Bacon, 2003). Martilla and James (1977) suggest that attributes that are high in performance and importance are major strengths (keep up the good work), while attributes that are high in performance and low in importance are minor strengths (possible overkill). These authors suggest that attributes that are low in performance and high in importance are major weaknesses (concentrate here), while attributes that are low in performance and importance are minor weaknesses (low priority). The goal of IPA is to identify a small number of attributes to be targeted for continuous improvement efforts, and researchers typically recommend improving major weaknesses first (Martilla & James, 1977).
IPA is a popular tool with practitioners, yet researchers have identified several issues and limitations (Bacon, 2003). To combat these issues, researchers have put forth a number of different IPA approaches as well as complementary analyses (Garver, 2024). Recently, NCA has been garnering much research attention as a complementary analysis to IPA (Hair et al., 2022; Hauff et al., 2024; Sarstedt et al., 2024).
NCA process for importance-performance analysis (IPA)
To implement NCA as a complement to IPA, researchers would collect traditional CX data centered on measuring customer satisfaction or performance on a number of attributes predicting a relevant dependent variable, such as the ACSI or NPS. Inputs to IPA are attribute importance (i.e., KDA) and performance scores.
If the intent is to examine the importance of a relatively small number of latent variables (i.e., 5 or fewer) with low to moderate levels of multicollinearity, then PLS-SEM would be the recommended statistical tool for KDA. If the intent is to examine the importance of a relatively large number of attributes (i.e., 6 or more) with higher levels of multicollinearity, then RWA would be the recommended statistical tool for KDA. Variance inflation factor (VIF) is an important metric to determine levels of multicollinearity in attributes, with low to moderate levels of multicollinearity having a VIF less than or equal to 3 (Hair et al., 2022). Attributes with a VIF greater than 3 would possess high levels of multicollinearity (Hair et al., 2022). For this example, RWA is the recommended statistical tool for KDA because it involves 10 attributes, and CX data typically has high correlation values and multicollinearity between the attributes. In this example, rescaled scores from RWA will be utilized as the importance score (Garver & Williams, 2020).
For performance of attributes, researchers typically utilize and plot mean scores in IPA (Bacon, 2003). For many offerings, this may be the only feasible choice. Yet, the limitation of this approach is that strengths and weaknesses are determined by attributes being better or worse than average and not determined by those attributes being better or worse than a best competitor in the marketplace. Garver (2003) suggests that a firm’s performance relative to a best competitor is a more valid input to IPA, and suggests using performance ratios (i.e., a comparison to a best competitor) where the crossbar would intersect where the firm is “tied” with the competition. Implementing this method, strengths and weaknesses are determined by being better or worse than a best competitor. In this example, attribute performance means will be utilized, yet future research should conduct this analysis utilizing performance ratios.
Sarstedt et al. (2024) suggest that NCA is a useful complement to IPA, and that the most important information from NCA is the percentage of the sample who does not meet the necessary condition. If an attribute’s level of performance (i.e., necessary condition) has already been achieved by a large percentage of the sample, then improving that attribute is not as critical. In contrast, if an attribute’s level of performance (i.e., necessary condition) has NOT been achieved by a large percentage of the sample, then improving that attribute is critical.
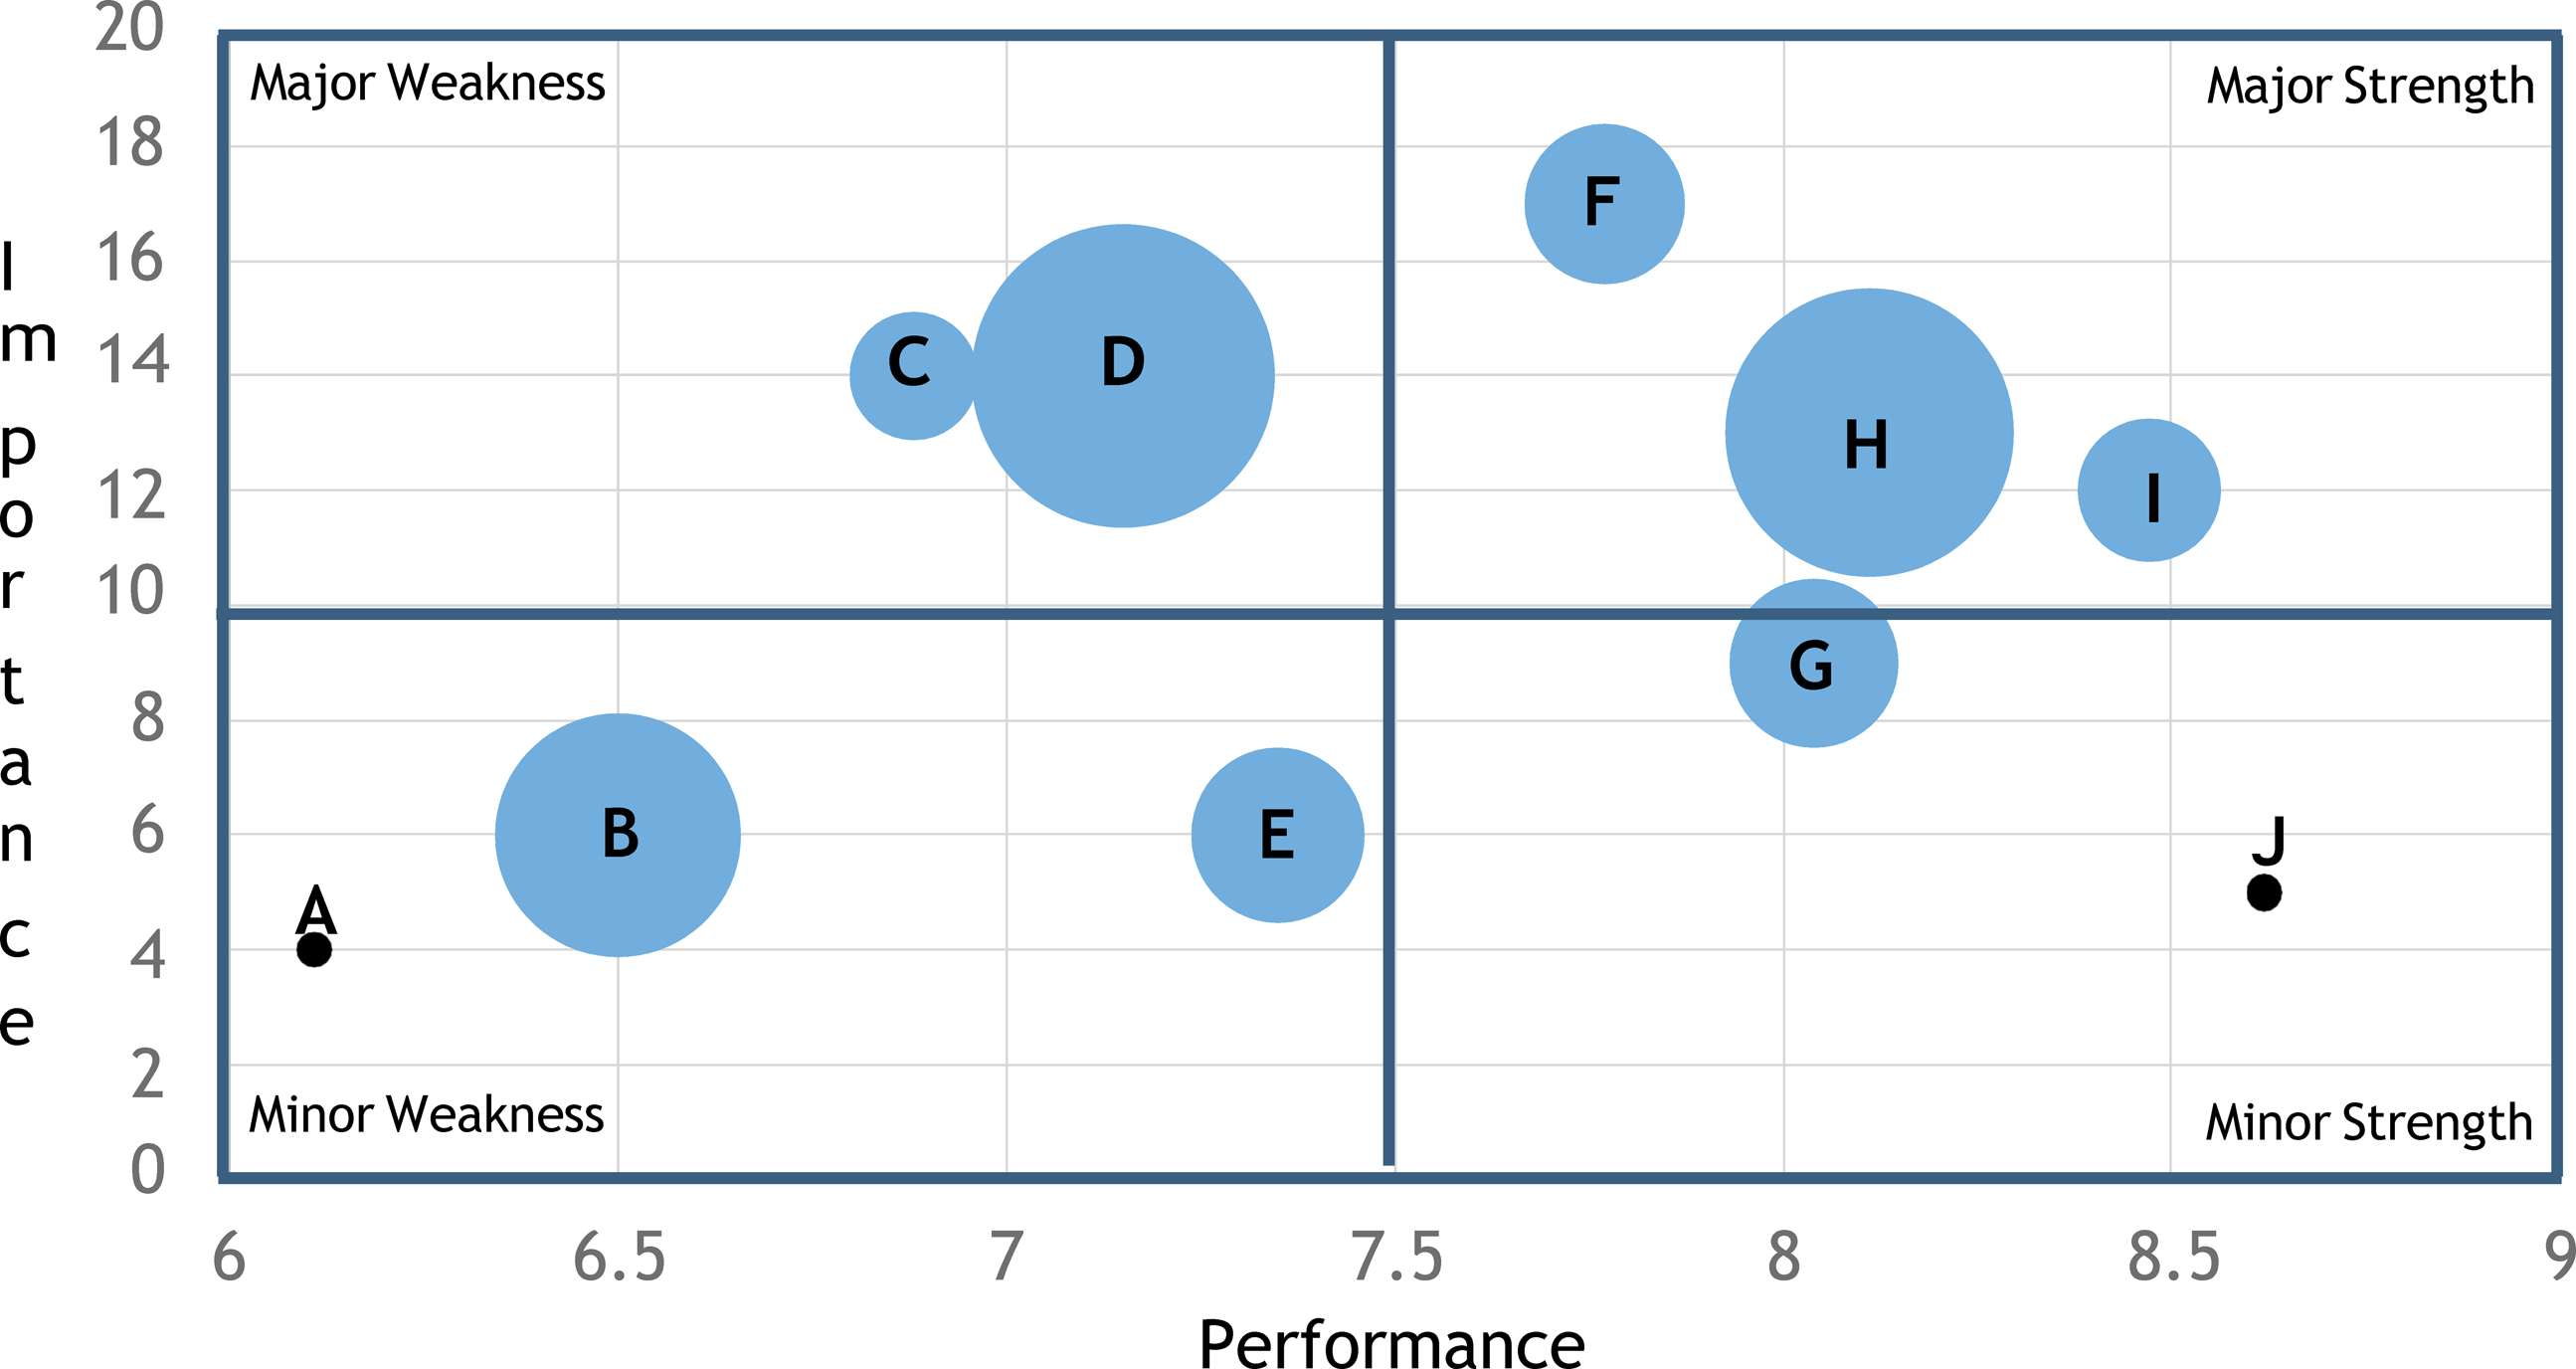
Implementing NCA as a complement to IPA, Sarstedt et al. (2024) adds the percentage of the sample who do not meet the attribute’s necessary level of performance (i.e., necessary condition) to IPA. More specifically, these researchers add this information to IPA by the size of the attribute’s “bubble.” For example, the larger the percentage of the sample who do not meet the attribute’s necessary level of performance, the larger the attributes bubble is in IPA. In contrast, the smaller the percentage of the sample who do not meet the attribute’s necessary level of performance, the smaller the attributes bubble is in IPA. If an attribute is not a must have attribute (small effect size less than .1), then the attribute is represented by a smaller black dot.
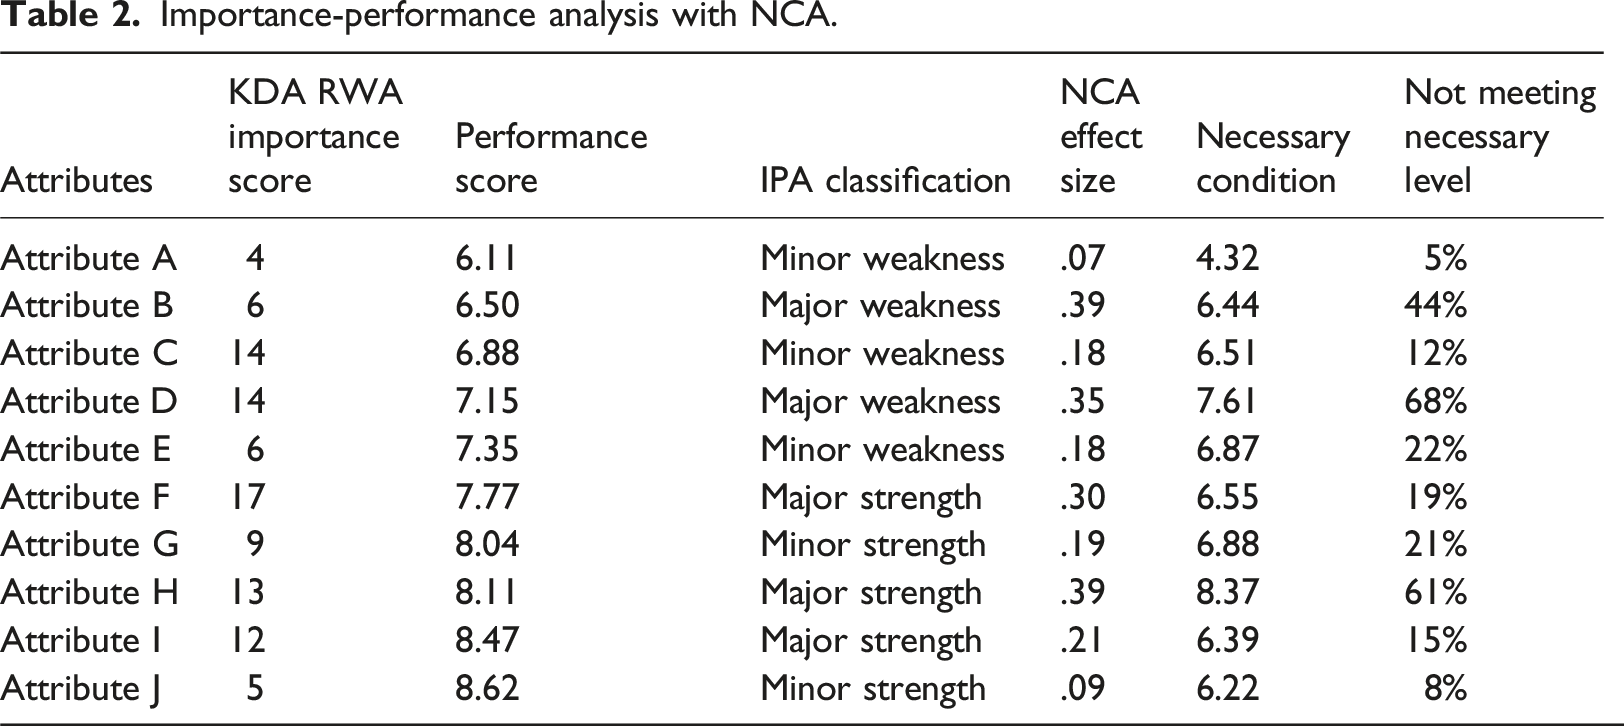
Importance-performance analysis with NCA.
Importance-performance analysis with NCA
Integrating NCA with IPA results in a different interpretation. Attribute D would still be prioritized from improvement efforts because it is a major weakness and has a large percentage of customers not meeting the necessary level (i.e., large bubble size). Attribute C is a major weakness, but it now has a lower priority for improvement because most customers are meeting its necessary condition. Attribute B (a minor weakness) might now be prioritized for improvement efforts because it has a large percentage of customer not meeting the necessary level (i.e., large bubble size). Attribute H, a major strength, may also be prioritized for improvement efforts because it also has a large percentage of customer not meeting the necessary level (i.e., large bubble size). For all these attributes, the necessary level of performance (i.e., must have) is also provided, which can serve as a benchmark of must have performance levels. For example, attribute H has a must have level of performance of 8.37. Integrating NCA with IPA provides a different perspective to the analysis, adding valuable insight.
Future research & conclusion
This research examined three different applications of NCA, specifically the Kano model, key driver analysis, and importance-performance analysis. The purpose was to introduce these applications and to put forth a call to action for future research. Future research needs to implement these approaches and to develop best practices to further refine each approach. Future research should also examine if the NSAII should be incorporated into IPA, replacing KDA attribute importance scores. If the NSAII represents a more complete understanding of an attribute’s importance, should this index replace KDA attribute importance scores in IPA? Future research needs to address this question as well as examine new applications of NCA.
Footnotes
Declaration of conflicting interests
The author(s) declared no potential conflicts of interest with respect to the research, authorship, and/or publication of this article.
Funding
The author(s) received no financial support for the research, authorship, and/or publication of this article.