






Abstract
We develop robust methods for analyzing clustered data where estimation of marginal regression parameters is of interest. Inverse cluster size reweighting in the objective function to be minimized is incorporated to handle the issue of informative cluster size. Performance of the resulting estimators is studied by simulation. Large sample inference and variance estimation is carried out. The methodology is illustrated using a periodontal disease dataset.
Introduction
The method of least squares is applied most often to estimate the parameters of a linear regression model. It is equivalent to maximum likelihood estimation if one assumes that the model errors are normally distributed. However, these estimates are sensitive to the presence of outliers in the data. More robust estimators of the regression parameters can be obtained by partly replacing the residual by its rank in the objective function of the least squares criterion leading to the so called R-estimator (Jureckova, 1971; Jaeckel, 1972; McKean and Hettmansperger, 1978). The classical regression setup assumes that the data (response) are independent, though not identically distributed.
We consider R-estimation of regression parameters in a linear model when the data are clustered so that the observations (responses) within a cluster are correlated, but data belonging to different clusters are independent. Let M denote the number of clusters and Y
ij
denote the jth value of the response variable in the ith cluster

where
We consider the possibility that the cluster size is random and informative (Hoffman et al., 2001; Williamson et al., 2003; Gansky and Neuhaus, 2009; Nevalainen et al., 2013) in which case Yij may be statistically correlated with the cluster size μi. In practice, this could arise when the cluster size depends on a cluster level latent factor (such as a random effect), a cluster level covariate, or both. For a more formal definition of informative cluster size in a regression setting, see Nevalainen et al. (2013). We give an example of this in Section 5 where the use of standard R estimator leads to substantially biased estimators of certain parameters.
The rest of the article is organized as follows: The R-estimating functions are introduced in the next section. Theoretical (large sample) results are developed in Section 3. Simulation results are presented in Section 4 where we compare the R-estimators with a weighted least squares estimator and a mixed effects model based estimator. We illustrate the use of our estimator with the dental data in Section 5 which motivated the statistical methodology developed in this article. We study the marginal effects of covariates such as smoking on attachment loss in a sample of periodontal disease patients. The clusters in this application are all remaining teeth belonging to the same individual. Since the number of remaining teeth may be indicative of a patient’s overall oral health, the cluster size is potentially informative. Also, the quantitative outcomes in this dataset were non-normal, making the use of robust methods more appealing. The article concludes with a discussion section (Section 6).
We propose to estimate the vector of marginal regression parameters b by minimizing the following inverse cluster size weighted objective function:

i.e.,

where

where
Once the regression parameter

Once again, this is different from the traditional R-estimator of
We undertake an extensive simulation study in Section 4 comparing the performances of these two sets of R-estimators.
A careful formulation of the estimation problem and technical arguments for its asymptotic analysis will be necessary since a zero median (or mean) property for the

Note that F can be regarded as the distribution of the model error associated with a typical measurement (i.e., chosen at random from all units in that cluster) of a typical cluster (i.e., chosen at random from all available clusters). Mathematically speaking, consider two random indices I and J such that I ~ uniform {1, . . . , M} and, given I = i, J ~ uniform {1, . . ., ni}. Then
We assume T(F) = 0, where T is the median; other location functionals can be used as well which will lead to the corresponding estimators of the intercept parameter
Let, without loss of generality, the true

By similar argument as in Datta et al. (2012),

with

in a local neighborhood of 0 (the true

with
For making statistical inferences based on this asymptotic normality result, we need to estimate the asymptotic variance covariance matrix. To that end, we will first discuss the estimation of

where

where

and

Here
Finally, the asymptotic variance–covariance matrix of

with

and

Next, combining the arguments of Datta et al. (2012) with Hettmansperger and McKean (2011, equation 3.5.22), we get:

where

Therefore,

where

with
An estimator of the asymptotic variance of

where

and

Here,
Theoretical investigation of the issue of optimal selection of h and
We consider a data generation scheme with M clusters. Two choices of M (50 and 100) were considered. First we generate a cluster specific random effects term

Another individual level covariate Wij is generated independently for each individual following the standard normal distribution. Model errors
In Table 1, we report the bias and the standard deviation of four sets of competing estimators including two R-estimators, one incorporating the inverse cluster size weighting (weighted R) and one without (naive R). Each of these entries is computed using a Monte Carlo sample size of 500. As can be seen from this table, the naive R-estimators for the intercept term
Monte Carlo estimates of bias and standard deviation (within parentheses) of various estimators under three different error distributions; each entry is based on 500 iterations. The high bias values are indicated in bold
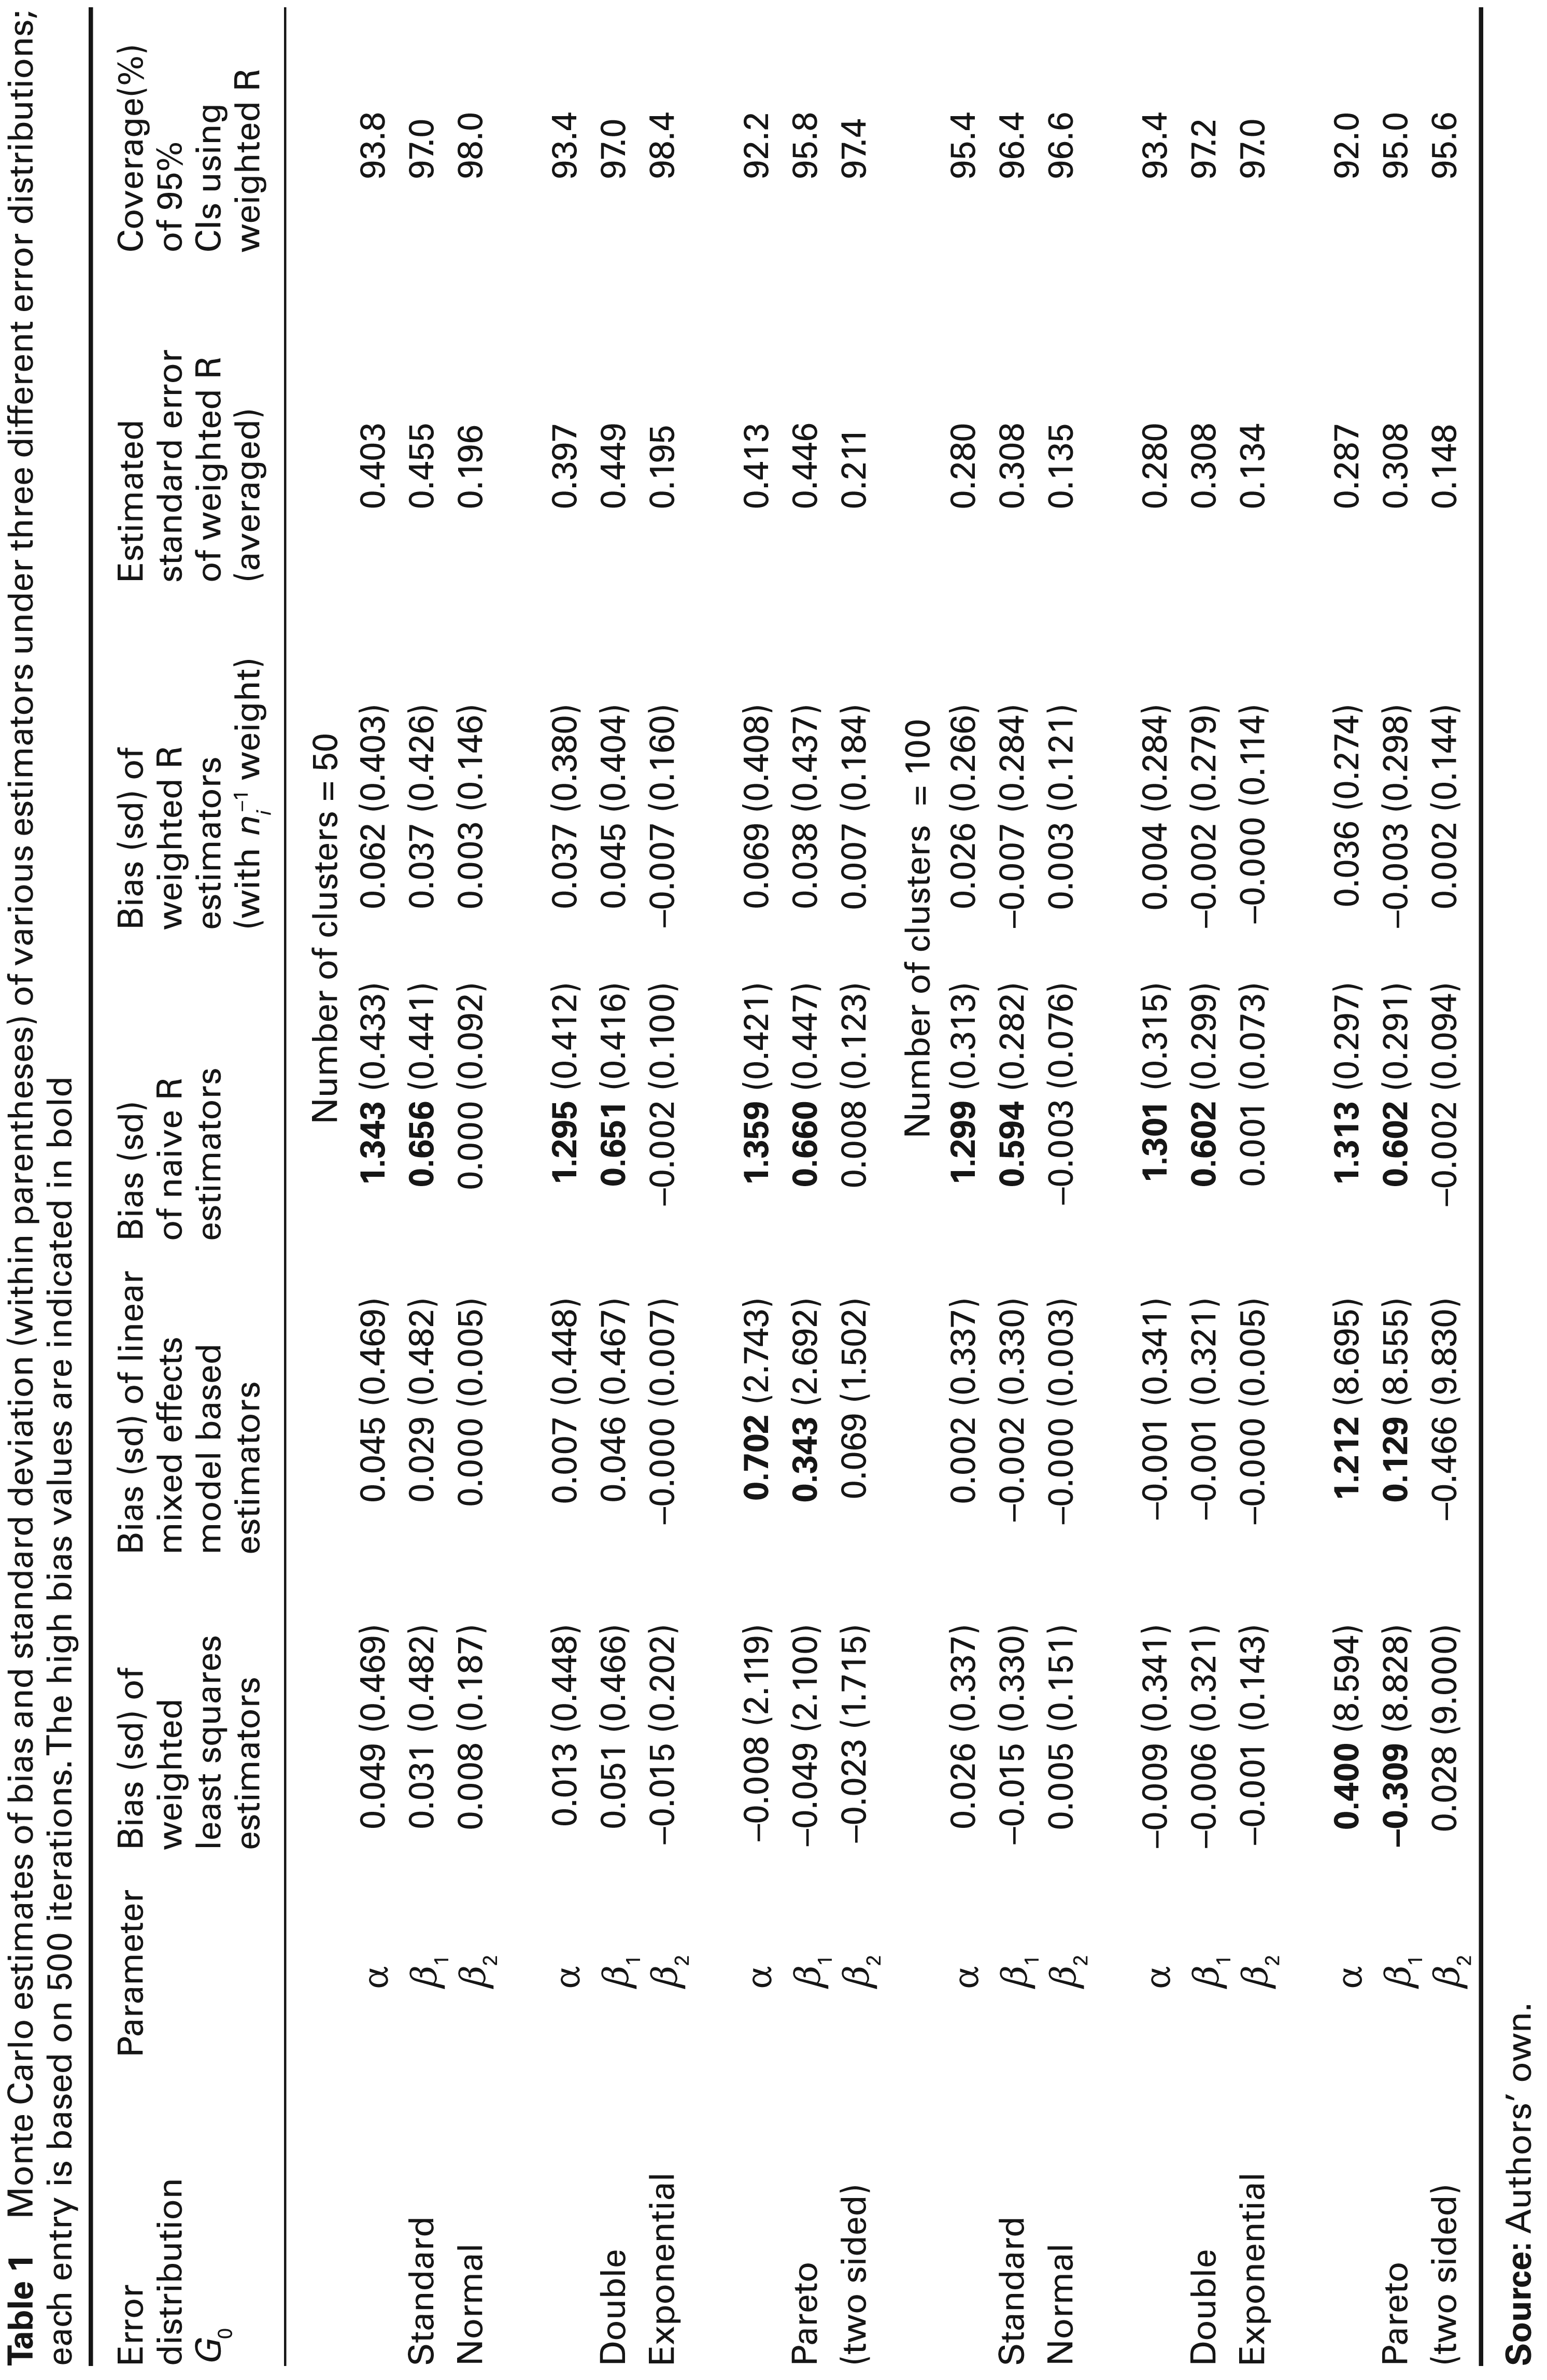
Monte Carlo estimates of bias and standard deviation (within parentheses) of various estimators under three different error distributions; each entry is based on 500 iterations. The high bias values are indicated in bold
We have also investigated the behaviour of the least squares estimator (LSE) and the one obtained from a classical mixed effects modelling of the data. To be fair, we use the same inverse cluster size reweighting in computing the least squares estimator since without these weights, the LSE for a and β1 will be biased just like the naive R-estimator (details not shown). It turns out that both these estimators perform fairly well for the normal and double exponential errors under the cluster size distribution considered here. However, they exhibit substantial bias and/or variance in case of a heavy tailed error (Pareto) distribution. Note that for Pareto errors, the response does not have a finite first or second moments and hence these estimators fail to be consistent and asymptotically normal. Thus, overall, the weighted R-estimator is the only one to have low bias and variance in all cases.
We also investigate the performance of the variance estimates for our weighted R-estimator. In Column 7, we report the average estimated standard errors over the Monte Carlo samples. These values seem to be in good agreement with the empirical standard errors reported in parentheses of Column 6. Finally, the last column reports the true (empirical) coverage of a nominal 95% large sample confidence interval obtained using the weighted R-estimator and the corresponding estimated standard errors. This is the empirical proportion of the 500 confidence intervals containing the true parameter. The coverage appears to be reasonable and generally improves with the number of clusters.
We illustrate our methodology on a periodontal dataset extracted from the Piedmont 65 + Dental Study (Beck et al., 1990). The Piedmont Health Study of the Elderly (Blazer and George, 2004), which is the parent study for this Piedmont 65 + Dental Study, is a longitudinal study of the health status of people aged 65 and over in five contiguous North Carolina counties. The Piedmont 65 + Dental Study takes advantage of the data available from the parent study while collecting additional information by means of an interview, oral examination, and microbiological and salivary assays.
Our response here is the total attachment loss which is measured at the tooth level. We apply our robust regression technique to study the effect of two potentially important covariates, tobacco use and socioeconomic status (SEIRSP), on the periodontal condition of a patient as measured by the total attachment loss of a typical remaining tooth. Since the sampling proportions for the blacks and whites were different for the parent study, the data for the two races should be analyzed separately in order to avoid any potential bias. For this reporting, we only use the data for the white patients at sixty months from study enrolment.
Here, the teeth belonging to each patient form a cluster and the cluster size is the number of remaining teeth at sixty months. It ranged from 1 to 32; 8 was the mode and 14 was the median. Since the tooth level data are clustered within each patient and the patients with fewer remaining teeth during the study tend to have greater attachment loss (possibly linked by health style choice such as tobacco use and possible latent factors such as oral hygiene), the cluster size for this data is potentially informative. This is clearly visible from the boxplots of patients grouped according to the extent of tooth loss (low = greater than 18 remaining teeth, between 8 and 18 remaining teeth, high = less than 8 remaining teeth) where the median attachment loss tends to be greater for individuals with fewer remaining teeth. (Figure 1)

Parameter estimates for the periodontal disease data

The use of tobacco was measured by a binary variable TOBUSE (=1, if user and = 2, if non user) and the socioeconomic status of the participant (in combination with that of his/her spouse) was measured by a continuous variable SEIRSP (with higher SEIRSP value indicating better socioeconomic condition). We fit a marginal regression model of the form (1.1) with these two covariables. The parameter estimates are reported in Table 2 along with 95% confidence intervals. In fact, we recompute the standard error and the confidence intervals with different bandwidths to ensure that our results are not greatly affected by the bandwidth selector. Based on this analysis, we can conclude that tobacco use is a statistically significant predictor of attachment loss. The effect of socioeconomic status on attachment loss was (borderline) significant as well.
We also report the results of naive (e.g., unweighted) R-estimation for comparison. There seems to be substantial differences between the estimated effects of the covariates between the two methods which is perhaps a reflection of the informative cluster size. In particular, note that the point estimate of the intercept term based on naive R lies outside the 95% confidence intervals constructed using the weighted R estimation methodology, suggesting that the naive R estimators may be severely biased. We have also reported the weighted least squares estimators which also differ substantially from the weighted R-estimators for this non-normal data (Figure 2). In particular, the intercept term is estimated to be much higher (as compared to the robust weighted R estimator) due to the long right tail of the error distribution; this in turn might have affected the estimator of the effect of tobacco use.

Finally we inspect the model residuals computed using the weighted R fit of the marginal regression model. In Figure 2, we display the inverse cluster size weighted histogram of the residuals. The shape of the histogram suggests a substantially non-normal error distribution. Thus, rank based methods may be more appropriate for this data than normal distribution based methods.
Clustered data methods are becoming increasingly popular and useful in applied research. Most clustered data approaches incorporate correlations in order to improve efficiency of the resulting inference. However, the issue of informative cluster size is less understood and often ignored.
As shown here, contrary to popular belief, the classical estimators of a marginal linear model may be biased, not just for the intercept term, but also for certain covariate effects when the cluster size is informative. A simple inverse cluster size reweighting at the correct place is capable of rectifying the problem. Theoretical development, albeit more difficult, is possible including asymptotic variance estimation that exploits independence of the clusters. However, appropriate methods, when the number of clusters is small, may involve more complex joint modelling of the cluster size, covariate and response.
Robust methods are a useful and appropriate choice for many practical applications. Examples include nonparametric rank type tests for clustered data problems with informative cluster size developed in Datta and Satten (2005, 2008) and Datta et al. (2012). Overall, the methodology developed in this article may avoid many pitfalls faced by standard analyses (e.g., least squares, mixed effects model, etc.) when the data are non-normal, clustered, and the cluster size is correlated with the cluster response, either through a latent factor or through one or more measured covariates. In addition, the methodology does not require specification of a correlation structure which may be complex and non-verifiable for certain applications. For the dental data application, the proposed method yielded reasonable and statistically significant estimates of various effects.
The estimator proposed here is fairly easy to code in R (R Core Team, 2012). However, since it involves numerical optimization, the computation could be somewhat time consuming in the case of large sample sizes and several covariates.
Footnotes
Acknowledgements
We would like to thank the three anonymous reviewers for their helpful comments which led to an improved manuscript. This research was supported by NIH grants 1R03DE020839-01A1, 5R03DE020839-02, 1R03DE022538-01, and 5R03DE022538-02. We thank Kevin Moss for helpful discussions regarding the periodontal data. We also acknowledge editorial assistance from Anisha Datta.