
Abstract
As the degree of power enhancement in internal combustion engines increases, the engines face significantly greater mechanical and thermal loads, presenting more challenges to the noise, vibration, harshness (NVH) performance and reliability of the entire machine. Effective NVH control requires accurate identification and analysis of vibration and noise sources, and a prerequisite for accurately identifying these sources is conducting thorough fault detection of related components. With the help of LabVIEW software, a system for empirical mode decomposition (EMD) and autocorrelation analysis was developed. Test results show that the autocorrelation signal analysis of the oil pan, generator, and cylinder head cover at 800 r/min, compared with the EMD component signals, resulted in no clutter signals, confirming the absence of fault waves in the components.
Keywords
Introduction
With the progress of society and the increase in environmental awareness, great attention is given to the vibration and noise generated by internal combustion engines themselves. In addition to this, scientific research teams and many researchers have taken the improvement of engine performance and the reduction of the engine’s inherent vibration and noise as research and development goals. However, due to the unique structure of the internal combustion engine adopting the crank-connecting rod mechanism, the working process of the internal combustion engine is not continuous, which makes the vibration generated by the internal combustion engine have the characteristics of multiple vibration sources and complexity, mainly including the overall engine vibration, crankshaft system torsional vibration, crankshaft system lateral vibration, crankshaft system longitudinal vibration, local vibration of various components caused by the main motion system, and various types of noise caused. Therefore, fault diagnosis of components is particularly important.
Research on vibration fault diagnosis started earlier abroad. In 2018, Aftab et al. 1 used Multivariate Empirical Mode Decomposition (MEMD) to extend the standard oscillation detection based on EMD; in 2019, Gurtner et al. 2 used an improved EMD detection method to study the multicomponent control loop of complex nonlinear electromechanical systems of electromechanical closed-loop systems; in 2022, Wang and Cheng 3 conducted numerical experiments based on the boundary effect of the EMD algorithm to analyze multiple screening and intrinsic mode functions (IMFs). These studies show that using the EMD method can achieve better results. Domestically, in 2012, Guo et al. 4 used the vibration signals measured by the EMD algorithm to study the fault diagnosis of wind turbines; in 2020, Zhang et al. 5 used the EMD- Singular Value Decomposition (SVD) and Convolutional Neural Network (CNN) methods to diagnose the faults of rotating machinery with the measured vibration signals.
In summary, it can be seen that vibration fault diagnosis research on internal combustion engines has been widely carried out both domestically and internationally. This paper aims to better study engine fault diagnosis by using LabVIEW software programming related systems to conduct EMD-autocorrelation fault diagnosis analysis.
Theoretical algorithms
The overall design of the vibration testing system mainly utilizes a While + loop structure, programming different modules according to different functions. The specific functions can be divided into vibration collection, signal analysis, signal processing, time-domain analysis, frequency domain analysis, time-frequency analysis, and EMD algorithm analysis.
The vibration collection module mainly uses the DAQmx program to collect relevant vibration acceleration signals. The vibration analysis module primarily converts the measured vibration signals into order spectra and level spectra based on algorithm programming, analyzing the vibration signals of engine speed changes over time to determine if there are any unnecessary sources of vibration. The vibration signal processing system module mainly filters the measured vibration signals through digital filtering and window function filtering to obtain digital plus window filtering, removing unnecessary interference waveforms. The algorithm analysis module includes time-domain analysis, frequency domain analysis, and time-frequency analysis to identify and analyze the location of the maximum vibration points in the collected vibration acceleration signals. The EMD algorithm mainly uses instantaneous frequency to describe non-stationary local vibration signals and uses the IMFs to decompose the complex measured vibration acceleration signals into individual signals and forms to quantify the measured instantaneous frequencies. The functional modules of this vibration system design are shown in Figure 1, the following diagram. Vibration testing and analysis system diagram.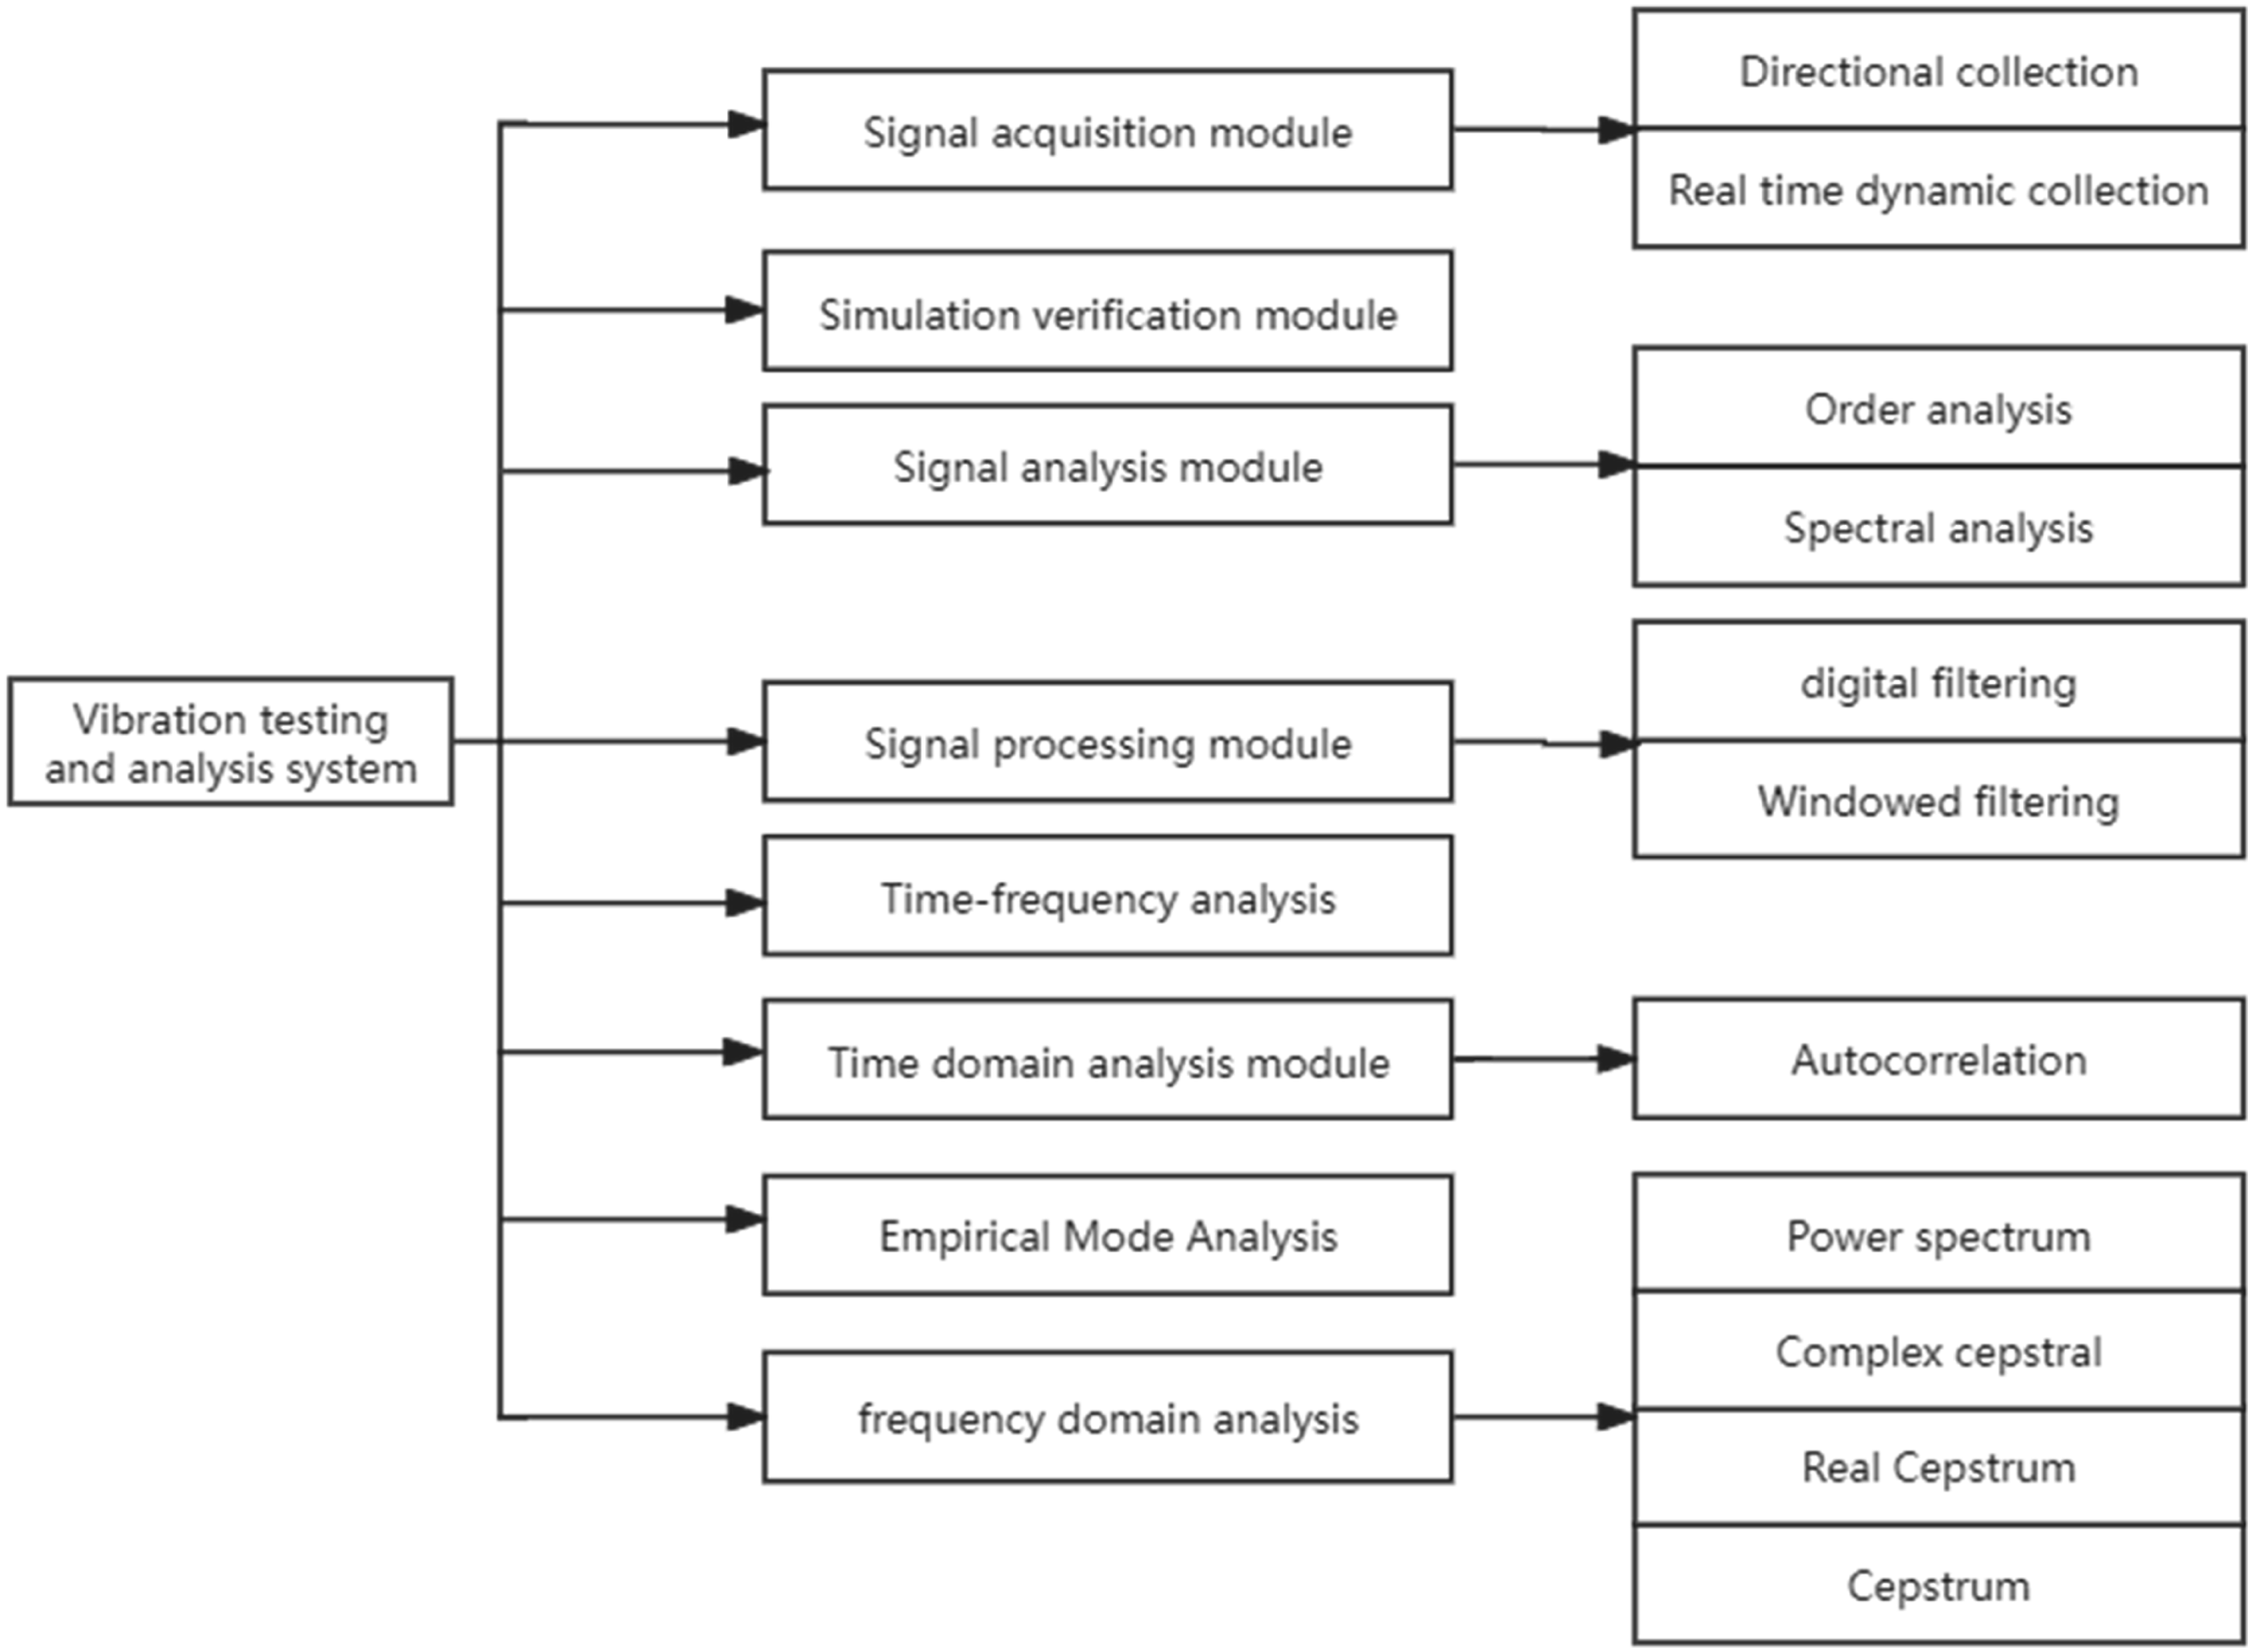
Theory of the EMD algorithm
The EMD algorithm decomposes a complex original vibration signal into several IMFs with different characteristic frequencies based on the absence of a base function, at different time scales. The frequency of these mode functions decreases progressively with the increase in the decomposition order, and each IMF is independent and does not interfere with each other.
The main focus of the EMD algorithm for vibration signals is on the analysis of instantaneous frequency and IMFs. Instantaneous frequency mainly reflects the frequency of the vibration signal at a certain moment, compensating for the inability of spectral analysis to analyze frequencies that change over time. For instantaneous analysis of vibration signals, the measured vibration signals are usually converted into analytic signals using the Hilbert transform, with the measured vibration signal denoted as X(t); and the analytic signal denoted as S(t). The specific formulas are shown as follows:


In Formula (2), p denotes the principal value of the integral.
For the instantaneous frequency of the vibration signal, the derivative of Formula (4) can be taken, with the instantaneous frequency denoted as f(t), and the formula is:

The analysis of IMFs is for calculating instantaneous frequencies and identifying any meaningless frequency components during the Hilbert transform of the function. The reason for using IMFs is that instantaneous frequency can only reflect a single component of the vibration signal, but to analyze the entire vibration signal, the original signal needs to be decomposed into multiple single-component vibration signals. The EMD can decompose the original measured vibration signal into multiple single-component vibration signals, which are referred to as IMFs. The IMF components need to satisfy two conditions: on the one hand, the number of extrema and zero-crossings in a complete signal sequence should be equal or differ at most by one; on the other hand, the local mean of the signal’s envelope defined by its local maxima and the envelope defined by its local minima should be zero, and symmetrical within that local time region. This symmetry is to avoid unnecessary fluctuations in the instantaneous frequency when converting global constraints to local constraints, making the obtained instantaneous frequency analytically meaningful.
In practical scientific research, the vibration signals collected often contain a large amount of impact clutter noise, which mostly does not meet the requirements for IMF components. Therefore, the collected vibration signals are first decomposed to obtain the required IMF components, ultimately obtaining signals that meet the requirements for IMF components (Figure 2). Emd calculation flowchart.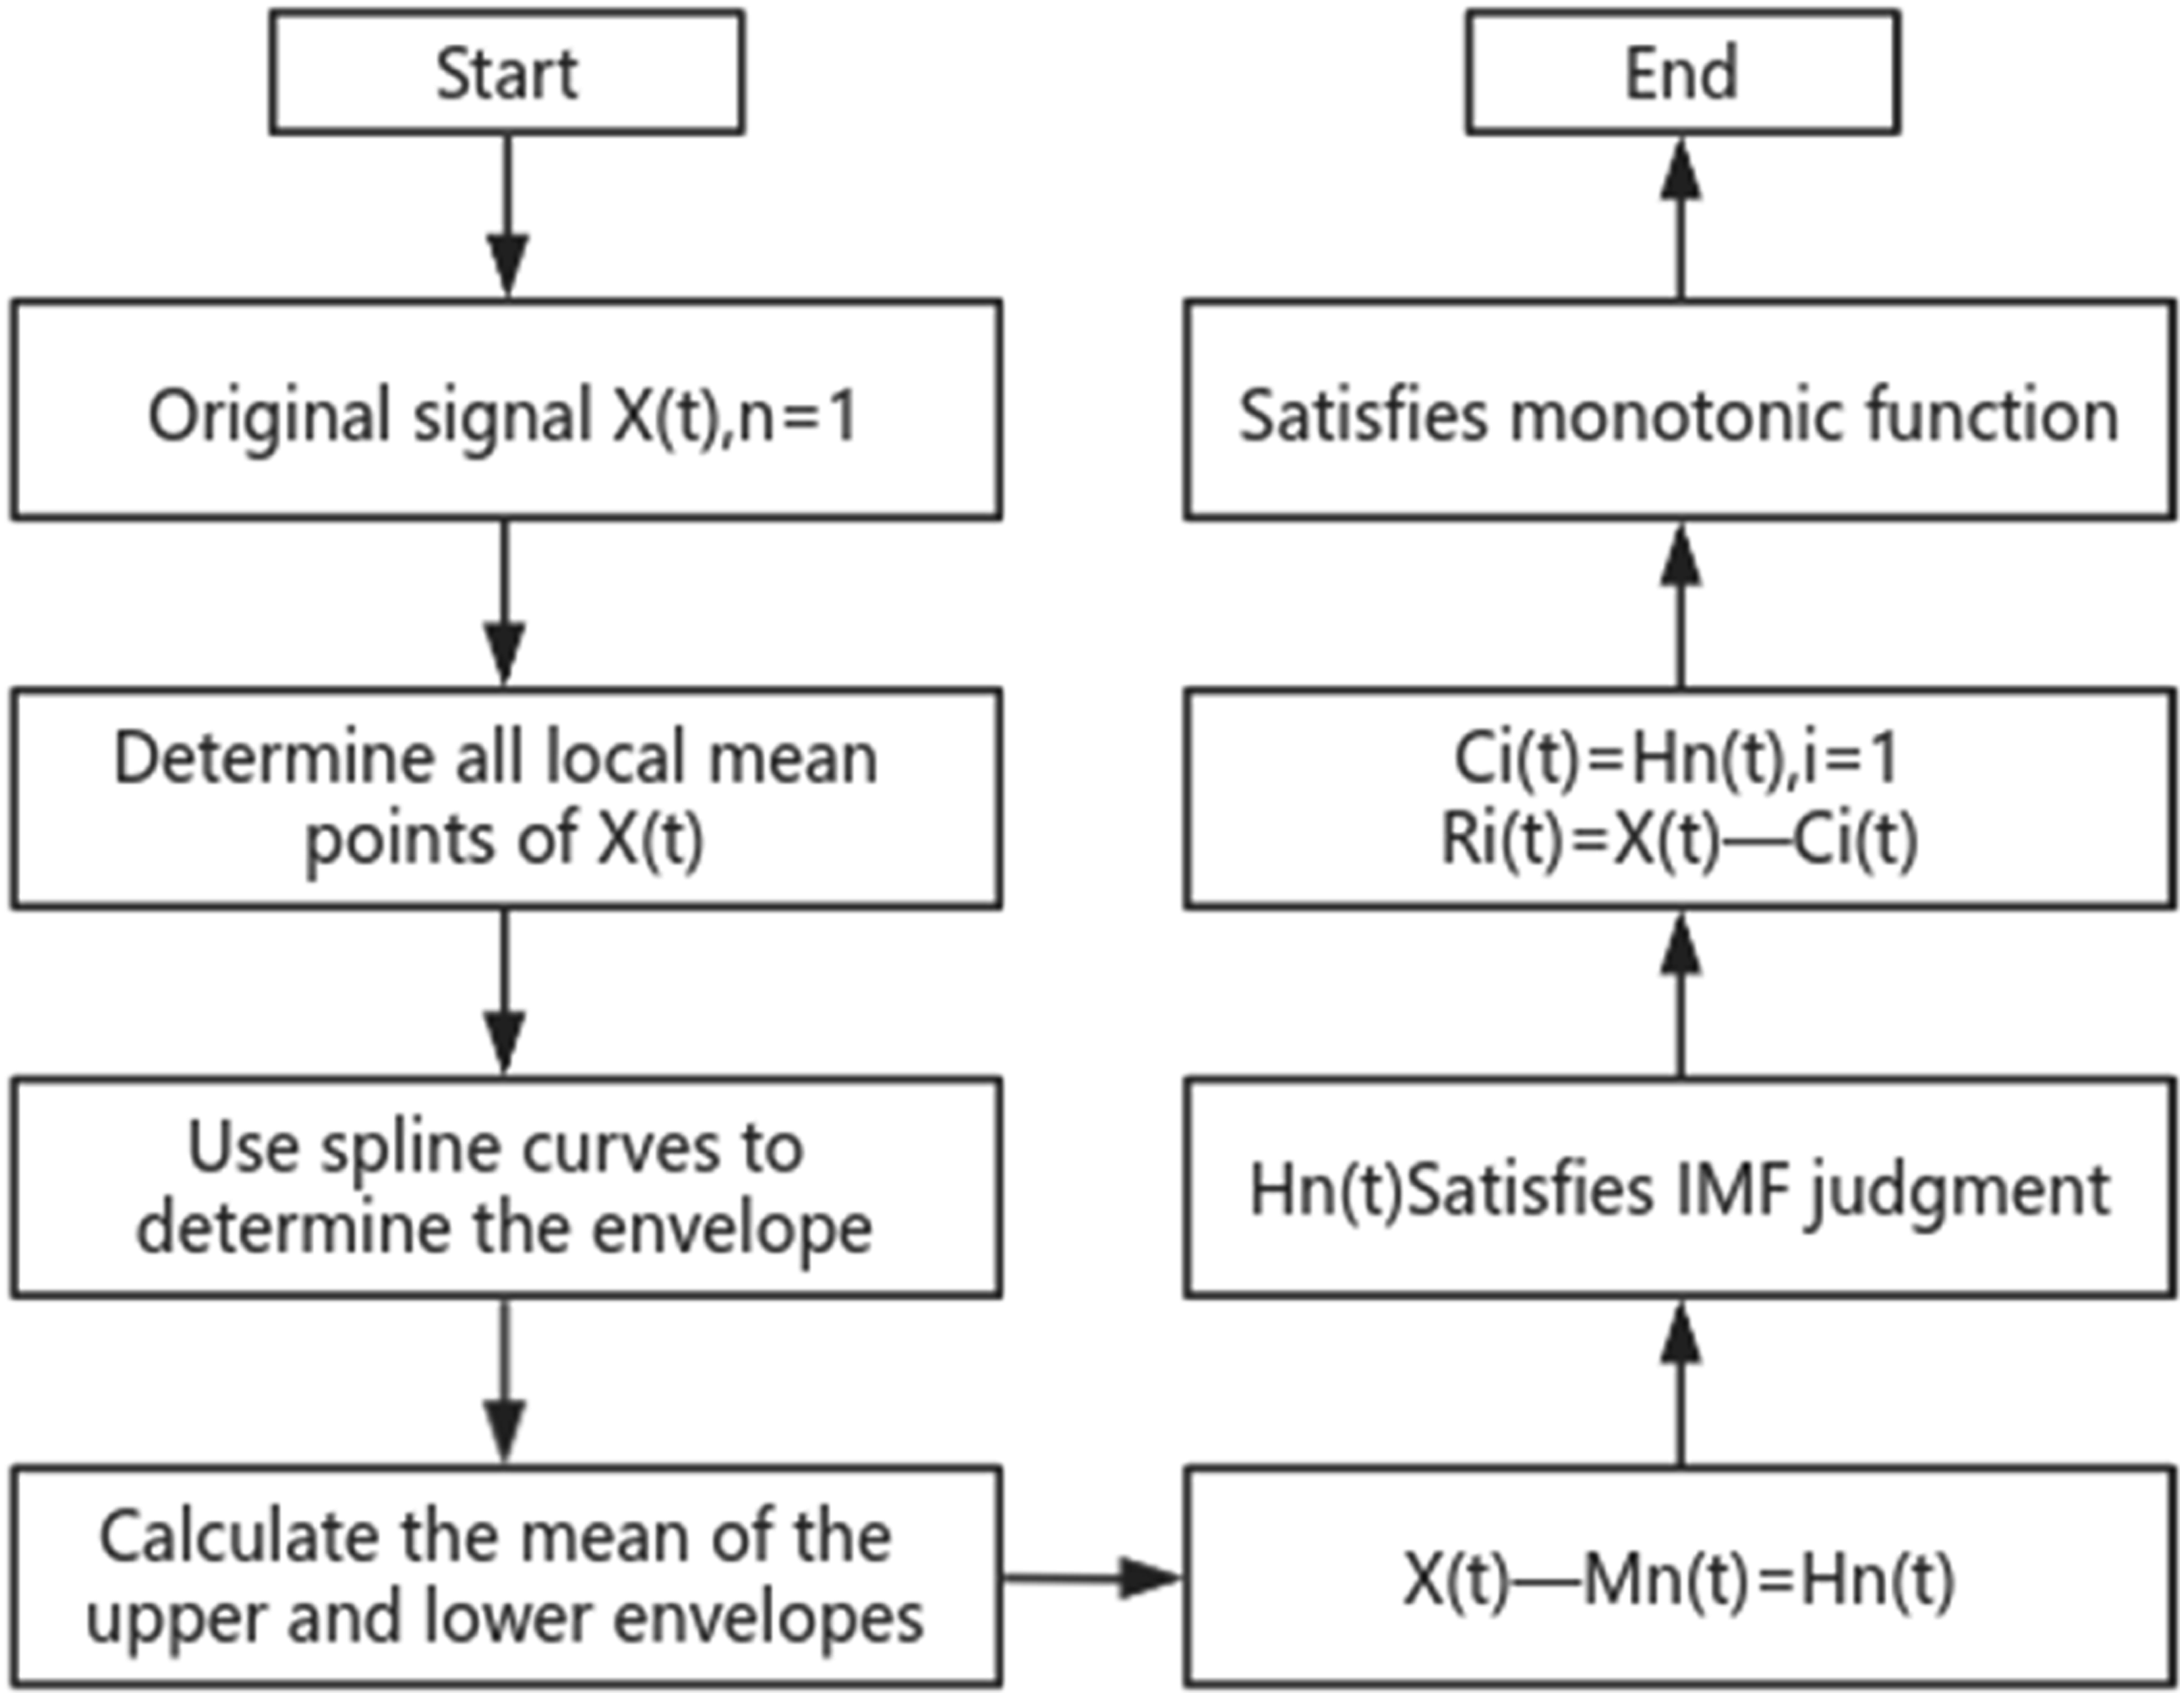
Where X(t) is the original vibration signal, determine the maximum and minimum values of the vibration signal, and then use three spline curves to find the upper and lower envelopes, denoted as Mn(t); the original vibration signal minus the low-frequency signal is denoted as Hn(t), the specific formula is shown as follows:


Therefore, the originally collected vibration signal can be represented by the following formula:

In the formula, Ri (t) serves as the residual function and can represent the average trend of the signal; Ci (t) as the IMF components can represent different frequency components within the vibration signal.
In summary, the EMD algorithm allows for an intuitive and convenient decomposition of non-stationary signals into stationary ones, making this method suitable for analyzing non-stationary, nonlinear vibration signals on power machinery.
Autocorrelation analysis
Correlation analysis can reflect the degree of correlation between random signals by utilizing the values of correlation functions to calculate the degree of correlation between random signals. Correlation analysis is mainly divided into autocorrelation and cross-correlation analysis.
Autocorrelation can analyze the correlation of measured vibration signals at different times, and the speed at which the signal’s function curve converges can accurately reflect the frequency components of different vibration signals and the magnitude of time-domain fluctuations. Especially for periodic vibration signals, autocorrelation analysis still shows periodic changes; thus, autocorrelation analysis can reflect whether the measured vibration signal contains periodic signal components.
Cross-correlation reflects the degree of correlation between two vibration signals and can be used to identify useful vibration signals hidden within noise and to find the propagation paths of vibration signals.
This paper mainly utilizes the autocorrelation algorithm, which primarily analyzes the correlation of collected vibration signals at two different times, with the vibration value

Software programming
To implement the programming of the engine fault diagnosis system, this study mainly uses LabVIEW, a software programming tool that utilizes graphical language. This software has many functions, capable of executing data calculation, software management, file transfer, and signal processing programming. Compared to traditional text programming, this method is simpler and more intuitive. Therefore, LabVIEW can easily develop the necessary virtual tools, which can then be integrated with relevant hardware for data acquisition, allowing for the rapid construction of the entire control system. Many research institutions and universities in China have given great attention to the development of LabVIEW. For example, Li et al. 6 proposed a method using orthogonal vibration signals from the top and side of the cylinder head to improve the identification rate of diesel engine fuel supply faults by utilizing vibration acceleration signals. They implemented diesel engine fuel supply fault identification using LabVIEW software. Yang et al. 7 established a bistable permanent magnet actuator model based on welding sleeve and slotted armature structure forming double-wing flux using LabVIEW, and the simulation results were consistent with the experimental results. Xu et al. 8 used LabVIEW to complete the control of polarization imaging and polarization image processing, achieving the integration of polarization information and improving the contrast between the target and the background. Zhang et al. 9 proposed a robot vibration testing method based on virtual instrument technology to determine the health status of fire-fighting robots. Yu et al., 10 addressing the inefficiency of traditional methods, proposed a method for suppressing torsional vibration noise in automotive transmission systems based on discrete wavelet transform, using LabVIEW to establish a model of the automotive transmission system. By using hardware acquisition and adopting both active and passive suppression methods, the torsional vibration noise of the automotive transmission system was suppressed.
Therefore, this study adopts LabVIEW software programming for the fault diagnosis system, specifically including signal acquisition, EMD, and autocorrelation modules.
Signal acquisition
The vibration analysis system was programmed based on LabVIEW. The vibration analysis system can be divided into signal acquisition, EMD analysis, and autocorrelation analysis modules, with the flowchart given in Figure 3. Flowchart of the signal acquisition module.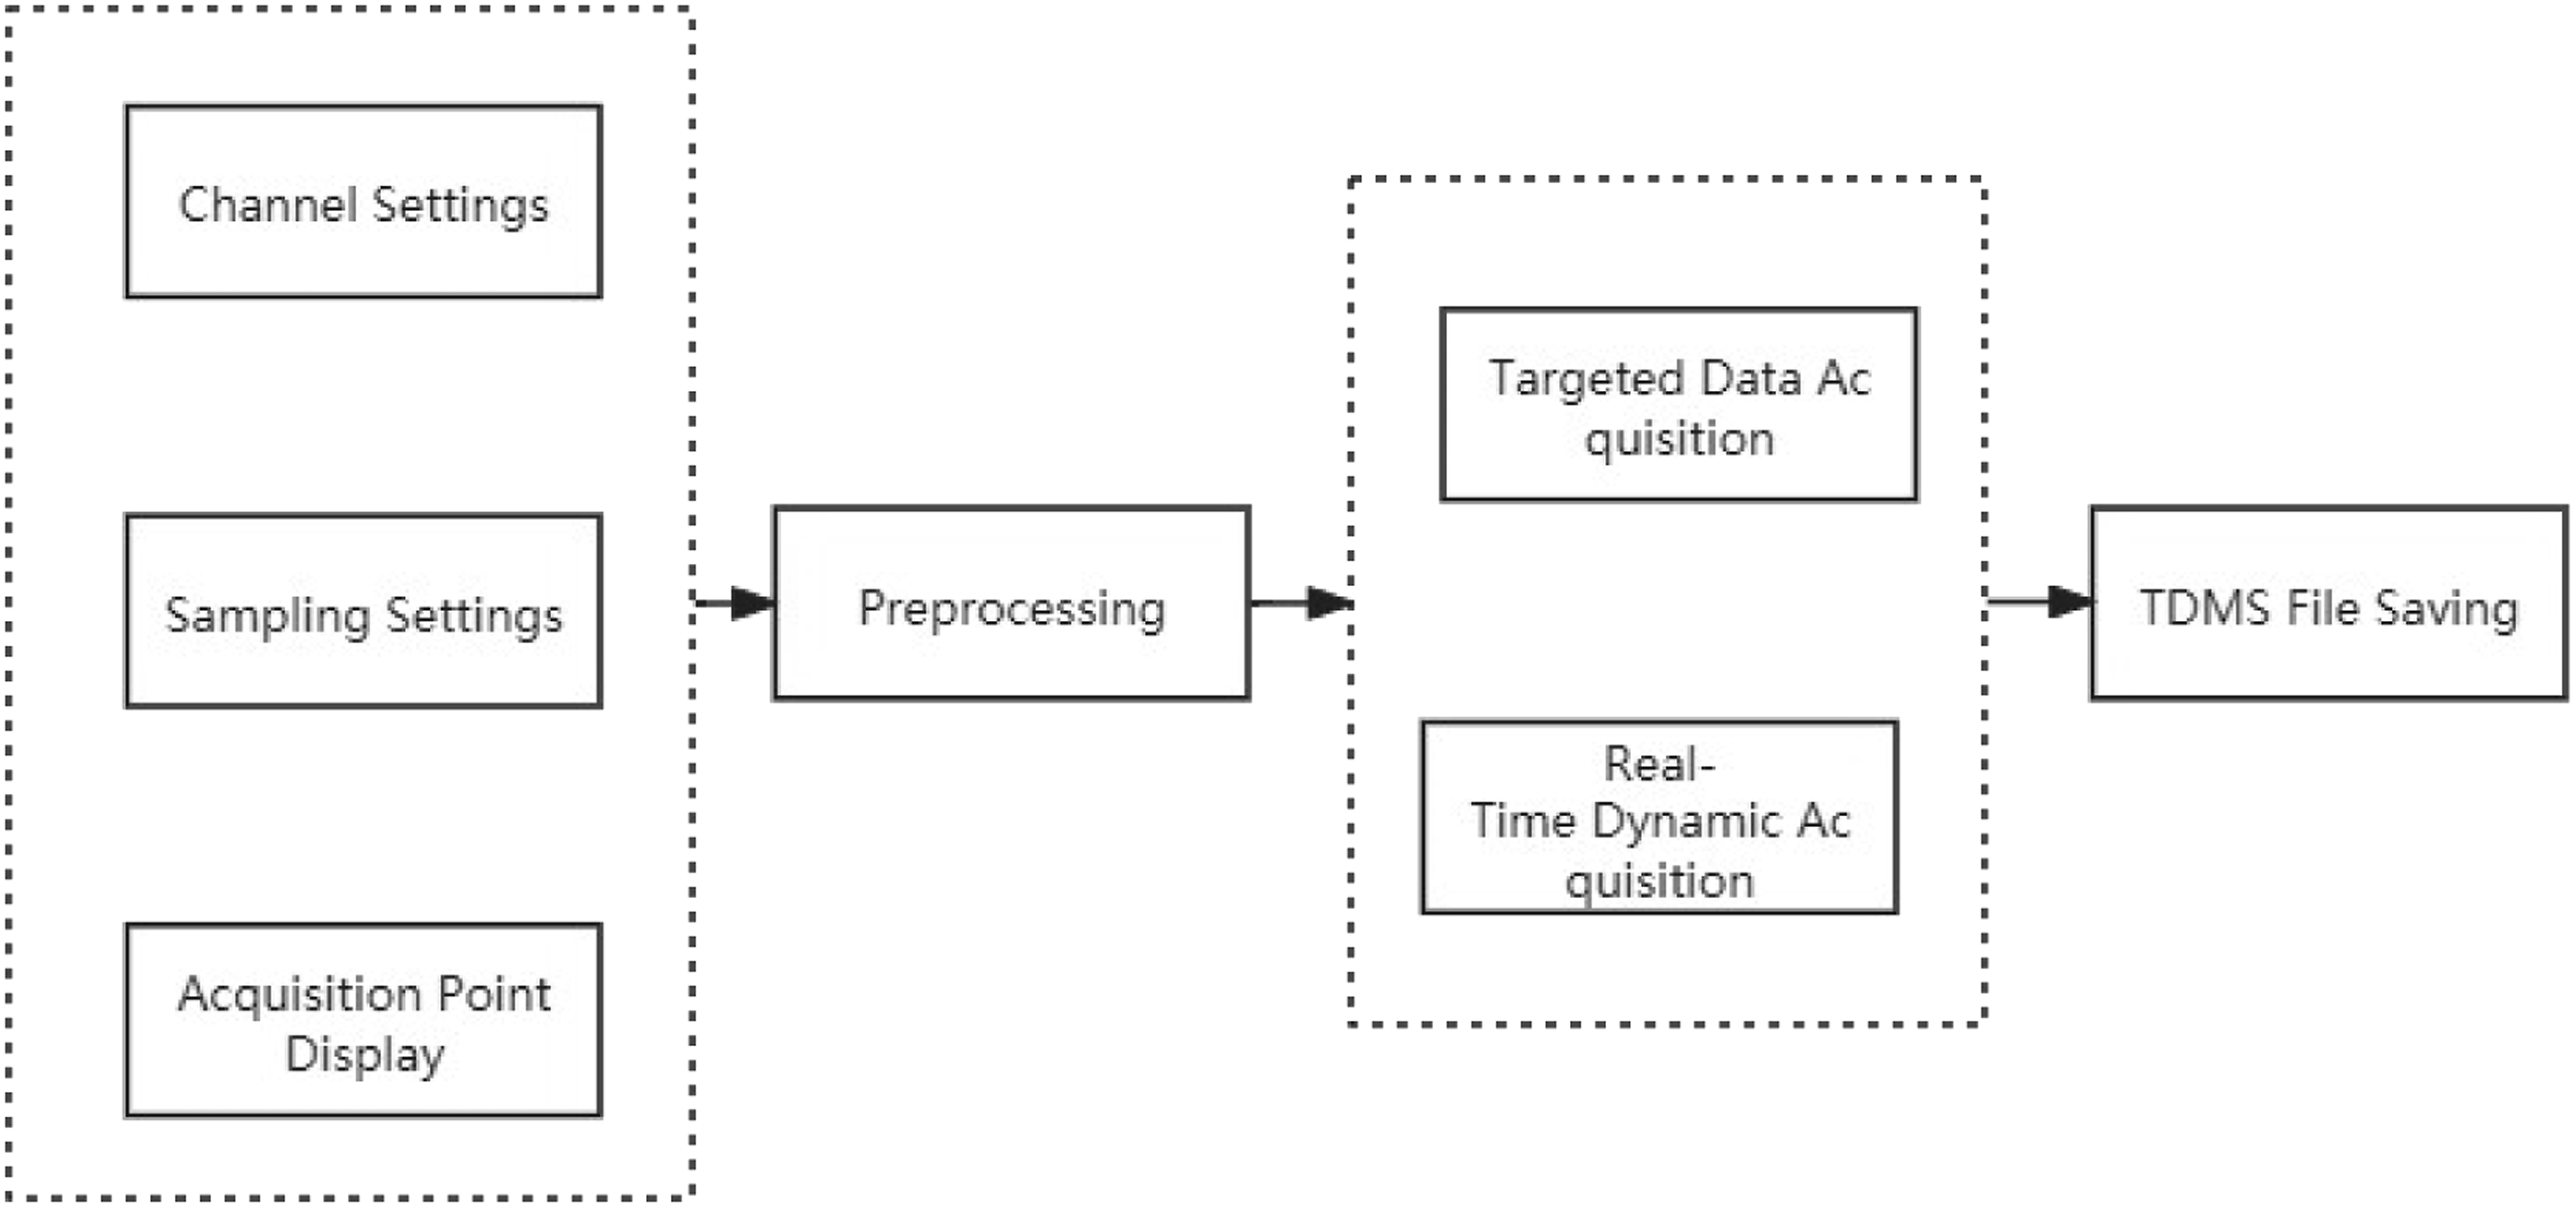
Signal preprocessing mainly involves the reading and processing of channel settings for vibration acceleration signal acquisition, sampling settings, and the display of acquisition points. First, use DAQmx Create Task VI to create a vibration task name, the task output signal is passed to DAQmx Create Channel VI, which is set to an AI accelerometer, and connected with channel settings, sensitivity, input range, and other parameters. The connected signal is passed to DAQmx Timing VI (sampling clock), which reads the sampling mode and number of samples, and the acquired signals are passed to DAQmx Configure Input Buffer, configuring the buffer for the acquired signals. The specific signal preprocessing program diagram is shown in Figure 4. Signal preprocessing program diagram.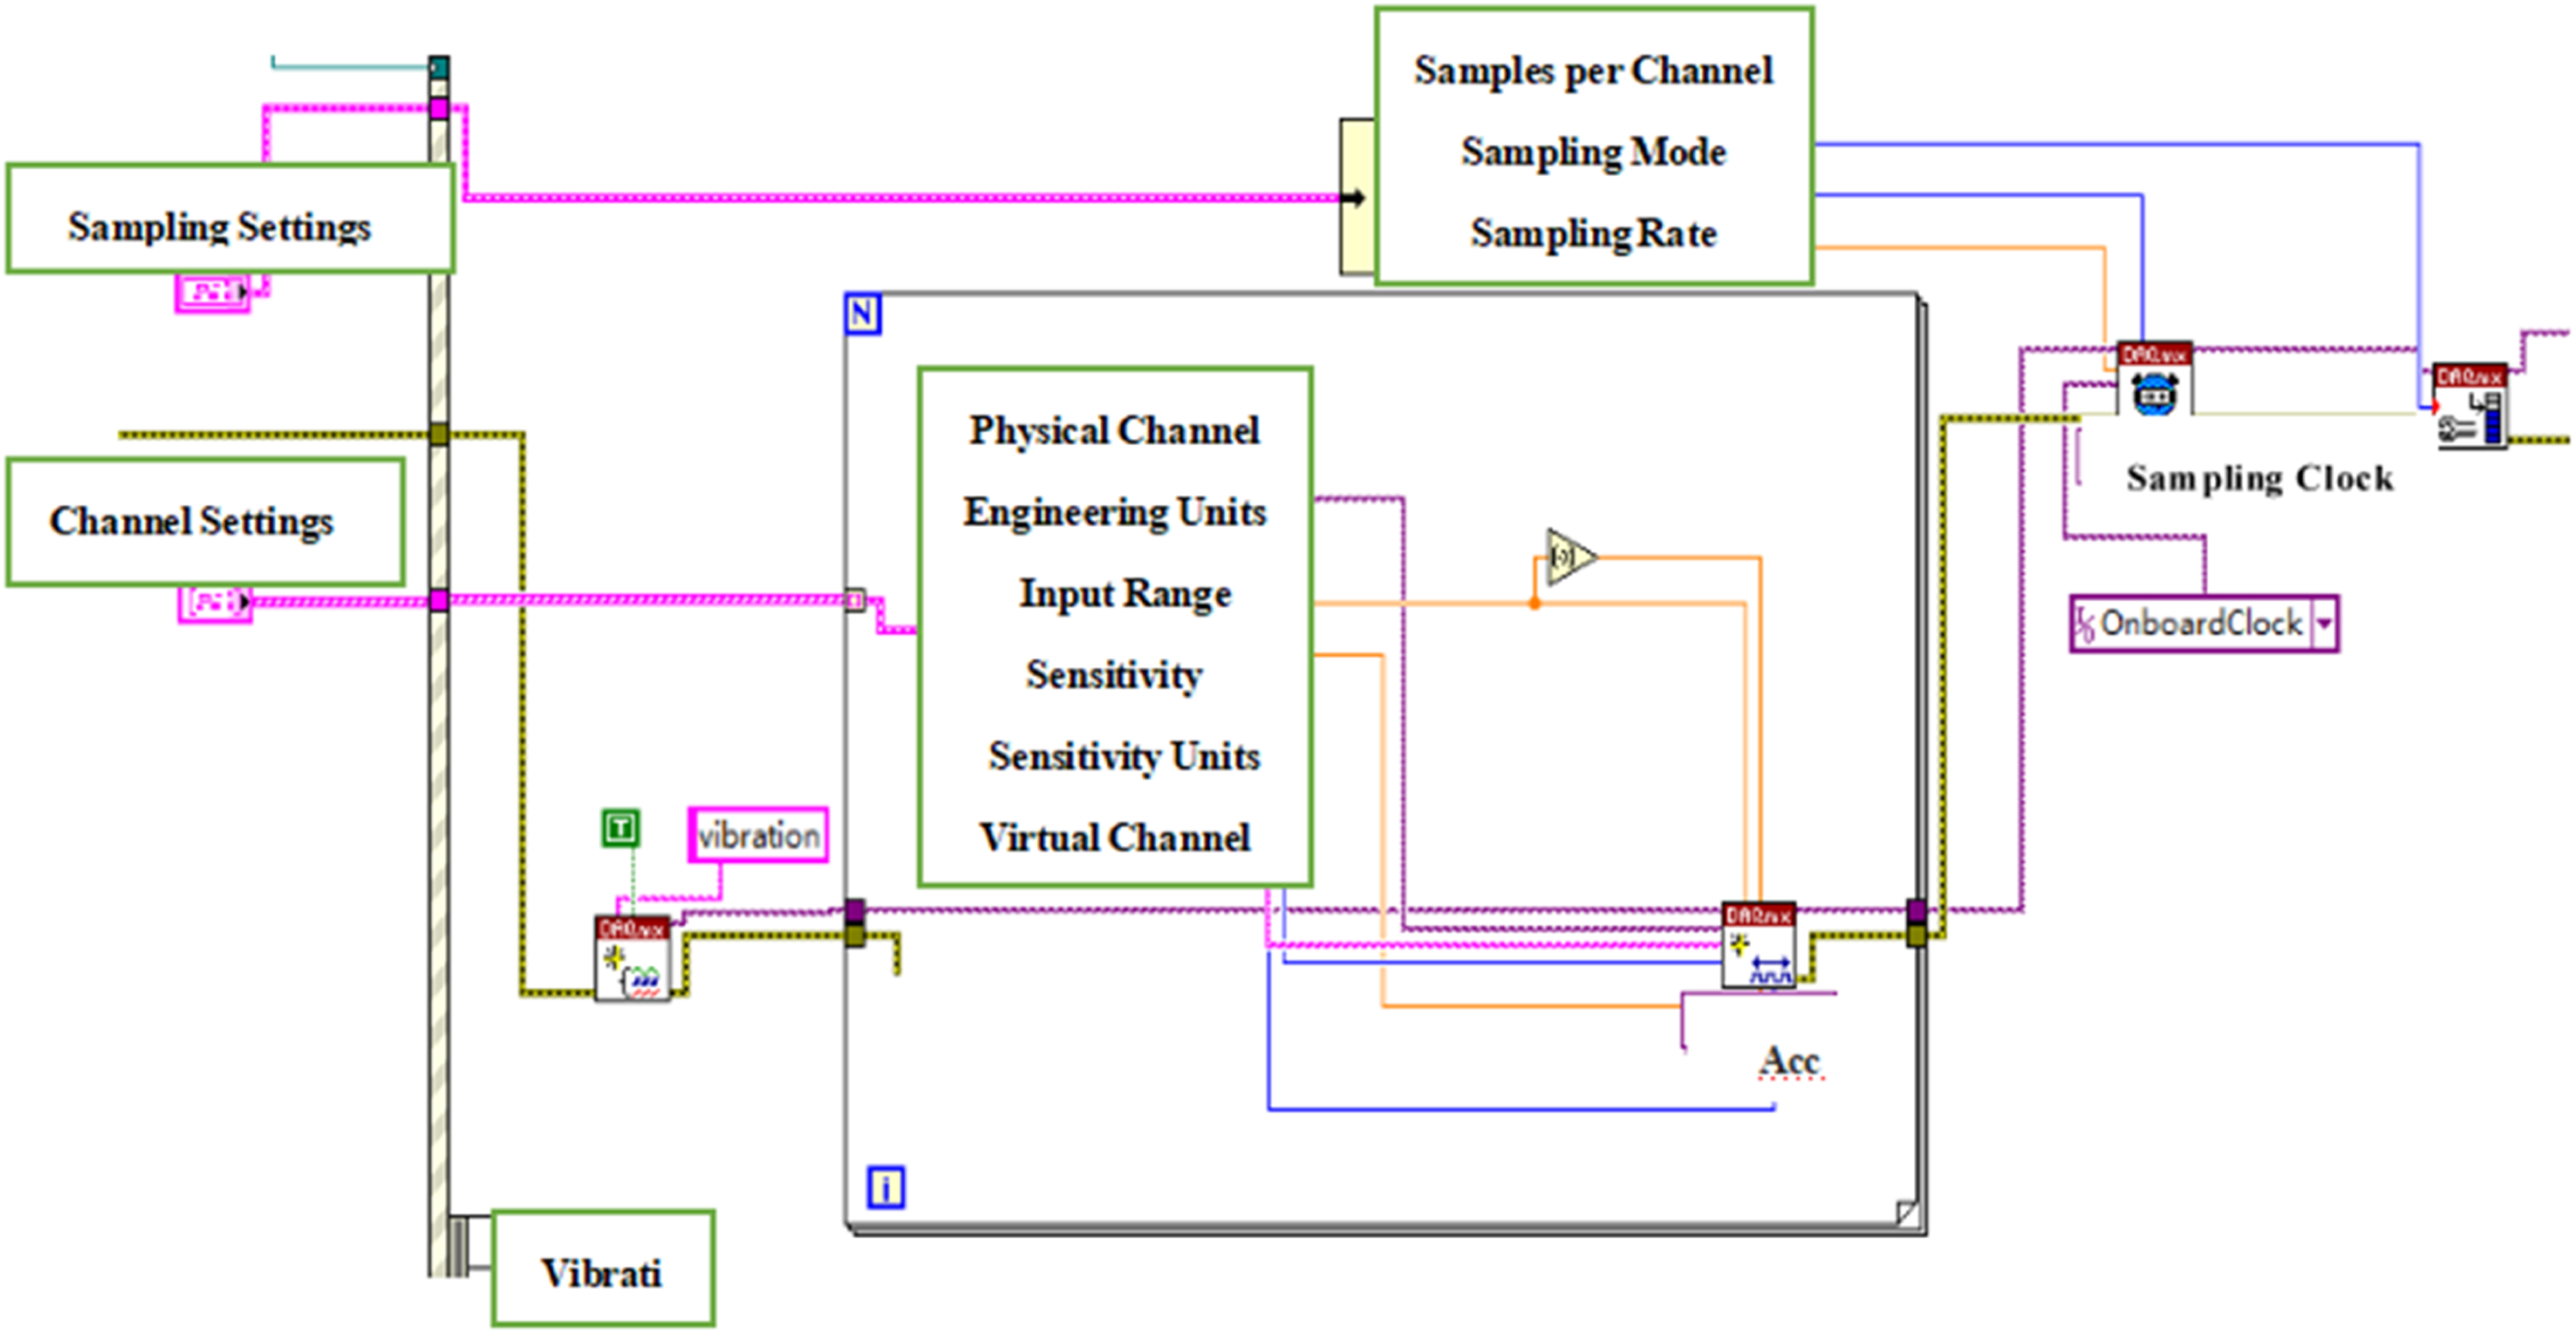
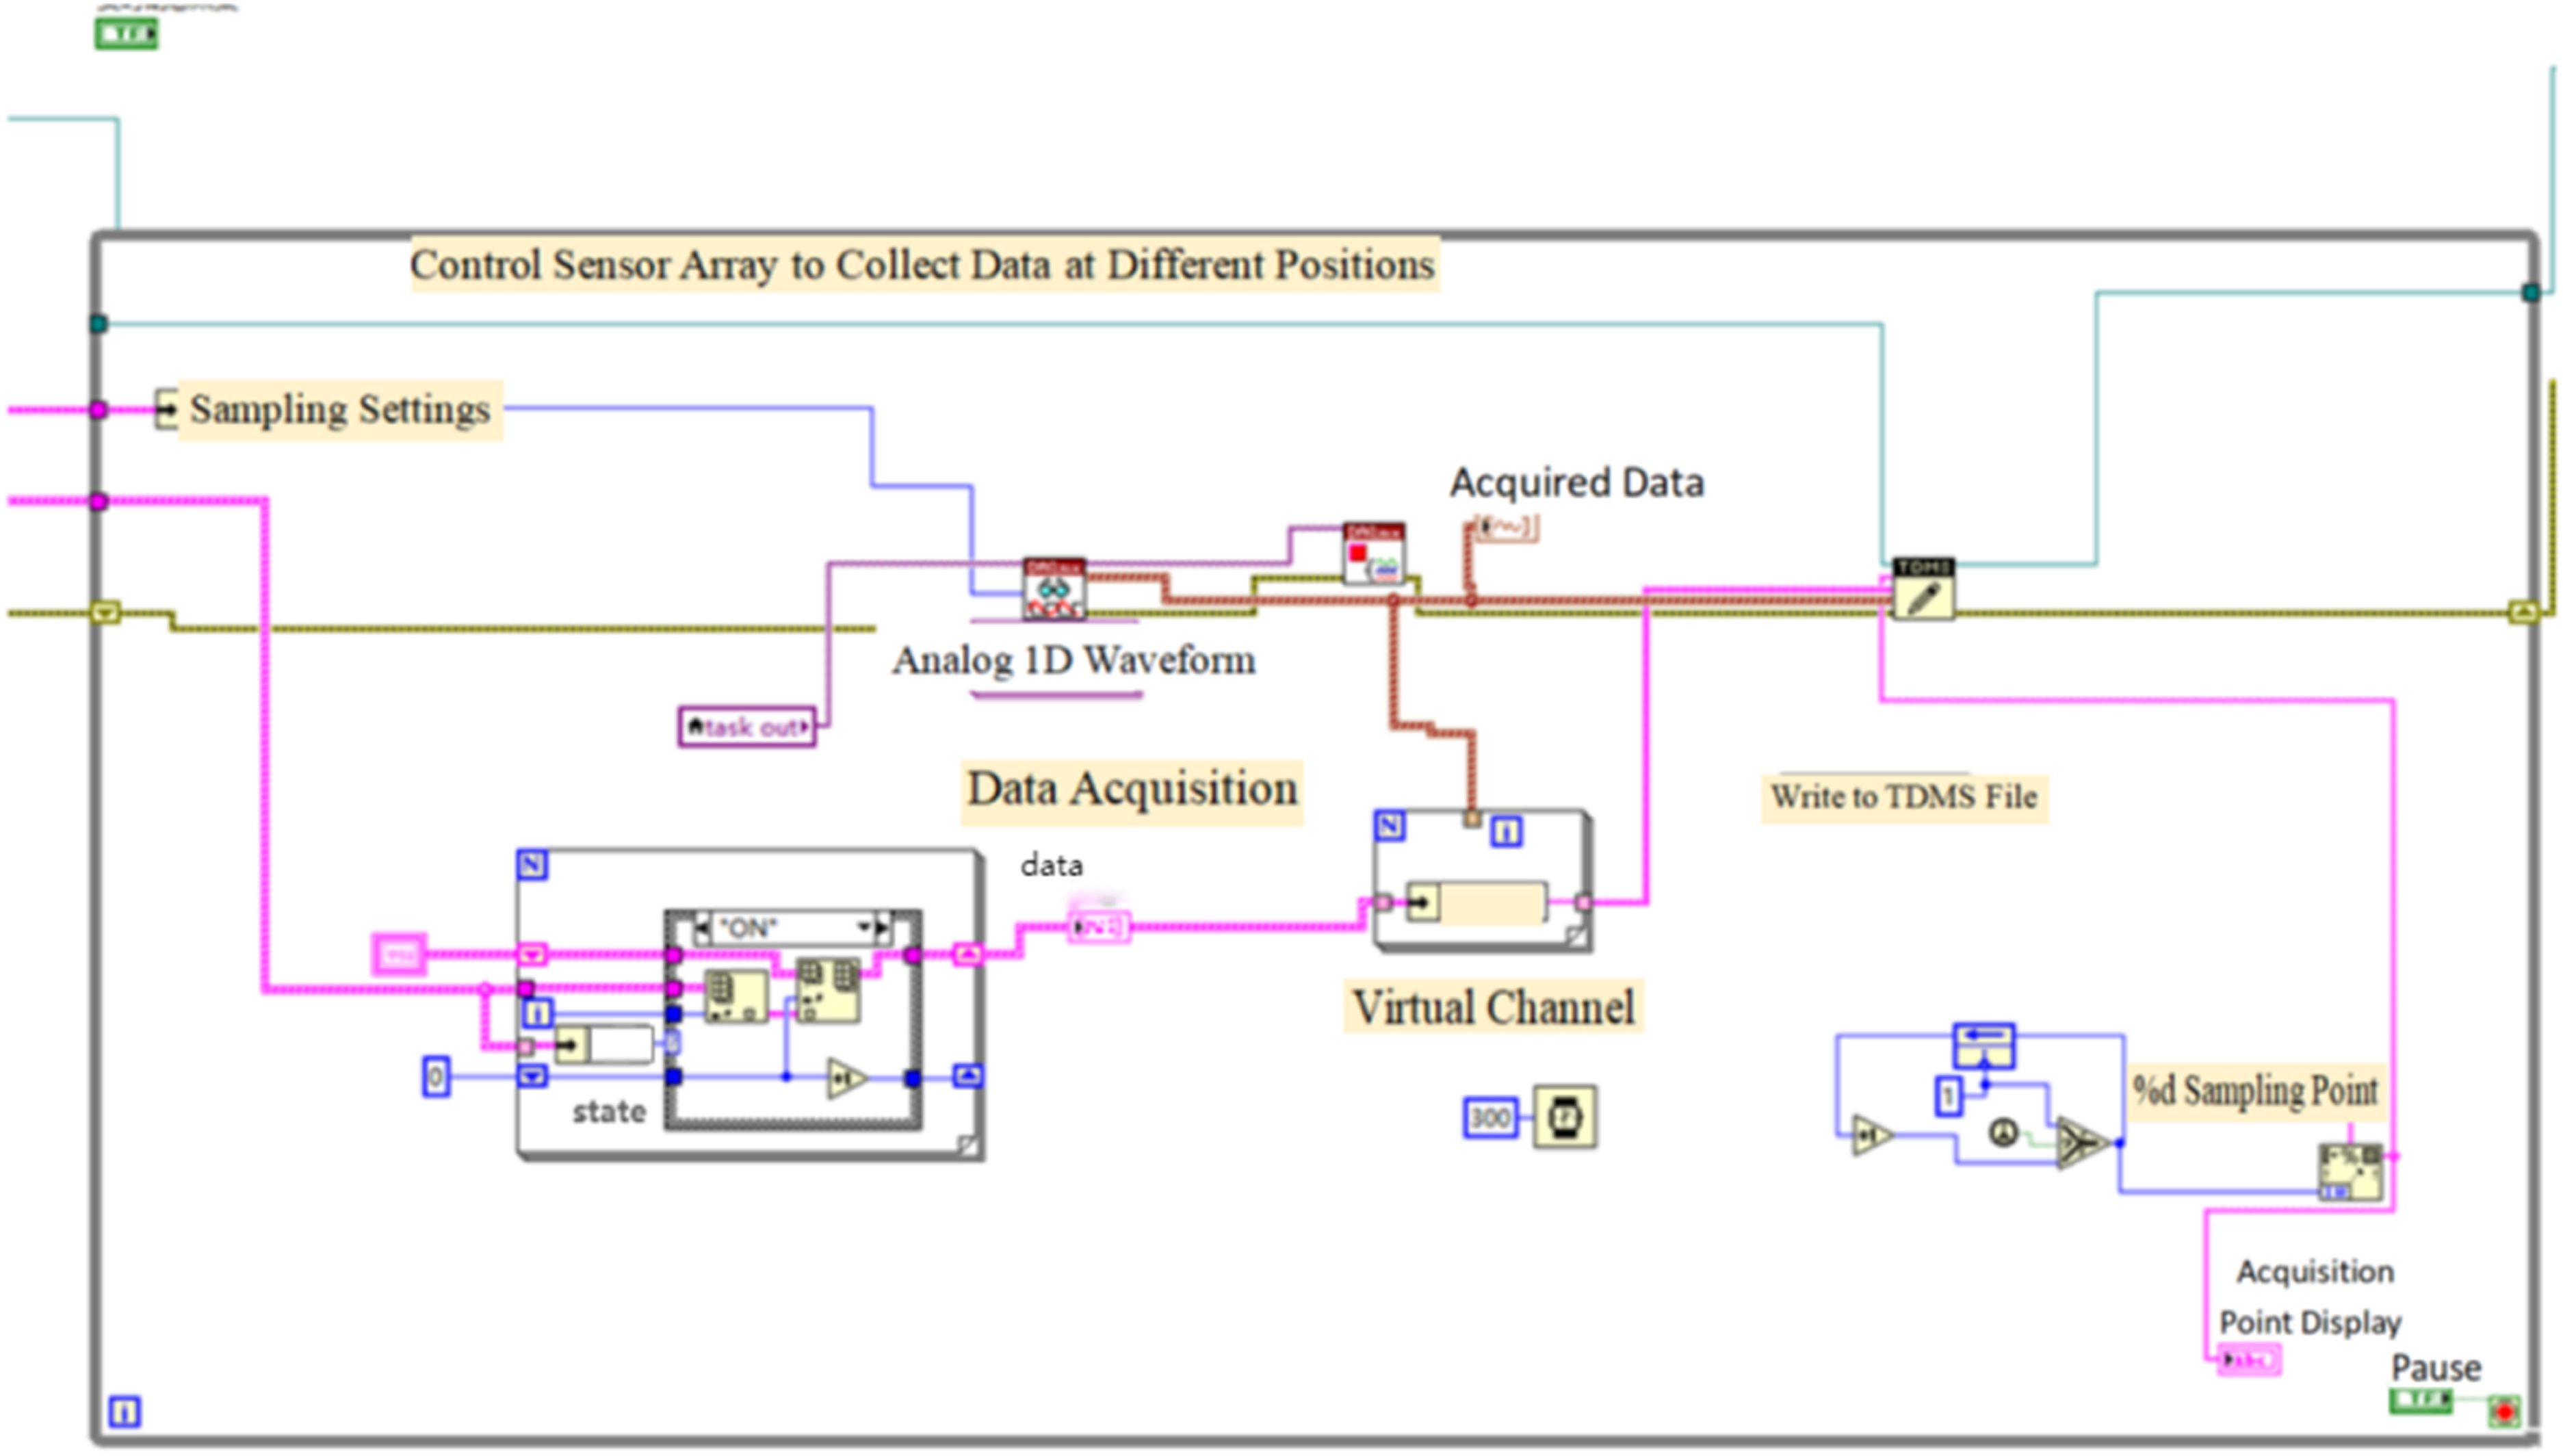
The vibration acceleration signal tasks collected are passed to the Targeted Data Acquisition module and the Real-Time Dynamic Data Acquisition module’s DAQmx to start Task VI, and the acquisition task outputs to the DAQmx to read VI, which is set to Analog 1D Waveform N Channels N Samples. The output acquisition signals are displayed in the form of a waveform chart, and the collected signals are input into the TDMS to write VI, along with the virtual channel positions and acquisition points. Since TDMS has good data sharing capabilities, it can be opened with Excel software, where the channels and acquisition points of collected data can be clearly seen in the Excel document. Therefore, users can refine and analyze data from different channels and also understand in real time the number of data points collected, thus quantifying whether data collection has been completed. The specific targeted acquisition program is shown in Figure 5, and the real-time dynamic acquisition is shown in Figure 6. Targeted acquisition program diagram. Real-time dynamic data program diagram.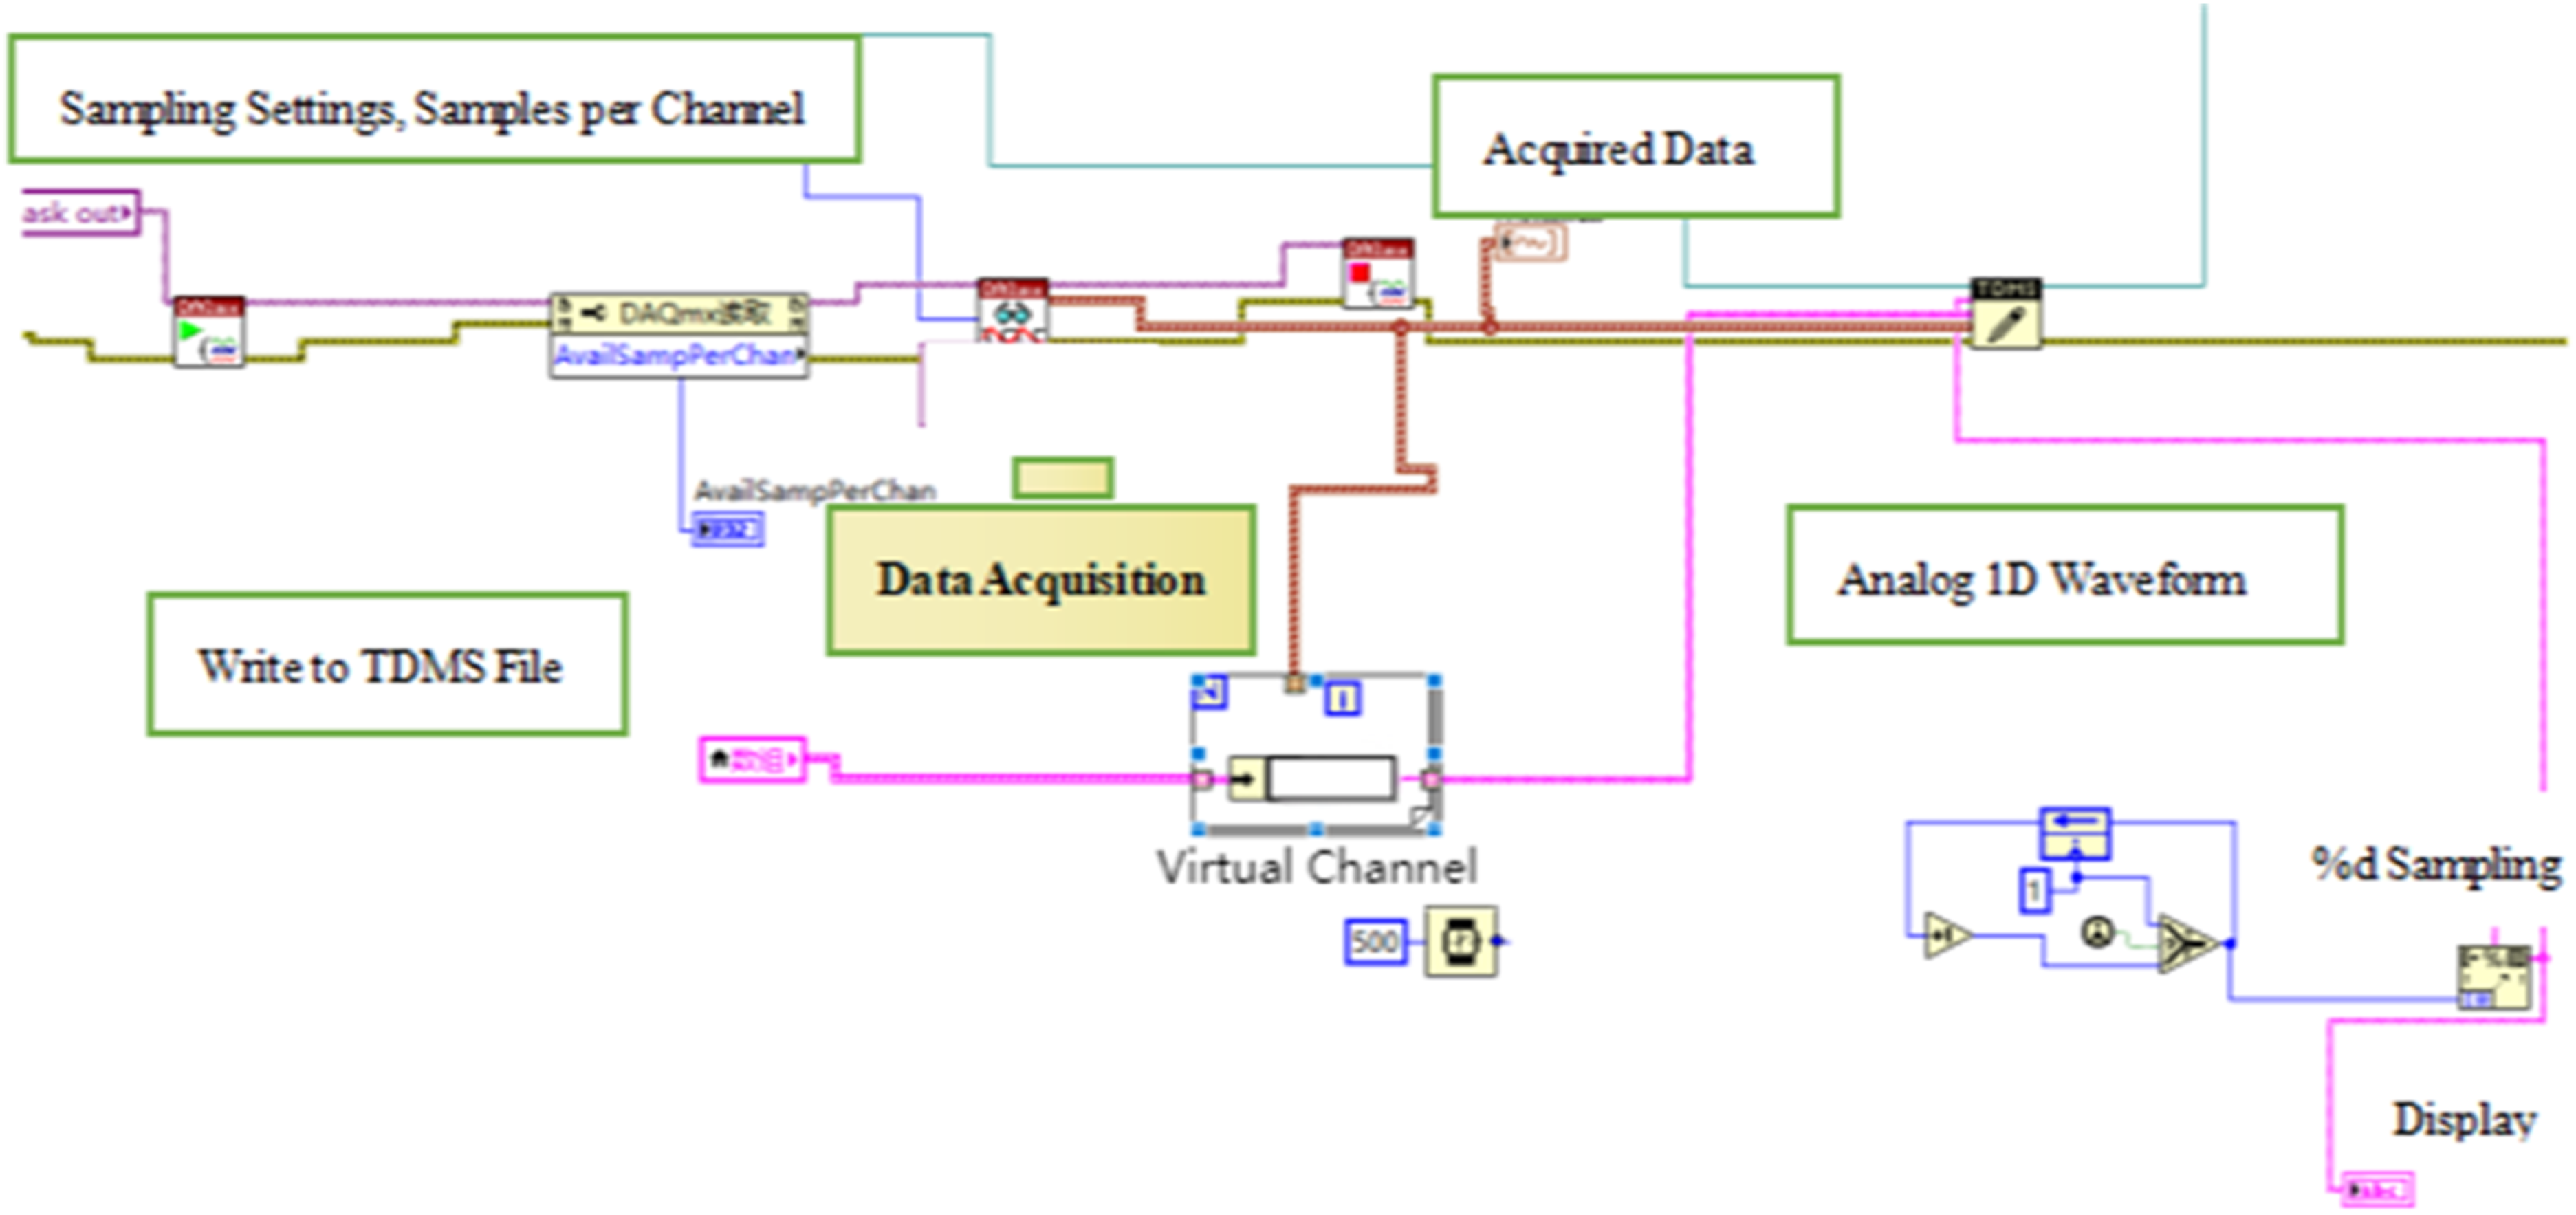
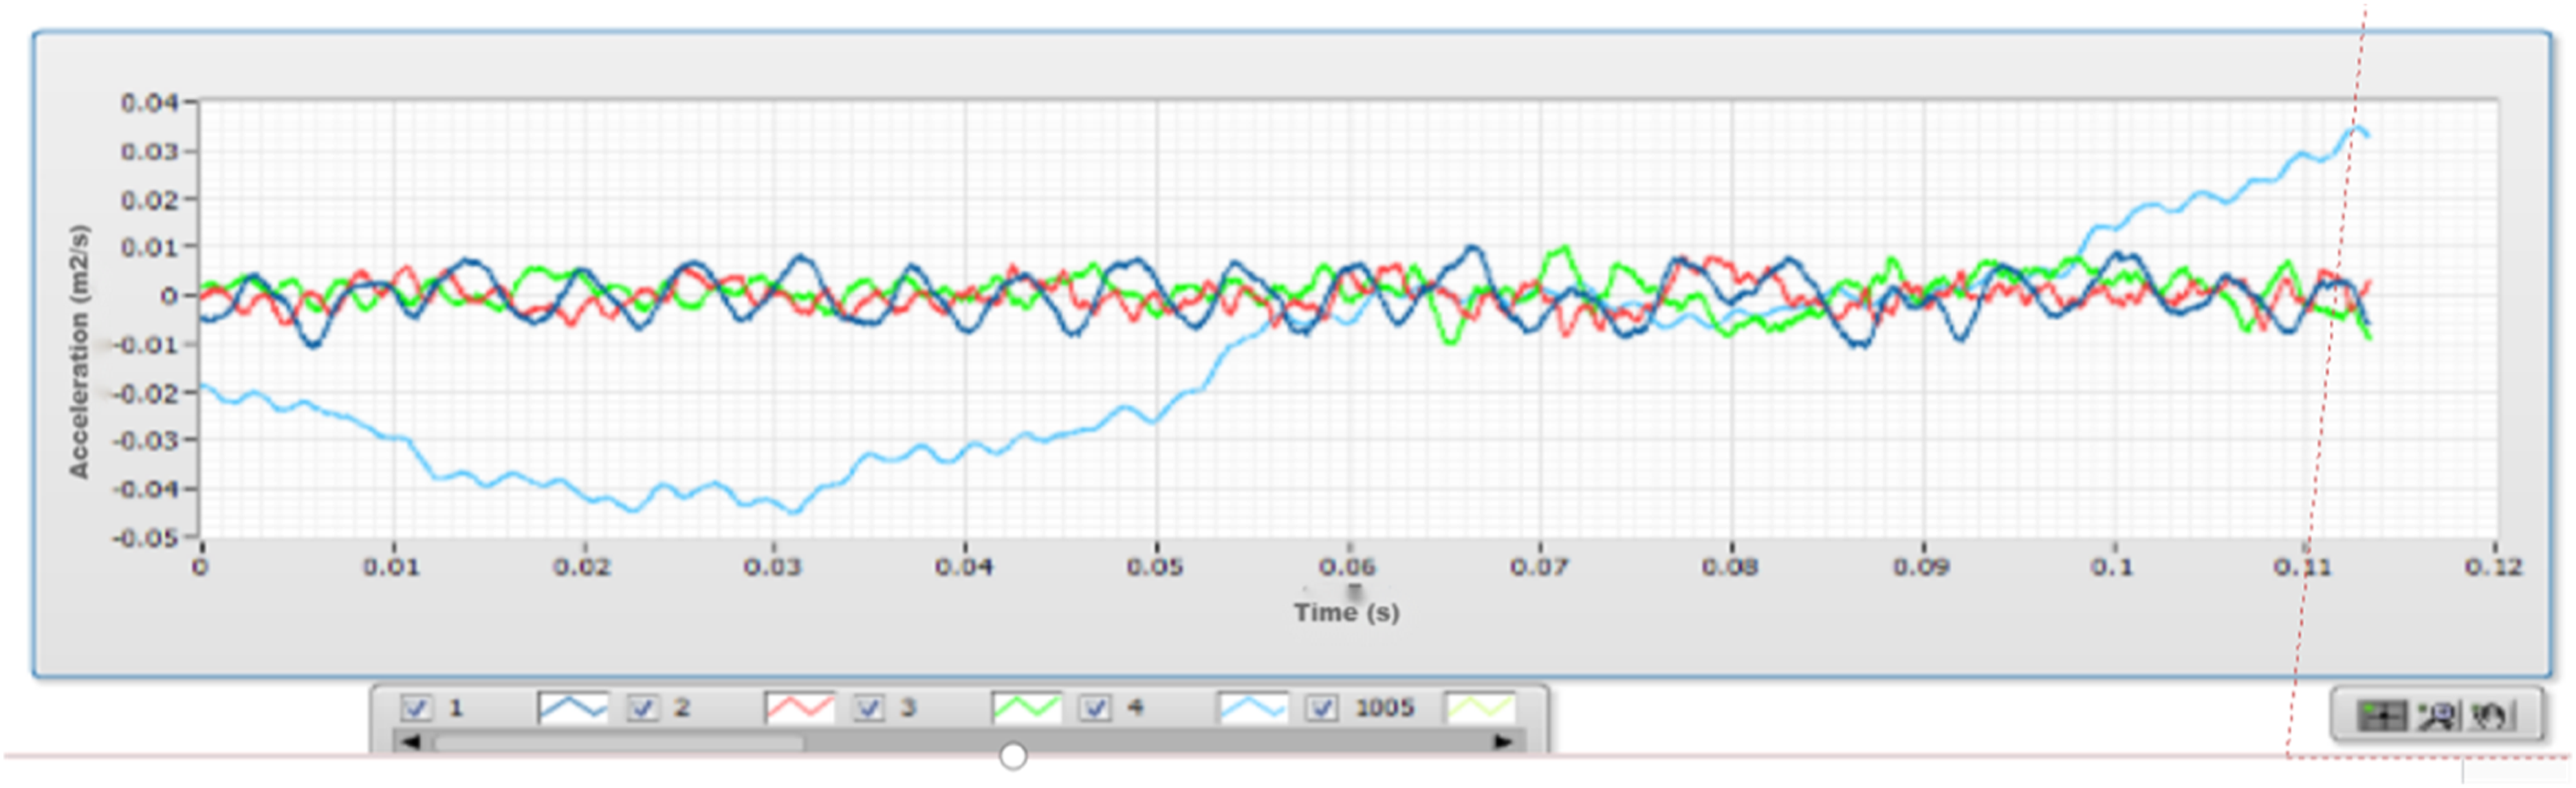
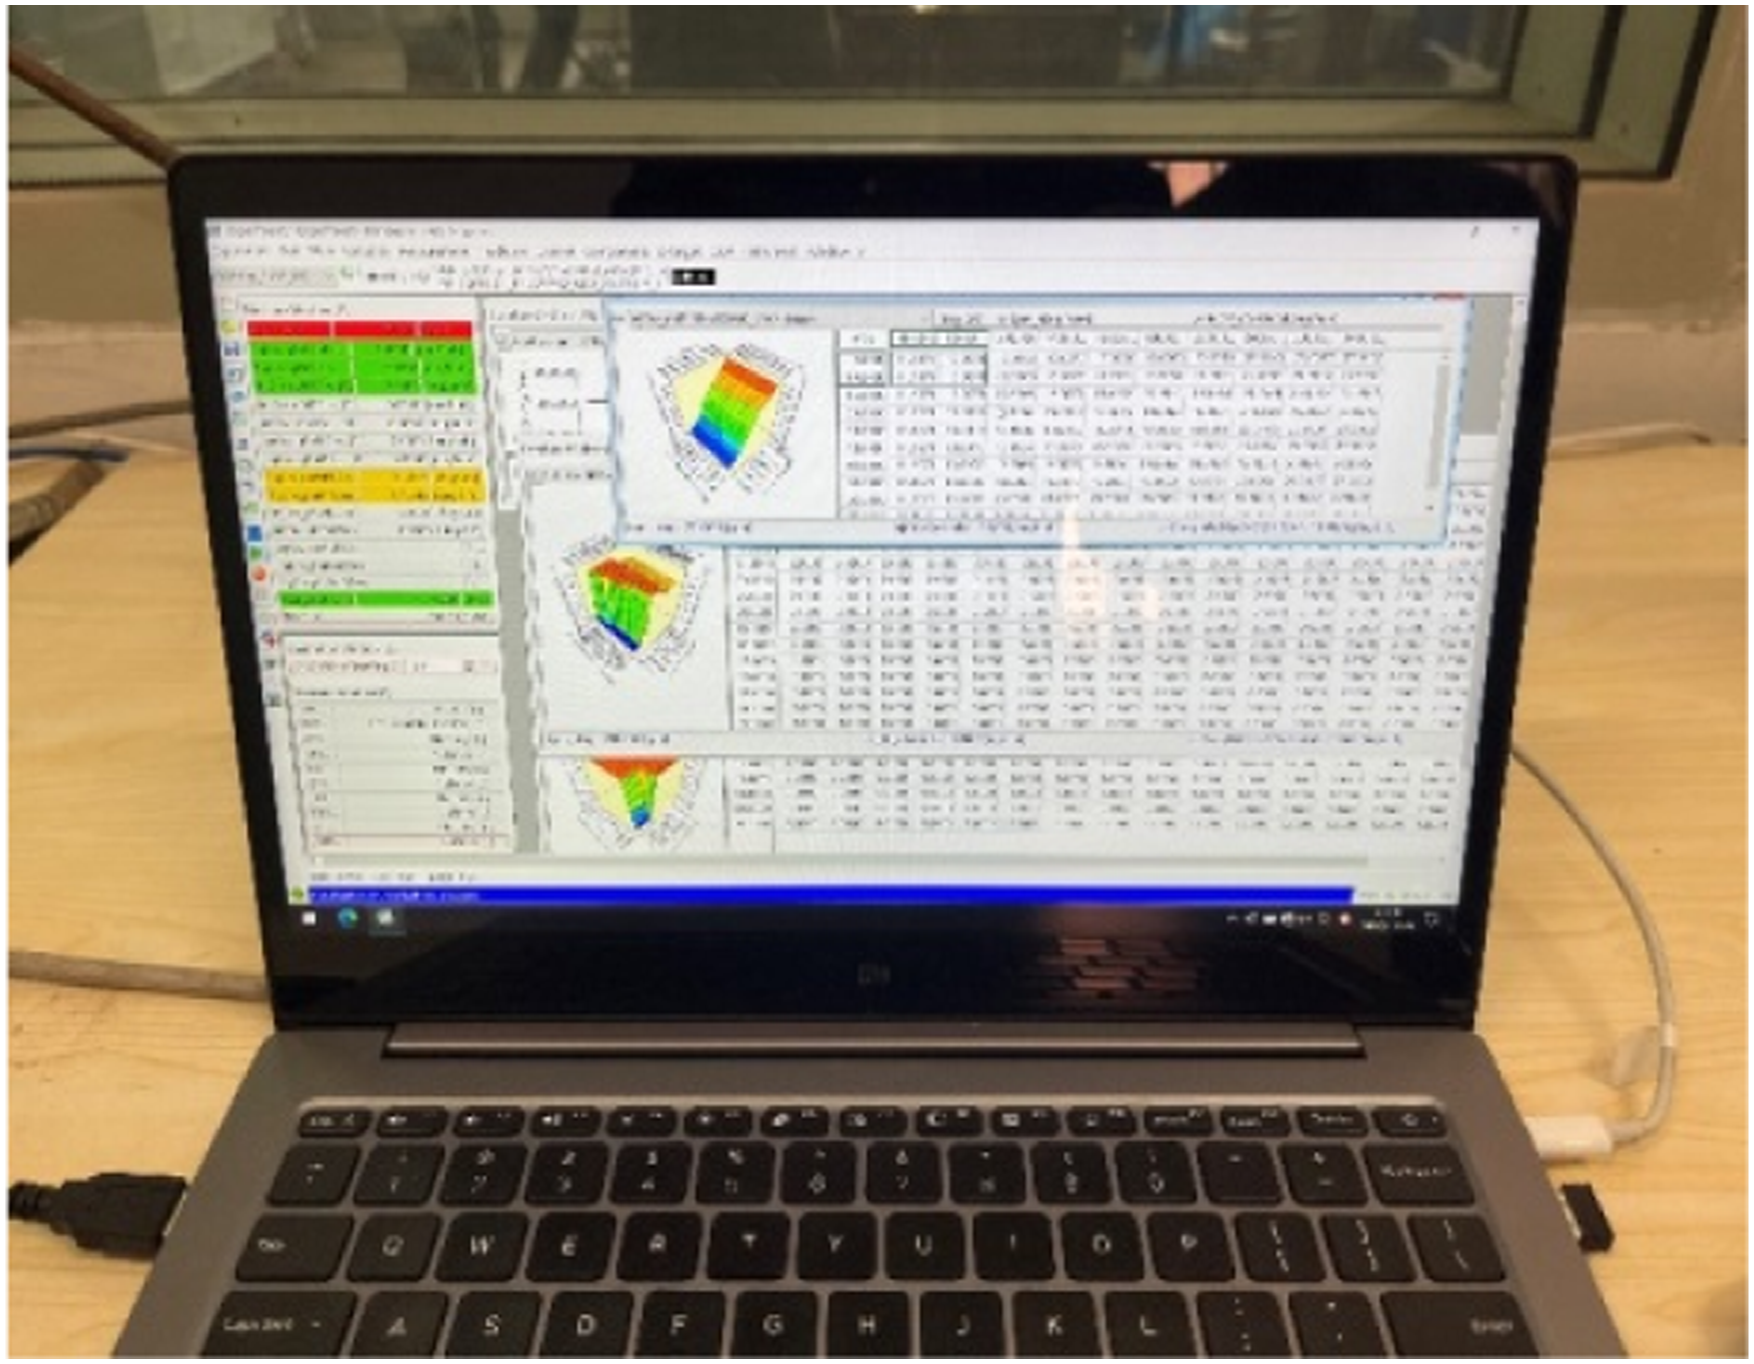
In the front panel of vibration signal acquisition, the collected signal can be preprocessed. By pressing the preprocessing button, the program creates a vibration signal collection task output, and settings such as channel sampling number, sampling rate, and sampling mode are configured for acceleration sampling. After setting the parameters, select the front panel of the real-time dynamic acquisition module, which sets the physical channel for collection, the virtual name of the physical channel, the status of the physical channel, the input range of the acceleration sensor, sensitivity units, and engineering units. After the settings are completed, pressing the corresponding acquisition button can perform targeted data acquisition and real-time dynamic acquisition of vibration signals. The front panel for targeted data acquisition of vibration signals is shown in Figure 7, and the front panel for real-time dynamic acquisition is shown in Figure 8. Targeted data acquisition front panel. Real-time dynamic acquisition front panel.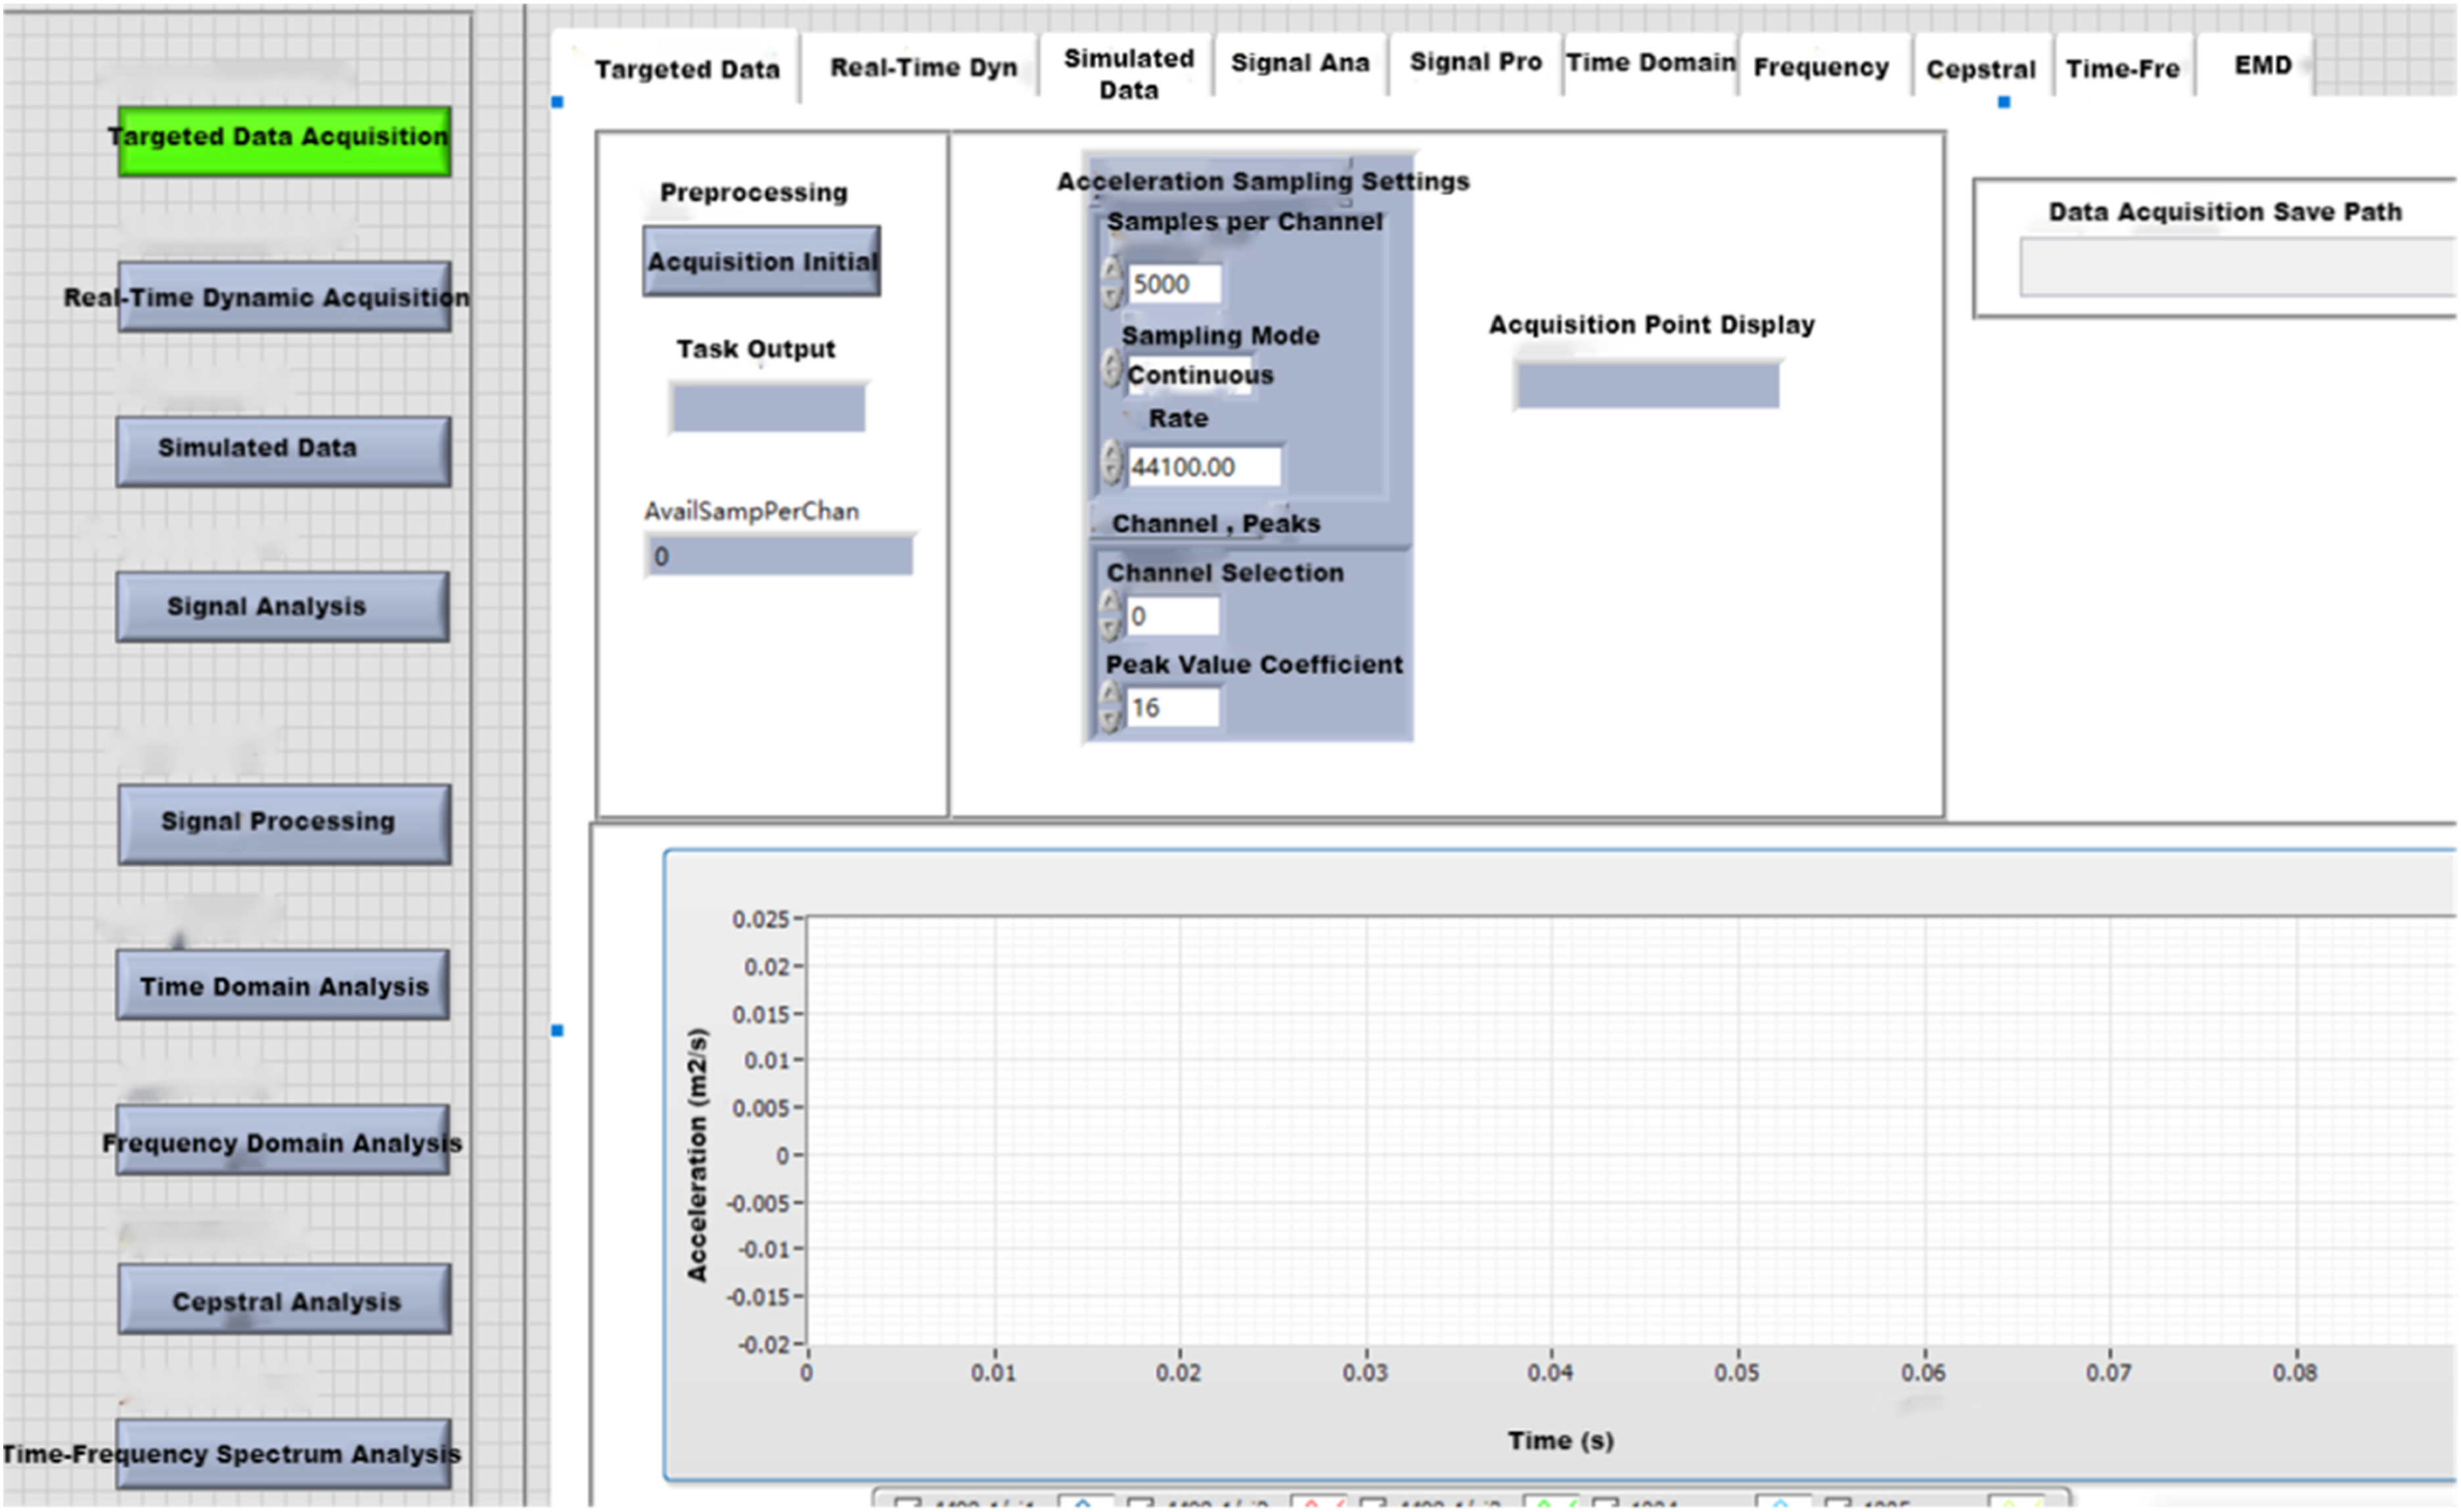
EMD algorithm programming
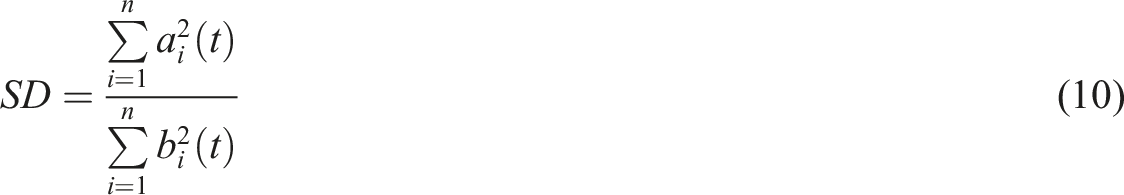
The implementation of the EMD algorithm primarily uses the Peak Detection sub-VI to set the parameters for peaks and troughs, in order to determine the maximum and minimum values of the extremum envelope. The average of the obtained maximum and minimum values is calculated to get the local mean, which is used along with the measured original vibration signal for the determination of IMF components. This determination plays a significant role in the signal decomposition results of the EMD algorithm and is crucial for judging whether the IMF components meet the selection criteria. Therefore, this value should be set reasonably. The standard for this judgment is usually the standard deviation coefficient difference, with its mathematical expression shown as follows: IMF component determination program diagram.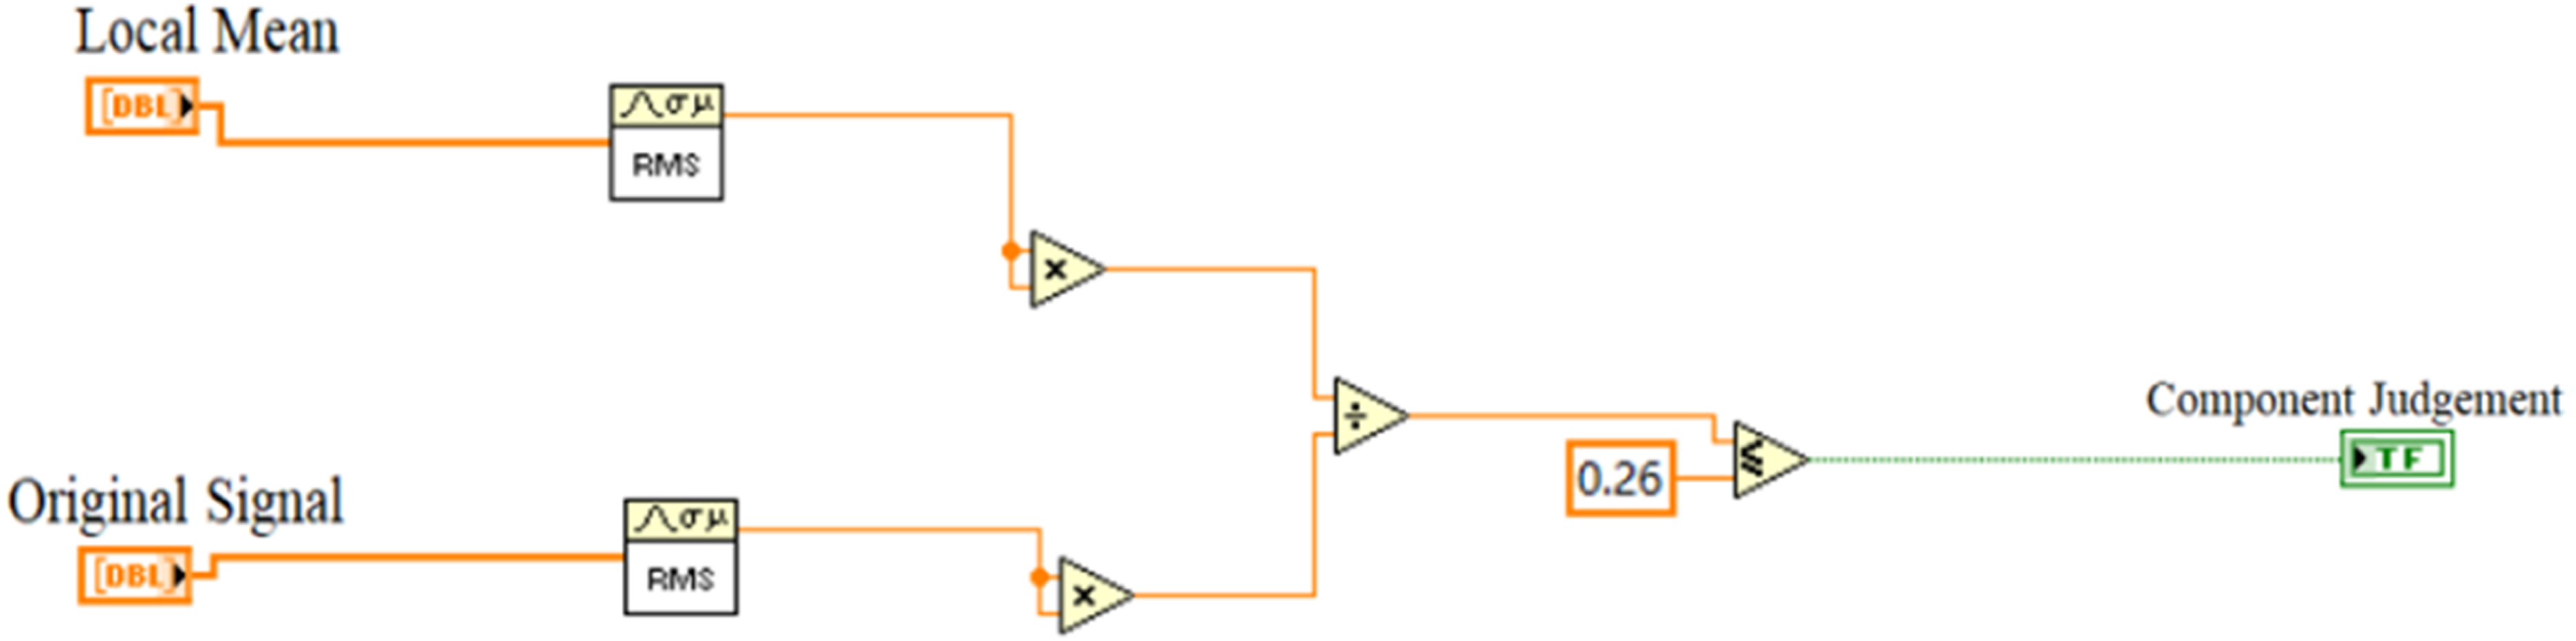
After the IMF component determination, the decomposed signal needs further decomposition of the residual component to decide whether to stop the EMD algorithm. The judgment is mainly based on two aspects: one is when the residual is a constant or a single function, and the other is when the component is less than a predetermined error value, which is set to 0.001. This judgment of the residual component program is made using the Peak Detection sub-VI. The specific program diagram is shown in Figure 10. Residual component program diagram.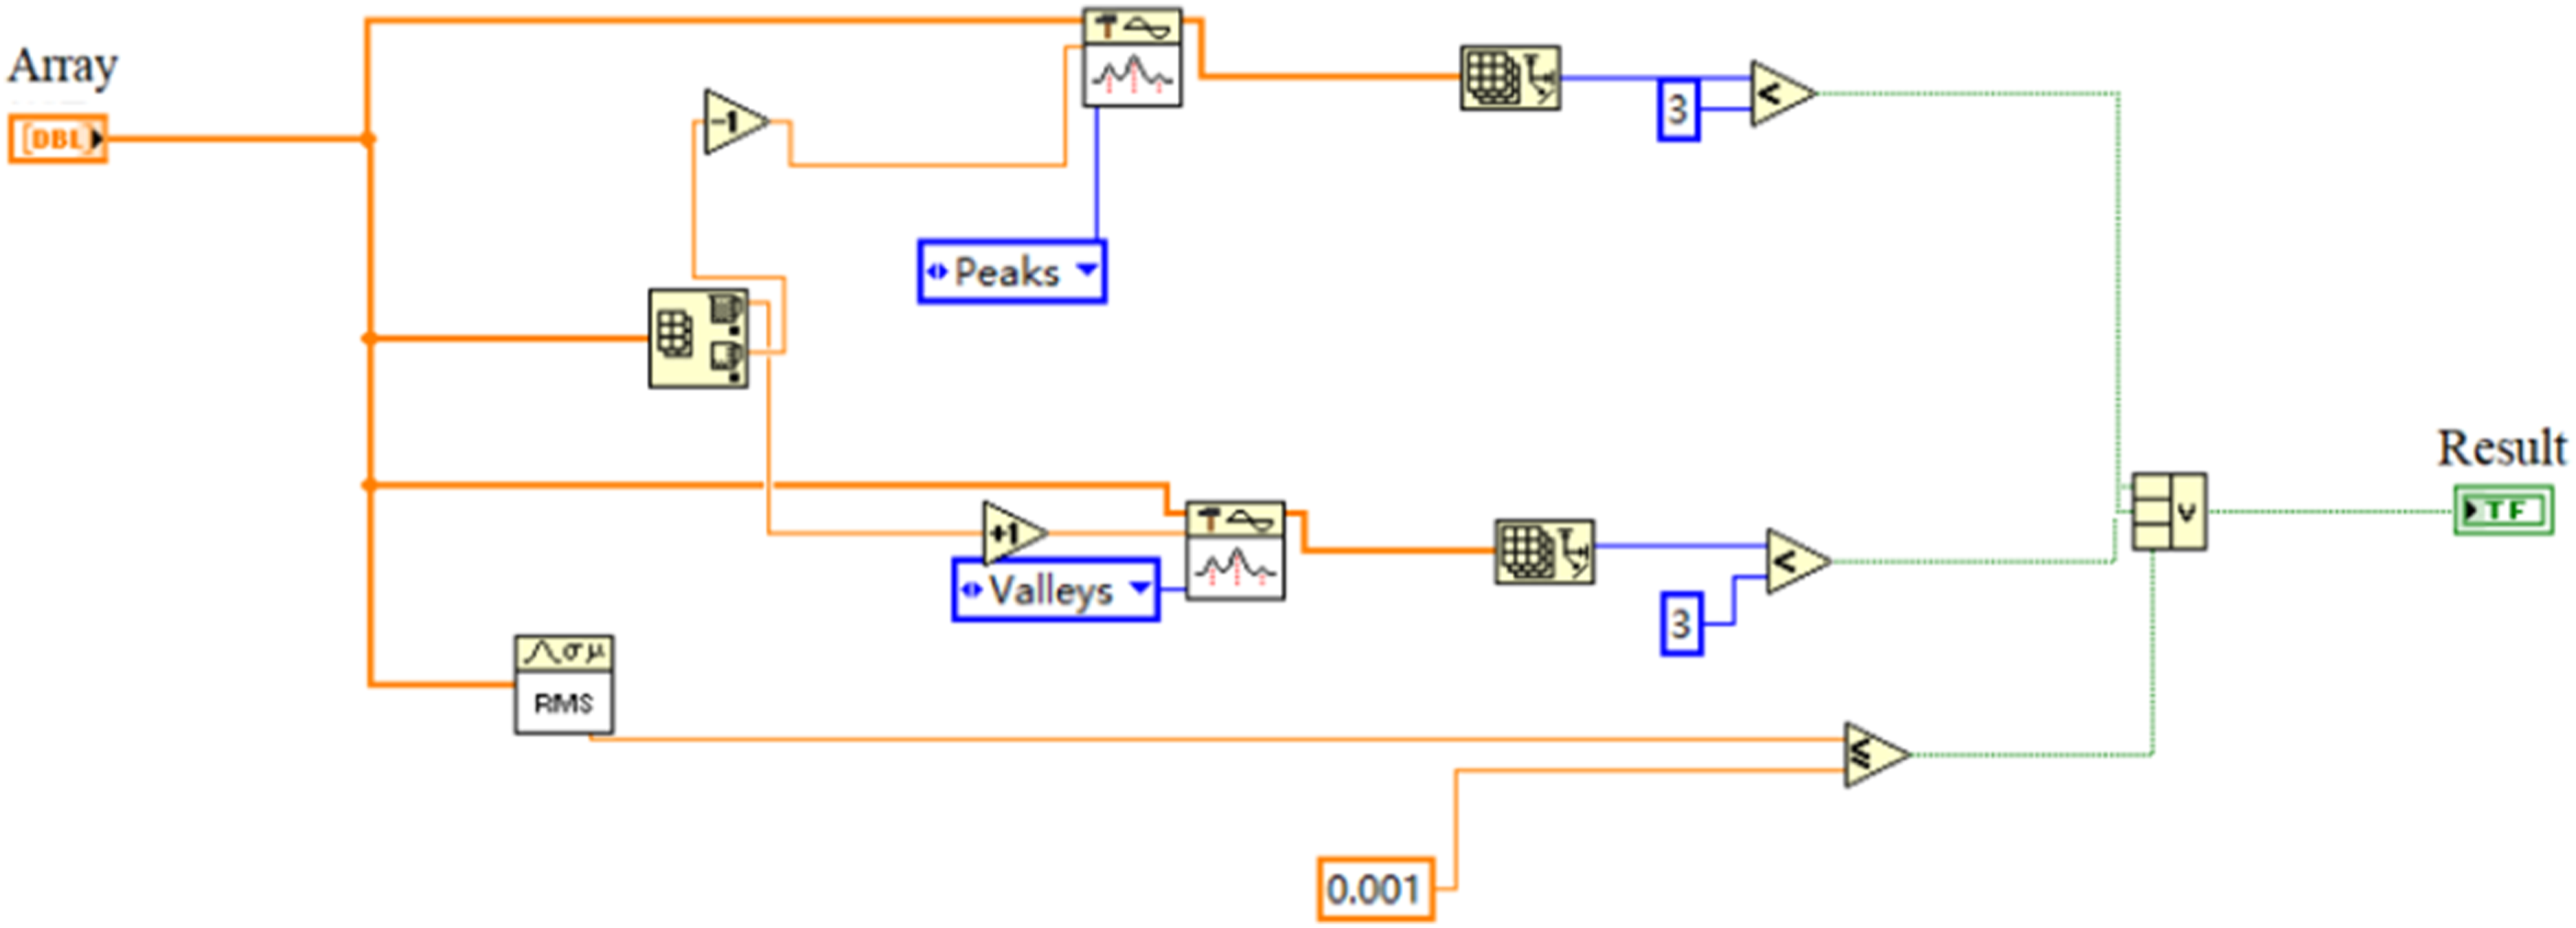
The EMD analysis module can decompose the acceleration and velocity signals into corresponding IMF components. The EMD module’s front panel is used for the analysis of collected results in terms of IMF components and frequency, with specific results shown in Figure 11. EMD analysis module program diagram.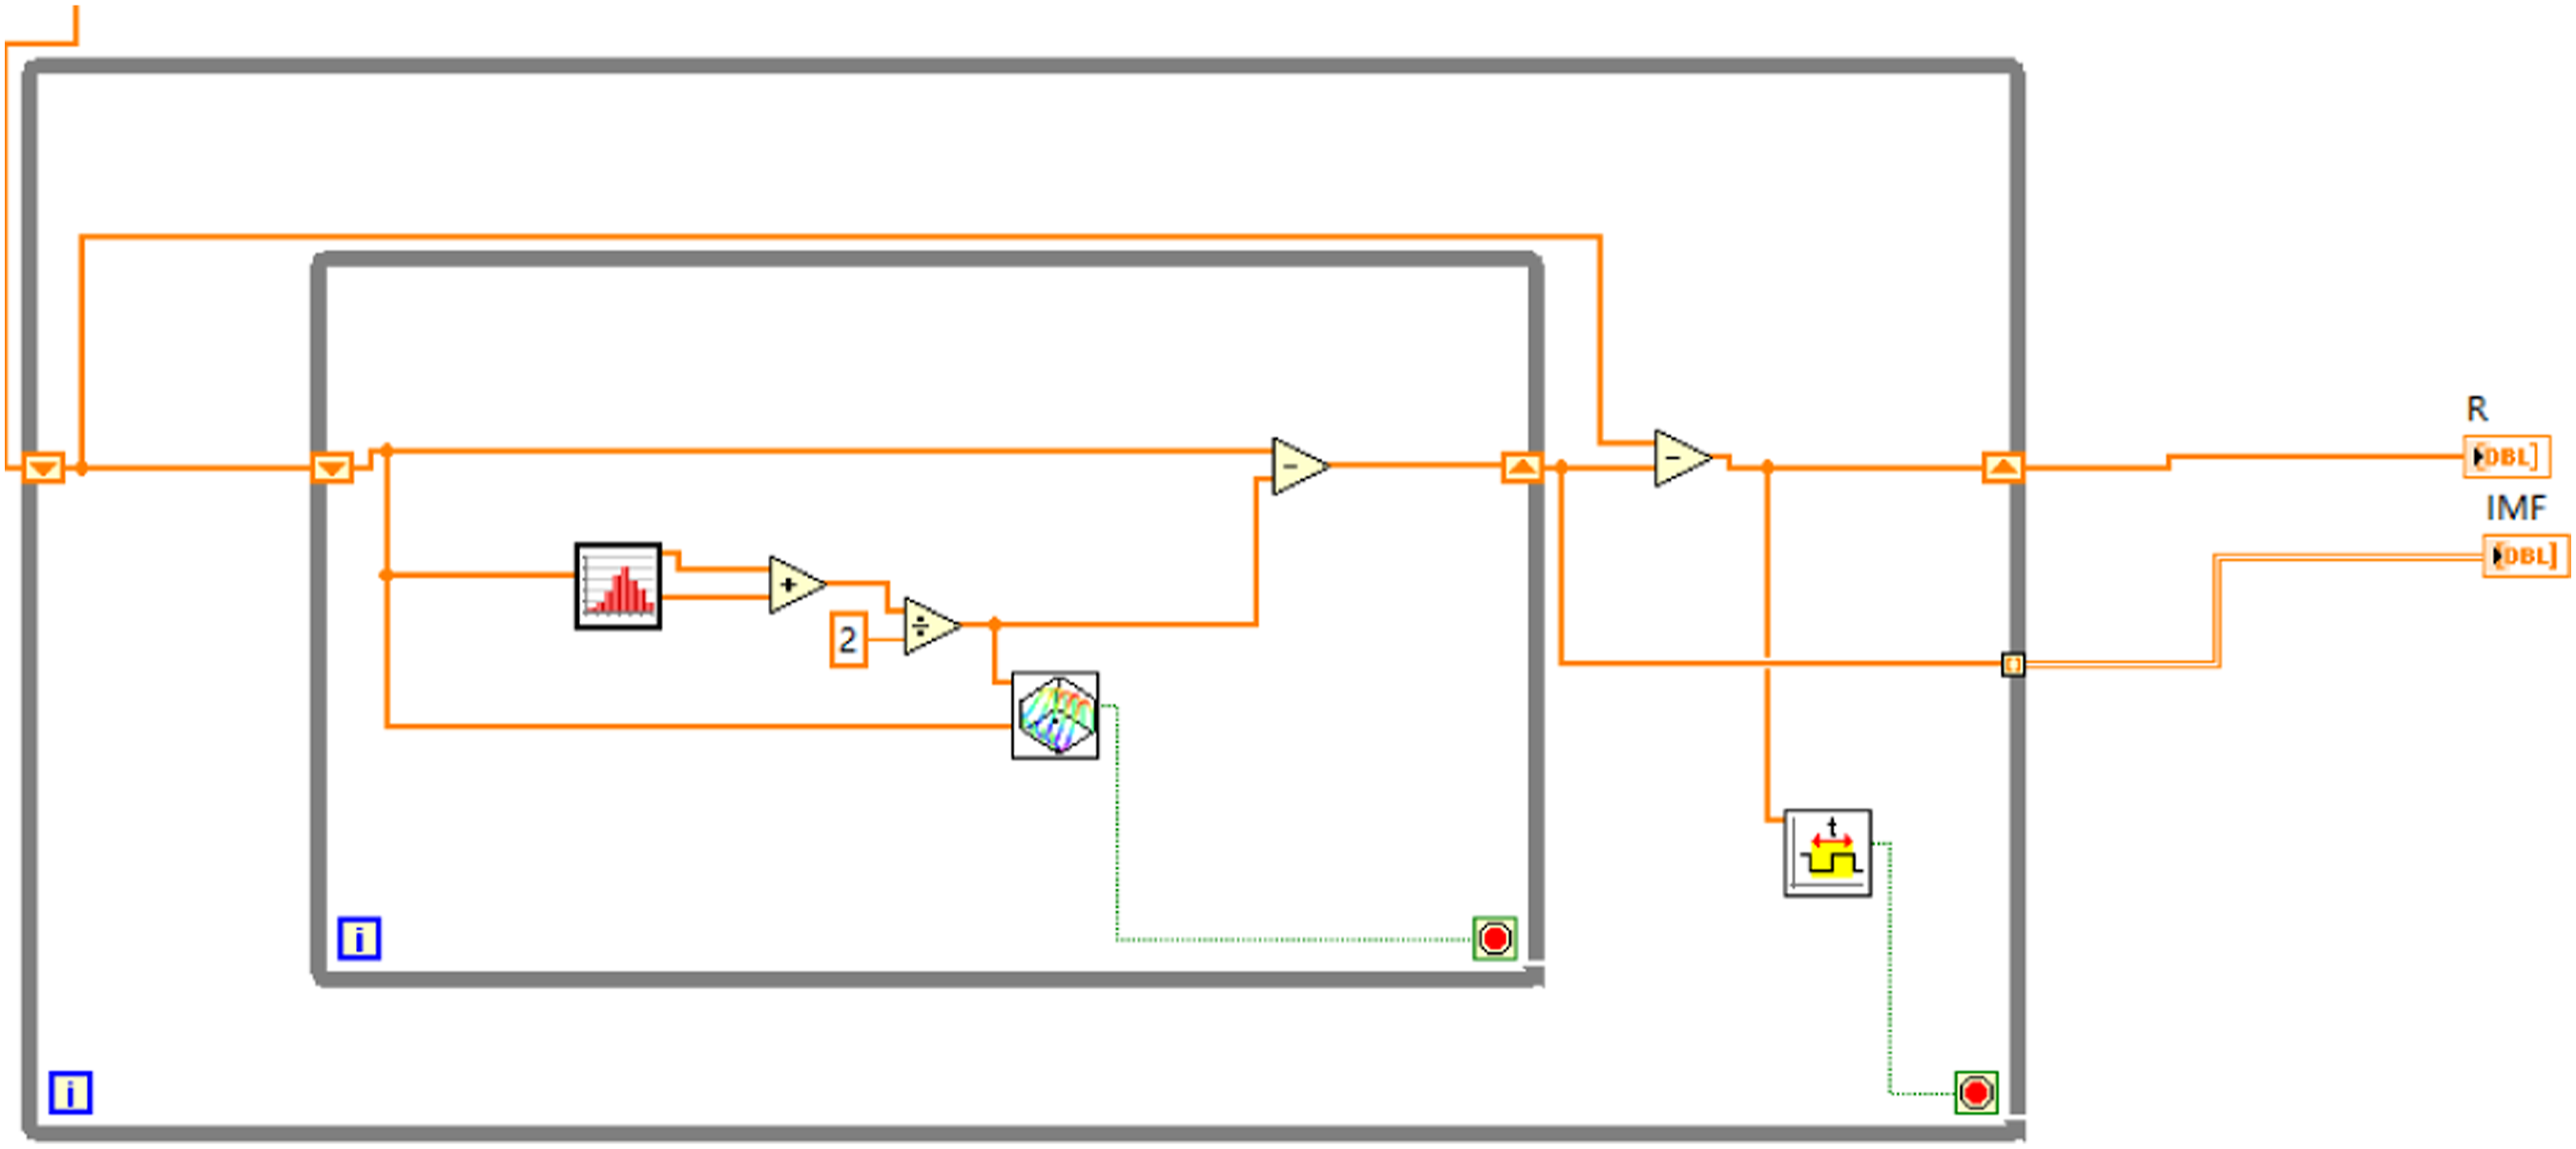
Pressing the EMD analysis button, the system automatically performs the EMD algorithm to process the vibration signal, with the specific front panel shown in Figure 12. EMD analysis module front panel.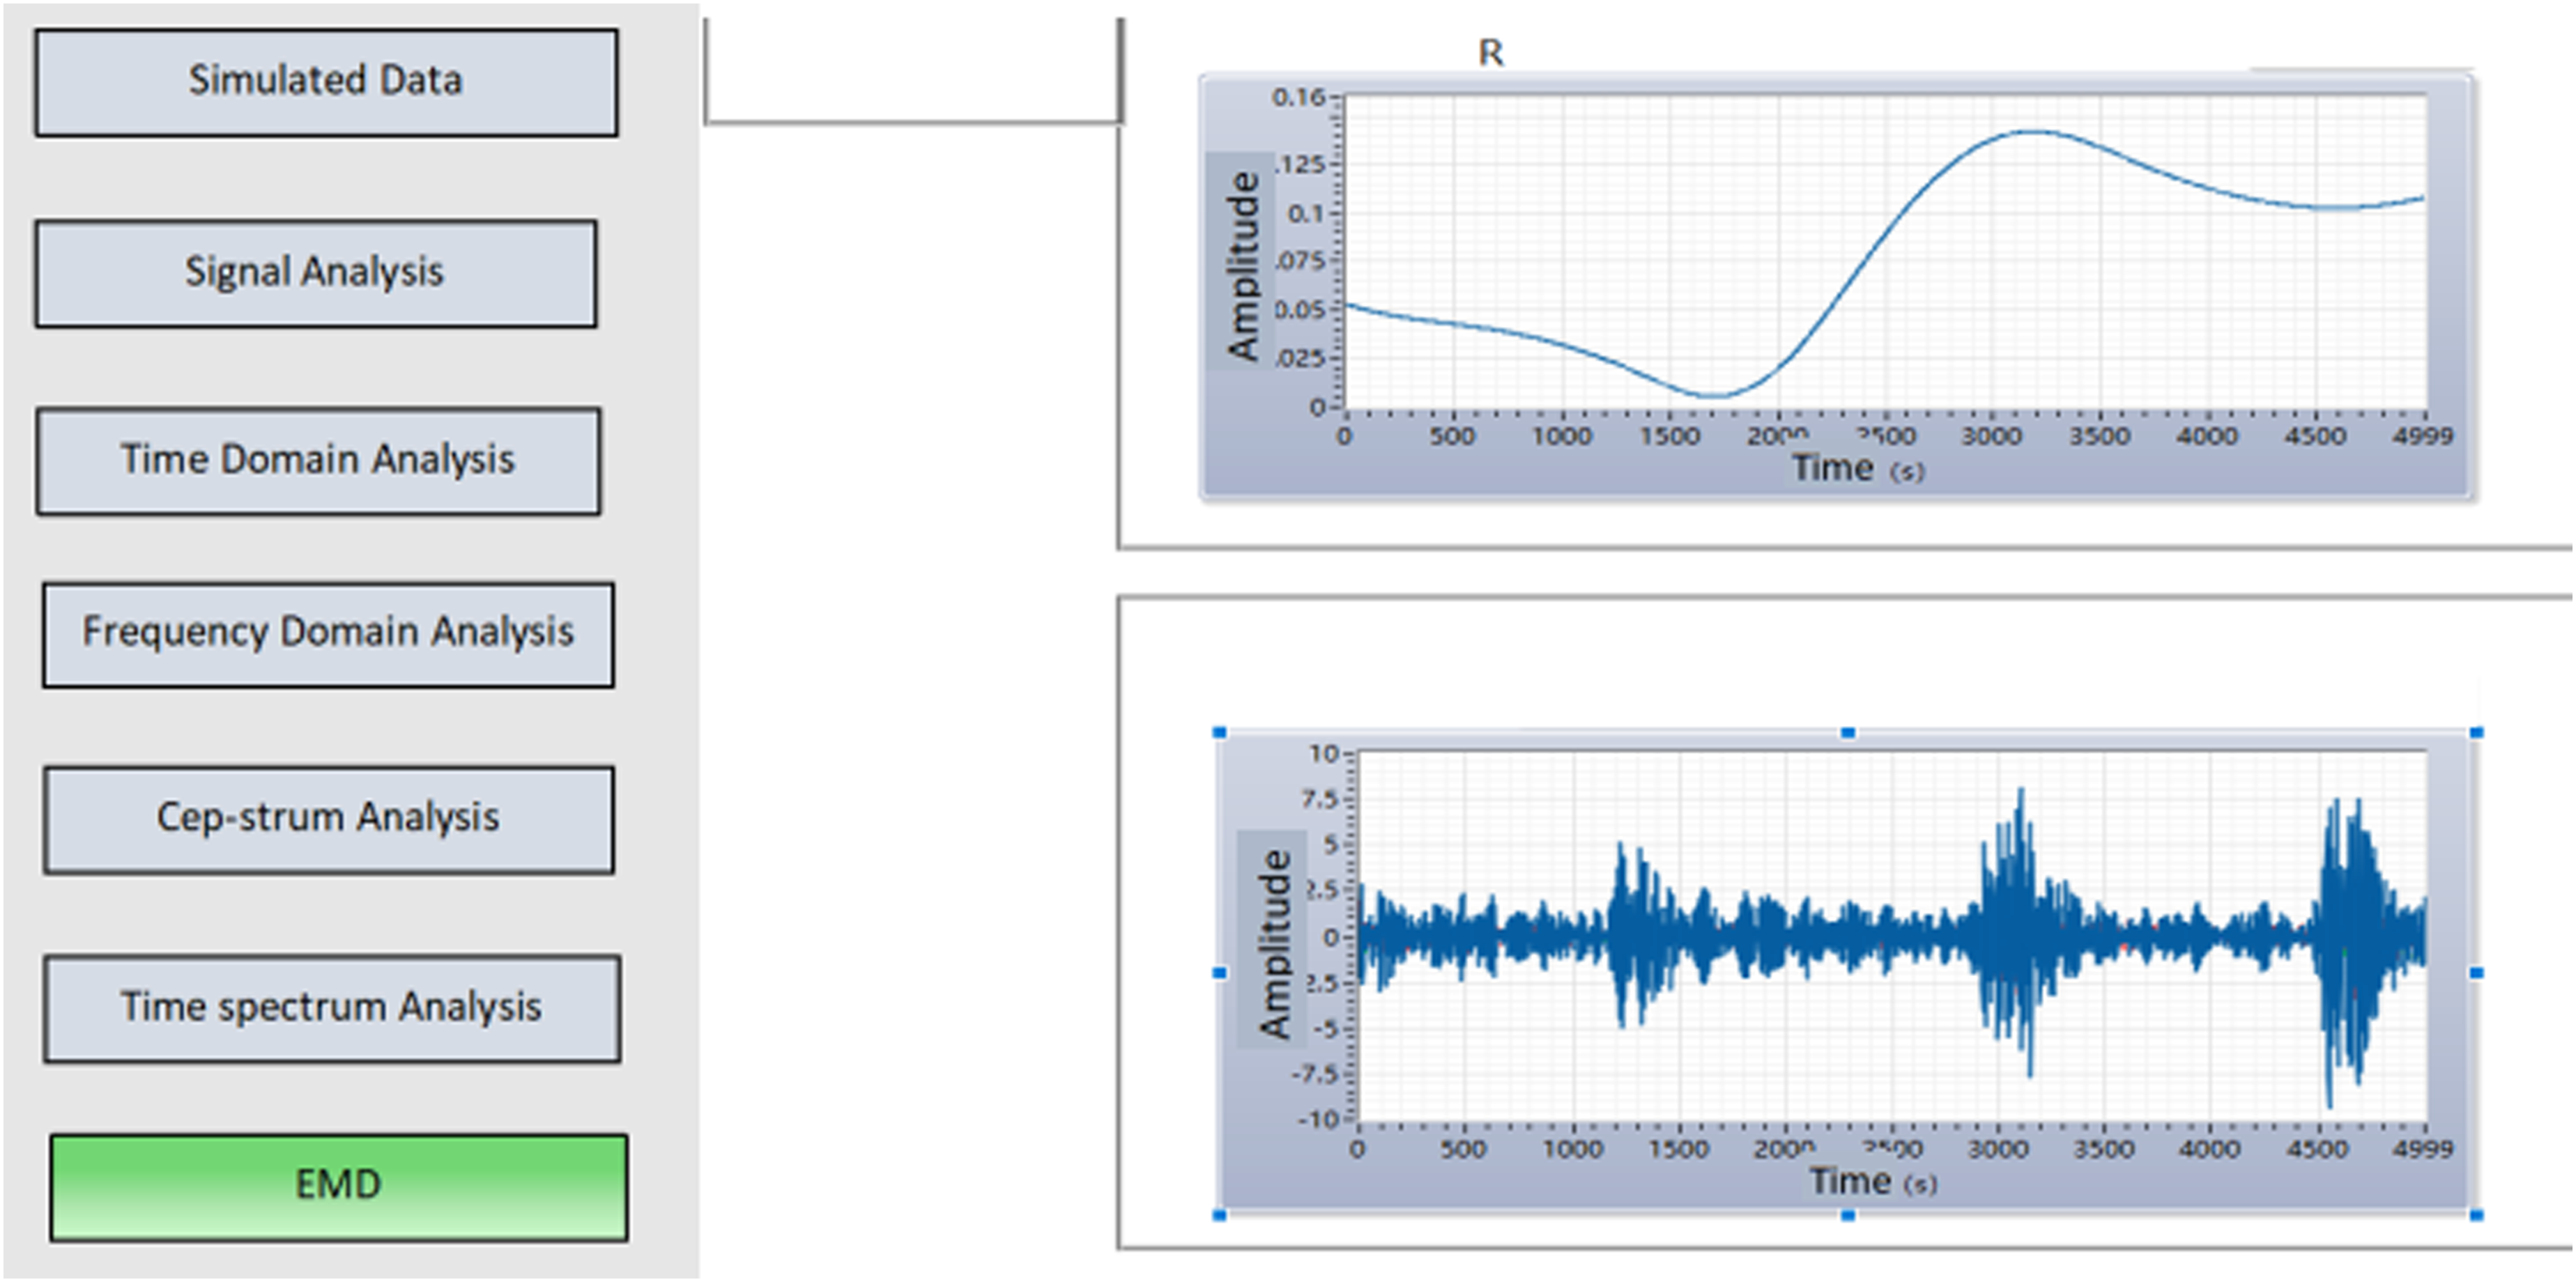
Autocorrelation programming
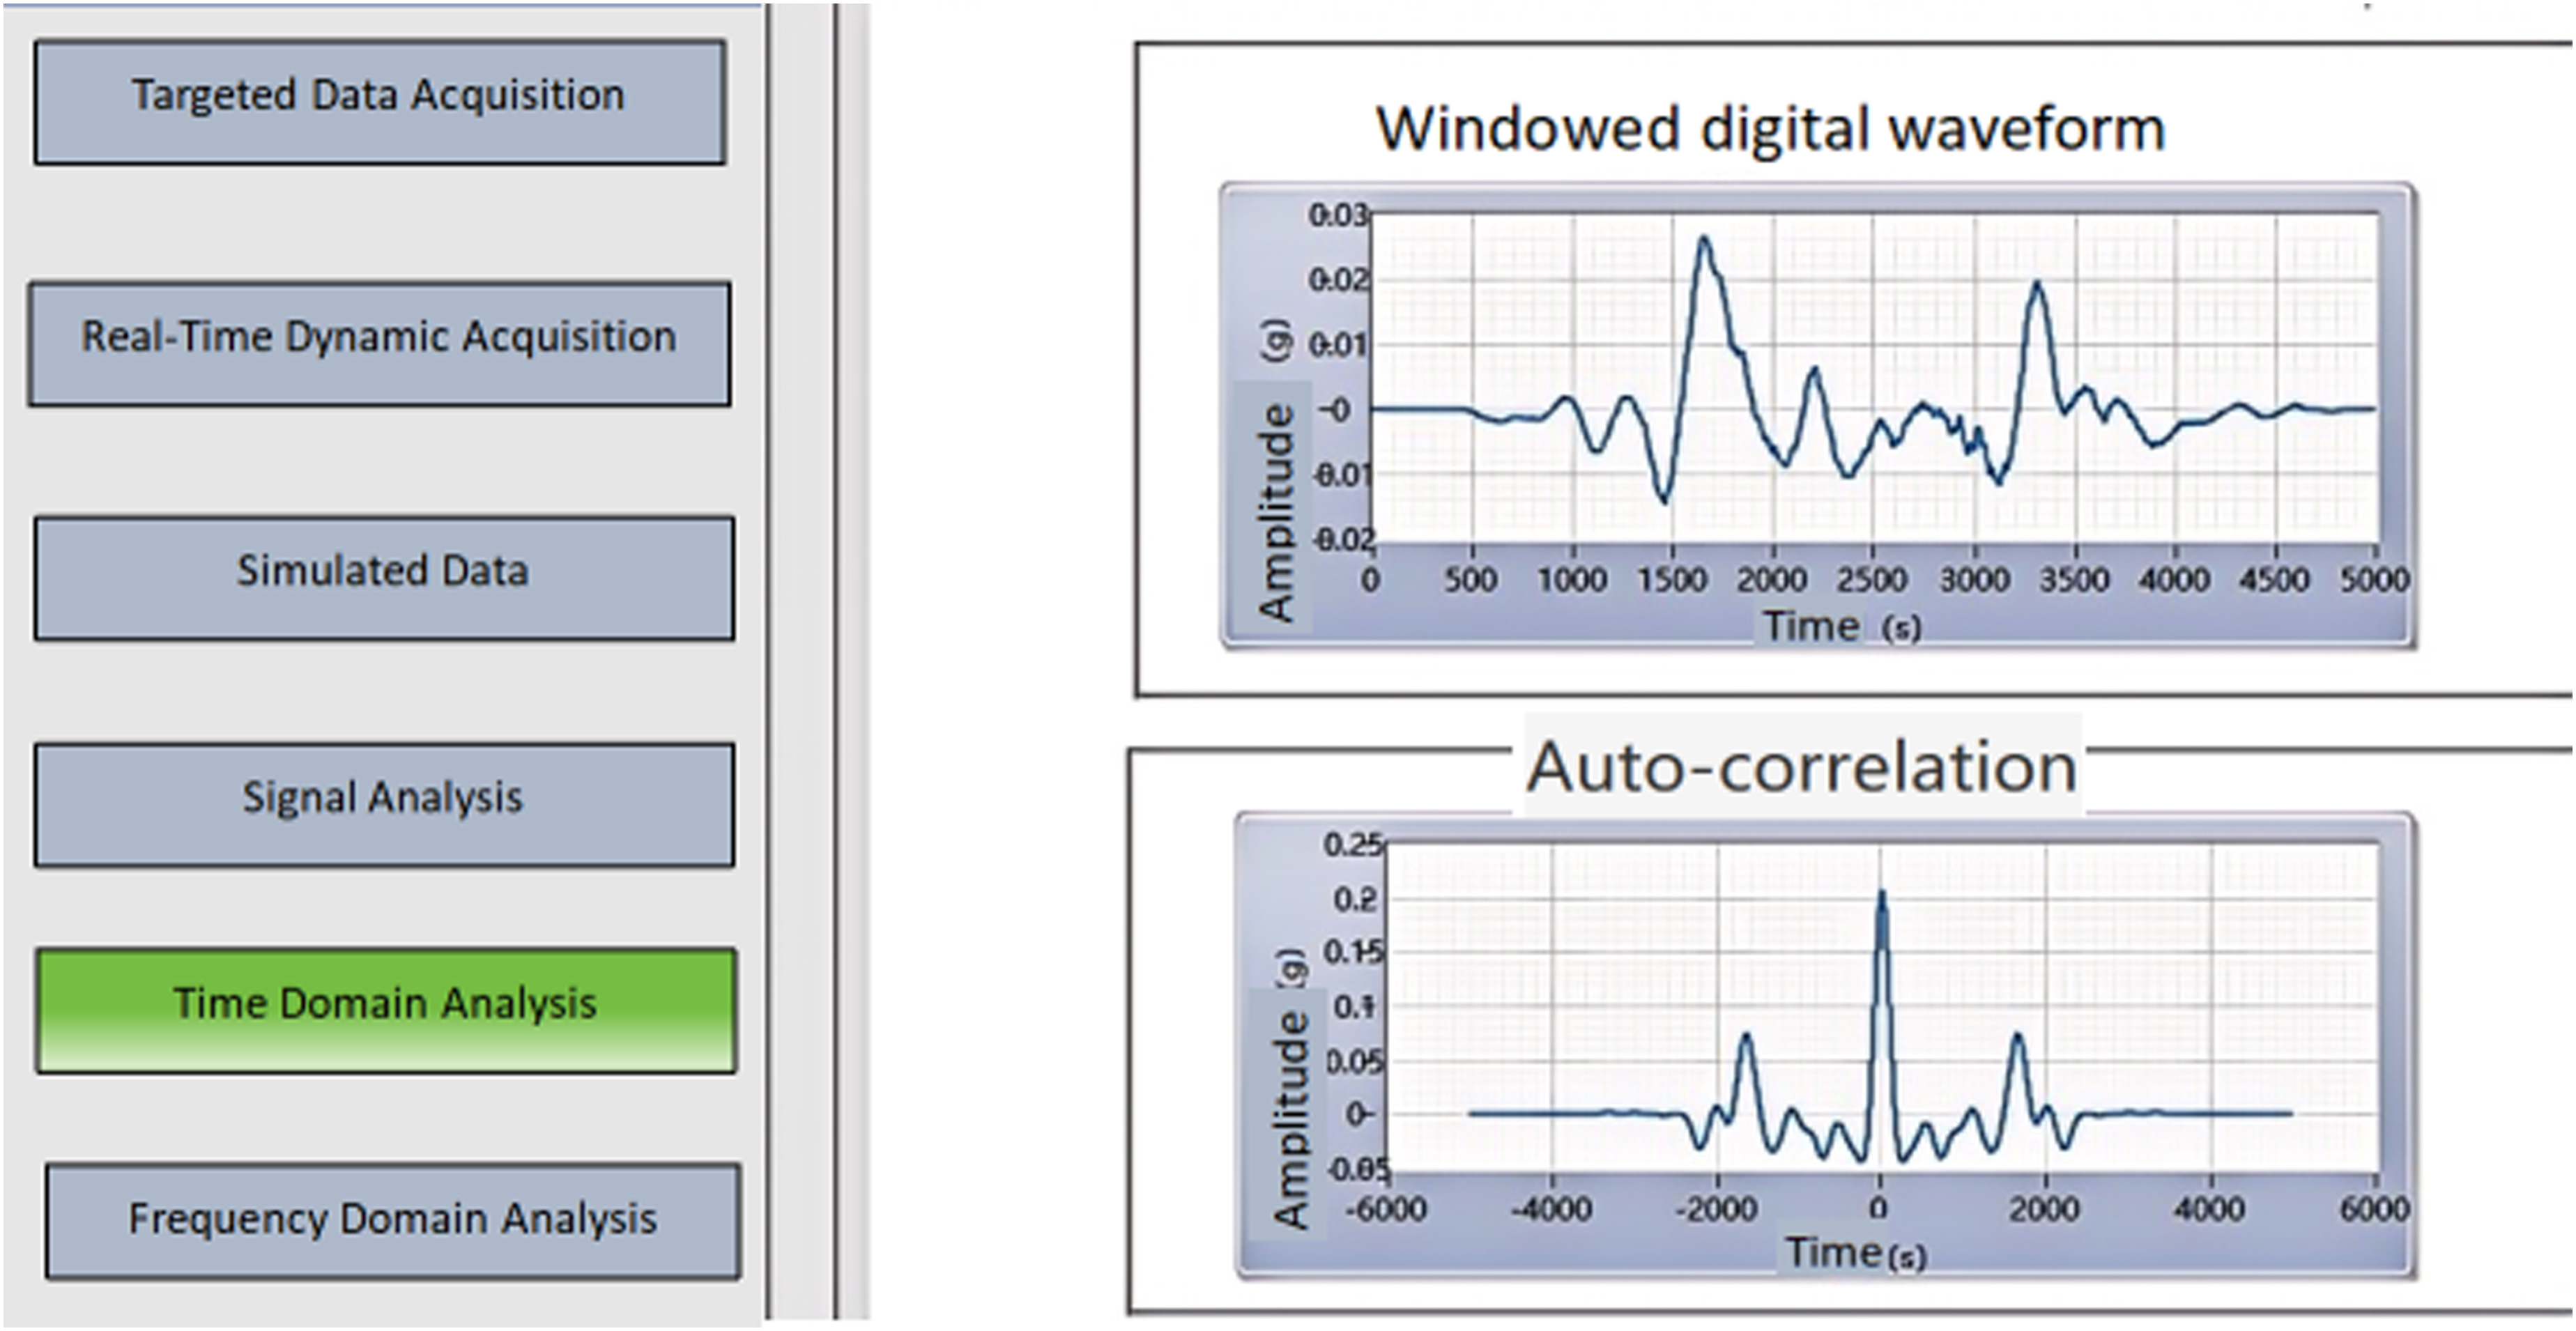
Process the windowed digital waveform signal after acquisition for time-domain autocorrelation analysis. Utilize the autocorrelation waveform signal processing sub-VI to perform autocorrelation analysis on signals from different channels. This analysis can both analyze different frequency components within a signal and extract mixed vibration signals. The specific autocorrelation analysis program diagram is shown in Figure 13, and the specific front panel is shown in Figure 14. Autocorrelation analysis program diagram. Autocorrelation analysis front panel.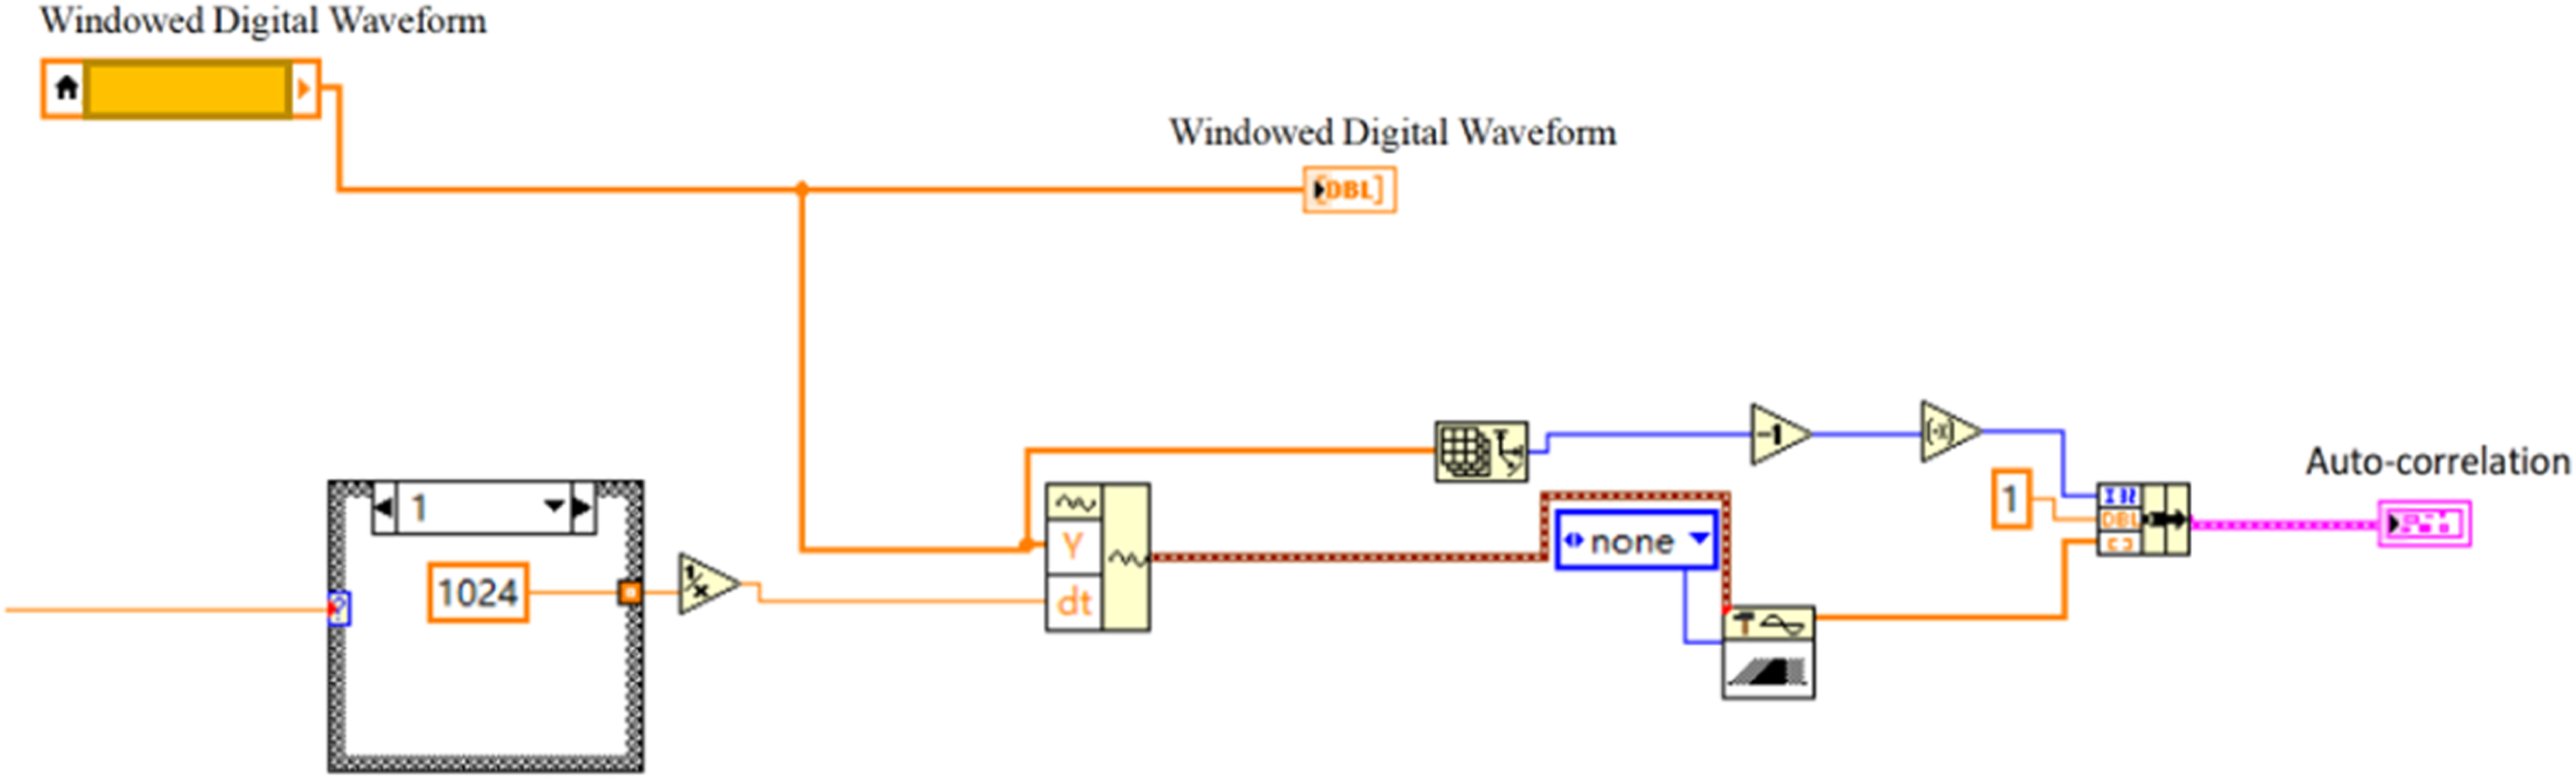
Experimental results
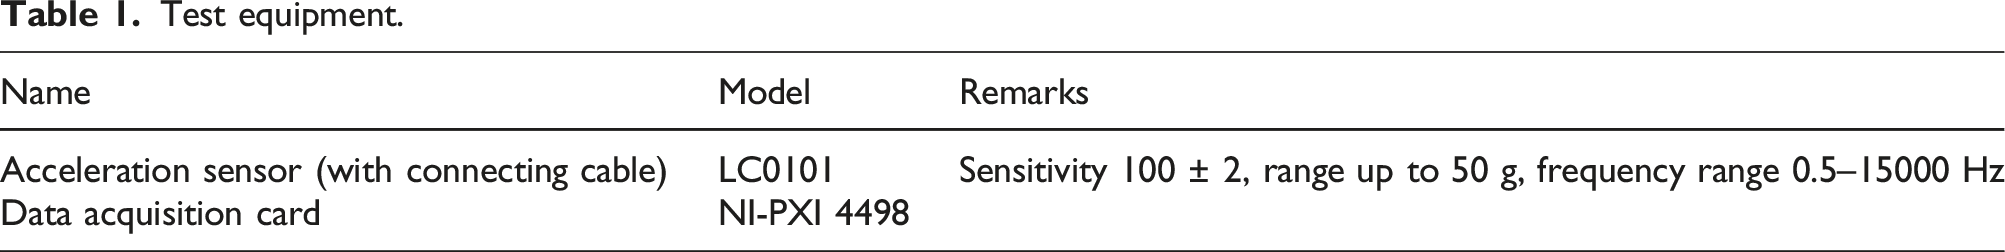
Test equipment.
(2) The test is conducted at a temperature of 16°C and an atmospheric pressure of 0.8×10⁵ Pa. During the test, the pre-injection timing is controlled at 10°CA, with a pre-injection fuel quantity of 1 mg/cycle. Under full load, vibration signals are collected at engine speeds of 800, 1600, and 2400 r/min.
(3) Standardization Process: The acceleration sensor is attached to the cylinder head cover, generator, and oil pan of the test object, with the other end connected to the data acquisition instrument NI-PXI 4498. Based on the collection settings and test settings in the software, when the test component vibrates, the voltage signal collected by the acceleration sensor is transmitted to a PC equipped with LabVIEW vibration collection software for processing, thus obtaining visualized autocorrelation analysis and EMD algorithm decomposition of IMF components.
Experimental equipment
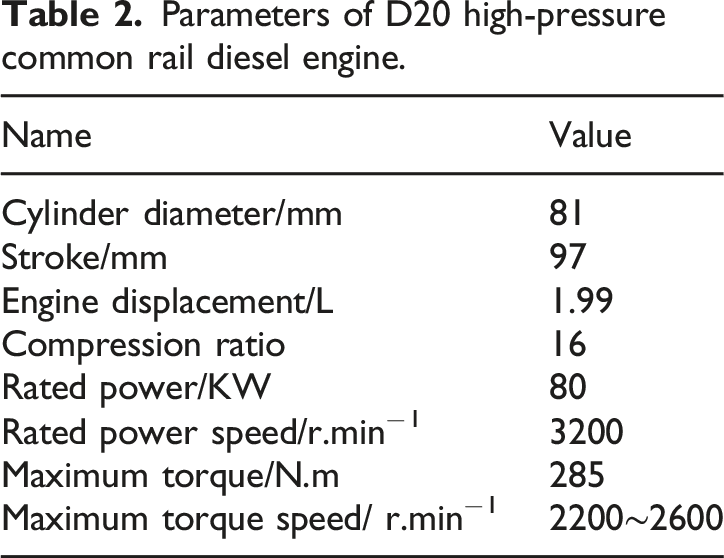
Parameters of D20 high-pressure common rail diesel engine.
To measure the main injection vibration signals under different operating conditions and the vibration signals of different pre-injection parameters, a vibration experimental rig is set up. The vibration experimental rig includes a self-developed vibration acquisition system, NI data acquisition device, LC01 series embedded IC piezoelectric acceleration sensor, and the D20 high-pressure common rail diesel engine. The specific experimental rig setup is shown in Figure 15. Vibration test rig setup.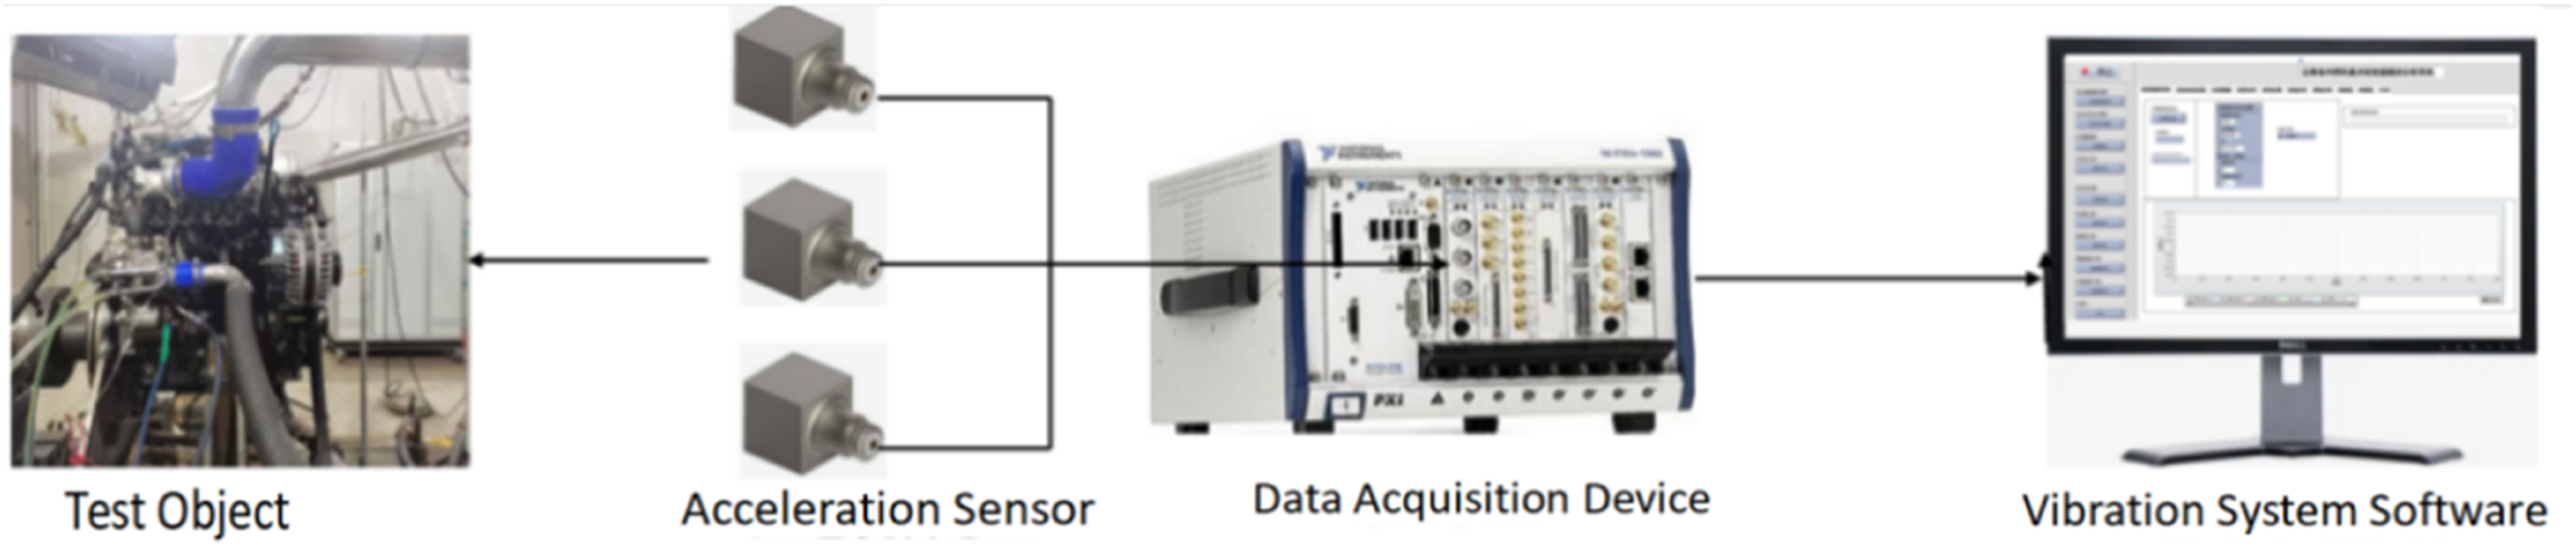
During the vibration testing process, three different test points are selected, with acceleration sensors closely attached to the test point locations. The acceleration sensors use the LC01 series built-in IC piezoelectric acceleration sensors, with a sensitivity of 100 ± 2, a range of 50 g, and a frequency range of 0.5–15,000 Hz. They are connected to the data acquisition device, and the collected vibration signals are transmitted to the computer through the acquisition card for relevant processing and analysis.
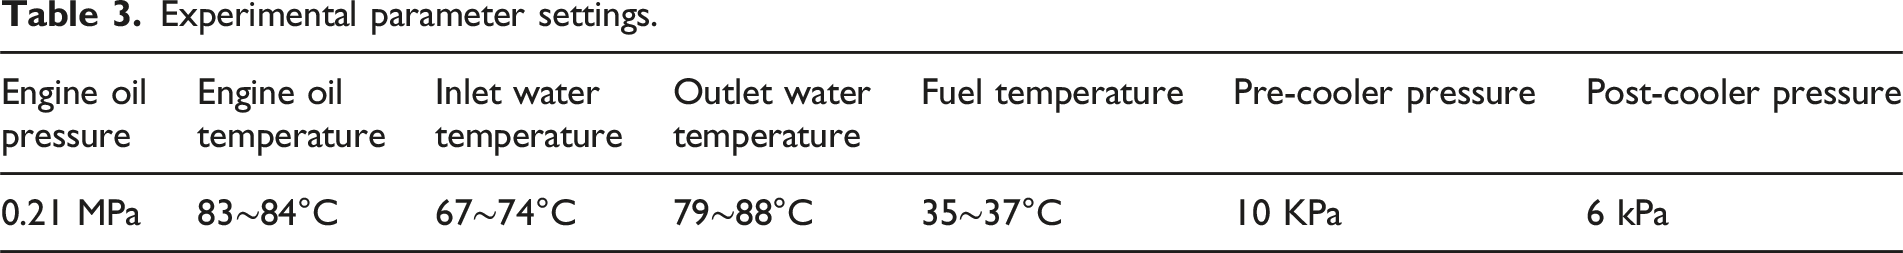
Experimental parameter settings.
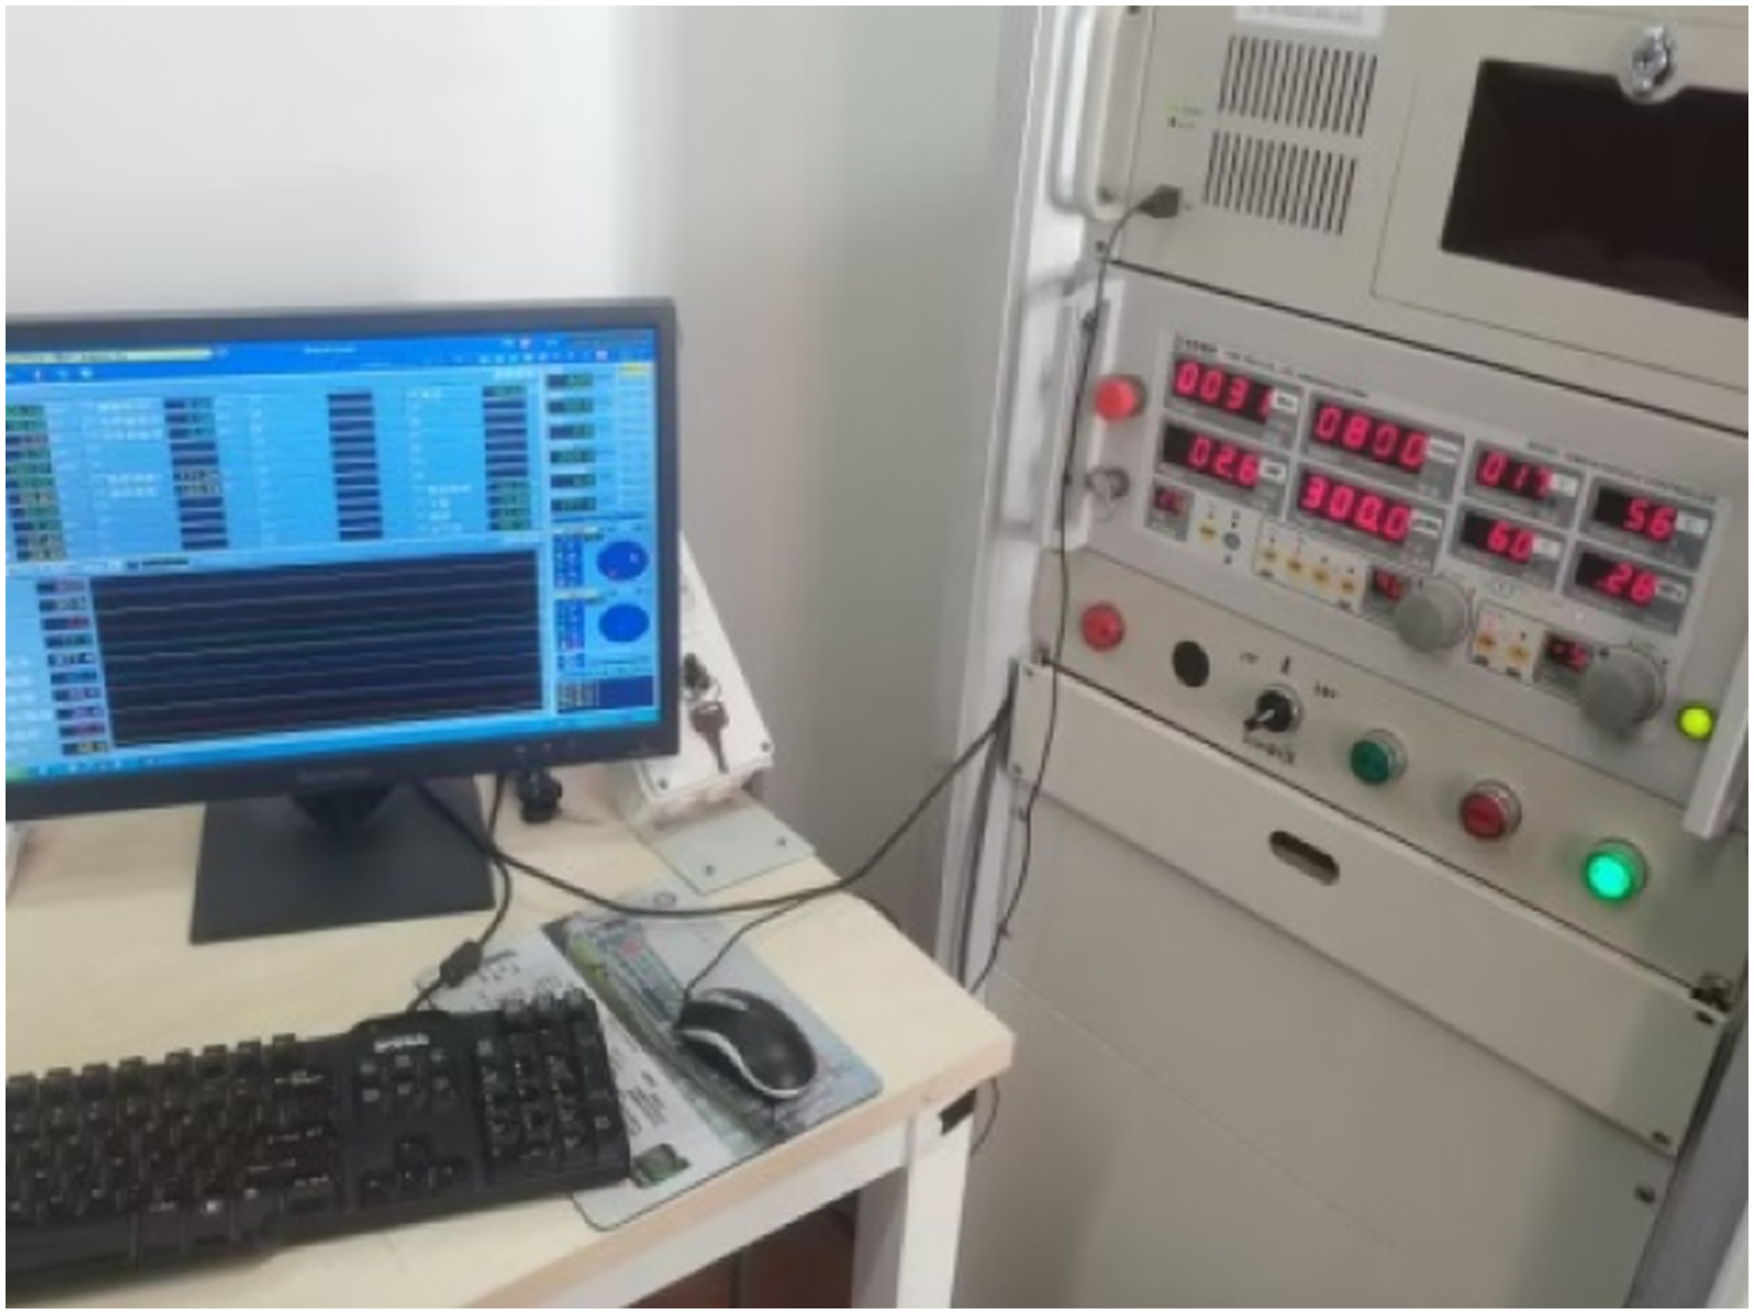
Test rig equipment.
INCA fuel injection parameter adjustment.
The vibration produced by engine combustion primarily acts on the cylinder head and its cover, and most of the noise generated by the vibration is concentrated in the oil pan and generator. Therefore, the test points are chosen to be at the top of the cylinder, the oil pan, and the generator (Figure 18). Engine test point setup.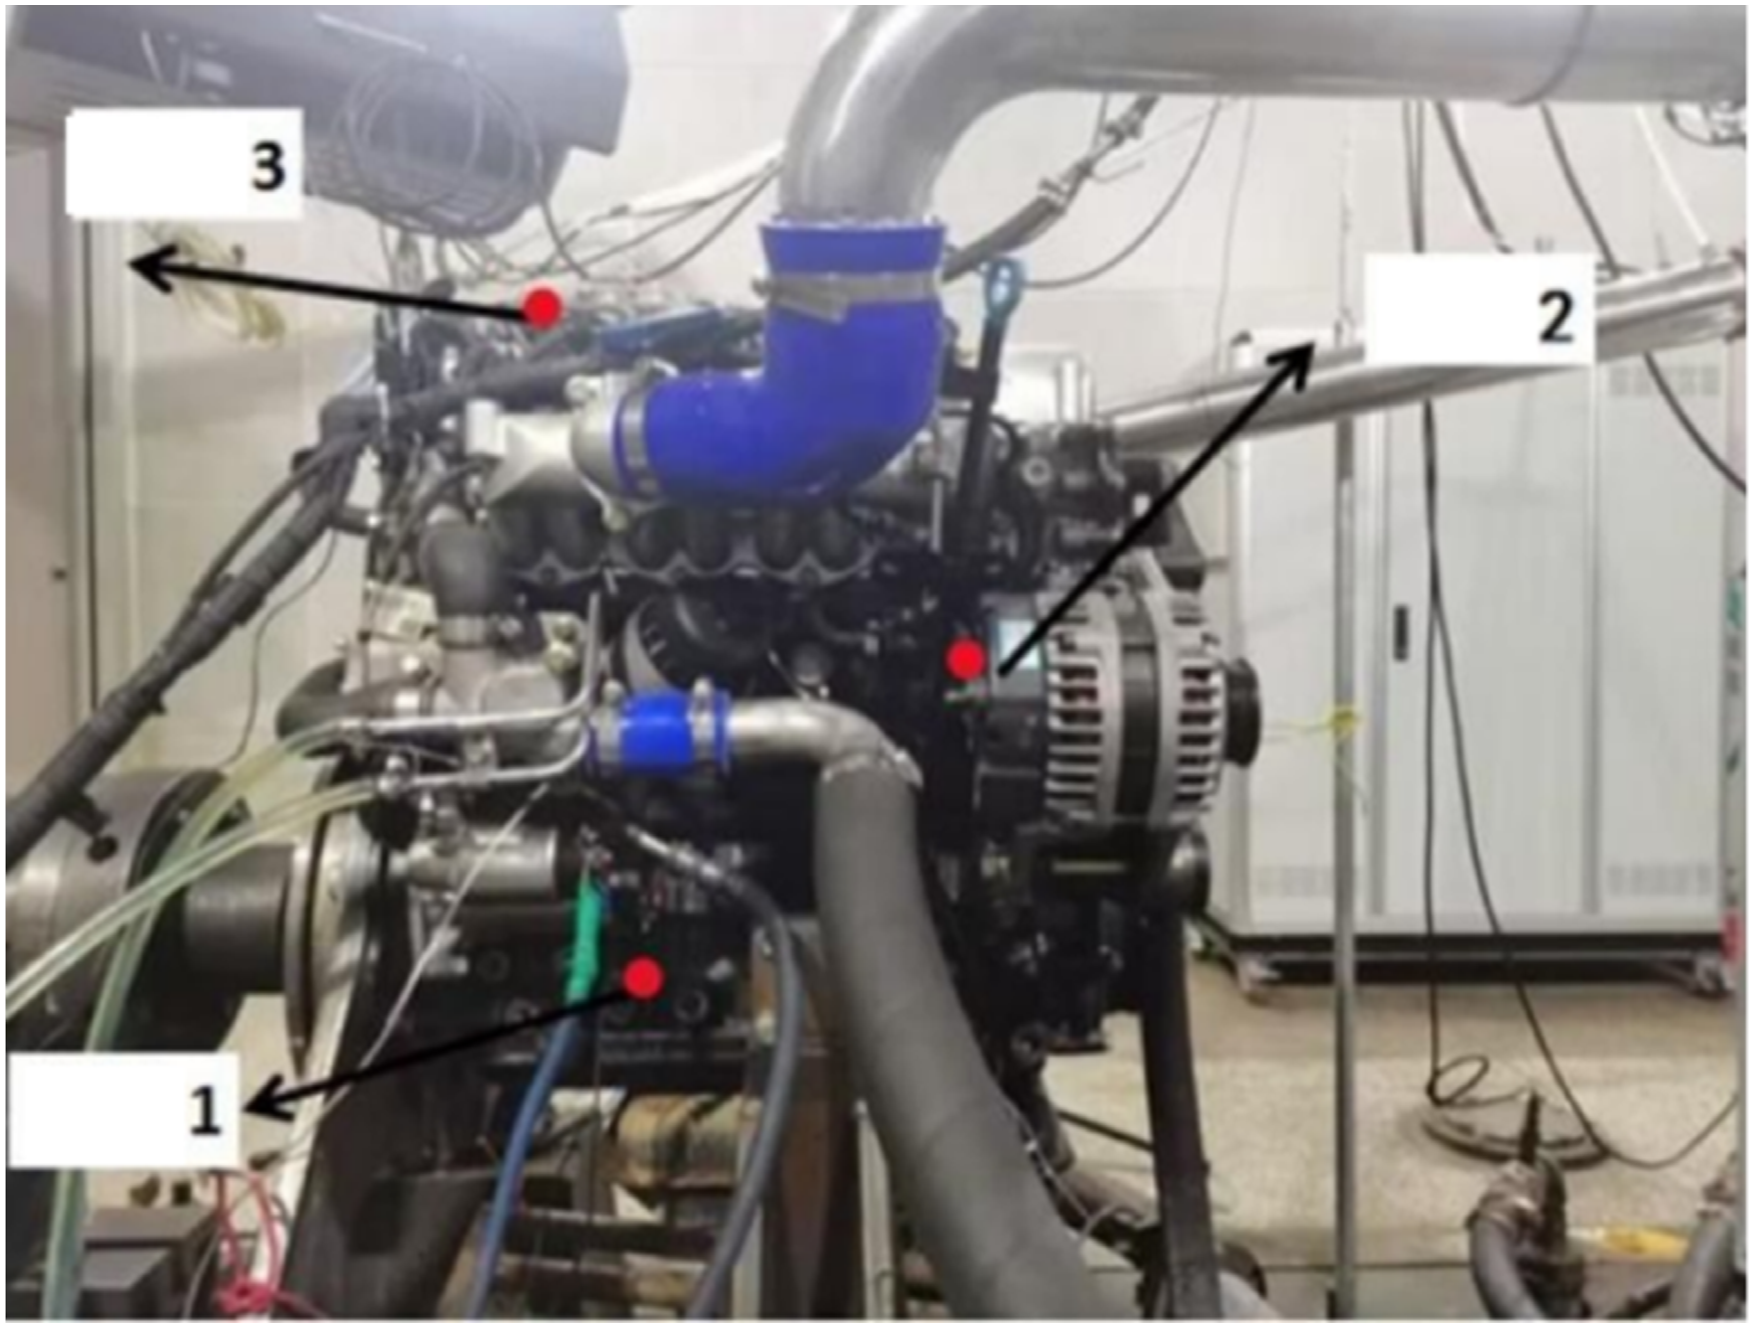
The experiment mainly analyzes the vibration signals at 800, 1600, and 2400 r/min under 100% load using the EMD algorithm to determine whether there are faults and noise in the engine parts. The noise caused by the vibration produced during engine combustion occurs mainly at the oil pan, generator, and cylinder head cover. Therefore, the cylinder head cover, oil pan, and generator are selected as the test points for the vibration test, using vibration signal analysis to determine if there are any engine faults, which is of great significance for engine vibration analysis.
Experimental results
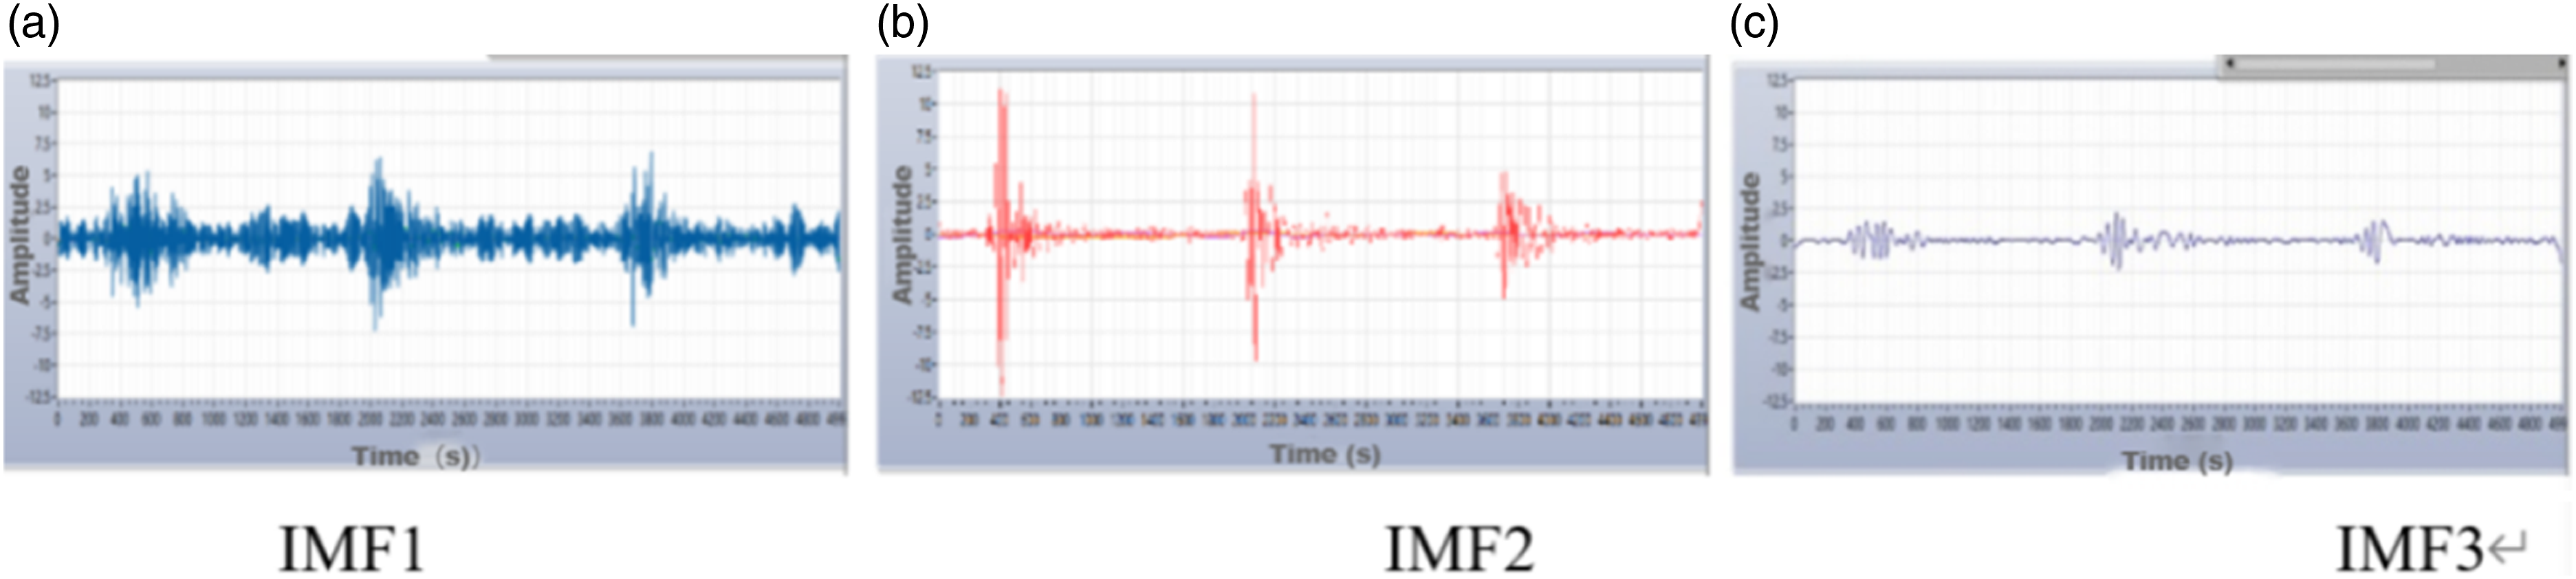
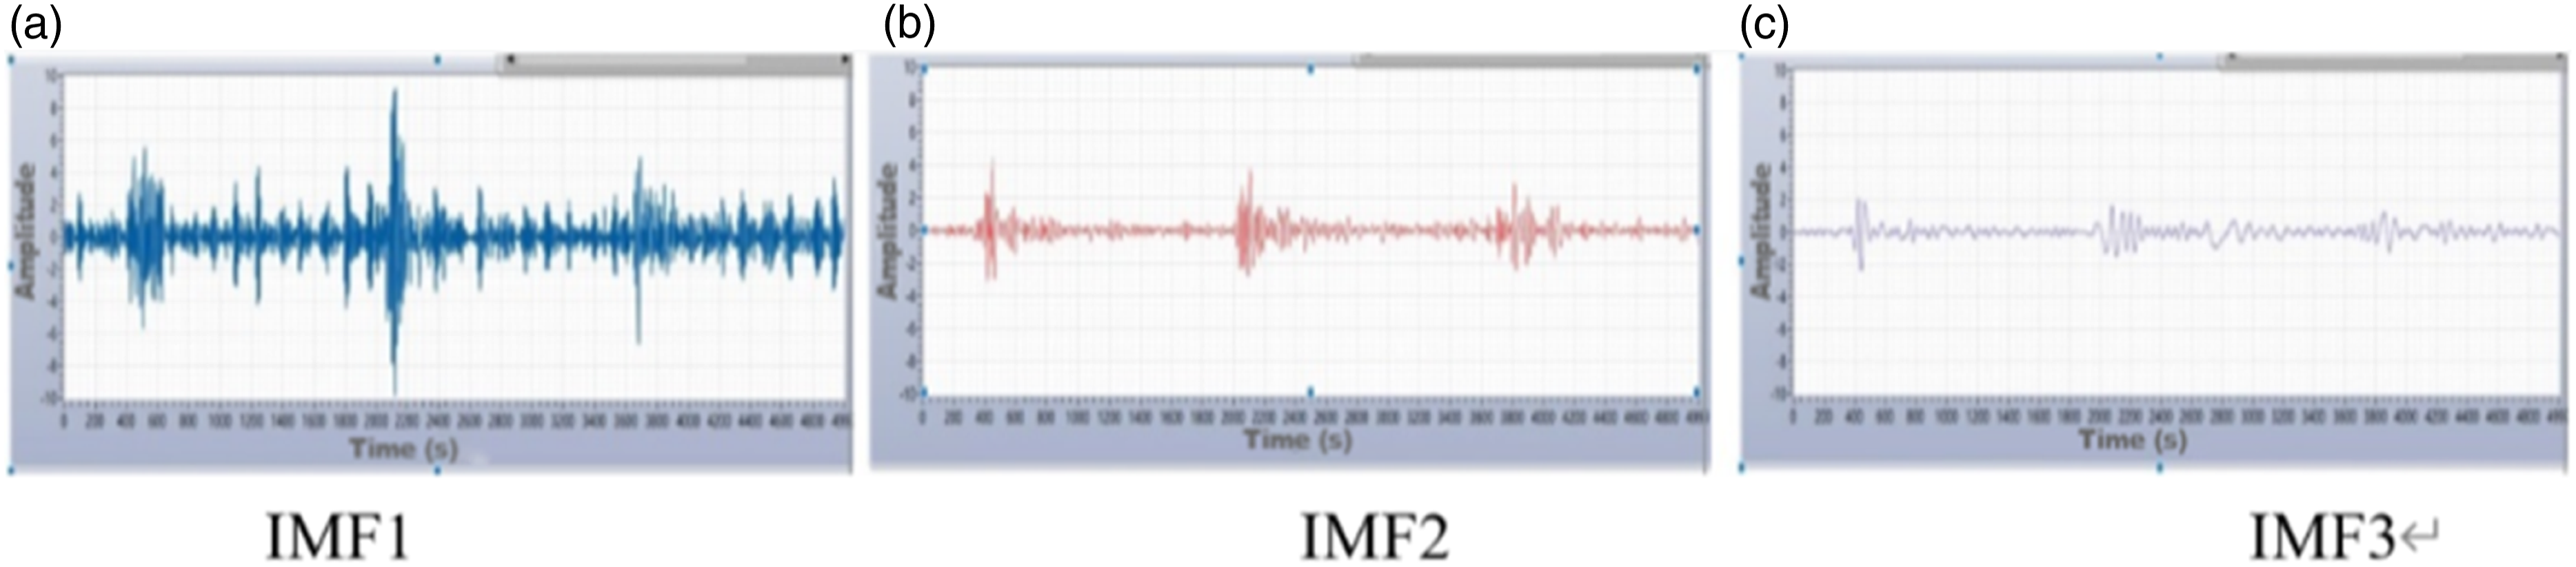
The study investigates the engine conditions at speeds of 800 r/min, 1600 r/min, and 2400 r/min under a fixed load of 100%. Channel 1 is used as the oil pan detection channel. The collected Channel 1 data are processed for autocorrelation and decomposed with the EMD algorithm for different speeds. For simplicity, this paper focuses only on the vibration signal analysis at 800 r/min, with specific results shown in the following figure:
From Figures 19 and 20, it can be seen that the oil pan vibration signals under different conditions can yield periodic signals through autocorrelation analysis. At 800 r/min, the three IMF components of the oil pan obtained from EMD match the periodic signals obtained from autocorrelation analysis at 800 r/min, without any other noise cycles. Therefore, this test indicates that there are no fault signal waves in the engine oil pan components, proving the signals’ authenticity and accuracy. Autocorrelation analysis of oil pan vibration signals under different conditions. EMD analysis of oil pan vibration signal at 800 r/min.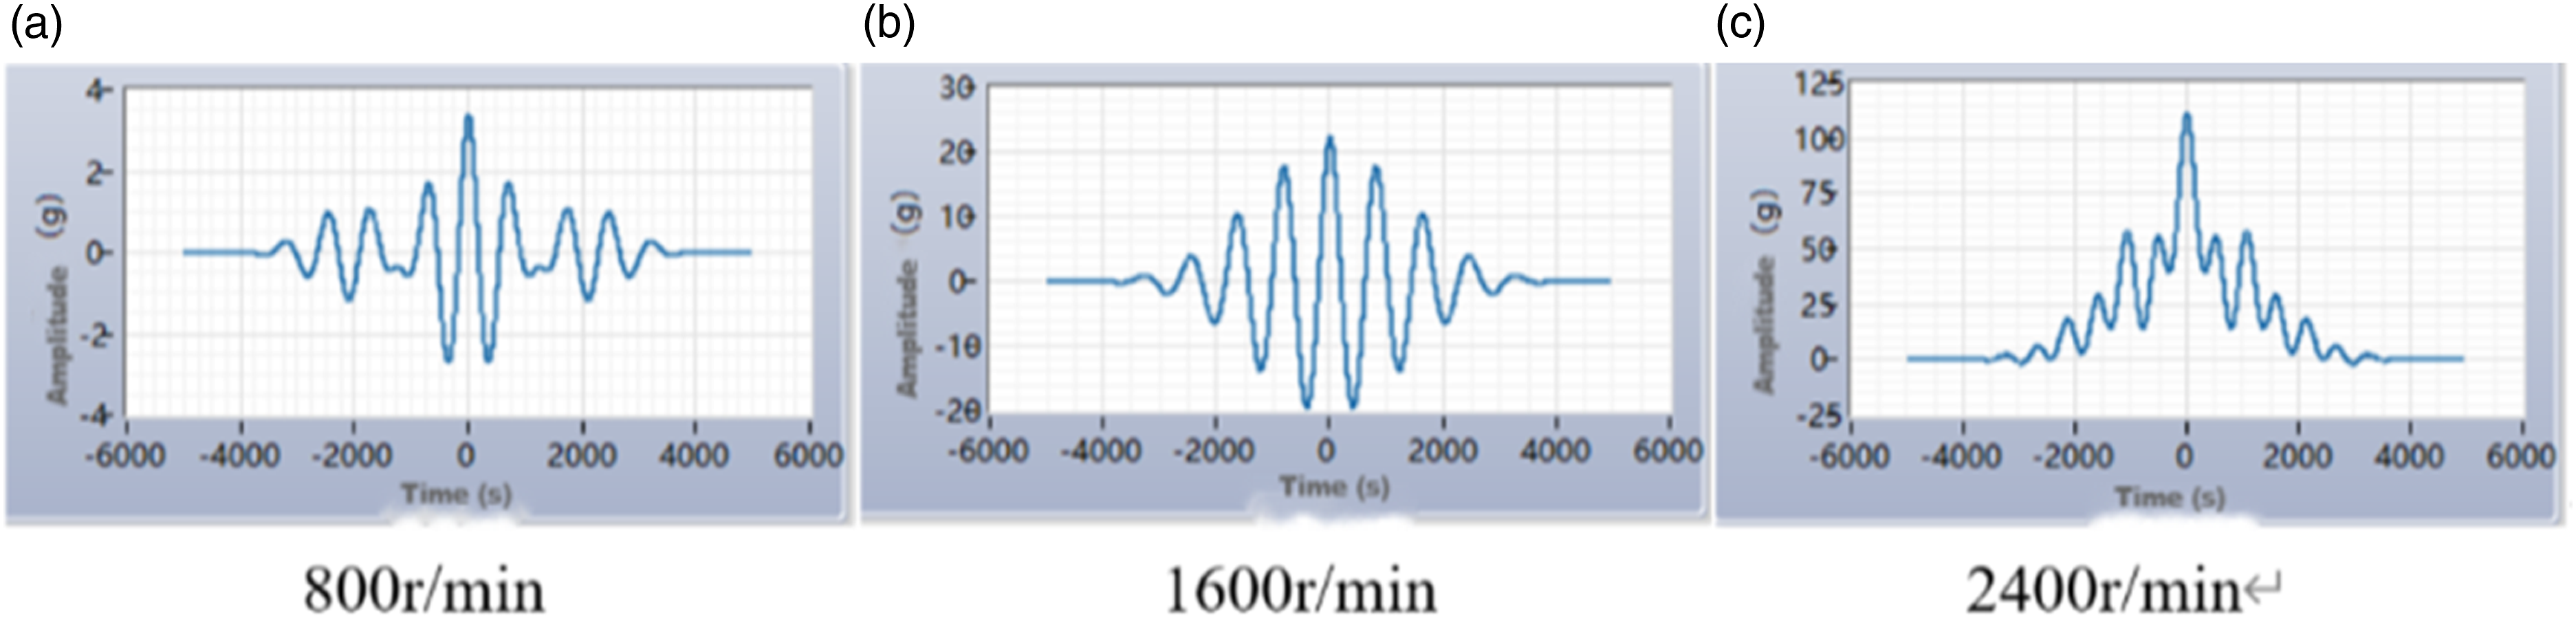
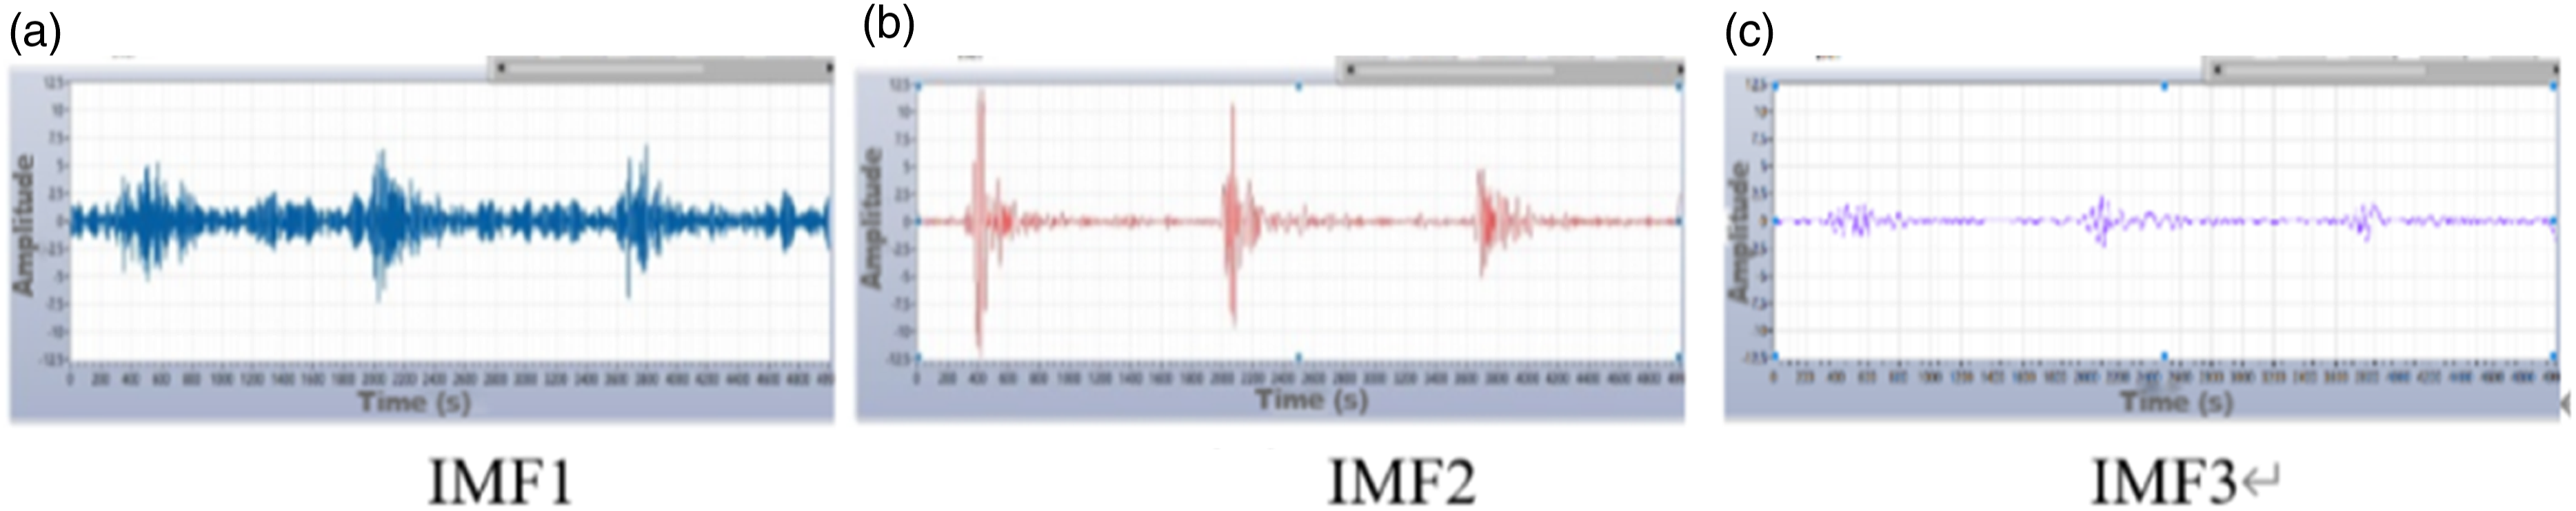
The study of engine speeds at 800 r/min, 1600 r/min, and 2400 r/min, where channel 2 is for generator detection, showed that the data collected from channel 2 subjected to autocorrelation analysis and EMD for vibration signals at different speeds yielded the following results:
From Figures 21 and 22, the three IMF components decomposed by EMD match the periodic signals of the generator at 800 r/min, without any other noise cycles. Thus, this test indicates that there are no fault waves in the generator location, proving the signals’ authenticity and accuracy. Autocorrelation analysis of generator vibration signals under different conditions. EMD analysis of generator at 800 r/min.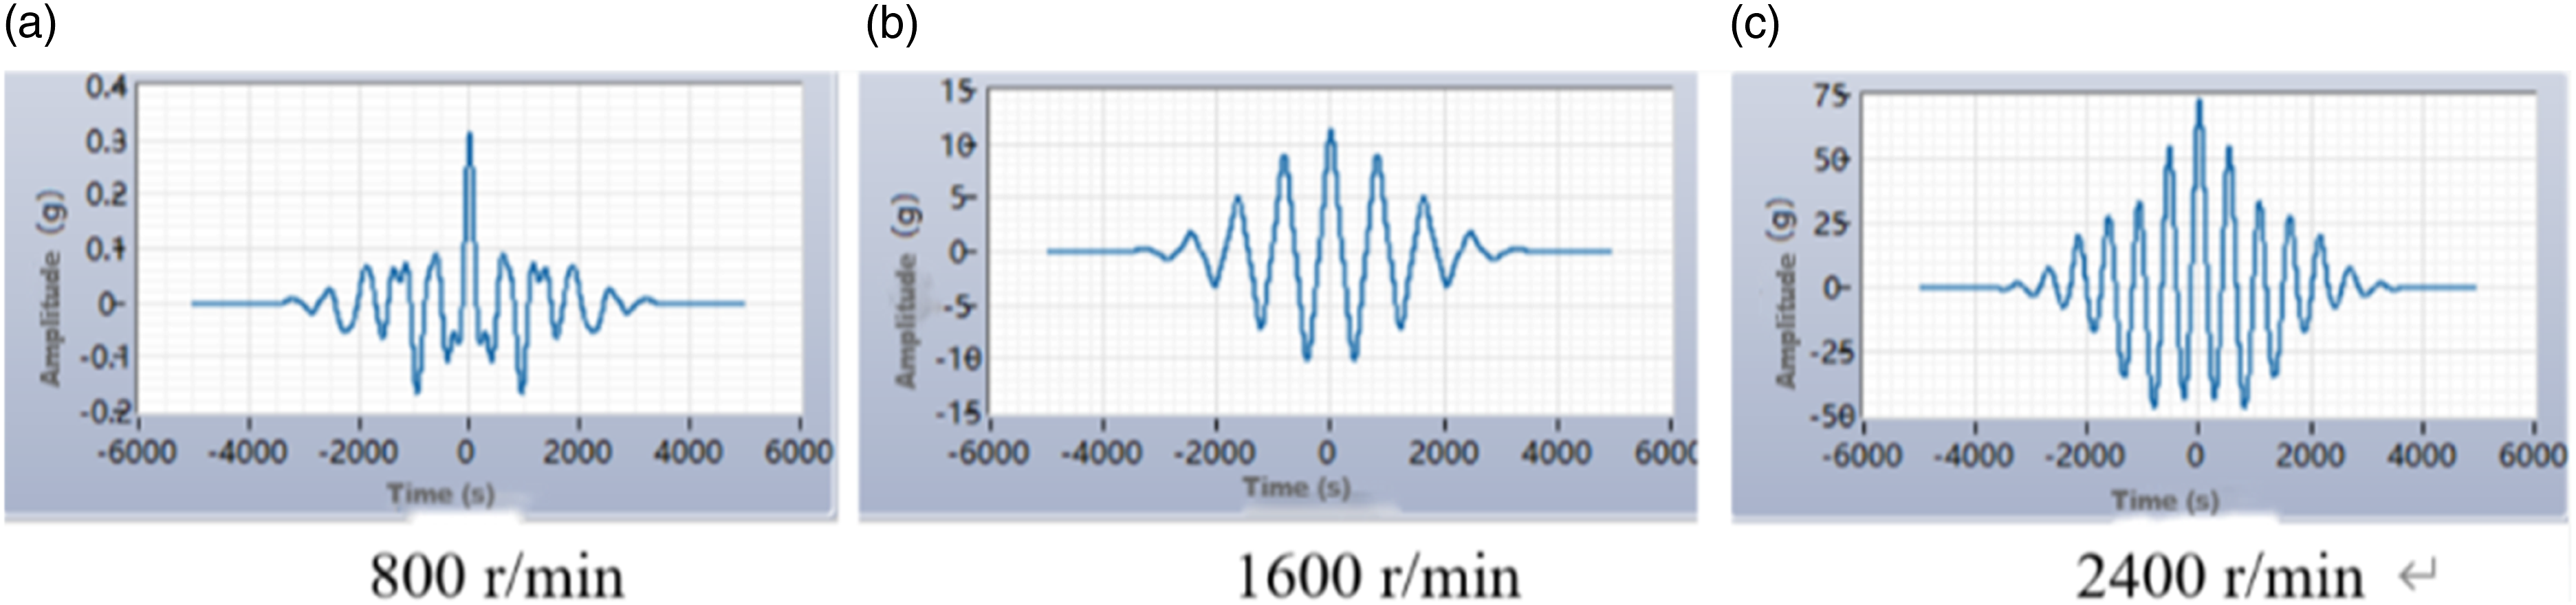
The study at engine speeds of 800 r/min, 1600 r/min, and 2400 r/min, where channel 3 is for cylinder head cover detection, showed that the data collected from channel 3 subjected to autocorrelation analysis and EMD for vibration signals at different speeds yielded the following results:
From Figures 23 and 24, the three IMF components decomposed by EMD match the periodic signals at 800 r/min, without any other noise cycles. Thus, this test indicates that there were no fault waves in the engine, proving the signals’ authenticity and accuracy. Autocorrelation analysis of cylinder head cover vibration signals under different conditions. EMD analysis of cylinder head cover vibration signal at 800 r/min.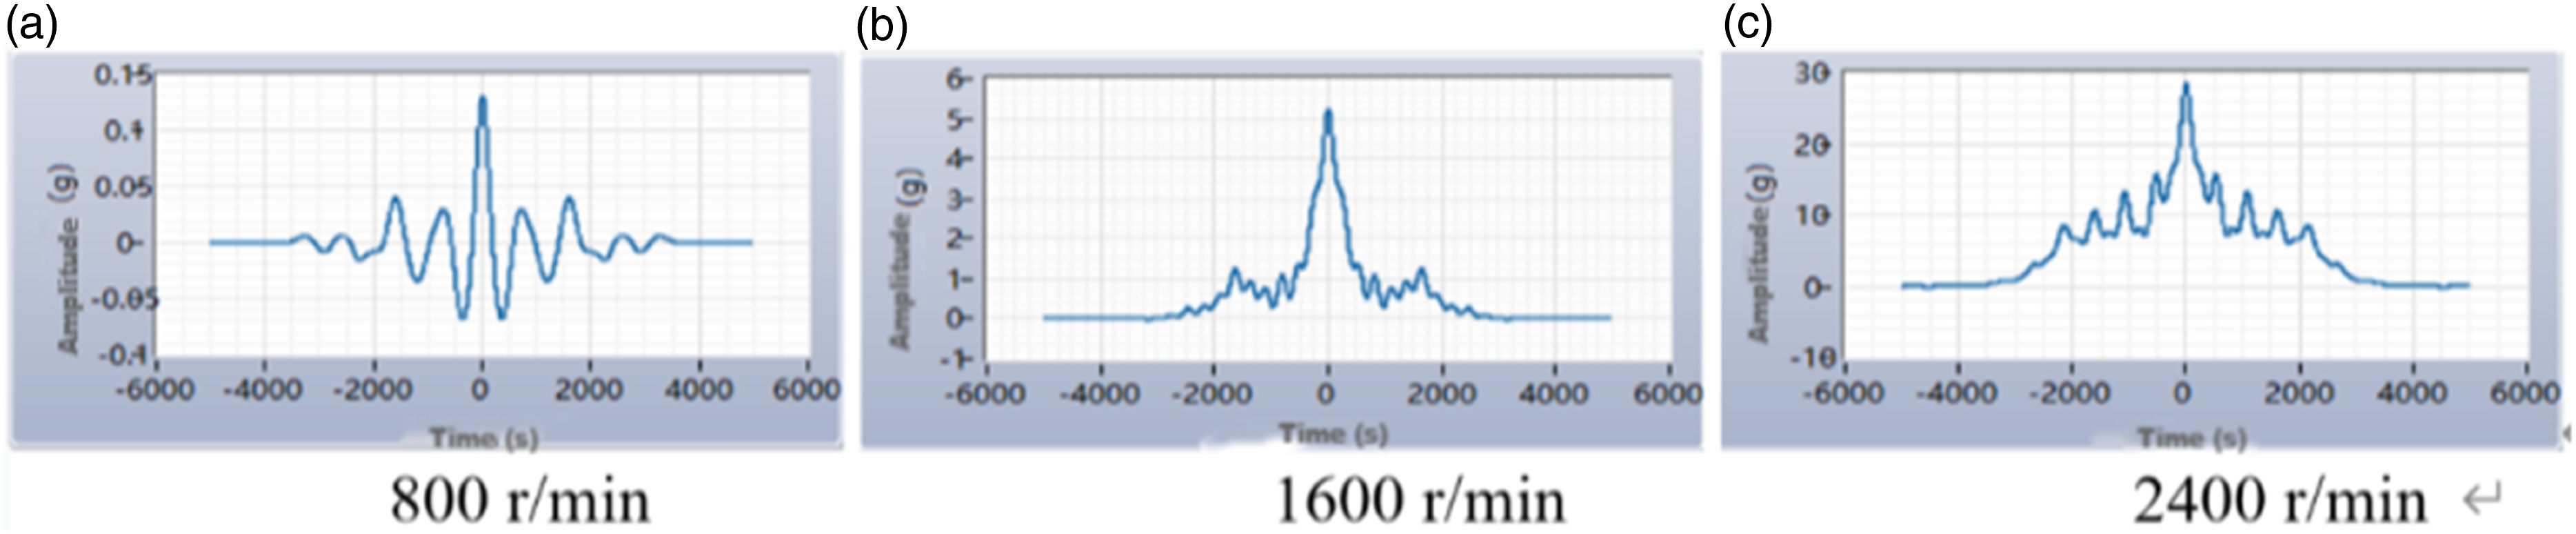
In conclusion, the EMD analysis and autocorrelation tests reveal no fault waves in the tested components, proving the components are normal. This test is significant and provides a basis for future component vibration and noise analysis, offering a diagnostic analysis for component fault exclusion and enhancing the accuracy of future vibration and noise analyses.
Conclusion
This paper utilizes the theories of EMD and autocorrelation algorithms based on LabVIEW programming for the test system to conduct fault diagnosis experiments on the oil pan, generator, and cylinder head cover. The specific results are as follows: the autocorrelation signal analysis of periodic signals and EMD component signals at 800 r/min for the oil pan, generator, and cylinder head cover show no noise, proving the absence of fault waves in the components. This study applies the EMD algorithm to decompose the collected vibration signals across different time scales, thus decomposing a complex original vibration signal into multiple high-frequency intrinsic mode functions with different characteristic frequencies. Time-domain analysis involves obtaining the vibration signal’s change over time curve, which contains information about the vibration of the object. Researchers can use the vibration signals to monitor the operating state of rotating mechanical parts, thereby analyzing rough mechanical faults in internal combustion engines and other machinery. The innovative aspect of this paper is the combination of these methods to determine the presence of noise, aiming for better fault exclusion.
Statements and declarations
Footnotes
Conflicting interest
The author(s) declared no potential conflicts of interest with respect to the research, authorship, and/or publication of this article.
Funding
The author(s) disclosed receipt of the following financial support for the research, authorship, and/or publication of this article: This work was supported by the Hubei Provincial Department of Education Science and Technology Project (Project Number: B20111810), focusing on the project titled “Optimization Design of Piston Profile for EQ6102 Diesel Engine.”