
Abstract
Traditional online advertising evaluation indicators (e.g., click-through rate and conversion rate) are characterized by limitations in scope and delayed feedback, rendering them inadequate for real-time and comprehensive evaluation. The existing models have insufficient accuracy when fusing multiple features. Therefore, the research proposes an evaluation framework that integrates multimodal features (MF) with attribute integration for user classification and constructs a cascading model based on MF and timing features (TC). The classification of user types is achieved through the attribute integration method, which utilizes multi-source data, including cognitive styles and emotional states. Quantification of features is facilitated by employing membership functions. The cascade model involves combining Markov chains and the PrefixSpan algorithm to mine temporal patterns. The results showed that when the user type was 2, the cluster center distances were (1.3, 0.9), and the type differences were significant. Under the activation of ReLU, the Auc of the cascade model was 0.803 and the logloss was 0.45. Under tanh activation, Auc = 0.795 and logloss = 0.452. The evaluation accuracy rate of the cascade model from 18:00 to 22:00 can reach up to 0.99 at most. The studies show that this method improves the evaluation accuracy and provides technical references for the industry.
Introduction
In the Internet Age, the way of human life has been constantly affected and changed. 1 As a propaganda medium and marketing channel in the information age, the Internet is a carrier and pathogen transmission of information. 2 As information technology has become more popular and developed, the commercial value of networks has constantly increased. Advertising practitioners have also focused their attention on networks, leading to the creation of online advertising. Online advertising delivery platform publishes or publishes advertisements on the Internet through advertising banners, text links, multimedia, and other methods on website. 3 Compared with four traditional media (newspapers, magazines, television, and radio) advertising, online advertising has unique advantages and is a implementation of modern marketing media strategy. 4 Online marketing method can be understood as the specific form of expression of online advertising, not limited to various specifications of banner ads placed on the web page. Email ads etc. can be understood as online advertising’s expression form. The competition between advertisers is deepening, and the scale of online advertising market is expanding. In 2004, the revenue of online advertising in the United States reached 9.6 billion US dollars. 5 With the development of online advertising, many problems have arisen, such as the lack of effective evaluation criteria for online advertising, which will also limit online advertising developing. Its effect evaluation can objectively evaluate the early stage advertising and guide the design of late stage online advertising. 6 Therefore, the research proposes a design of online advertising effect evaluation integrating multimedia feature (MF) and user classification. It is hoped to improve the real-time and accuracy of online advertising effect evaluation and promote the online advertising industry development. This research contains four parts. The first is the summary of the research on MF and user classification. Next is the evaluation design of online advertising effect integrating MF and user classification. Then it is a simulation and analysis of online advertising design evaluation integrating MF and user classification. The fourth part is the summary of entire research.
Related works
Multimodal refers to information in multiple modalities, including text, images, videos, and audio. As the name suggests, multimodal research focuses on the fusion of these different types of data. Wang et al. proposed an MF based effective memory model for online advertising. By analyzing the relevance of ads and links in different search results, this study used eye movement characteristics to evaluate the impact of relevance on online advertising attention. This method had a good memory effect on online advertising. 7 Zhang et al. proposed a supervised video summarization method based on key frames, which used MF fusion and bidirectional long short-term memory (LSTM) network to achieve video summarization and summary. Experimental results on TVSum and SumMe datasets showed that the method performed well. 8 These existing methods cannot measure different features’ contribution effectively. In response, Tang et al. proposed a motional recognizing method on the foundation of RGB D image features. RGB-D sensors were used to extract human motion features, and multiple K-nearest neighbor classifiers were used to achieve integrated decision classification. This algorithm achieved ideal recognition results on two datasets. 9 Singh et al. proposed a multimodal biometric recognition system that utilized a combination of two or more biometric recognition methods to achieve facial detection and recognition of physiological features of fingerprints. The accuracy of this method was accused at 95%. 10 Yi et al. proposed an intelligent extraction method of rock discontinuity based on multimodal semantic features and full convolutional neural network (CNN). In this experiment, a dense point cloud model of rock mass surface was generated using multi perspective images and 3D geological semantic feature expression. Moreover, the mapping relationship between multimodal semantic features was established. Compared with the traditional field measurement results, this method had completeness and accuracy. 11 Jaafar and Lachiri proposed a method based on four multimodal fusion for detecting multiple data attacks from different sources and forms. The experiment utilized audio, video, text modality, and deep learning information to detect attacks in surveillance. The un-weighted average accuracy of this method was 85.66%, and the weighted one was 86.35%. 12
User classification is the classification of target groups into different categories based on a certain level. Xu et al. proposed a dynamic SOM fuzzy clustering algorithm for mixed attributes. Self-organizing feature mapping was used to achieve preliminary clustering. Moreover, an improved dynamic fuzzy K-prototype clustering method was combined to achieve user dynamic classification. Experiments on UCI dataset indicated that this algorithm was effective. 13 Zhang and Bors proposed a Twitter user classification method for the public health field. Manual encoding of samples from Twitter users with different health conditions was combined to extract new features from the user’s Twitter profile. F1 score for the best result of this method on dataset was 0.59, which could only extract a small portion of user features. 14 Zaidi et al. proposed a dynamical selecting method framework, utilizing the most promising classifier in the classifier pool to complete the classification of each touch sample. This method had higher potential and feasibility than the benchmark method. 15 Hu et al. proposed a comprehensive method for the classification of electric vehicle users. Simultaneously, intra group methods were compared with traditional clustering methods and fuzzy c-means methods. This method had better stability. 16 There was a coupling relationship between users and emotions, as well as between users and features. Huang et al. proposed a new IEC model that utilized a CNN based coupling learning model to achieve user feature coupling modeling. Moreover, product and matrix product were used in the experiment to capture user features. These experimental results on real image sets indicated that the coupling method considering user emotions and user features could significantly improve the performance of the IEC model. 17 Karthik and Sethukarasi proposed a new LSTM architecture based on firefly swarm optimization in order to identify the irony in tweets. The firefly swarm algorithm could optimize LSTM’s weighting factors, and so on. Its average accuracy could reach 97.25%. 18
In summary, many experts and researchers have conducted various studies and designs on MF and user classification, but the stability accuracy of these methods and models still needs to be improved. A survey of the extant literature reveals that the majority of user classification methods are predicated on a solitary attribute (e.g., behavioral data or emotional characteristics). These methods often neglect to systematically integrate multi-source heterogeneous data, thereby failing to offer a comprehensive depiction of user behavior. Multimodal feature fusion models often adopt static stitching methods and lack dynamic modeling of feature interaction relationships. The mining of temporal features has not fully combined the temporal context rules of users’ click behaviors either. Therefore, the research proposes the design of online advertising effect evaluation integrating MF and user classification. It is hoped to improve the accuracy of online advertising effect evaluation and escort the healthy development of online advertising. Compared with existing studies, this research is innovative in that it proposes a user classification method based on attribute integration to achieve collaborative modeling of multidimensional features. A cascade evaluation model integrating multimodal and timed features is constructed to improve the interactive representation of features. Combined with temporal pattern mining and dynamic scene adaptation, it provides a more comprehensive technical framework for online advertisement effectiveness evaluation.
D esign of online advertising effect evaluation integrating MF and user classification
This chapter uses MF and user classification to evaluate and design online advertising effect. The first section of this chapter is the evaluation criteria of online advertising and the classification design of user types based on attribute integration. The second section of this chapter is the design of online advertising effect evaluation module combining MF and timing characteristic (TC).
Online advertising evaluation criteria and user type classification design based on attribute integration
The evaluation indicators of online advertising effect include click, visit, visit cost, and conversion rate. Due to the development of machine learning, data mining, and other technologies, traditional online advertising evaluation indicators have limited application. The feedback is not timely and does not meet operators’ needs. The linear model built by combining user click and browse information cannot meet the requirements of online advertising effect evaluation. 19 Therefore, the advertising evaluation index used in the research is impression space, which is systematically symbolically defined. The subject and object feedback information form impression space, where feedback information is expressed in the form of impression space vectors. Cognitive style and emotional factors can affect subject information. The user’s emotional state is divided into mood state and passion state. Moreover, the description of object feedback information is completed using the subject’s memory of the object.
There are differences in personality characteristics reflected by different users, such as personality, expressiveness, and emotions. Therefore, the study adopts multi-source heterogeneous data collection to achieve data analysis and secondary data utilization. Individual user information includes basic user information, user growth information, and social relationship information. The research uses data such as user awareness characteristics, emotional characteristics, and user behavior as a reference for user classification design.
20
Emotional characteristics are a collective term for a series of subjective cognitive experiences. The study used Bourne depression status chart to collect emotional characteristics in Figure 1. Bourne depression status chart.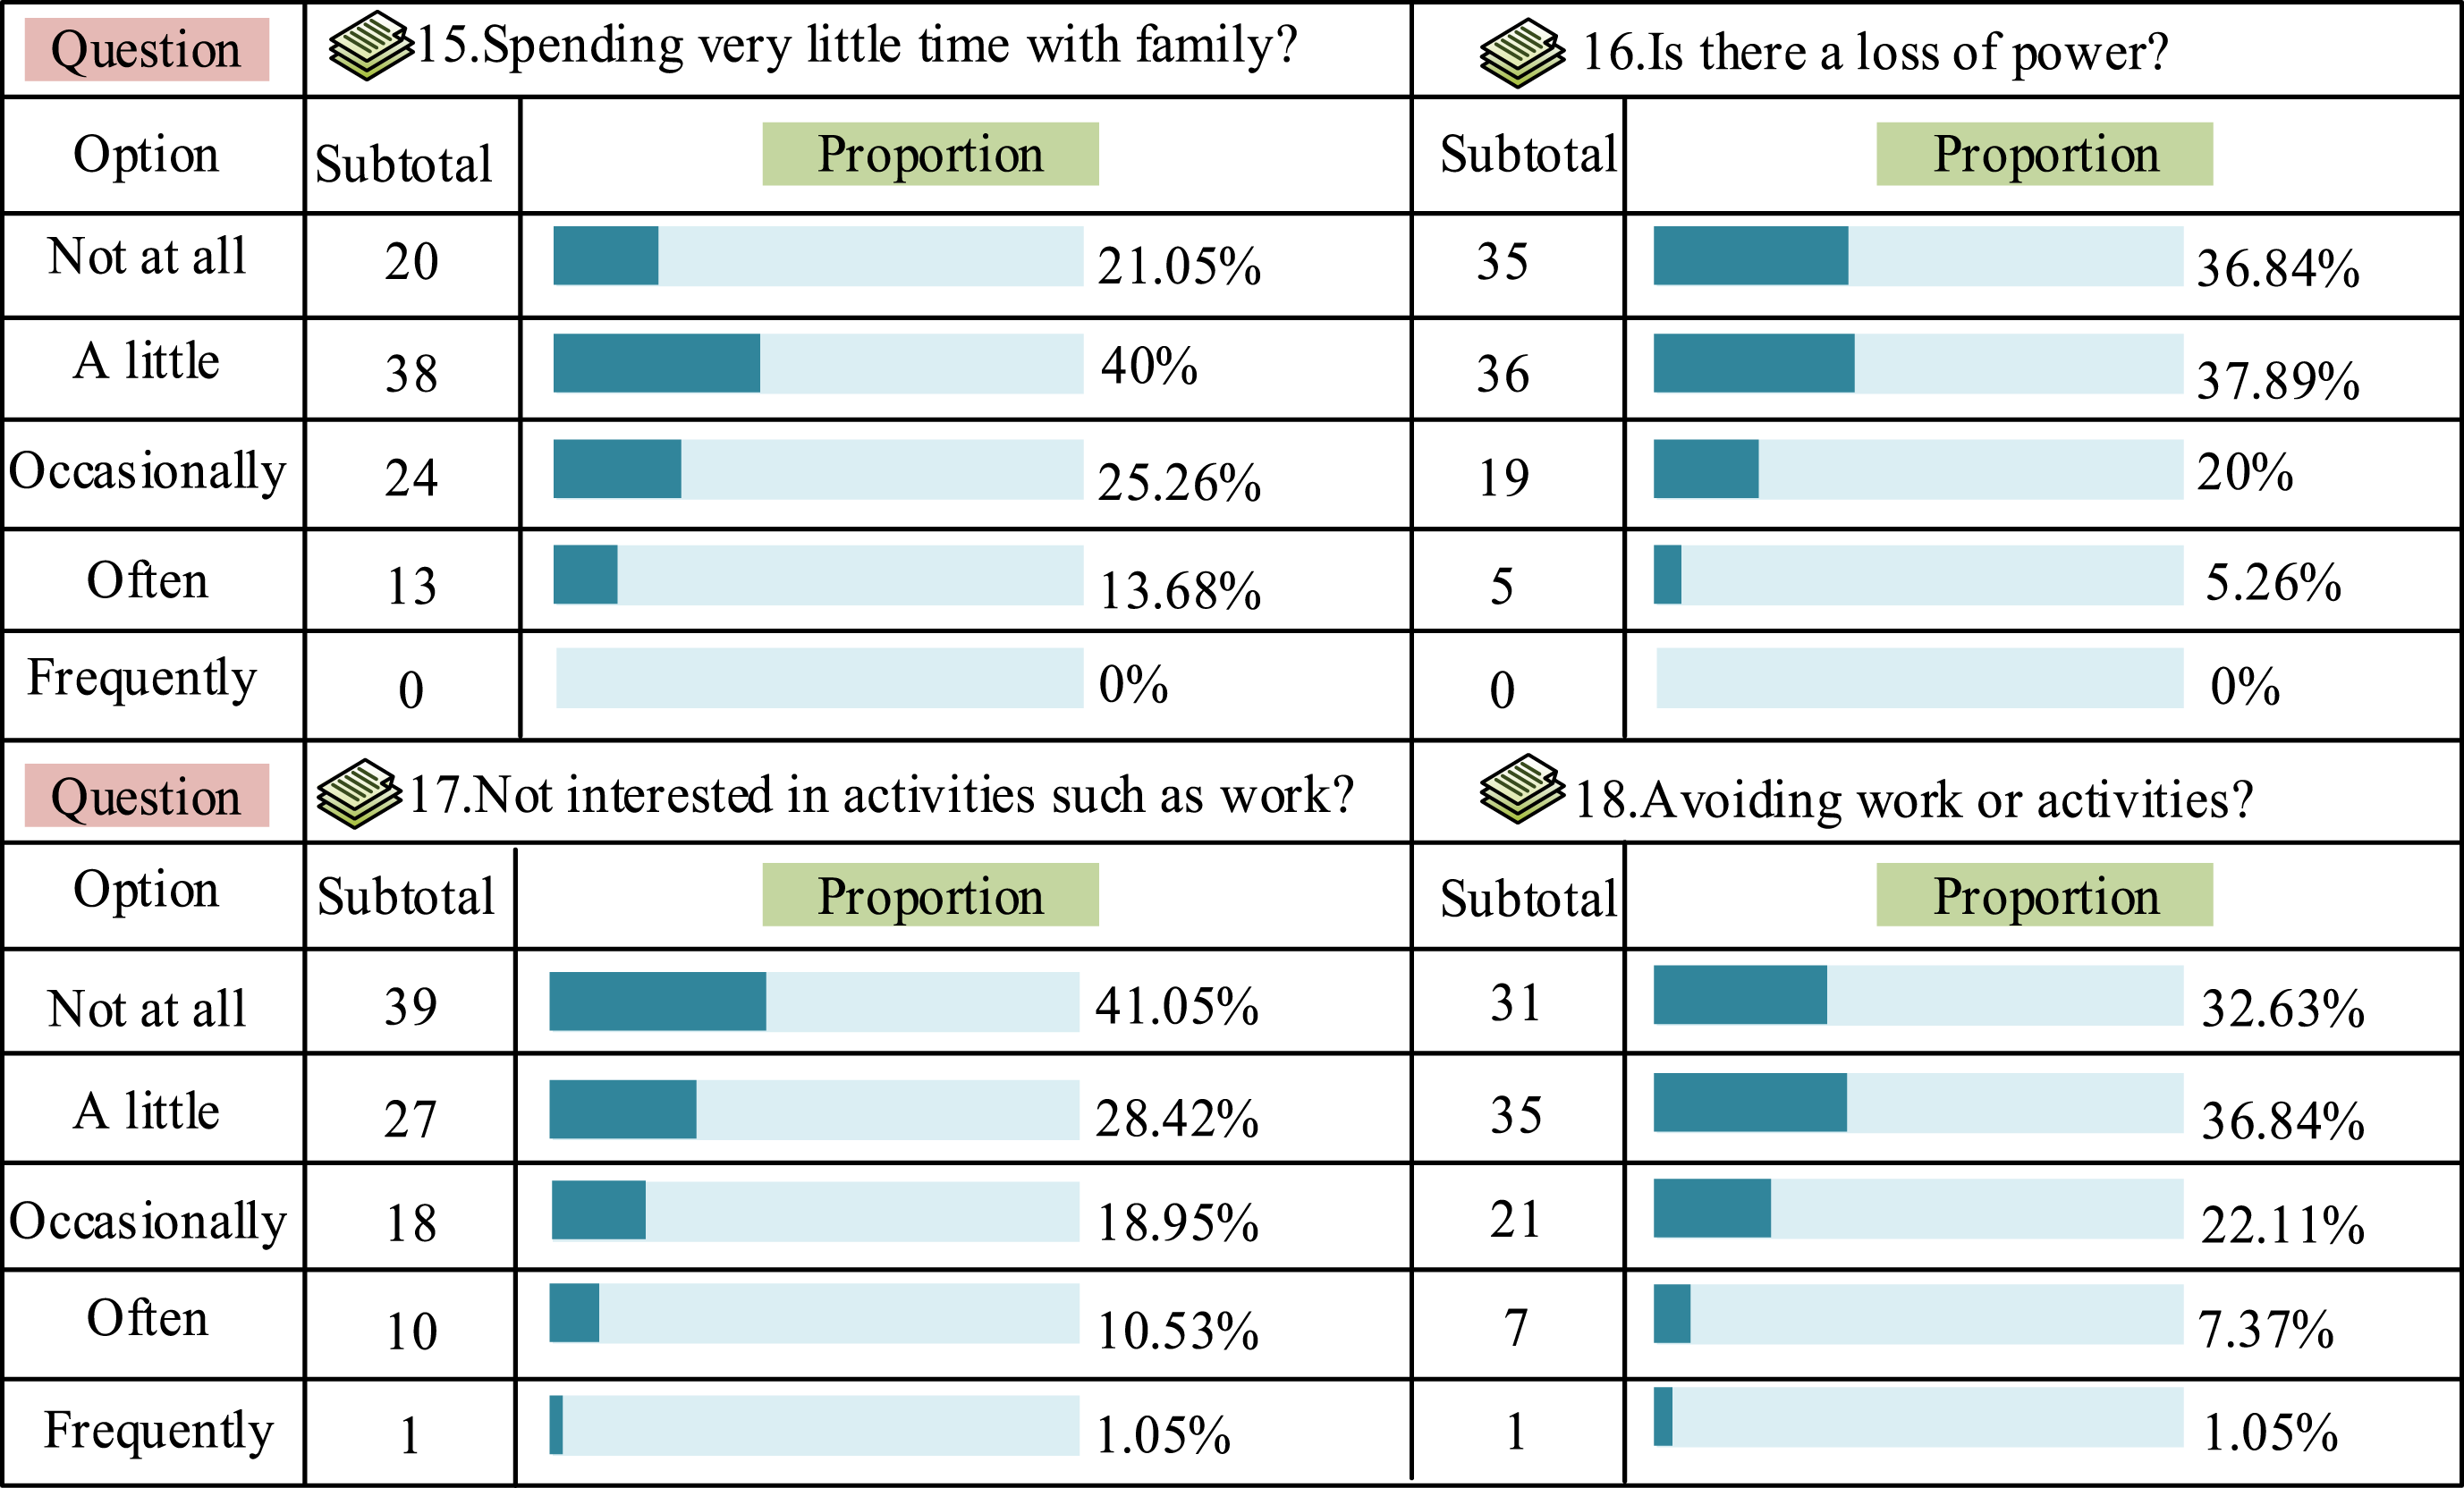
Testers answer each question based on their own situation, while inspectors analyze the emotional state of the testers through a question scale. Consciousness features reflect the user’s subjective initiative, including original consciousness and explicit consciousness, and the quantification of consciousness features is achieved through cognitive style. The collection of cognitive style tests is achieved through Witkin embedded graphics. Testers choose graphic options that are similar to known graphics, and inspectors also analyze the testers’ consciousness state based on the question scale. User clicks and browsing records belong to user behavior, reflecting their psychological activities and development patterns. The study selects user heatmaps to complete user behavior analysis, where the user’s favorite areas and locations are highlighted in a special form. The collected user feature data cannot be directly divided into user types. Therefore, a membership function is used to quantify the feature data. At the same time, the experiment combines binomial distribution, Exponential distribution, uniform distribution, and other common distributions to find common characteristics of users, hoping to reduce the workload.
Cognitive characteristics (such as Witkin test scores) follow a normal distribution because human cognitive abilities usually present a bell-shaped distribution. Emotional characteristics, such as Beck Depression Scale scores, follow a skewed distribution. There is a higher proportion of samples with mild depression, and the tail corresponds to severe depression. The behavioral characteristics (such as the click interval time) conform to the exponential distribution because the user’s click behavior has no memory, which conforms to the Markov characteristics. The normality of cognitive characteristics is verified by the Shapiro–Wilk test (p = 0.12>0.05, accepting the null hypothesis). The index distribution fitting of behavioral characteristics is verified by the Kolmogorov–Smirnov test (p = 0.08>0.05) to ensure the rationality of the distribution hypothesis.
The joint decision-making of attributes realizes the division of user types. Moreover, each user attribute provides corresponding attribute contribution values, reflecting the degree of contribution of user types to the classification results.
21
The study uses multiple integrated attribute joint decision-making to achieve user type division. Figure 2 shows the user type division based on attribute integration. User type classification based on attribute integration.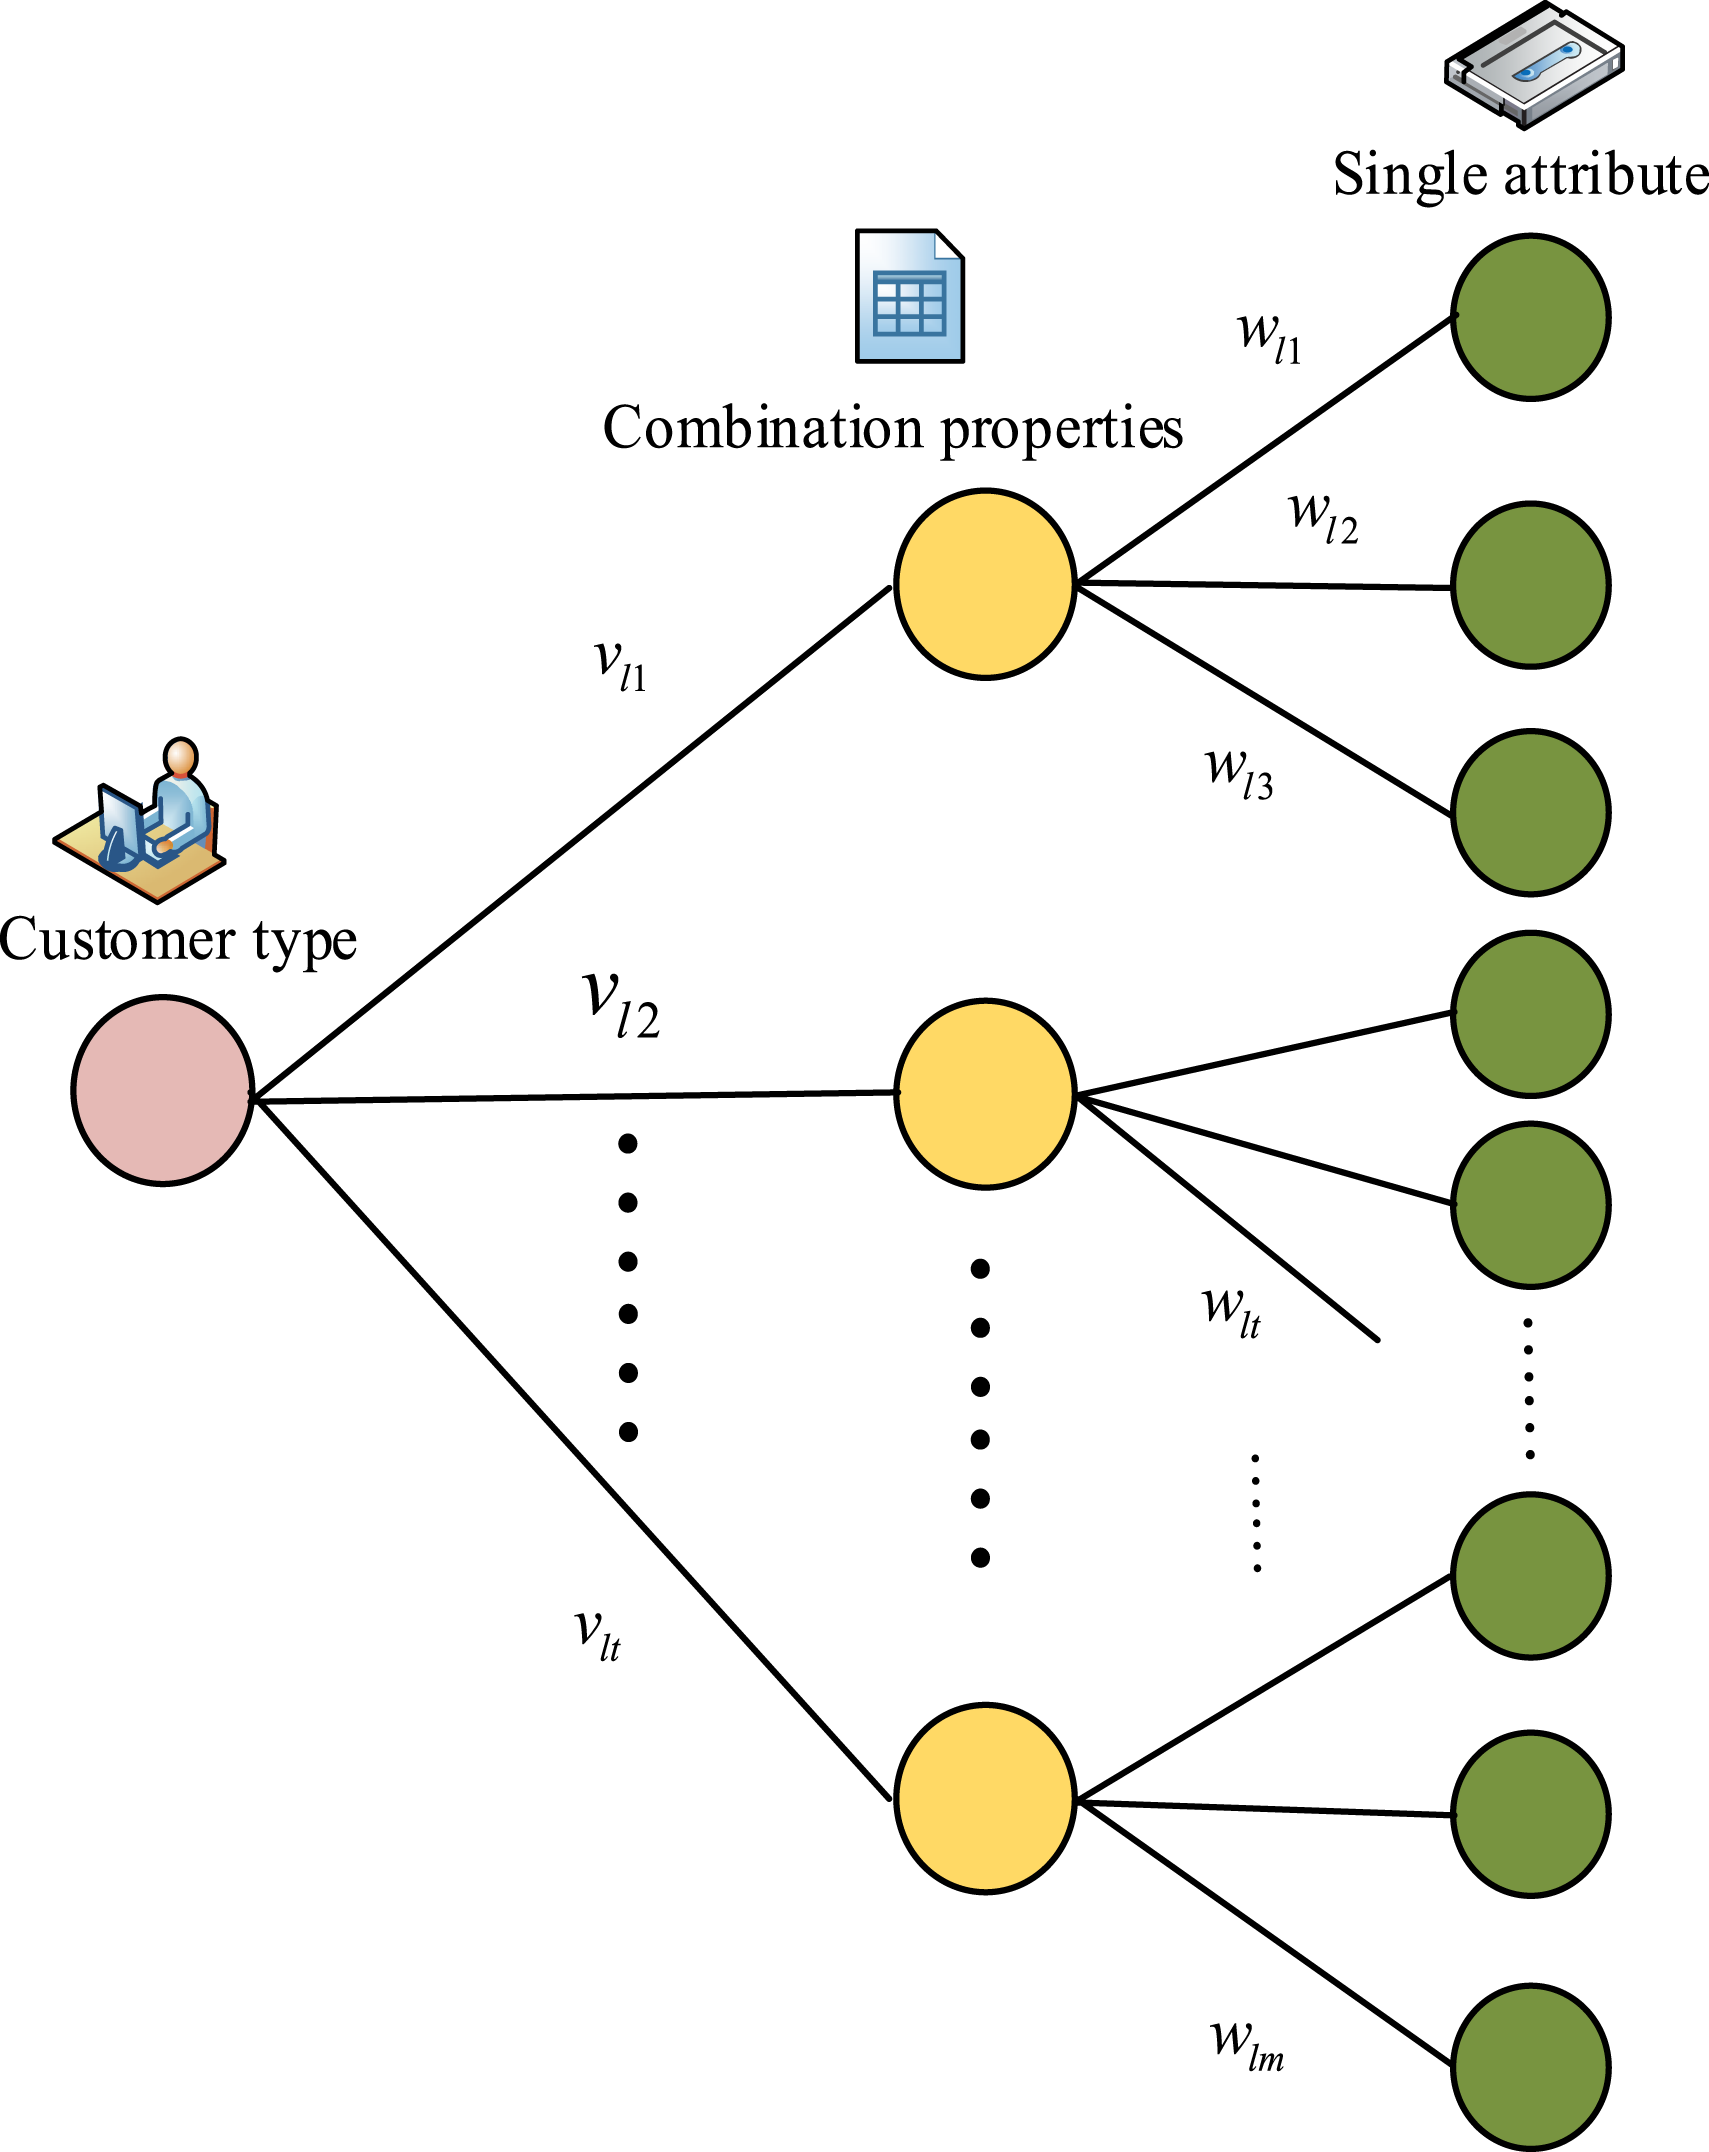
User attributes include single attribute and integrated attribute, which can affect the result of user type classification. Single attribute contribution is the first level contribution
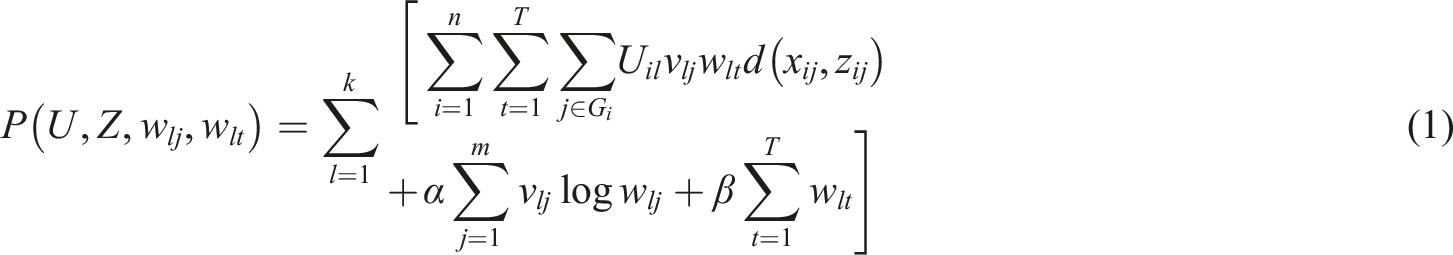
In equation (1),
Design of online advertising effect evaluation module combining MF and TC
The research selects classic deep learning architecture to build a cascade model based on MF and TC to achieve click-through rate estimation. Figure 3 shows a cascaded model based on MF and TC. Cascading model based on multimodal and temporal features.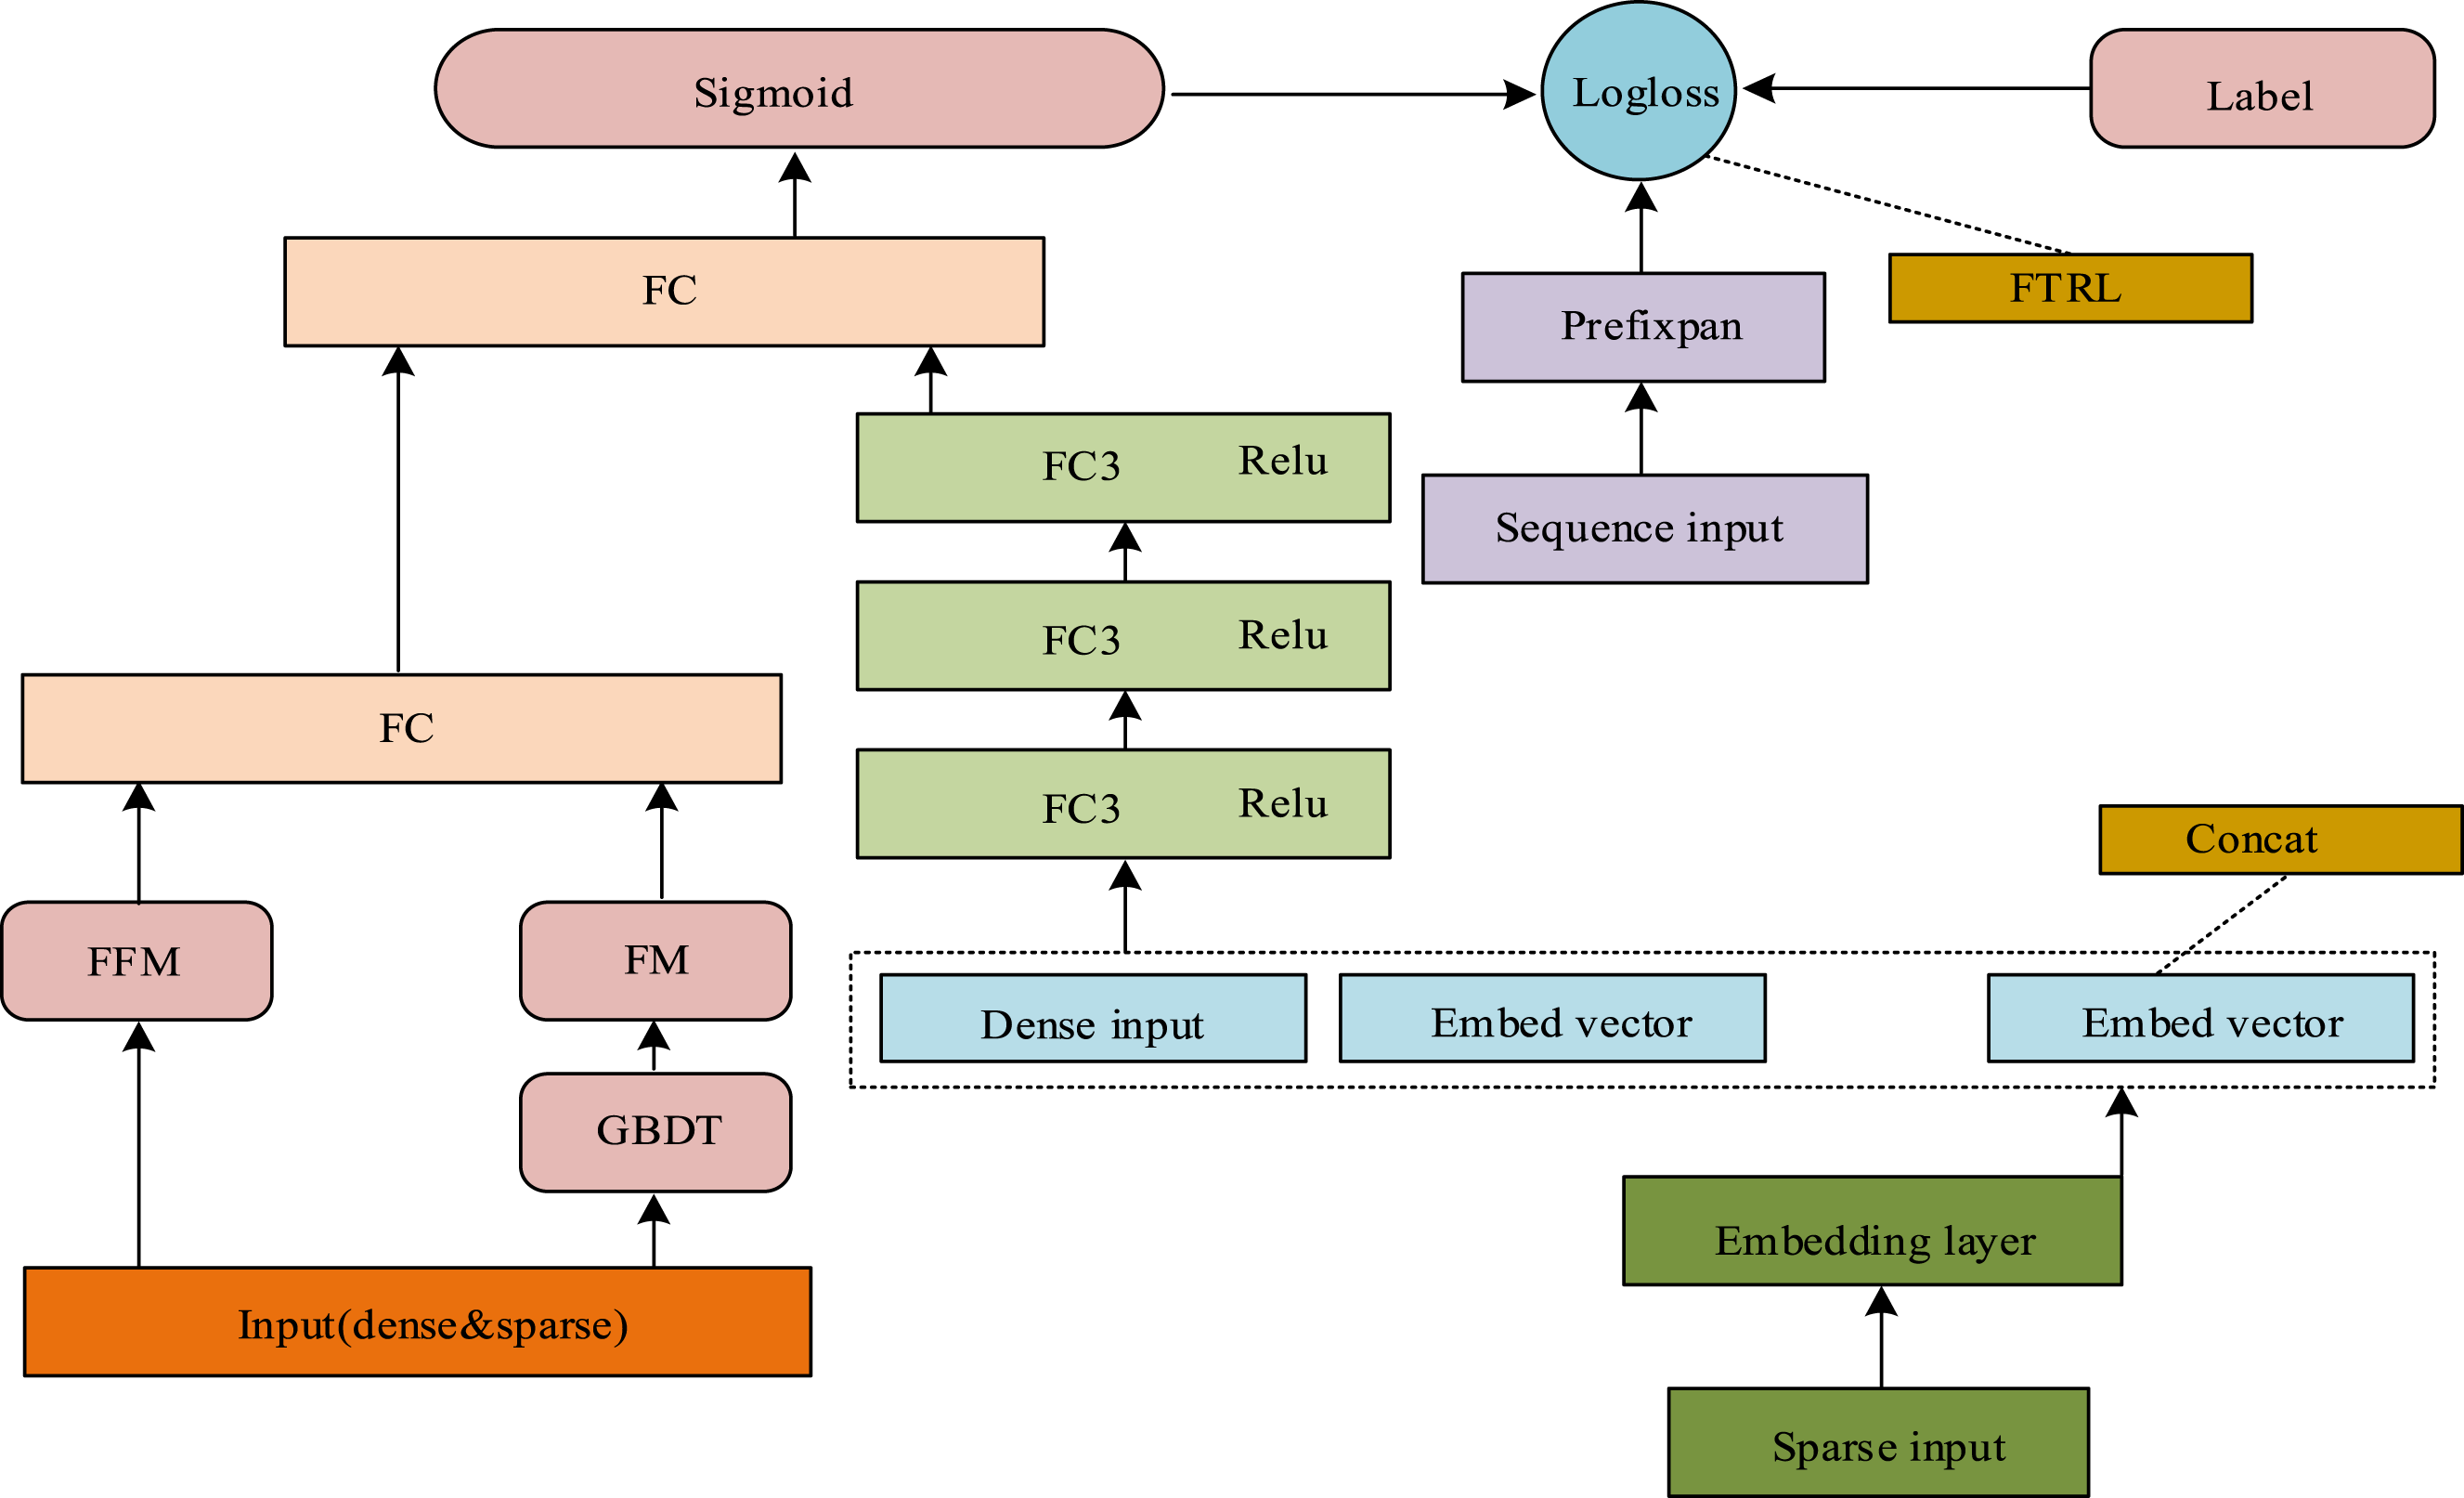
Three components of the cascade model based on MF and TC are respectively gradient boosting decision tree (GBDT) module, factorization machine (FM) module, and field factorization machines (FMM) module. These three modules are not independent of each other. The cascade model uses a three-layer architecture consisting of “feature generation, interaction modeling, and time series enhancement” to integrate implementation methods. The GBDT module automatically generates high-order nonlinear features. Its tree-structure output, such as leaf-node indexes, is used directly as input for the FM module, replacing traditional manual feature engineering. The FM module captures second-order feature interactions. Its latent vector representation is concatenated with the GBDT features, which are then input into the FFM module. The FFM module introduces the concept of “domains,” such as the user and advertising domains. It enhances feature expression by interacting with latent vectors in different domains and simultaneously performs time series weighting on the model output. This is done by combining time series patterns mined by the PrefixSpan algorithm, such as high-click sequences at night. The data flow path is as follows: original features →GBDT feature engineering →FM low-order interaction →FFM high-order domain interaction →time series pattern fusion →Click probability prediction.
In the Cascade Model, the PrefixSpan algorithm mines temporal patterns in users’ click behavior. It efficiently extracts frequent click sequences using prefix projection technology and avoids the problem of an exploding candidate set, which is common in the traditional Apriori algorithm. The active period of users is identified by combining the timestamp information, providing a sequence pattern basis for TC modeling. This module is located in the temporal feature input layer of the cascading model. It works with the Markov chain model to create a representation of the temporal context of the user’s click behavior.
Follow-regularized-leader (FTRL) algorithm is applied to the parameter update stage of the FM and FFM modules. In scenarios involving large amounts of sparse advertising data, the model’s ability to fit and generalize is balanced through the regularization mechanism. Meanwhile, the model can respond to real-time updates in advertising placement to ensure evaluation accuracy in dynamic scenes. This module is embedded in the model training process, forming a “feature-parameter” collaborative optimization closed loop with the GBDT feature generation process.
Users’ clicks on the network are motivated and targeted. The research uses Markov chain model and transition probability to complete information mining and click sequence construction. As a partially observable random event, user clicks are represented by Potential sequence assumptions for observing sequences.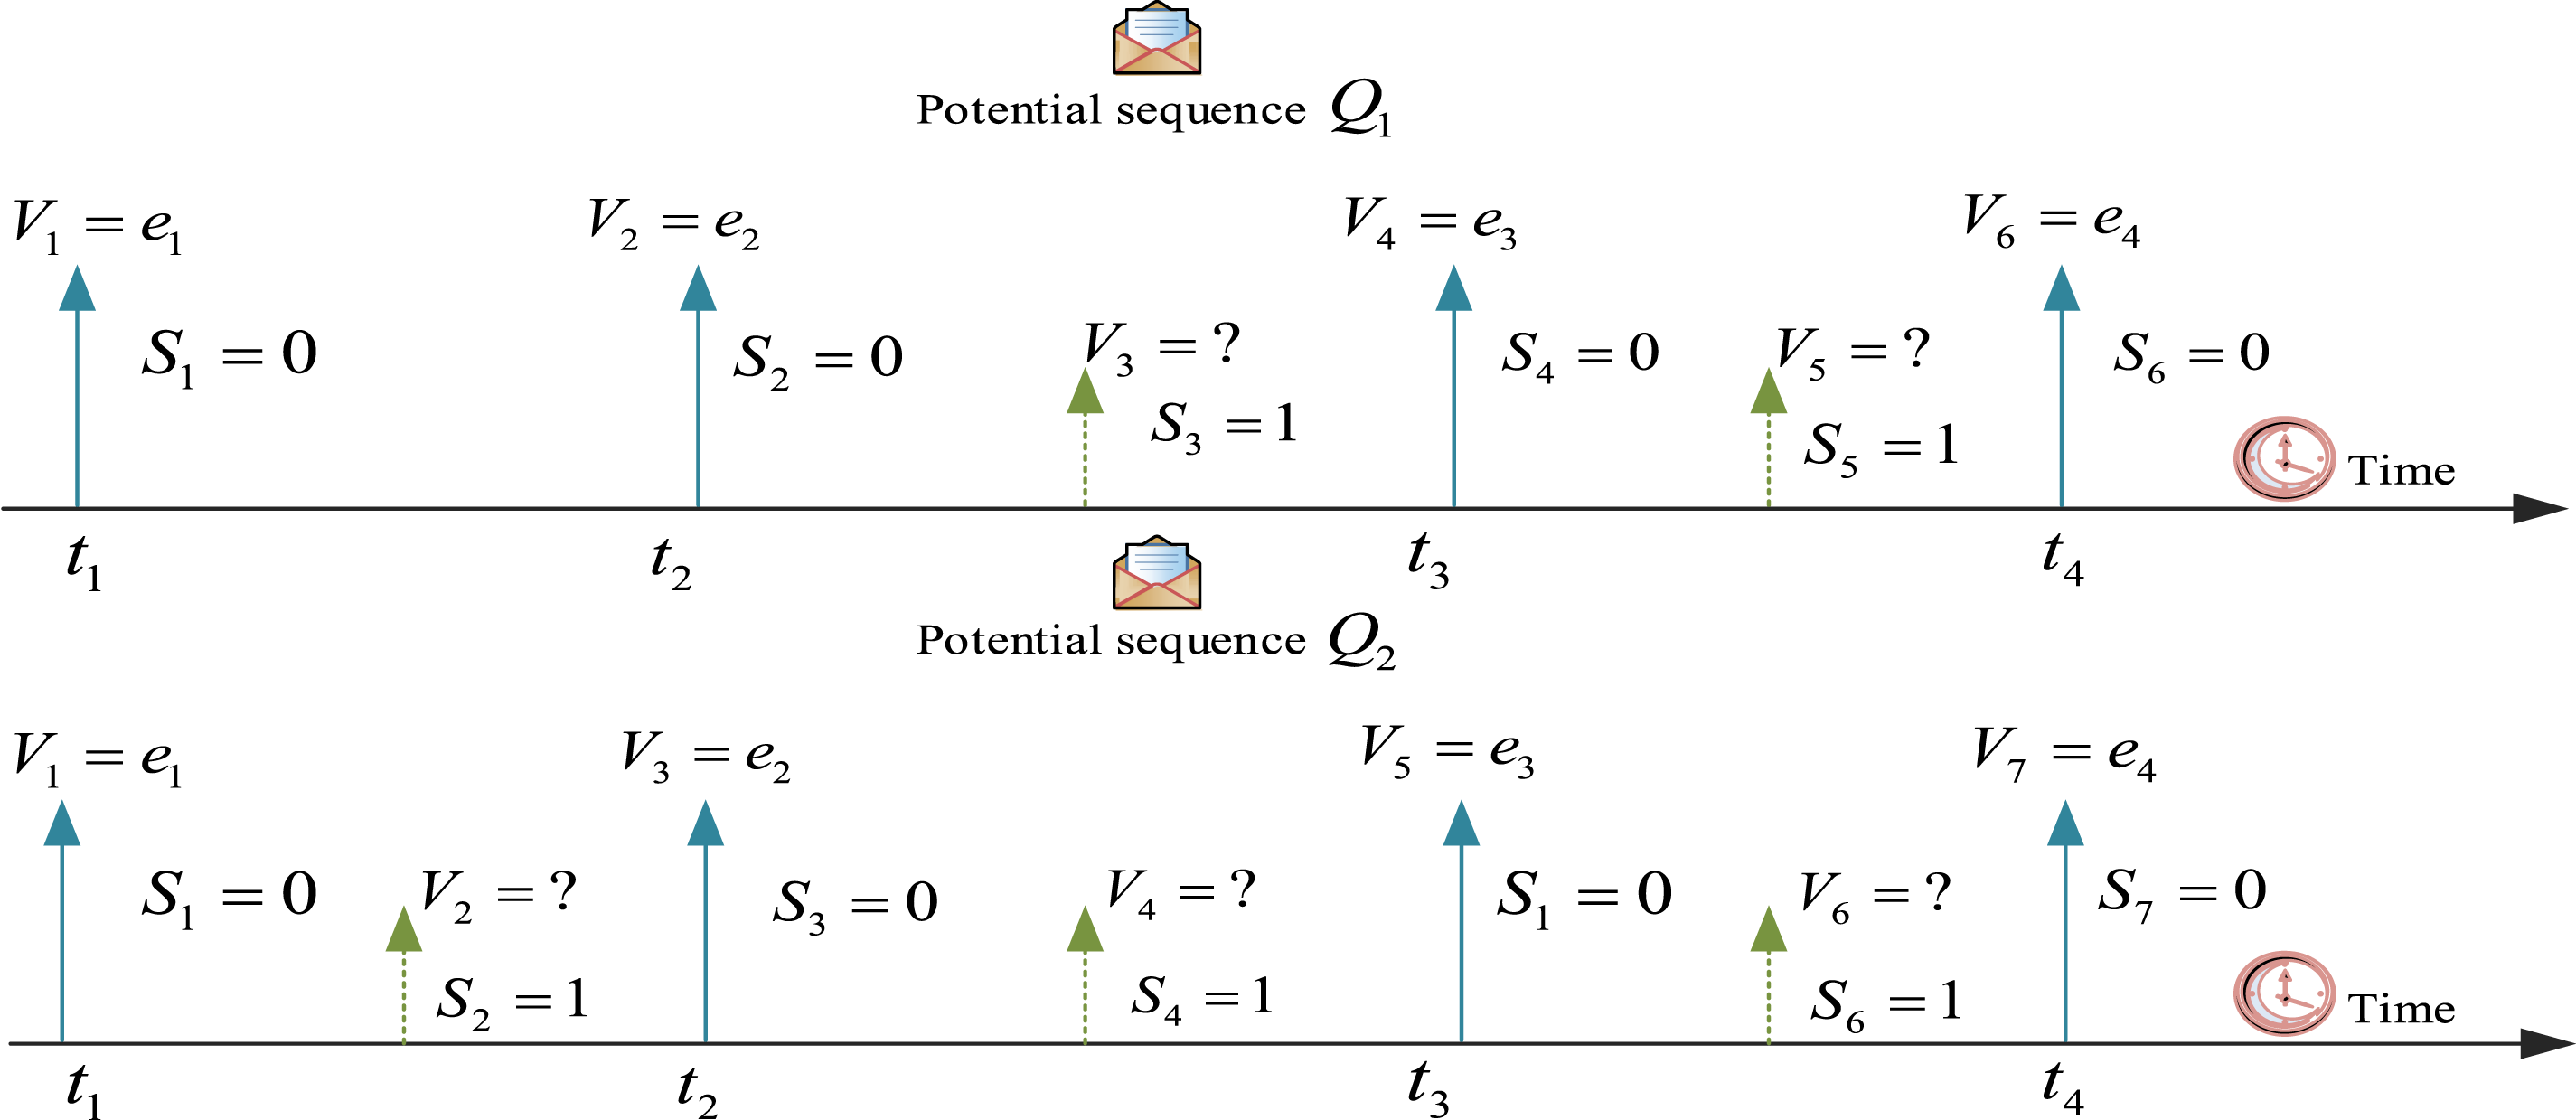
The dashed line represents unobservable user click behavior, the

When the Markov chain model is applied to the analysis of click sequences, it is based on three core assumptions: ① The user’s click behavior satisfies the first-order Markov property. In other words, the current click state depends only on the previous state, not on any earlier history. ② Unobserved click behaviors can be regarded as hidden states, and their distribution can be inferred through observable sequences. ③ The probability of a state transition exhibits temporal stationarity, meaning the transition patterns remain consistent across different time periods. Equation (3) is based on the properties of Markov chains. It weights the user’s click sequence using state transition probabilities to depict the probability distribution of different click paths. Equation (4) establishes an objective function for maximum likelihood estimation based on this. It transforms the model parameter optimization problem into maximizing the probability of observable sequences. Equation (5) introduces an iterative optimization mechanism and gradually updates the model parameters through the EM algorithm to solve the problem of parameter estimation in the hidden state. The three form a complete derivation system through the logical chain of “sequence modeling-parameter estimation-iterative optimization,” achieving a closed loop from the observation of click sequences to the solution of model parameters. Equation (3) is the formula obtained by weighting each click sequence using Markov chains.

In equation (3), the predictable events that users click on are represented by

In equation (4), the observable sequence is

The Gibb inequality condition is used for transformation, and the Viterbi accelerated approximation algorithm is used to optimize the model. Each time node’s numerical value and unique structure are the characteristics of time series, and user specific behavior patterns can be mined through frequent sequence patterns. The research adopts PrefixSpan algorithm based on temporal information to mine frequent sequence patterns. The TC before and after users click on advertisements need to be combined with temporal sequences and association rules between clicks on advertisements to complete the search. PrefixSpan algorithm has a smaller projection dataset and less memory consumption because it will not produce candidating sequences during its operation. The working time of frequent sequence pattern mining will shorten with the reduction of the projection set. The fixed length sequence obtained from the scanned data set is projected as a prefix to multiple local projection sets. Then the recursive method is used to complete the design of the intra set sequence pattern mining algorithm. The sequence processed by PrefixSpan algorithm is a complete information flow. Assuming that each observation attribute is
The traditional feature processing method is complex to operate and consumes a lot of resources. Therefore, the research uses GBDT feature processing method and Ensemble learning to complete the establishment of the nonlinear model. In each iteration process, the new decision tree is established in the direction of the residual gradient reduction, and the path of the decision tree can be directly input into different models to simplify the feature processing process. Figure 5 shows GBDT algorithm model. GBDT algorithm model.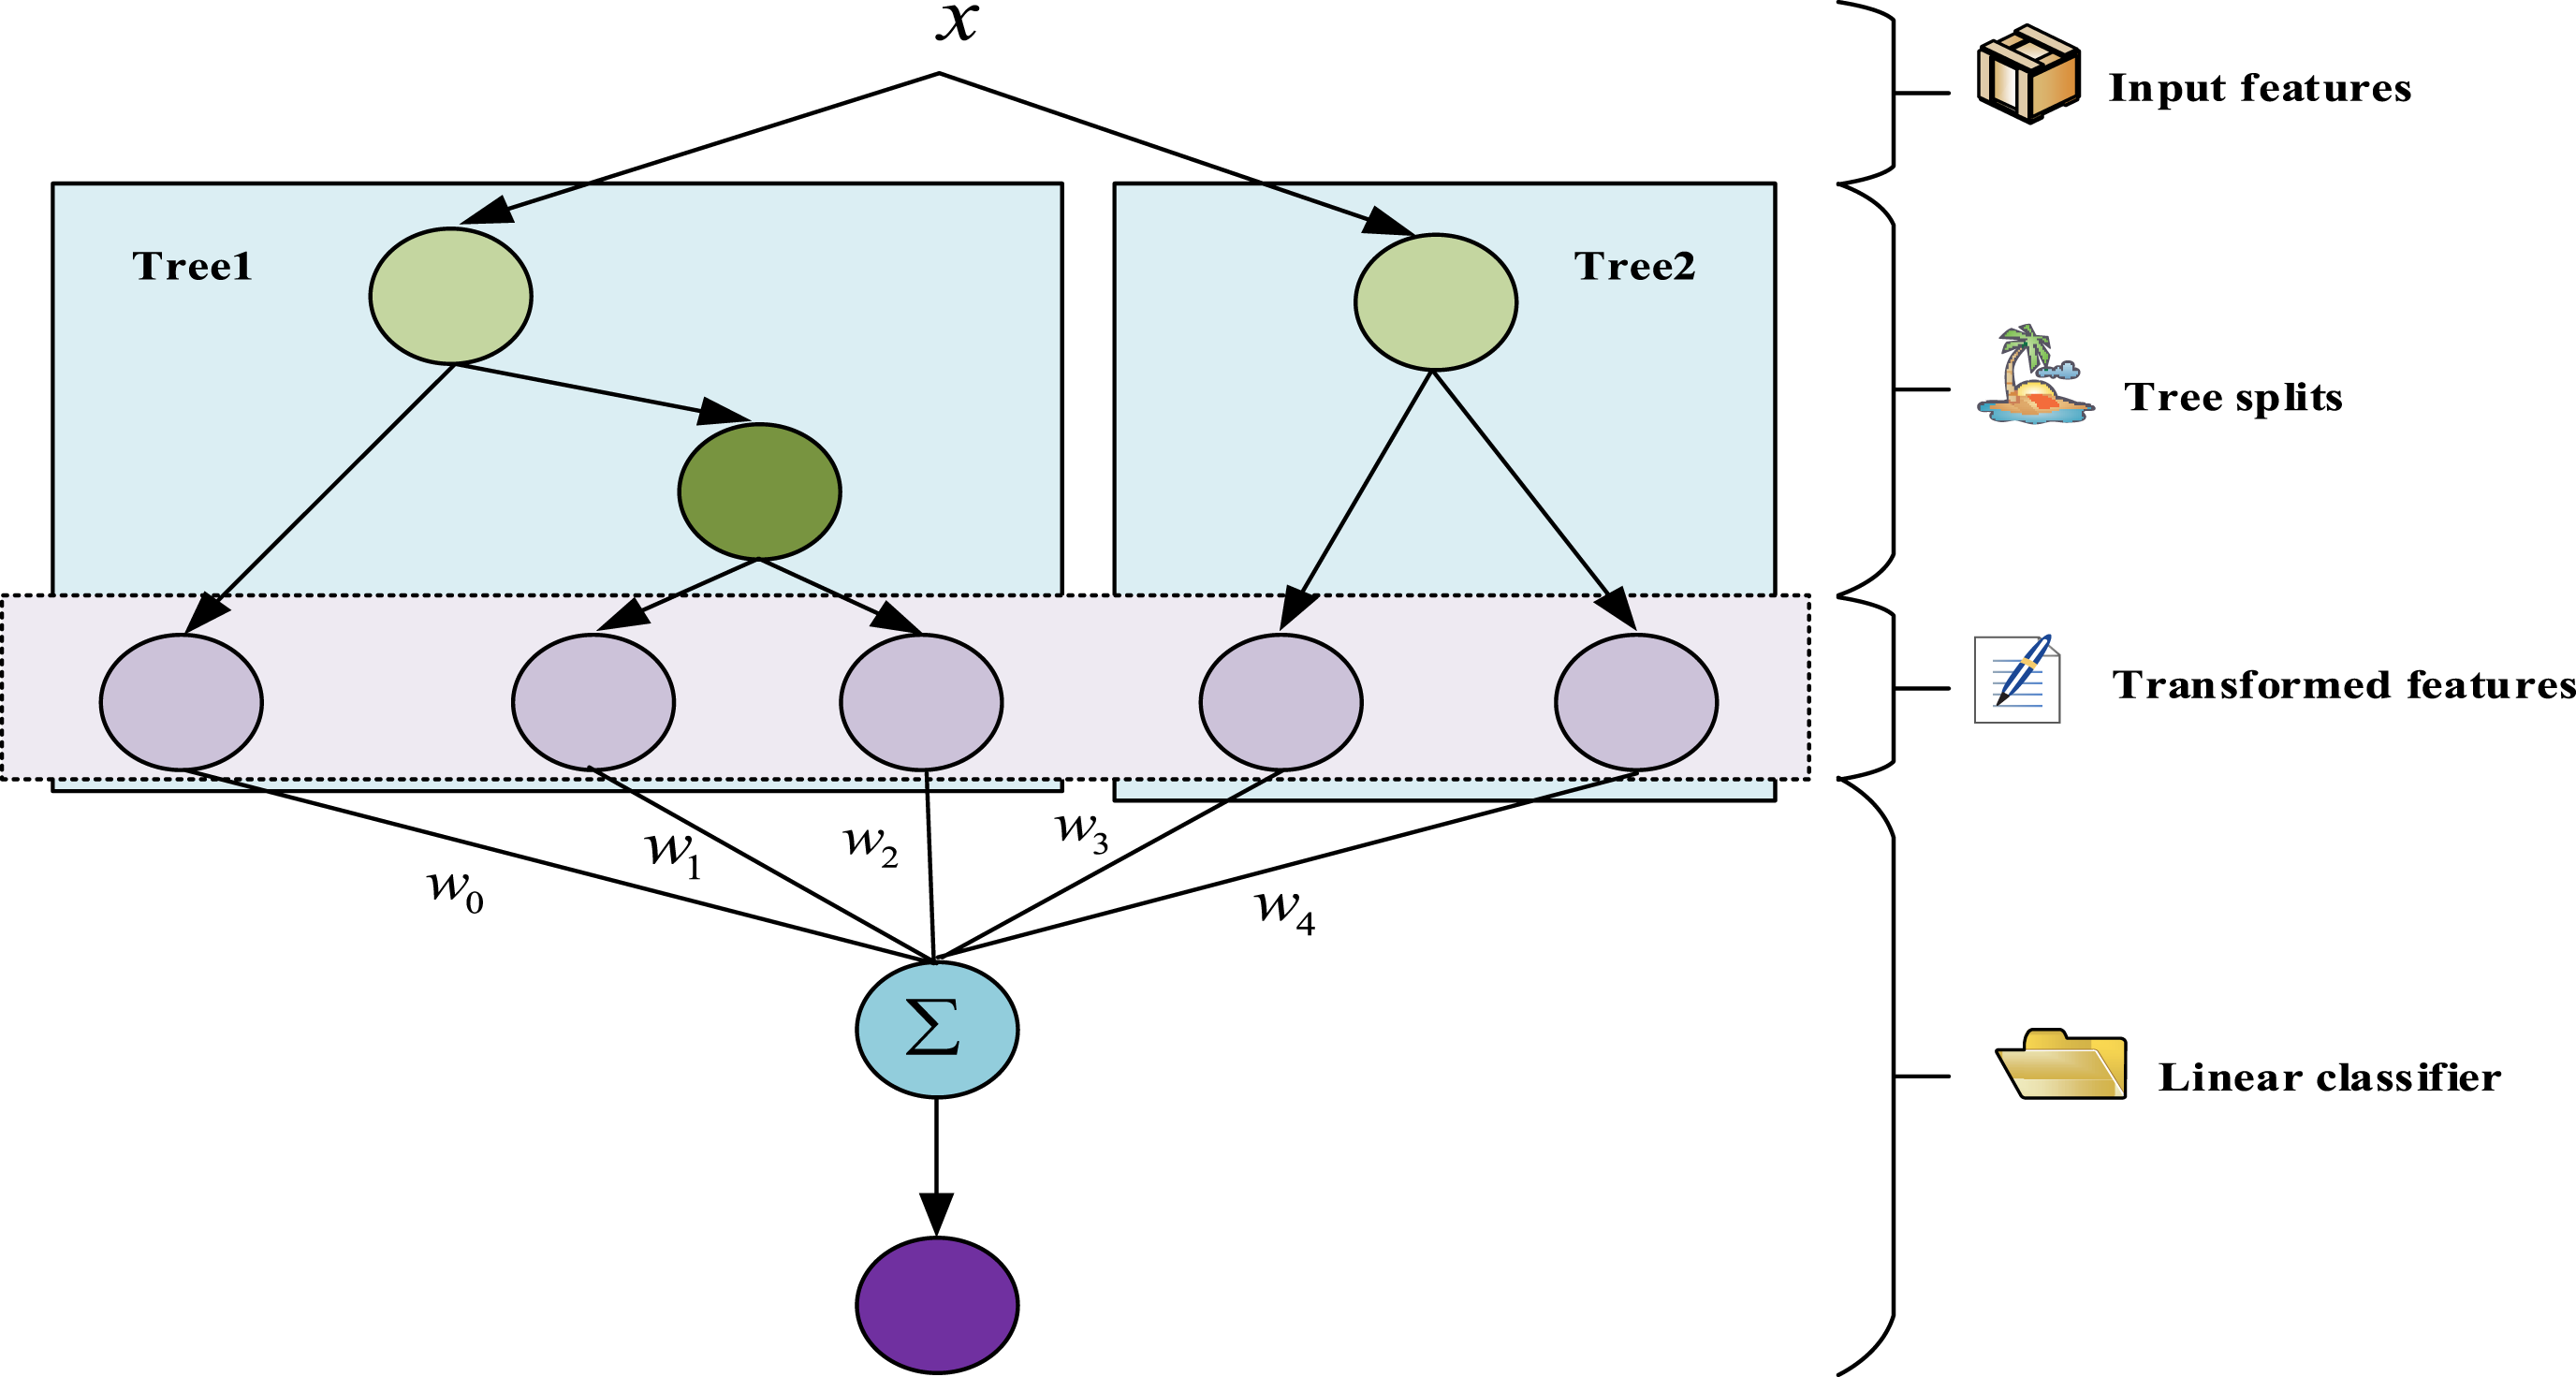
The research combines FM module to complete high-level and low-level and high-order combination feature extraction, hoping to improve model’s training effect. FM module contains the relationship between two traditional linear models and one distinct feature component. Equation (6) is the FM model used to complete click-through rate estimation.

In equation (6), the range of values for parameters

In equation (7), the

In equation (8), the auxiliary vector is introduced into each feature component
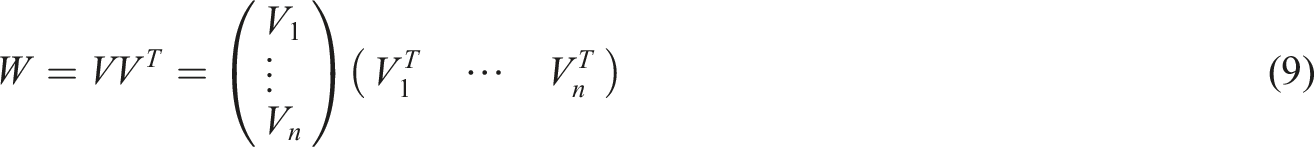
At this point, FM model can be solved using a random gradient descent algorithm. The FFM module improves upon the FM module by introducing the implementation domain of contract property features and utilizing hidden vectors from different domains to enhance model accuracy. Equation (10) is FFM module.

In equation (10), the feature index is represented by

The research uses Auc as the performance evaluation index of advertising click-through rate prediction, and combines the classic click-through rate calculation formula for auxiliary evaluation. Equation (12) is the classic click-through rate calculation formula.

In equation (12), the Click-through rate is
The PrefixSpan algorithm extracts frequent click sequences and forms temporal pattern feature vectors. Each element of these vectors represents the frequency with which a pattern occurs. On this basis, the Markov chain uses these feature vectors as observation sequences to establish a hidden state transition model. Its state space corresponds to the user states of “high intention” and “low intention.” It dynamically adjusts the transition probability based on the frequency of patterns obtained by PrefixSpan. Next, the posterior probability calculated by the Markov chain is combined with the cascade model’s MF characteristics and entered into the FFM module for the final prediction. PrefixSpan and the Markov chain work together through a state-pattern mapping matrix. This matrix uses elements that represent the weights of patterns in different states. It addresses the influence of temporal pattern importance and transition probability on click behavior.
The PrefixSpan algorithm is an efficient method for mining frequent sequence patterns. Its core lies in using prefix projection technology to avoid generating a large number of candidate sequences, thereby reducing computational complexity. The algorithm first scans the click sequence dataset to generate all frequent sequences with a length of 1. Next, for each frequent prefix, create its corresponding projection dataset (i.e., the sequence ending with this prefix in the original dataset). Then, recursively mine the frequent suffixes in the projection dataset to generate the expanded frequent sequence. This process continues until no new frequent sequences can be discovered. In terms of complexity, the time complexity of PrefixSpan is
In click sequence modeling, Markov chains define observed states, such as specific click events, and hidden states, such as user intent categories. They use state transition probabilities to characterize user behavior patterns. The algorithm steps include: ① The definition of the state space involves mapping click events to observed states and abstracting user intentions into a set of hidden states. ② Parameter estimation: The transition probability matrix and emission probability matrix are iteratively optimized through the EM algorithm, and the initial parameters are randomly initialized. ③ Sequence decoding: The Viterbi algorithm is used to infer the most likely sequence of hidden states to reveal the evolution of intent behind click behavior. Its training complexity is
Simulation and analysis of online advertising design evaluation combining MF and user classification
This chapter conducts simulation analysis on design evaluation of online advertising integrating MF and user classification. The first section of this chapter is the evaluation criteria of online advertising and the effect verification of user type classification on the foundation of attribute integration. The second section of this chapter is an effect verification of online advertising effect evaluation module combining MF and TC.
Evaluating criteria of online advertising and verification of user type classification based on attribute integration
This experiment uses a hardware environment equipped with dual NVIDIA A100 40 GB Gpus and Intel Xeon Gold 6240 (2.6 GHz, 18 cores) cpus. The framework adopted in the experiment is PyTorch 1.12.0 for model training, and TensorFlow 2.9.0 is taken as the baseline simultaneously. During the training process, the batch size is set to 256, the learning rate to 0.001, and the Adam optimizer is adopted. The entire training process consists of 50 rounds and is expected to take approximately 4.5 hours to complete in single-card mode.
Expert scale and impression space comparison table.
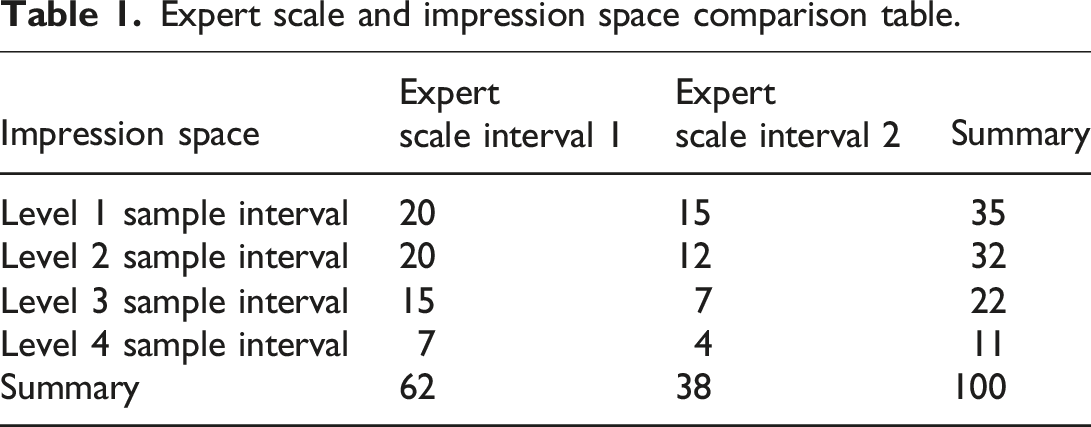
The original assumption is that there is no deviation between the observed and theoretical values, and Sig is taken as 0.05.
During the process of establishing labels, three advertising analysts conduct manual classification based on user behavior logs (including click duration and conversion records). The consistency among them is measured using the Kappa coefficient. The result is a Kappa coefficient of 0.82, which indicates good consistency. The data is sourced from the real data of a certain e-commerce platform in 2024, involving 100,000 users. Among these users, high-conversion users classified as Type 1 accounts for 38.7%, while low-conversion users of Type 2 accounts for 61.3%. The experiment compares user type classification based on a single attribute with user type classification based on attribute integration, using classification time and accuracy as evaluation indicators. The two user classification methods classify 1000 users in Figure 6. Comparison of user classification time and accuracy.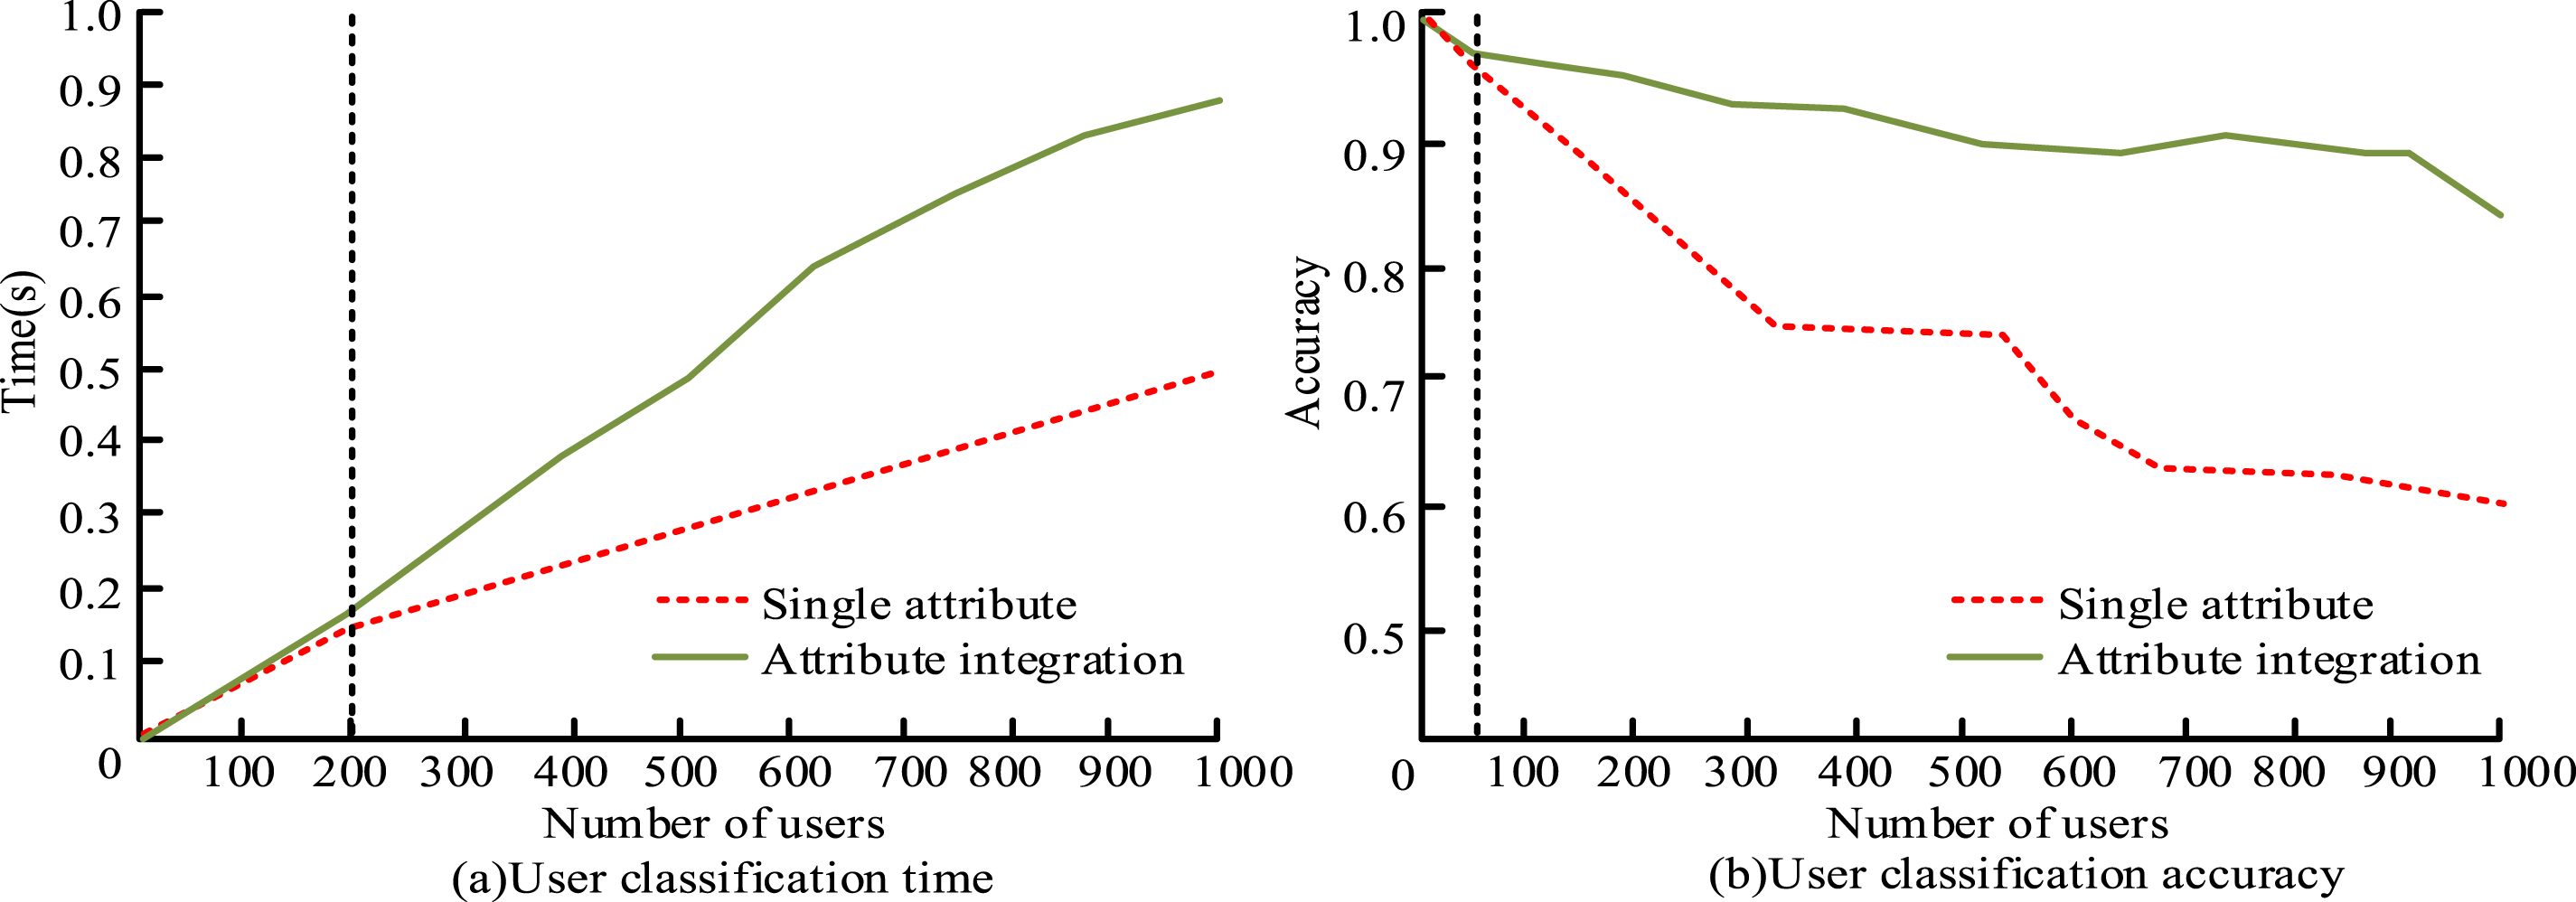
Figure 6(a) shows the experimental results of the time used for two methods of classification. When user number is less than 200, the difference in classification time between the two classification methods is not significant. When user number exceeds 200, the user type classification method based on a single attribute takes less time than the user type classification method based on attribute integration. When user number is 1000, the difference in time between the two is 0.38 seconds. This is because the process of user type classification based on a single attribute is relatively simple and takes less time. Figure 6(b) shows the classification accuracy experimental results of the two methods. When user number is less than 50, the accuracy difference between the two classification methods is not significant. When user number exceeds 50, the accuracy of the user type classification method based on a single attribute is lower than that of the user type classification method based on attribute integration. When user number is 1000, the accuracy of the user type classifying method on the foundation of a single attribute is 0.51, and the accuracy of the user type classifying method on the foundation of attribute integration is 0.85. This indicates that the user type classifying method on the foundation of attribute integration is more effective.
In the classification scenario of 1000 users, the single-attribute classification method takes 0.62 seconds, has an accuracy rate of 0.51, and has computational complexity of O(n). It is suitable for application in scenarios with high real-time requirements but low accuracy requirements, such as the preliminary filtering of real-time advertisement placement. The attribute integration classification method takes 0.98 seconds, with the accuracy rate improved to 0.85. The computational complexity is O(n2k) (k represents the number of attributes). It is suitable for offline model training and key user segmentation. To optimize this classification method, strategies such as parallel computing of attribute contribution values and screening of core attributes based on feature importance can be adopted to reduce the k value.
Effectiveness verification of online advertising effect evaluation module combined with MF and TC
The experimental dataset is derived from the actual click flow data of a specific e-commerce platform from June 2024. It includes two million click records from 100,000 users. In the dataset, the proportion of click samples is 4.7% (94,000), and the proportion of non-click samples is 95.3% (1.906 million), indicating a class imbalance phenomenon. There are a total of 128 feature dimensions, including 64 MF features (text, image, and video embeddings), 24 user attributes, and 40 TC features. The sparsity of numerical features is 15%, and the sparsity of category features after exclusive hot encoding is 82%. Since the data contains commercially sensitive information, no public datasets have been used and anonymization has been carried out. Anonymization processing includes removing or encrypting personal identity information of users involved in the data (such as name, phone number, address, etc.) to protect user privacy, while retaining key data such as click behavior and feature dimensions for model training and analysis. The clickstream data undergoes the following processing procedures: First, the data is cleaned to filter out invalid clicks (e.g., those with a stay time of less than 3 seconds) and to fill in missing values using mean or mode filling. Then, feature engineering is carried out. Among them, the MF feature uses the CLIP model to extract graphic and text features, and the VGG model to extract video features. TC features extract temporal features such as click timestamps, days of the week, and time periods. Finally, to maintain a consistent class distribution, the dataset is divided into 80% for training, 10% for validation, and 10% for testing. The experiment selects the difference of two squares within the group to analyze and determine the optimal user number and user type clustering in Figure 7. The optimal number of clusters and user type partitioning results.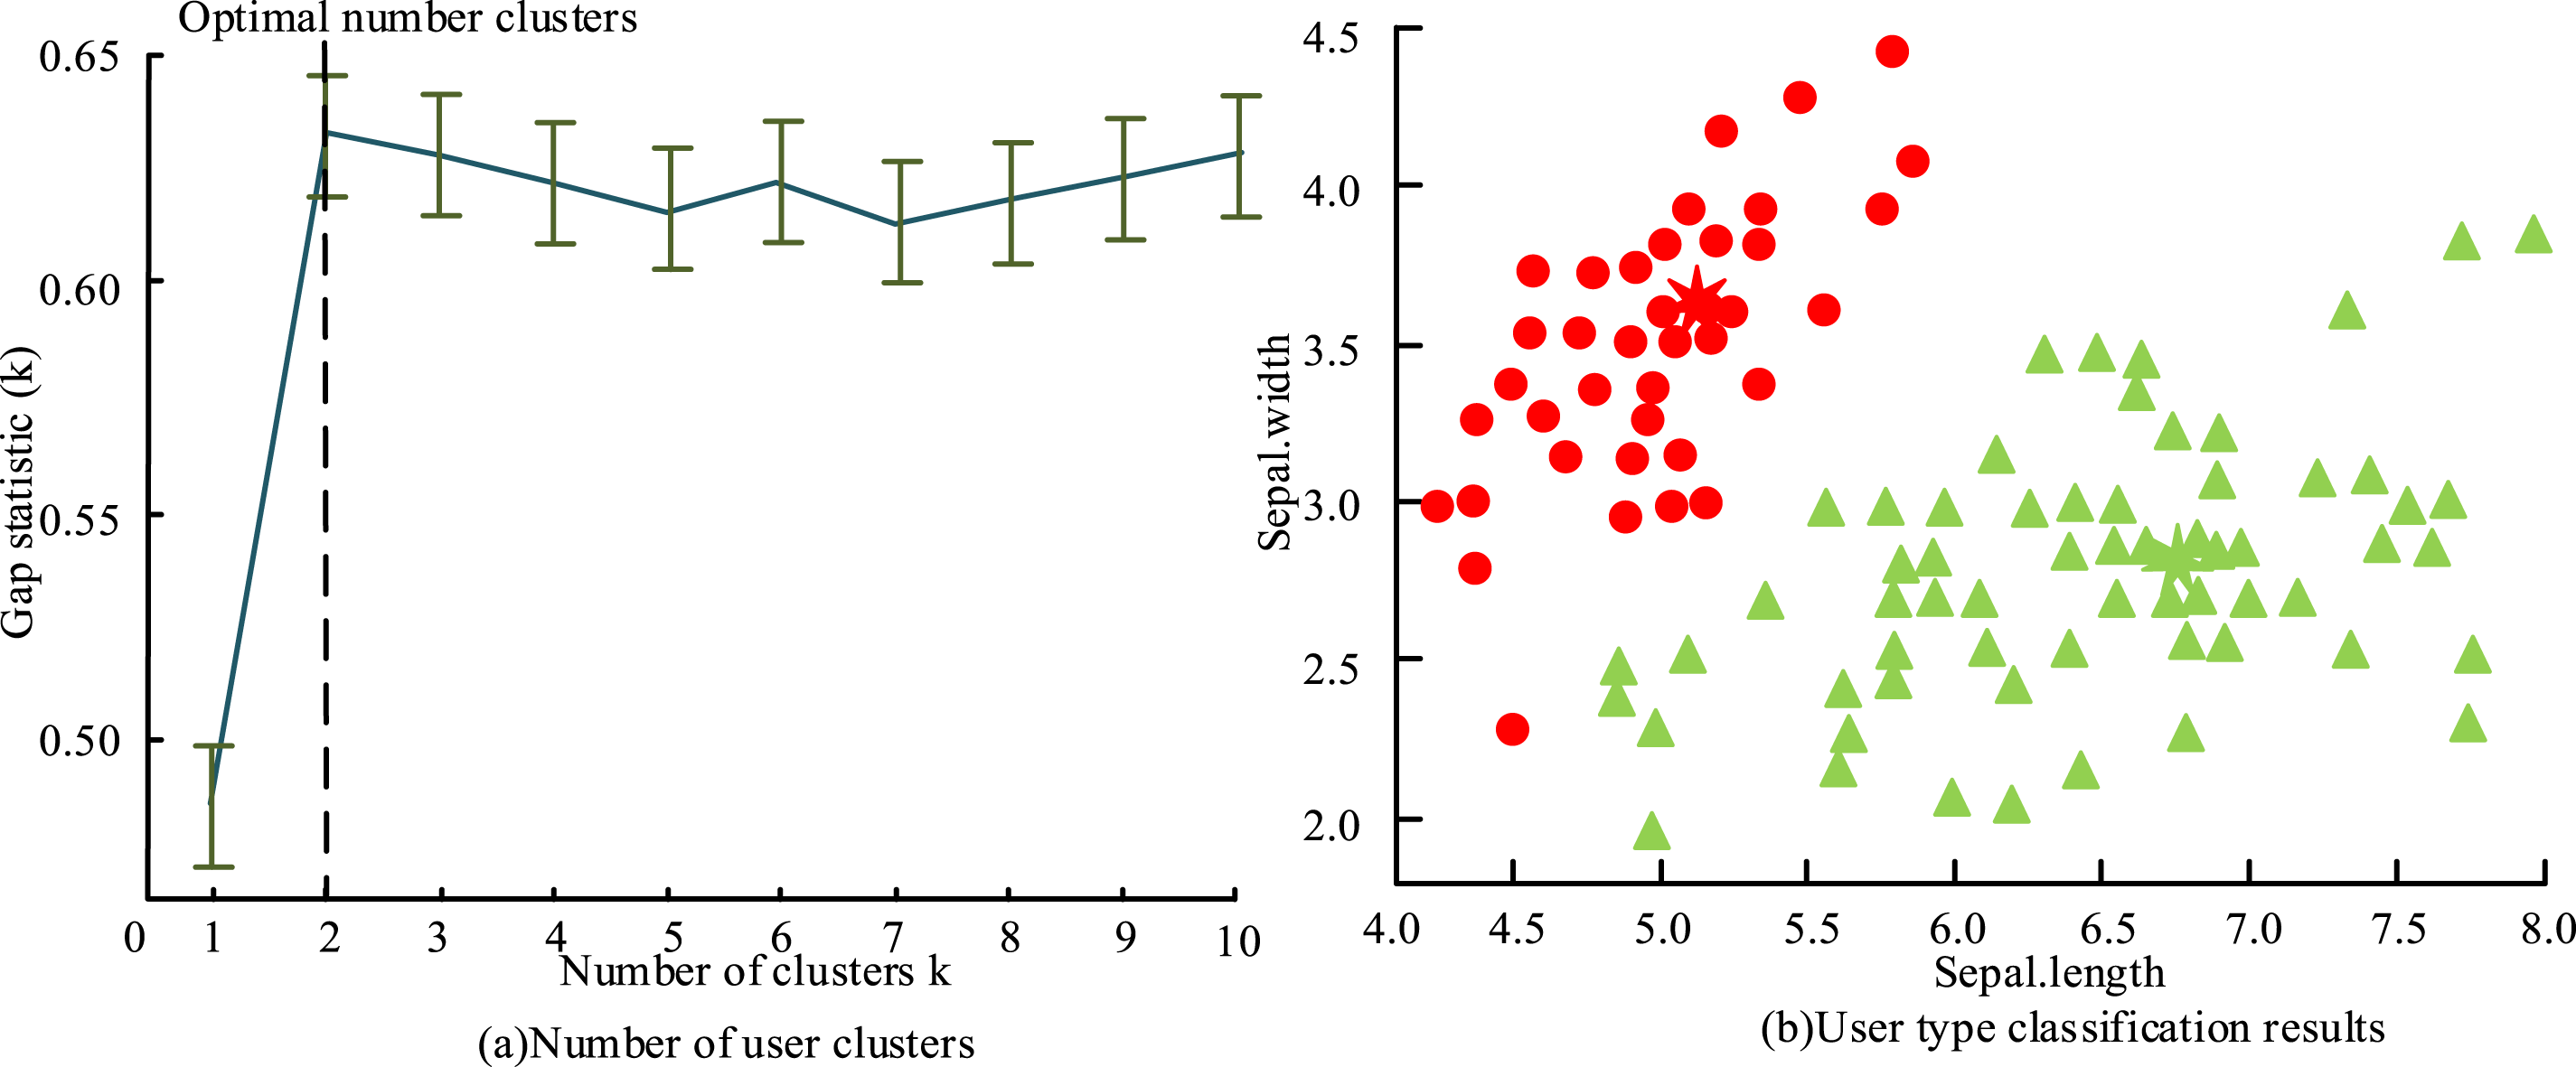
Figure 7(a) shows the experimental results of the optimal users number. When user type is 2, there are significant differences among different user types, indicating that the optimal luster number is 2. Figure 7(b) shows the user type division when the number of clusters is 2. Two user types are different significantly, with a distance of (1.3, 0.9) between the clustering centers. This is beneficial for the cascade model based on MF and TC to demonstrate the highest accuracy of classification. When k = 2, the decrease in the sum of squares (SSE) within the group is the greatest (a 42% decrease compared to k = 1). After k > 2, the decrease in SSE slows down (only a 11% decrease when k = 3). This indicates that the two clusters are able to capture the main differences in the data. In the advertising field, the “high-value user/ordinary user” dichotomous pattern is common. Among them, k = 2 corresponds to high-conversion potential users (Type 1) and low-conversion potential users (Type 2). It meets the requirements for formulating advertising strategies. When k = 2, the distance between clustering centers (1.3, 0.9) is the largest, and the discrimination between classes is significant. This avoids the problem of insufficient small class samples that may occur when k > 2 (such as the proportion of samples of a certain class <15% when k = 3).
When constructing the GBDT model, 100 trees and a depth of six layers are selected as hyperparameters, aiming to balance the capacity and computational efficiency of the model. The grid search method is used to optimize these parameters, considering different combinations of 50, 100, 150 trees and depths of 4, 6, 8. For the FM model, the hidden vector dimension k is set to 8, which takes into account the high sparsity of the advertising features. Selecting k = 8 strikes a balance between the number of parameters and the model’s expressive ability. In the FFM model, the learning rate is set to 0.001 and L2 regularization with a value of 0.01 is used. Such a setting is to prevent parameter oscillations when dealing with sparse data and to suppress overfitting through L2 regularization. The optimization of these hyperparameters is accomplished through cross-validation. Among them, the alternative values of the learning rate include 0.0005, 0.001, and 0.002. As for the cascading model, the batch size is set to 256. This choice takes into account both the utilization rate of GPU memory and the stability of the gradient. Experiments on the advertising dataset, which has a sample size in the millions, show that the optimal batch size is 256. The ReLU activation function (AF) has advantages such as alleviating gradient vanishing, high computational efficiency, and sparse activation characteristics. It is particularly suitable for data scenarios with sparse advertising features. The output range of the tanh AF is between [1,1], which is suitable for processing data with symmetrical distribution. Moreover, its gradient is relatively smooth, which is conducive to the initial convergence of the model. In the context of advertising click prediction, the ReLU AF is better suited to large-scale online learning due to its sparsity and computational efficiency. It also performs better overall. The tanh AF, on the other hand, is more suitable for scenarios where symmetrical output feature normalization is required. The experiment compares each baseline model with a cascade model based on MF and TC (referred to as CM) in Figure 8. Comparison of Auc of various models.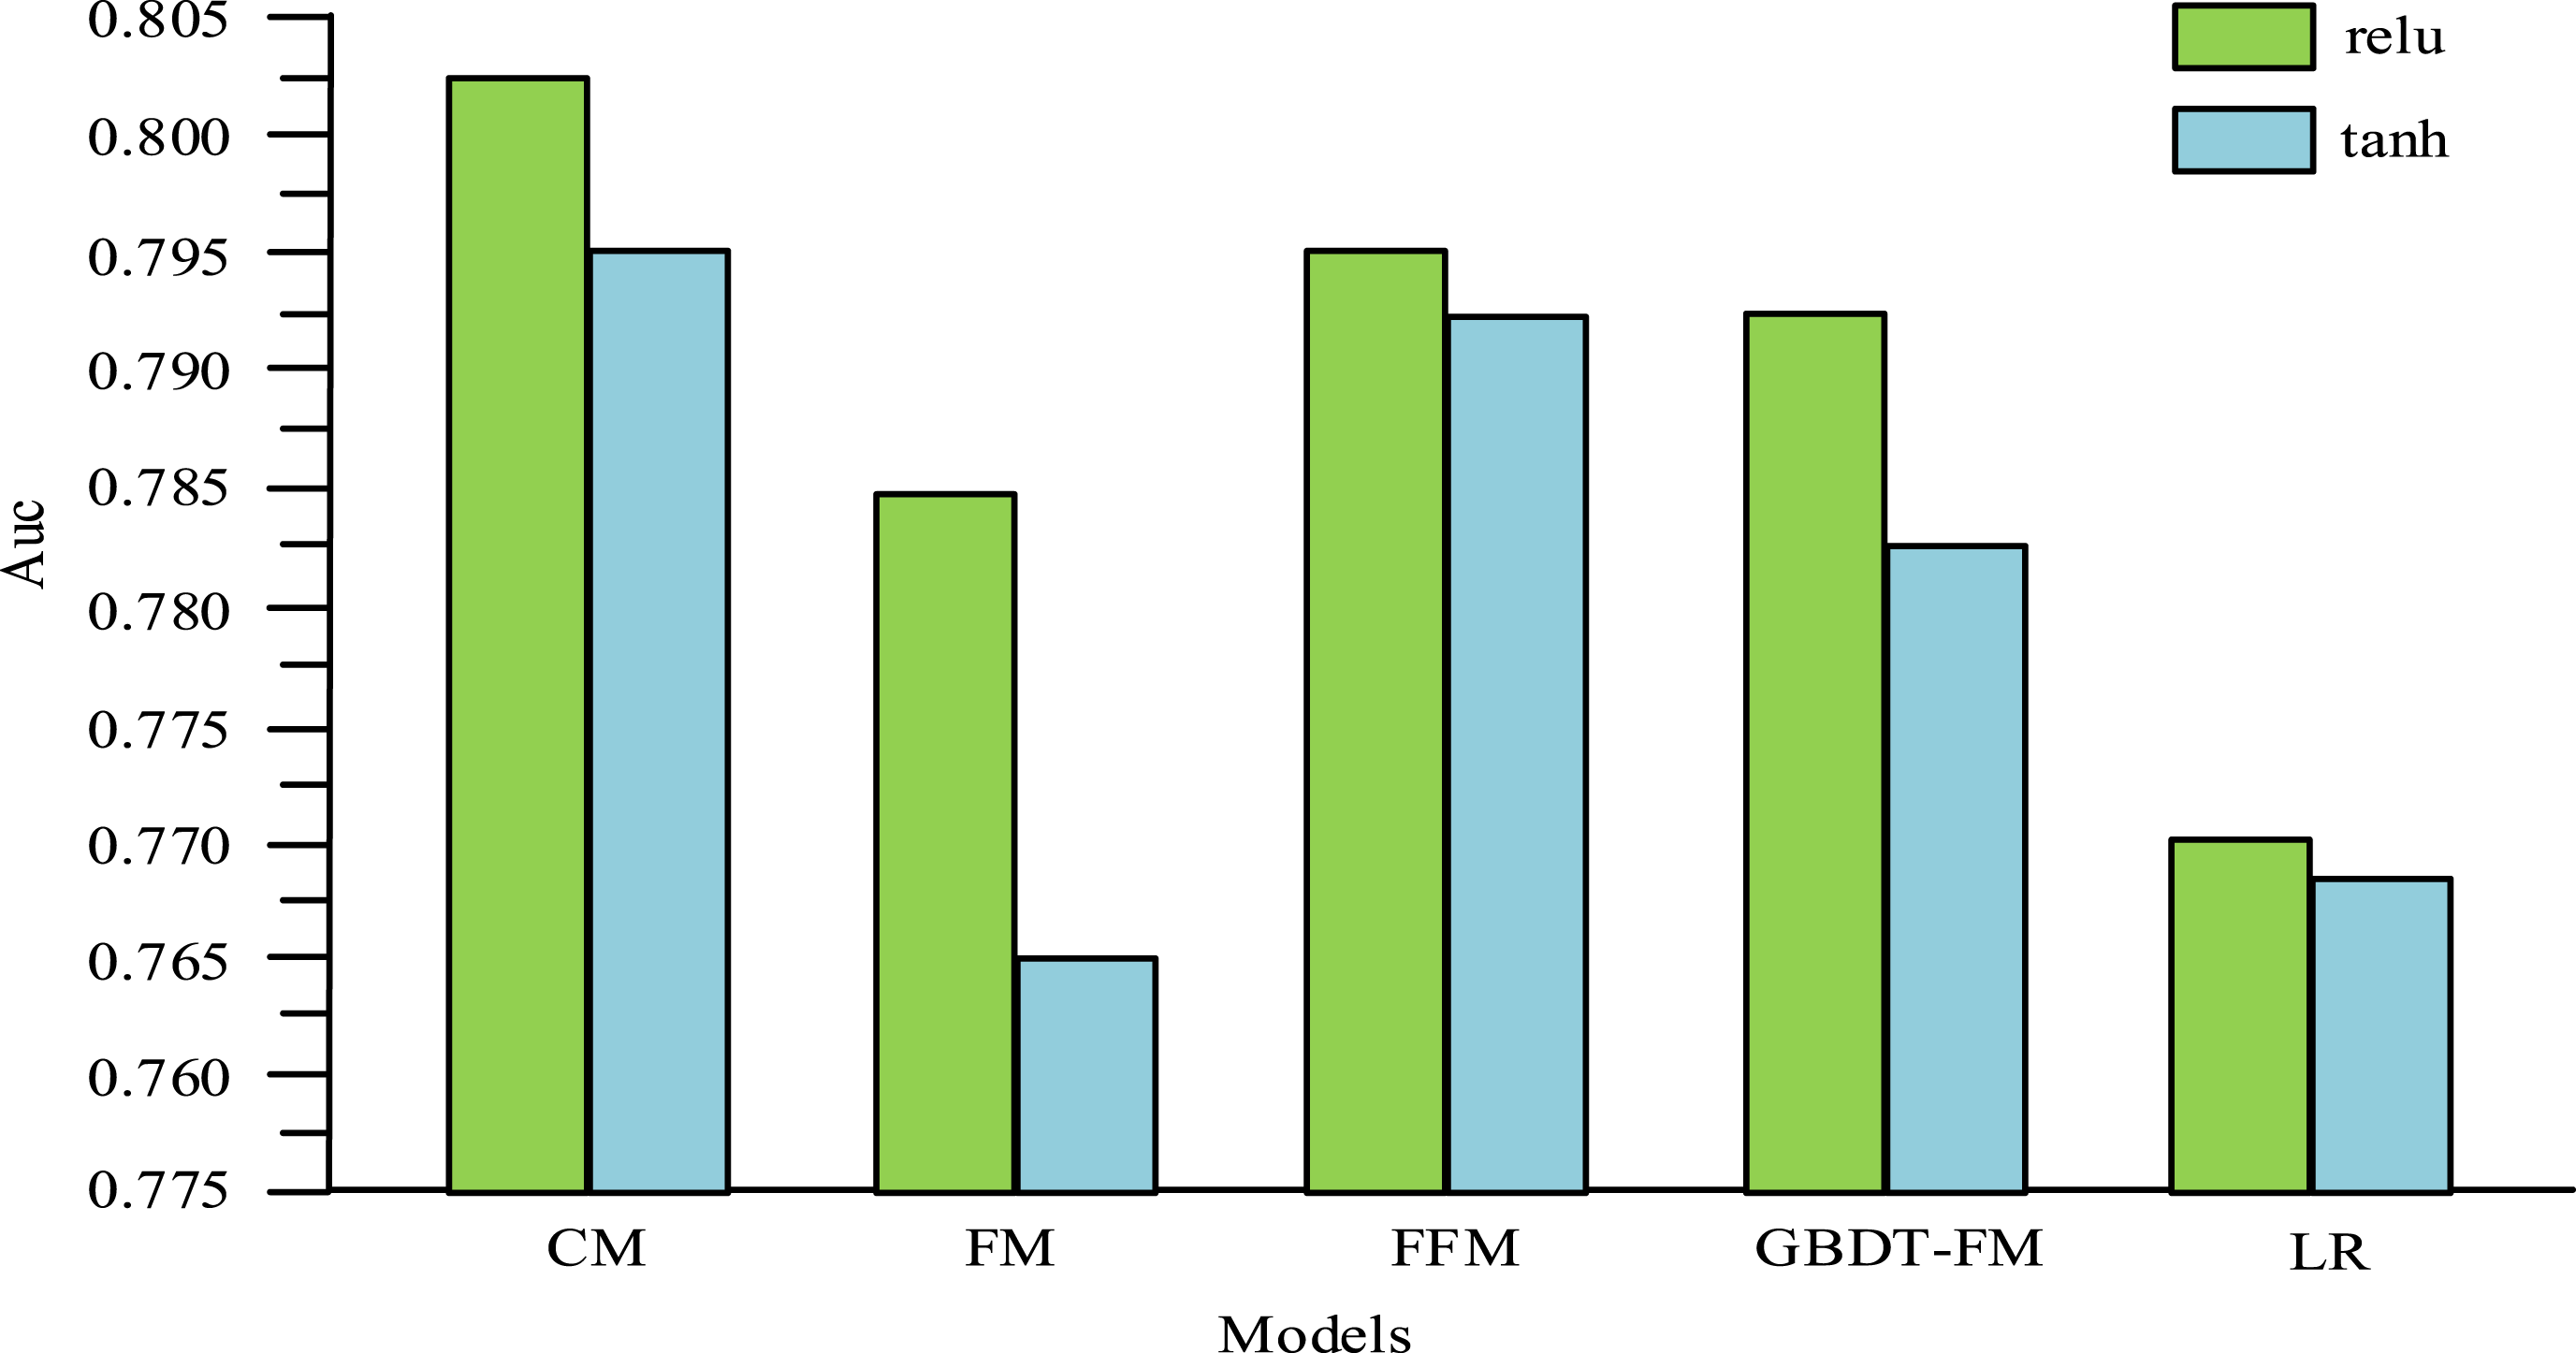
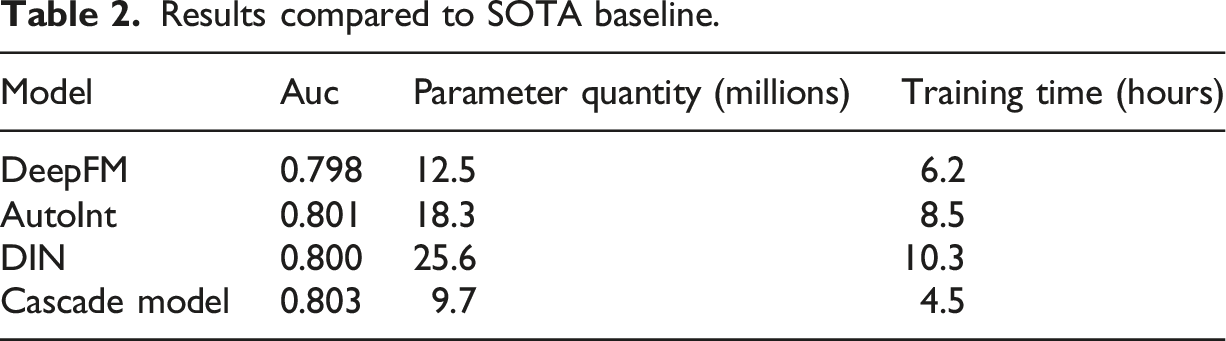
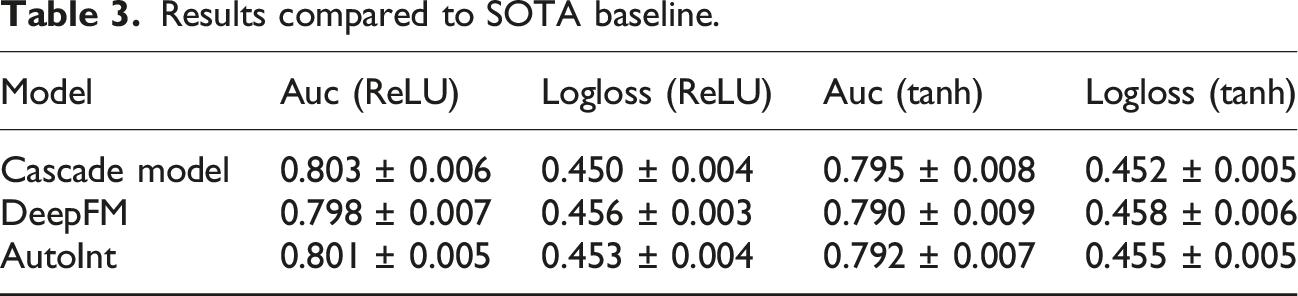
Figure 8 shows the Auc comparison of various models, and the performance of traditional LR models is poor. Although the training speed of the LR model is fast, the effect is not ideal. The Auc value of LR model under ReLU AF is 0.77, and the Auc value under tanh AF is 0.768. The performance of the FM model is better than that of the traditional LR model. The Auc value under ReLU AF is 0.785. GBDT + FM model is an improvement of FM, and its Auc value is 0.09% higher than that of FM model. The Auc value of the cascade model based on MF and TC under ReLU AF is 0.803. The Auc value under tanh AF is 0.795, which is higher than the Auc value of the other four models. The difference in Auc between the cascade model and GBDT + FM is significant (paired t-test, t = 2.37, p = 0.021<0.05). The 95% confidence interval is [0.005, 0.018]. Figure 9 shows the logloss values of the five models under ReLU and tanh AF. Comparison of logloss of various models.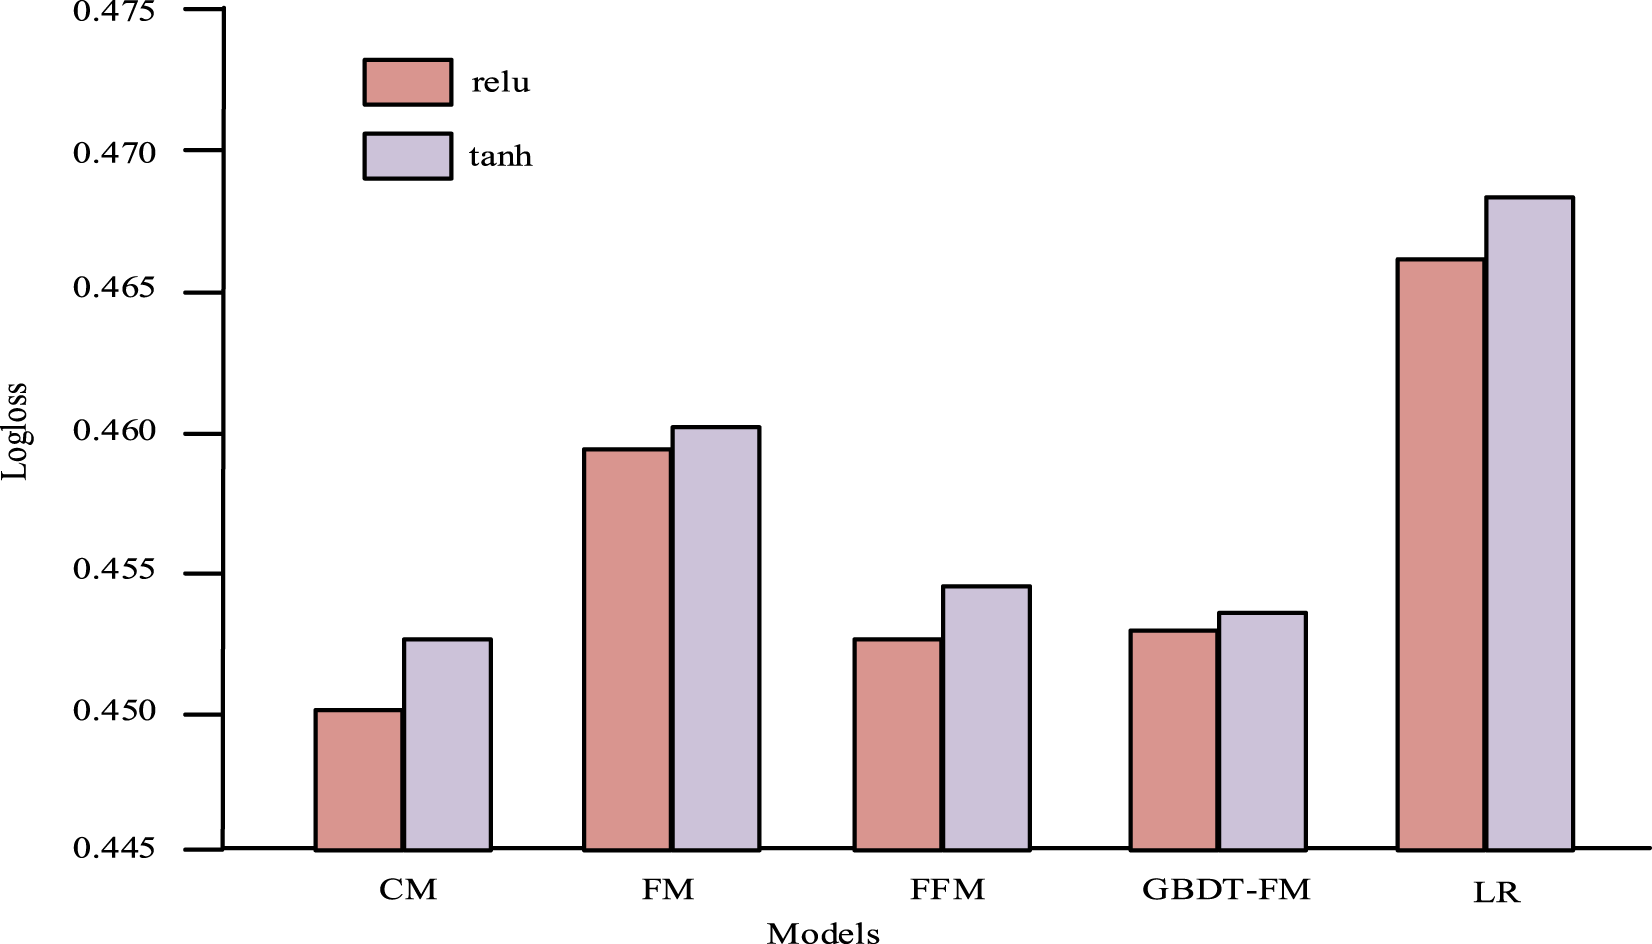
In Figure 9, the logloss value of the traditional LR model under ReLU AF is 0.466, and the logloss value under tanh AF is 0.469. The logloss value of the FM model under ReLU AF is 0.459. GBDT + FM model is an improvement of FM, and its logloss value is 0.01% lower than that of the FM model. The logloss value of the cascade model based on MF and TC under ReLU AF is 0.45. The logloss value under tanh AF is 0.452, which is lower than the logloss value of other four models, indicating that the more accurate the Click-through rate estimation is. The experiment compares the accuracy and Rate of convergence of each module in Figure 10. Comparison of accuracy and convergence speed of each module.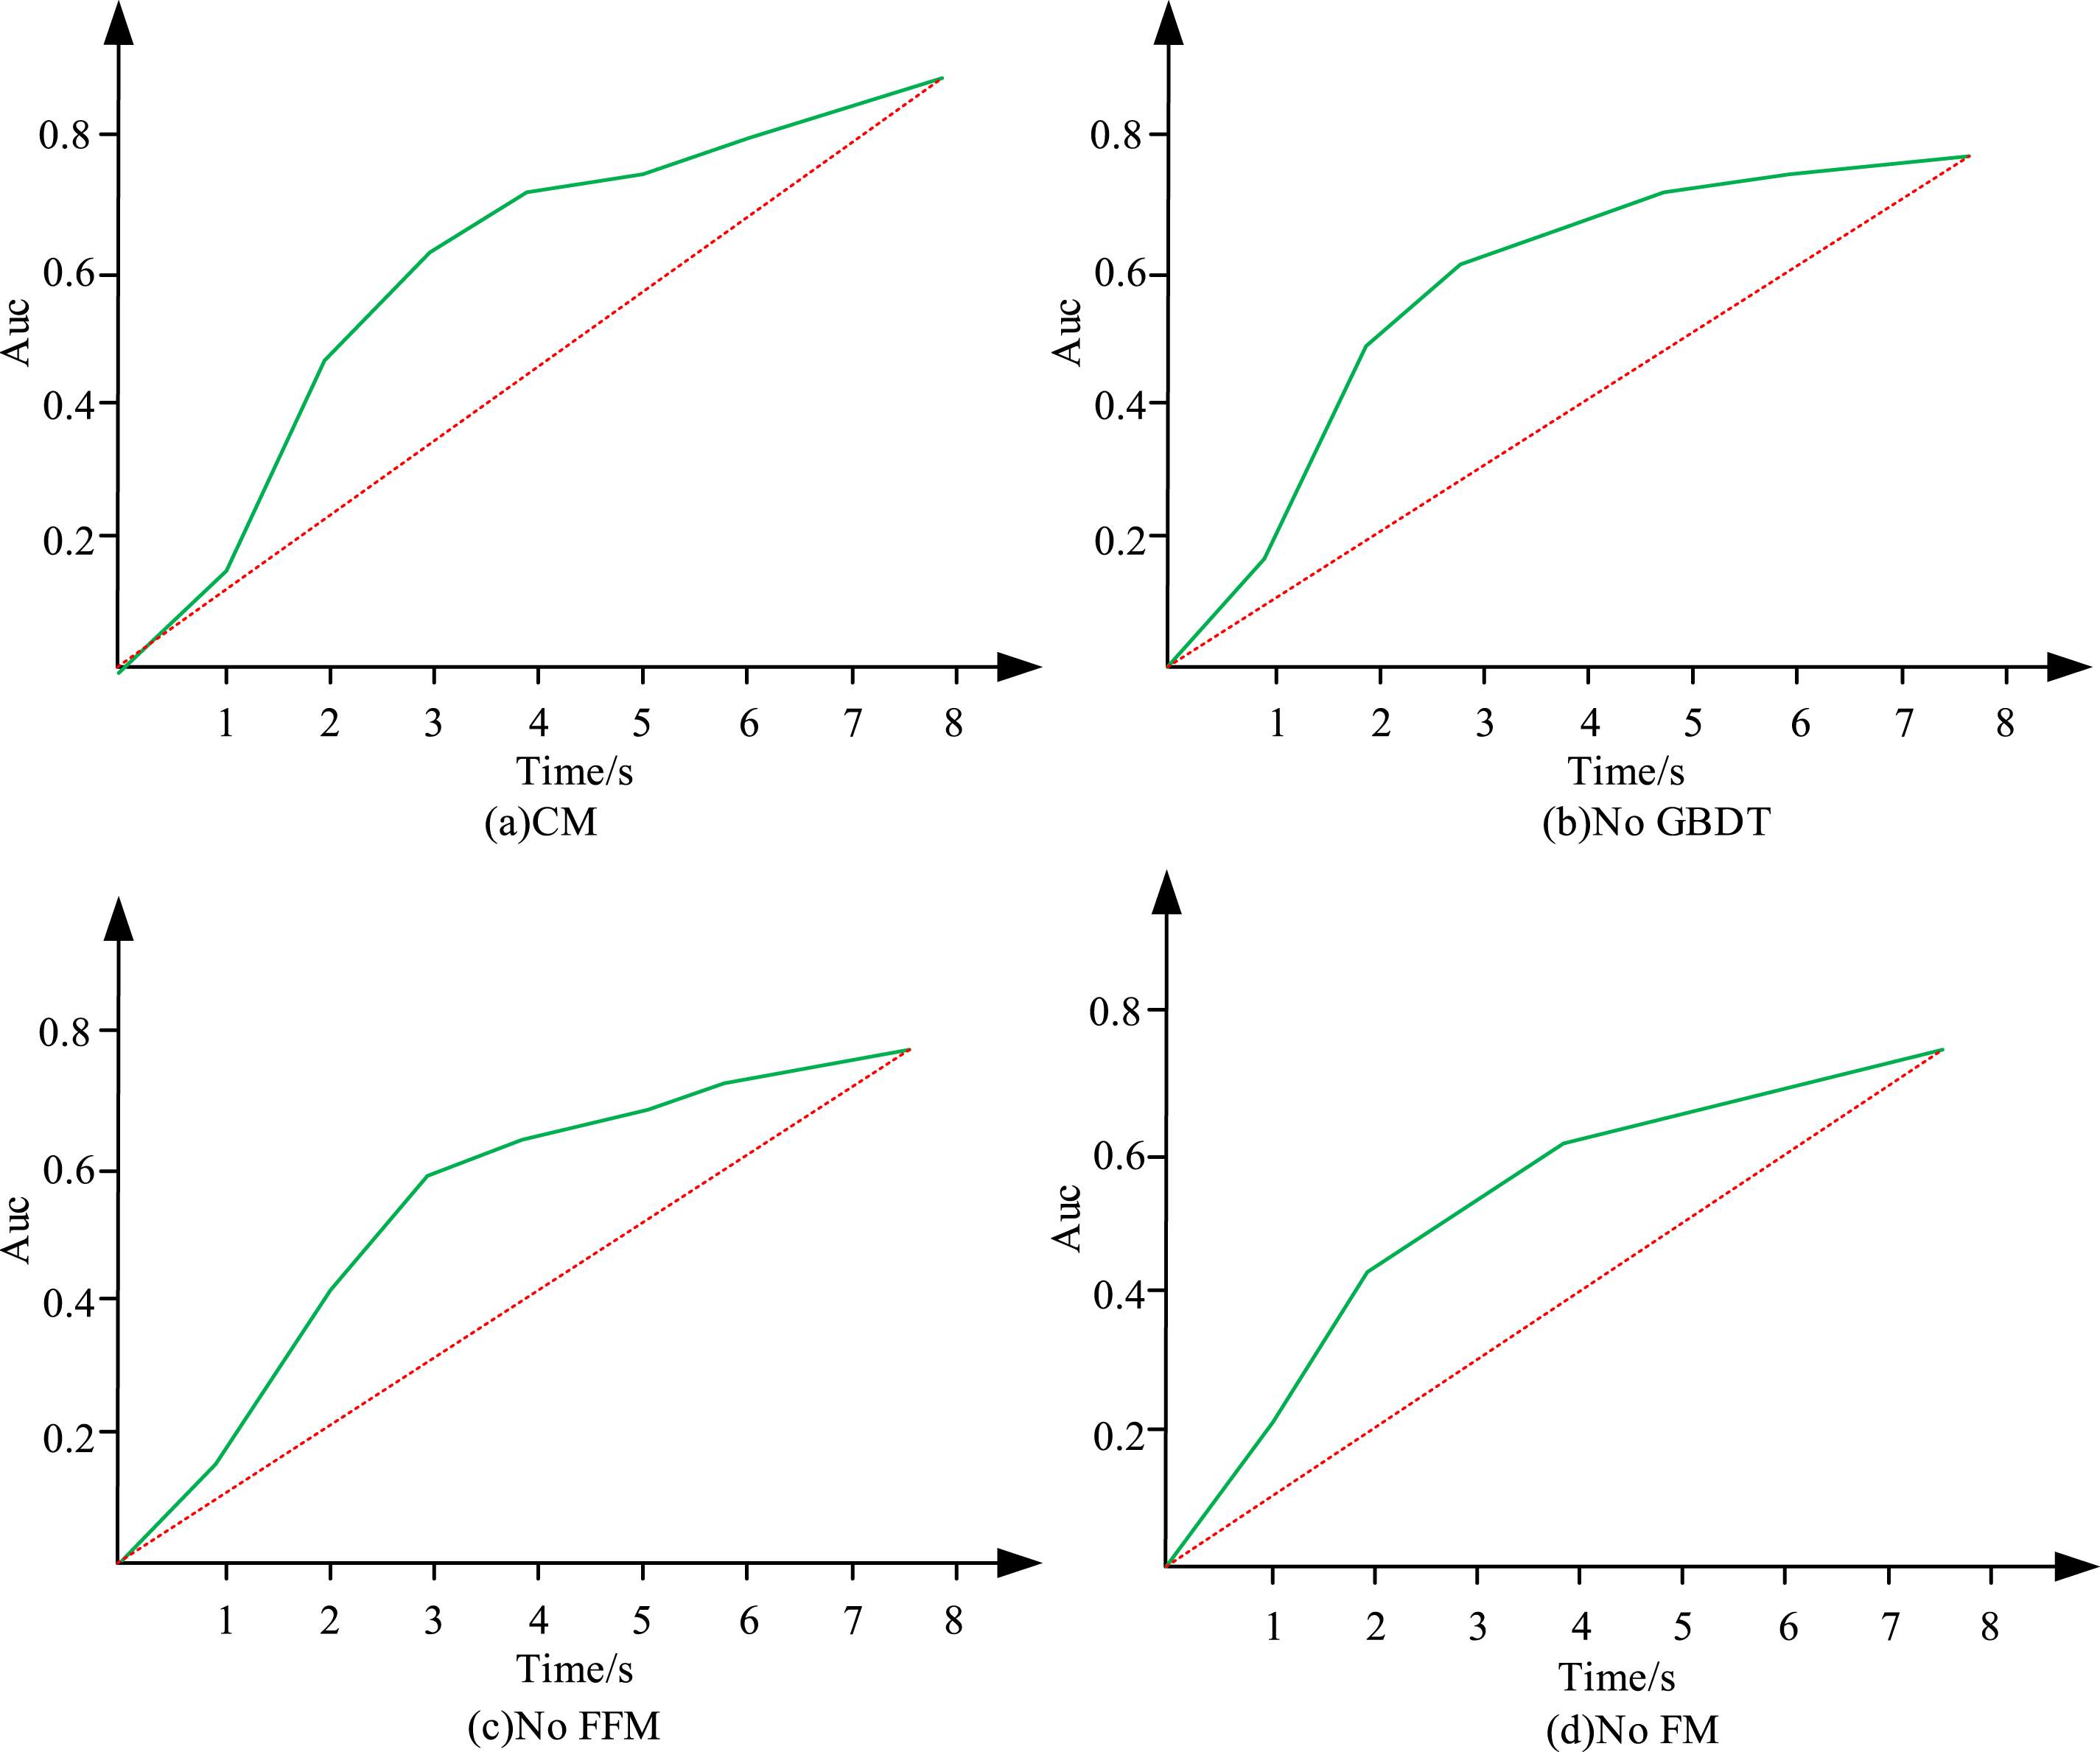
Results compared to SOTA baseline.
Results compared to SOTA baseline.
In different time periods, Figure 11 shows the accuracy of the evaluation of different online advertising effects based on the cascade model of MF and TC. Accuracy changes over time and types of online advertising.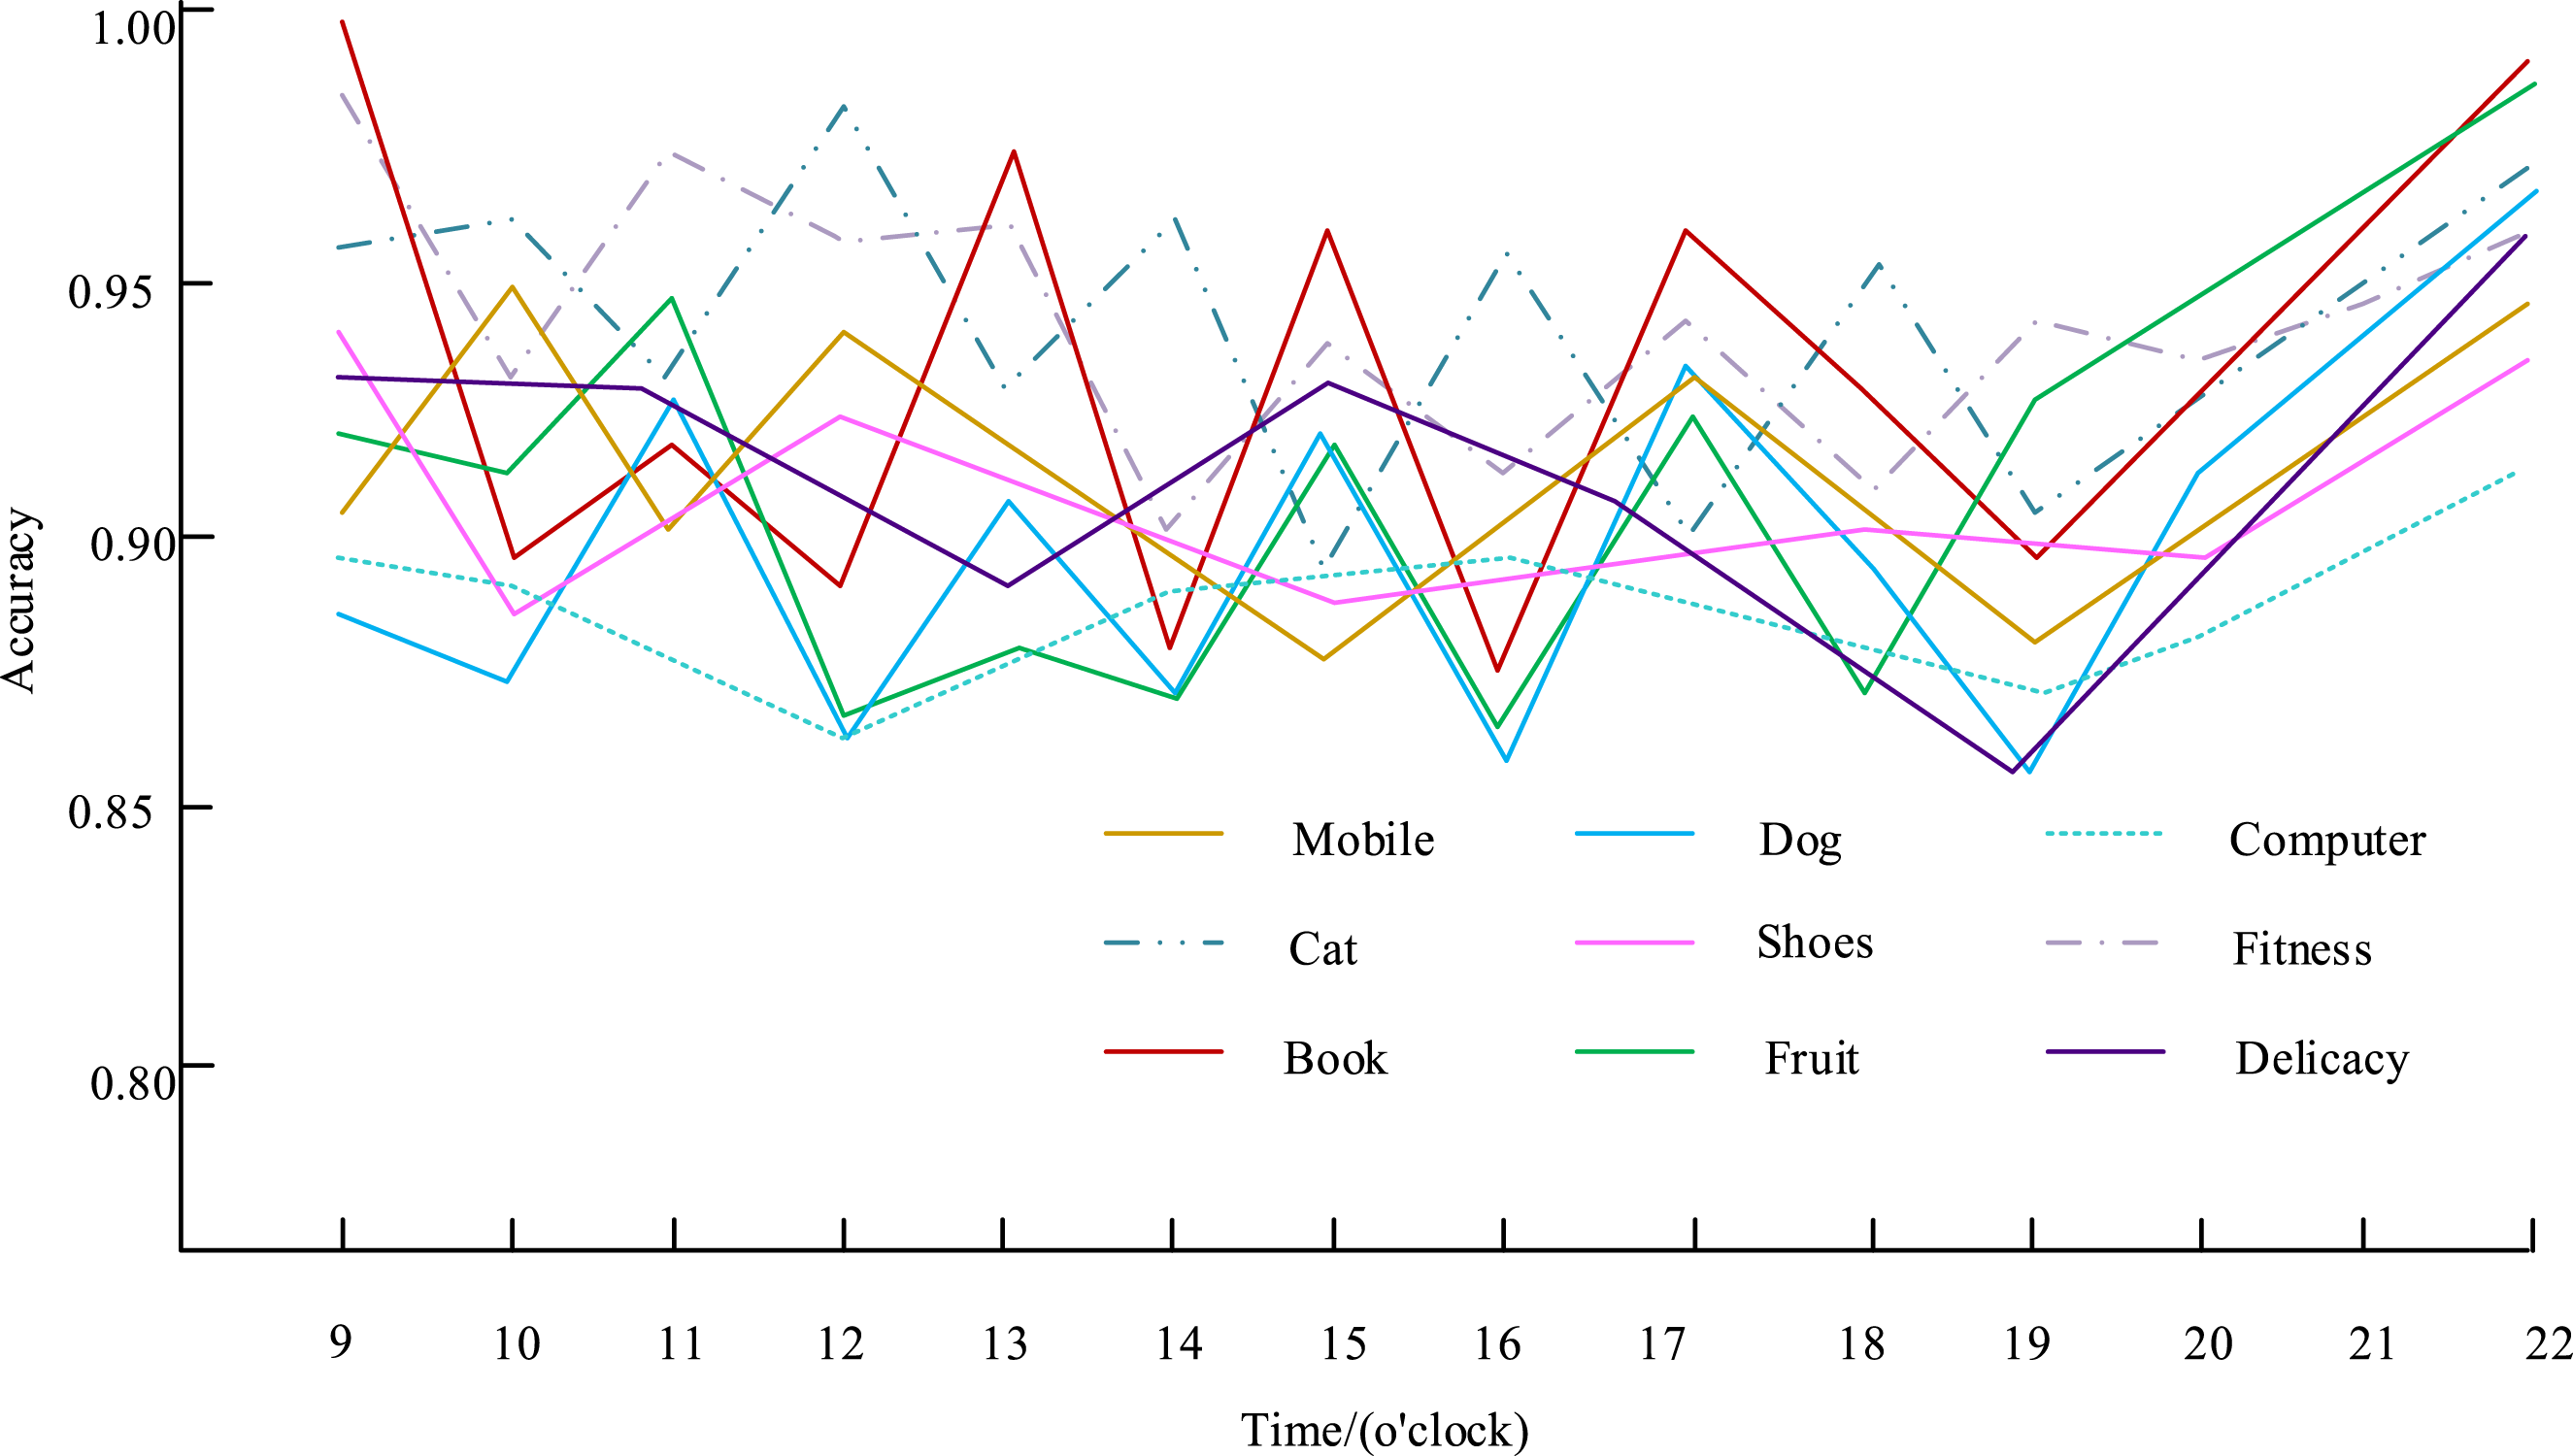
In Figure 11, between 9:00 and 18:00, the accuracy of the cascade model based on MF and TC in evaluating the effects of different online advertising fluctuates greatly. Because this is the working time of most online advertising platforms, advertising information is updated more frequently. During the day, users are engaged in work or study activities, which results in scattered attention and highly random click behaviors (e.g., breaking news interfering with advertisement browsing). This leads to an unstable sample distribution. Most platforms iterate advertising materials during the day (9:00–18:00) (with an average of 3–5 updates per day). The feature distribution of new materials deviates from historical data, and the model needs to be continuously adapted. There is no obvious pattern in users’ click time intervals during the day. For example, click patterns during morning rush hour and lunch breaks are quite different. The PrefixSpan algorithm has difficulty capturing stable timing patterns, resulting in decreased TC module contribution. During the period from 18:00 to 22:00, the accuracy rate of the cascade model based on MF and TC for evaluating the effects of different online advertising shows an upward trend, with the highest accuracy rate of 0.99. During this period, online advertising information is not updated frequently, and the accuracy rate of the model can be well maintained.
When the PrefixSpan algorithm deals with time series data, its computational complexity and scalability face some limitations. When the length of the time series exceeds 50, the size of the projected data set may increase exponentially, resulting in huge memory consumption. To achieve this, low-frequency patterns can be filtered by setting a minimum support threshold (e.g., 5%) and adopting a vertical partitioning strategy, such as segmented projection by user ID, to reduce memory consumption. Additionally, PrefixSpan does not natively support online scalability. This can be achieved by regularly retraining the model and combining it with sliding window techniques (such as retaining only the data of the last 30 days) to balance timeliness and computational load. When the number of user features exceeds 100, the time required for correlation analysis of sequence patterns and features increases significantly. To optimize this process, first use GBDT to screen the top 20 key features, and then conduct time series mining. Meanwhile, the adoption of approximate PrefixSpan algorithms (such as PrefixSpan+) can achieve a 30% speed improvement at the expense of 12% accuracy.
Conclusion
Internet technology development has made the internet an important way for people to obtain information. Moreover, businesses push products and services through webpage advertisements. To realize the accurate evaluation of online advertising effect, the research proposed the evaluation design of online advertising effect that integrates MF and user classification. A user type classification method based on attribute integration was used to achieve the division of user types. When user number exceeded 50, the accuracy of the user type classification method based on a single attribute was lower than that of the user type classification method based on attribute integration. When user number was 1000, the accuracy of the user type classification method based on a single attribute was 0.51, and the accuracy of user type classification method based on attribute integration was 0.85. This indicated that the user type classification method based on attribute integration was more effective. When the user type was 2, there were significant differences among different user types, and the distance between the clustering centers of these two was (1.3, 0.9). The Auc value and logloss value of the cascade model based on MF and TC under ReLU AF were 0.803 and 0.45, respectively, and the Auc value and logloss value under tanh AF were 0.795 and 0.452, respectively. In the comparison experiment of the accuracy and convergence rate of each module, if GBDT module is removed from the cascade model, model’s convergence rate is improved, but the accuracy of the model is reduced. The cascade model based on MF and TC has the best convergence effect. Future research can apply the attention mechanism to the design of online advertising and improve the personalization and real-time of online advertising recommendation.
ORCID iD
Liuying Yu https://orcid.org/0009-0006-0334-6041
Footnotes
Funding
The author(s) received no financial support for the research, authorship, and/or publication of this article.
Declaration of conflicting interests
The author(s) declared no potential conflicts of interest with respect to the research, authorship, and/or publication of this article.