
Abstract
A field study was conducted in small-scale urban green spaces in Zhengzhou to monitor PM2.5 and PM10 concentrations along with temperature, humidity, and wind speed. Data analysis using SPSS revealed that PM2.5 showed a fluctuating decline throughout the day, while PM10 steadily decreased. No significant spatial differences were found in PM2.5, PM10, temperature, or humidity between the interiors and exteriors of the green spaces, but wind speed varied significantly. The reduction in PM2.5 and PM10 concentrations was influenced by distance from pollution sources and canopy density, with greater distances and sparser canopies leading to lower concentrations. However, the reduction rates remained below 5%, indicating a weak effect. Meteorological factors played a key role: PM2.5 was negatively correlated with temperature and positively with humidity, while its correlation with wind speed was not significant. PM10 was positively associated with humidity and negatively with both temperature and wind speed. A regression model estimated that a 1°C increase in temperature could decrease PM2.5 by 0.502 μg/m3 and PM10 by 3.586 μg/m3. Based on these findings, an optimized strategy for small-scale green space design is proposed to improve air quality while meeting urban functional needs.
Keywords
Introduction
Currently, research into the reducing effect of urban green spaces on atmospheric particulate matters is still evolving. 1 Studies have indicated that the atmospheric particulate matter concentration in urban green spaces is lower than in areas outside of these green spaces. 2 Enhancing the overall green coverage rate and developing suitable types of green spaces can somewhat reduce the atmospheric particulate matter concentrations in urban areas, thereby improving air quality. 3 Green spaces in urban parks, with varying vegetation structures, exhibit differences in their ability to reduce PM2.5 and PM10 concentrations, influenced by multiple environmental factors. 4 Certain plant community patterns have been identified that can lower atmospheric particulate matter concentrations. 5 There are observable patterns in the fluctuations of atmospheric particulate matter concentrations, such as the diurnal change of PM2.5 concentration, which forms a “U” shape. 6 Correlation analysis has revealed a significant negative relationship between atmospheric particulate matter concentration and green coverage rate, 7 a significant positive correlation with humidity, 8 and a negative correlation with temperature. 9 Furthermore, precipitation has a notable effect on reducing atmospheric particulate pollution. 10 These studies have delved into the role of urban green spaces in enhancing air quality and have supported the planning and design of urban green spaces and the development of environmental policies. However, there is a current gap in research on the monitoring and evaluation of the long-term air quality improvement effects of urban green spaces, public awareness and involvement in the role of urban green spaces in air quality improvement, the applicability of research findings in cities with different sizes and geographical characteristics, the economic costs of constructing and maintaining urban green spaces, and the economic benefits analysis of air quality improvement. Future trends may include a focus on more detailed green space design, long-term benefit assessments, cost-benefit analyses, and the specific impacts of different types of green spaces on air quality. Thus, this study focuses specifically on the air quality impact of small-scale public green spaces (<1.5 ha).
As park cities are built and the “Ecological Restoration and City Repair Initiative” progresses, small-scale public green spaces have emerged as a focal point for development. Currently, the focus of constructing these urban green spaces is on the refurbishment and rejuvenation of small-scale green spaces, with limited research into how their landscape layout affects the surrounding spatial environment. This study examines typical small-scale public green spaces, monitoring and documenting the diurnal and spatial changes of atmospheric particulate matter concentrations on-site. It assesses how different spatial structures influence atmospheric particulate matter concentrations, evaluates the role of meteorological factors on these concentrations, and notes the variation in weather elements across different spatial layouts. Furthermore, the study suggests design optimization strategies for small-scale public green spaces aimed at reducing atmospheric particles and improving the microclimate. This study provides the first quantification of sub-5% PM reduction rates in small-scale green spaces and proposes a novel design paradigm for them “prioritizing functional needs over PM reduction.” These insights offer guidance and recommendations for the development of small-scale public green spaces in urban renewal projects.
Related works
The reducing effect of green spaces on airborne particulate matter has become a focal point in urban ecological research. Empirical studies predominantly concentrate on correlations between vegetation structure and removal efficiency. Research demonstrates that vertical stratification characteristics in roadside vegetation barriers significantly enhance PM2.5 and PM10 removal efficiency. 11 Among varied configurations, multi-layered composite green spaces exhibit substantially higher particle removal rates than single-structure designs, while indirectly improving human comfort through microclimate regulation.12,13 Modeling approaches effectively quantify PM10/PM2.5 reducing effects, providing actionable insights for structural optimization. 14
Reducing effect is further modulated by scale effects and environmental drivers. Field measurements reveal higher PM2.5 removal efficiency in parks smaller than 4.71 ha, with models quantifying their impact scope and magnitude. 15 Notably, street-scale green infrastructure may exacerbate localized pollution due to impaired ventilation, whereas larger-scale tree canopy cover improves air quality. 16 Seasonal variations and intra-park environmental factors (e.g., distance to pollution sources, temperature, and humidity) critically influence particulate regulation efficacy.17–19 Collectively, these studies establish the scientific foundation for empirical research on particle concentration reducing in small-scale public green spaces.
Research methods
Sample plot selection
The selected sample plot was the green space nearby the southwest corner of the intersection of Songshan Road and Zhongyuan Road in the Zhongyuan District of Zhengzhou, as depicted in Figure 1. This sample plot is situated in the central area of Zhengzhou’s old part and serves as an entrance and exit for the subway station, attracting a high volume of pedestrian traffic. The sample plot spans an area of 12,000 square meters, aligning with the scale of small-scale green space in urban renewal projects currently underway. Additionally, the Zhengzhou Municipal Ecological Environment Bureau’s air quality monitoring station and the Medical College are located nearby, just 1.5 km away, providing accessible official data for reference. Location of sample plot.
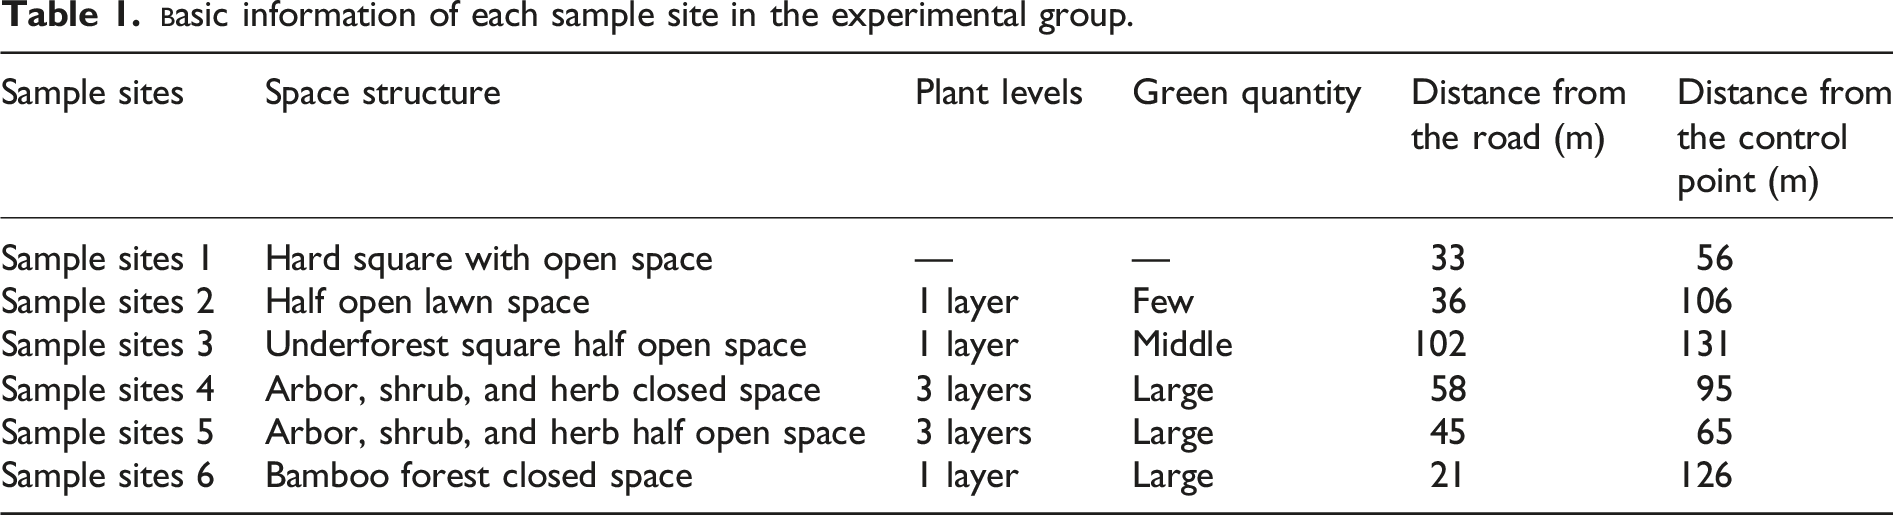
Six sample sites were chosen within the sample park to serve as the experimental group, while a single site was selected at the intersection of a major urban road outside the park to act as the control group. In total, seven points were surveyed, with their specific locations depicted in Figure 2. Sample sites 1–6 constituted the experimental group, each featuring distinct spatial structures that encompassed nearly all spatial types found at the sample site, as well as those common in small-scale green spaces in urban renewal projects. This variety allowed for a more comprehensive assessment of microenvironmental variations across different types of small-scale green spaces. The details for each site in the experimental group are presented in Table 1. Sample site 7 in the control group was situated at the intersection northeast to the sample site. These roads are busy urban arteries with high traffic volumes (7–9 am, 5–7 pm), providing a representative baseline of atmospheric particulate matter pollution experienced by residents in the central urban area. Its proximity to the sample site facilitated a direct comparison of the microenvironments inside and outside the park. Location of sample sites (distances: 50–100 m).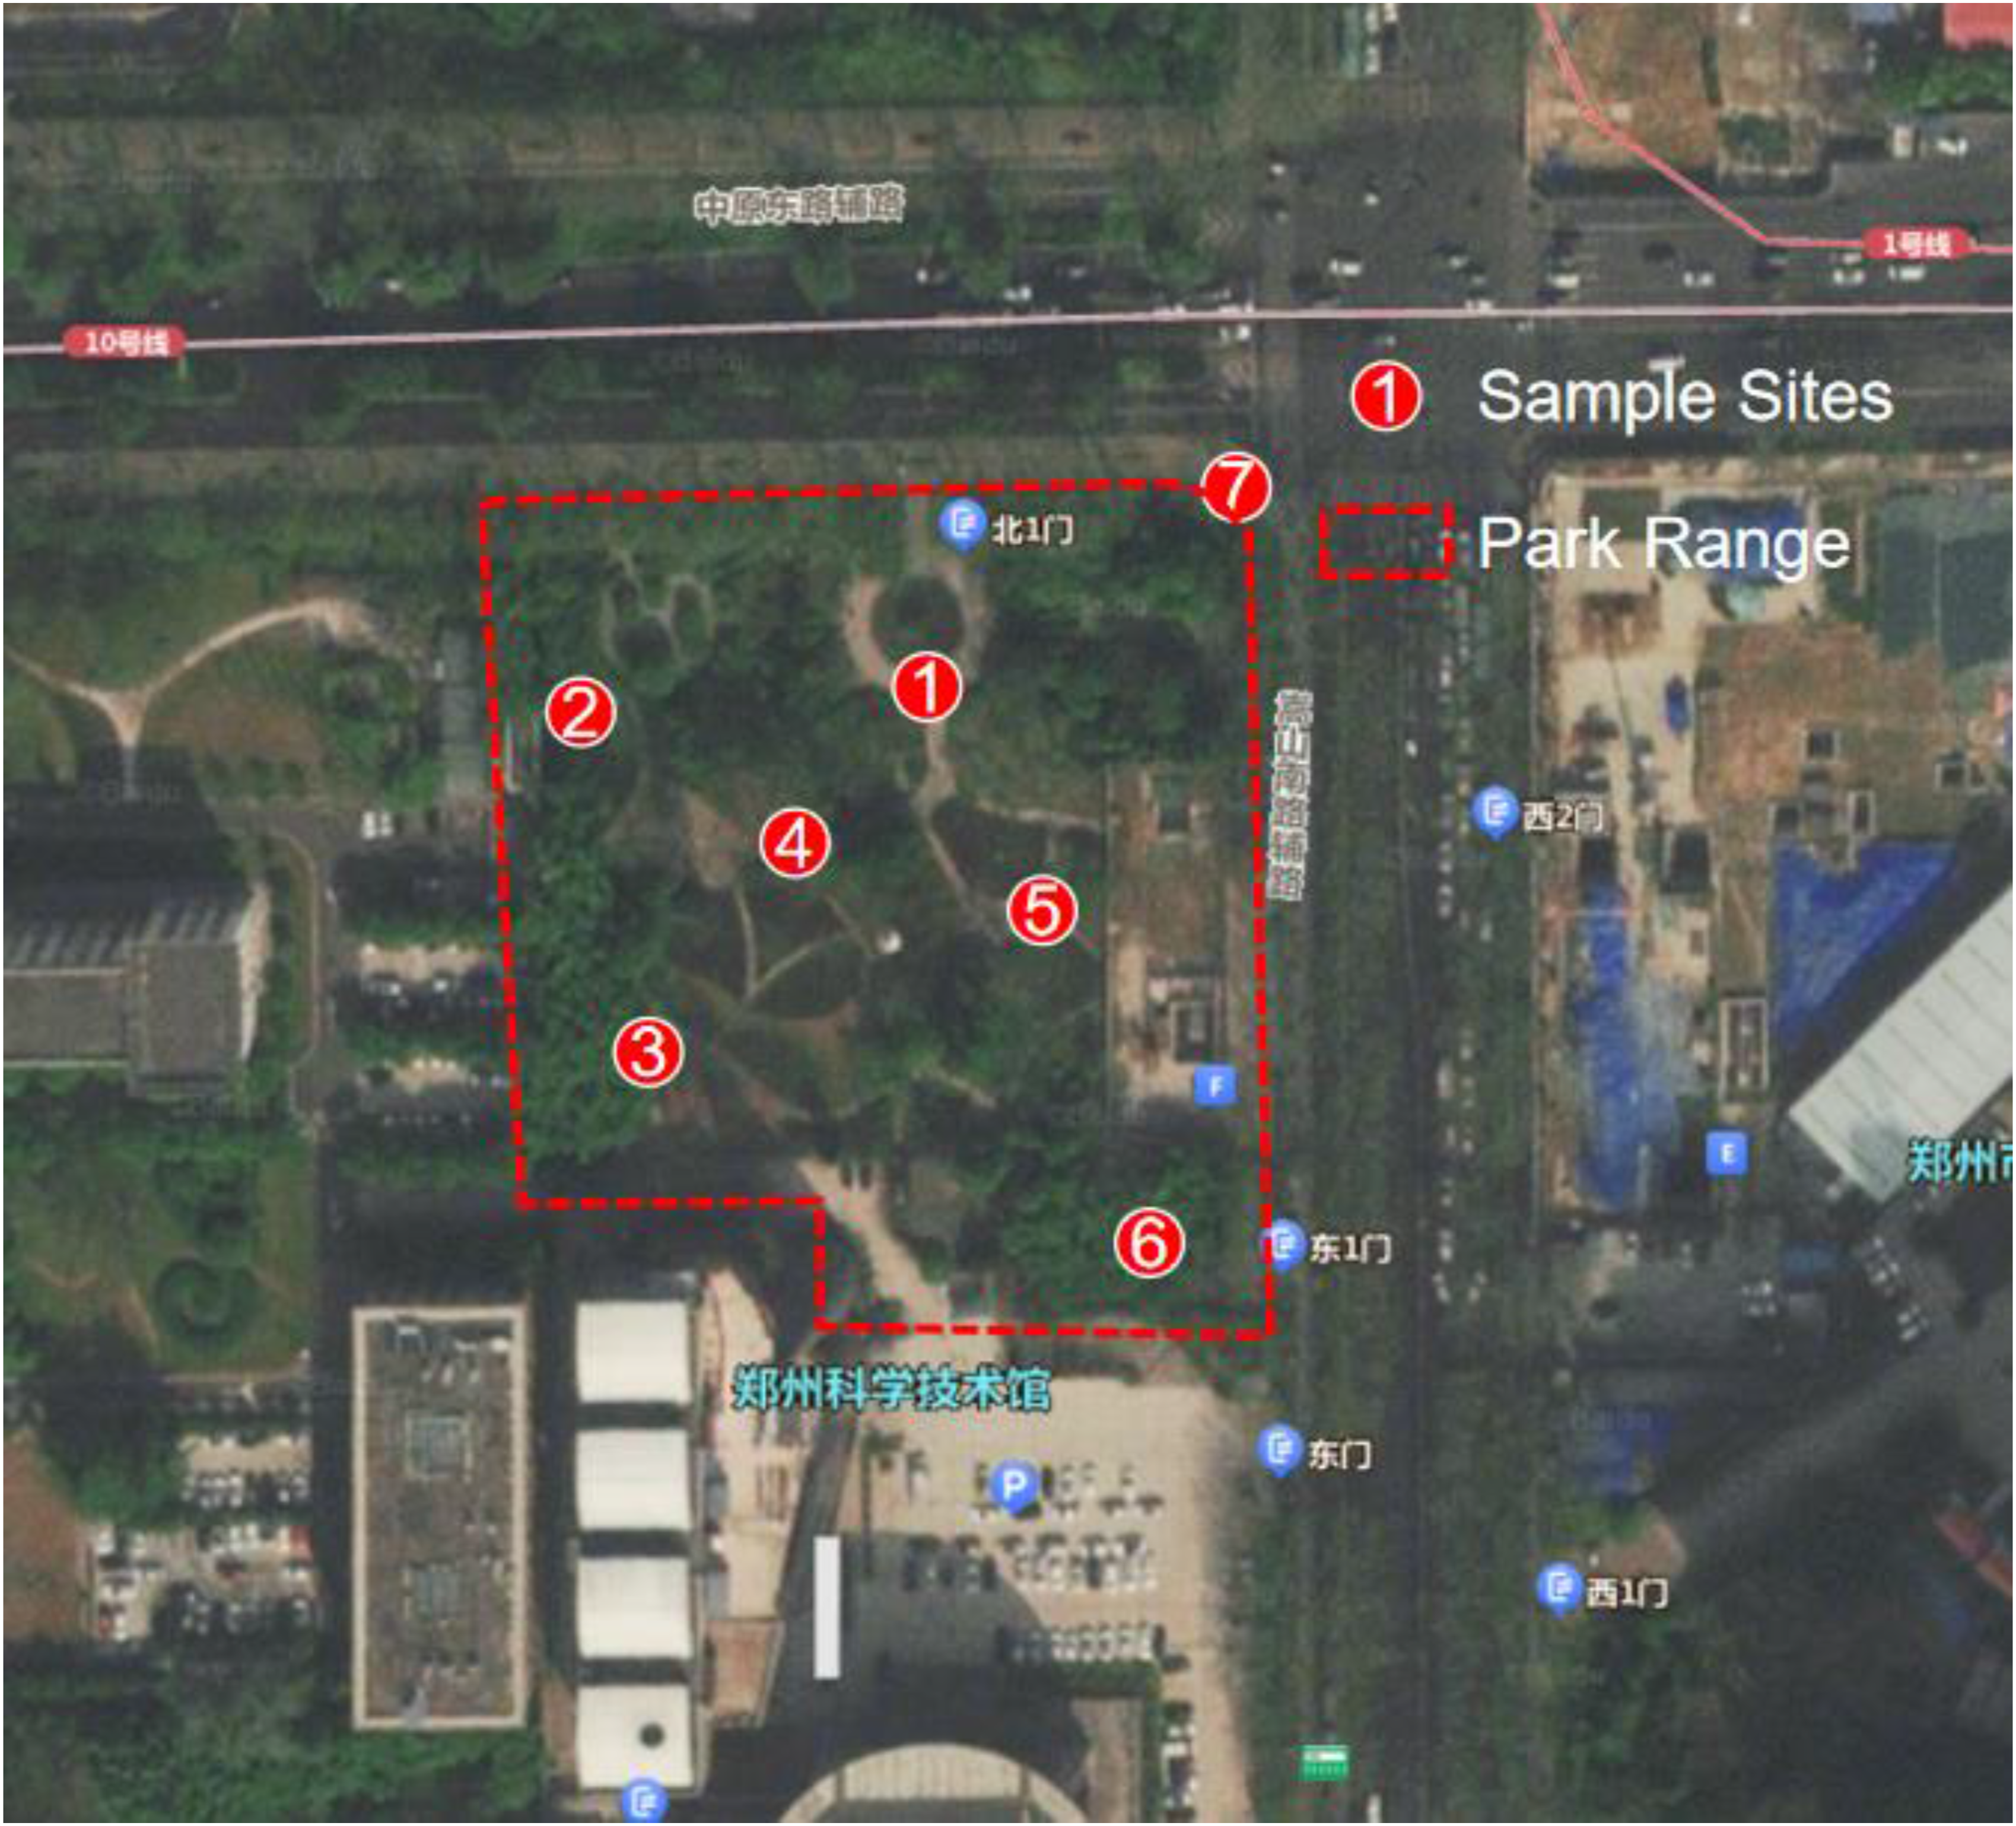
Monitoring methods
The above sample sites were monitored on three separate days in early, mid and late September 2022. The selected days must have either sunny or cloudy weather, with no strong winds: 09–14 (Sunny, 1.6 m/s), 09–21 (Cloudy, 3.1 m/s), 09–28 (Sunny, 1.9 m/s). Data on PM2.5, PM10, temperature, humidity, and wind speed were collected over a 12-h period, from 7 am to 7 pm, once an hour. The measurements were taken at a height of 1.5 m, which corresponded to the average height for human to breathe. The instruments used for these measurements were the Aeroqual Series 500 Particulate Monitor (±0.005 mg/m3 + 15%) and the Kestrel 5500 Anemometer (±2%RH, ±0.5°C, ±3%WS).
Data processing
Measured data were organized and cleaned using Microsoft Excel, addressing missing values and outliers. The processed data were then visualized using Origin software. Statistical analyses, including analysis of variance (ANOVA), correlation analysis, and regression analysis, were performed using IBM SPSS Statistics. The research flowchart of this study is shown in Figure 3. Research methodology flowchart.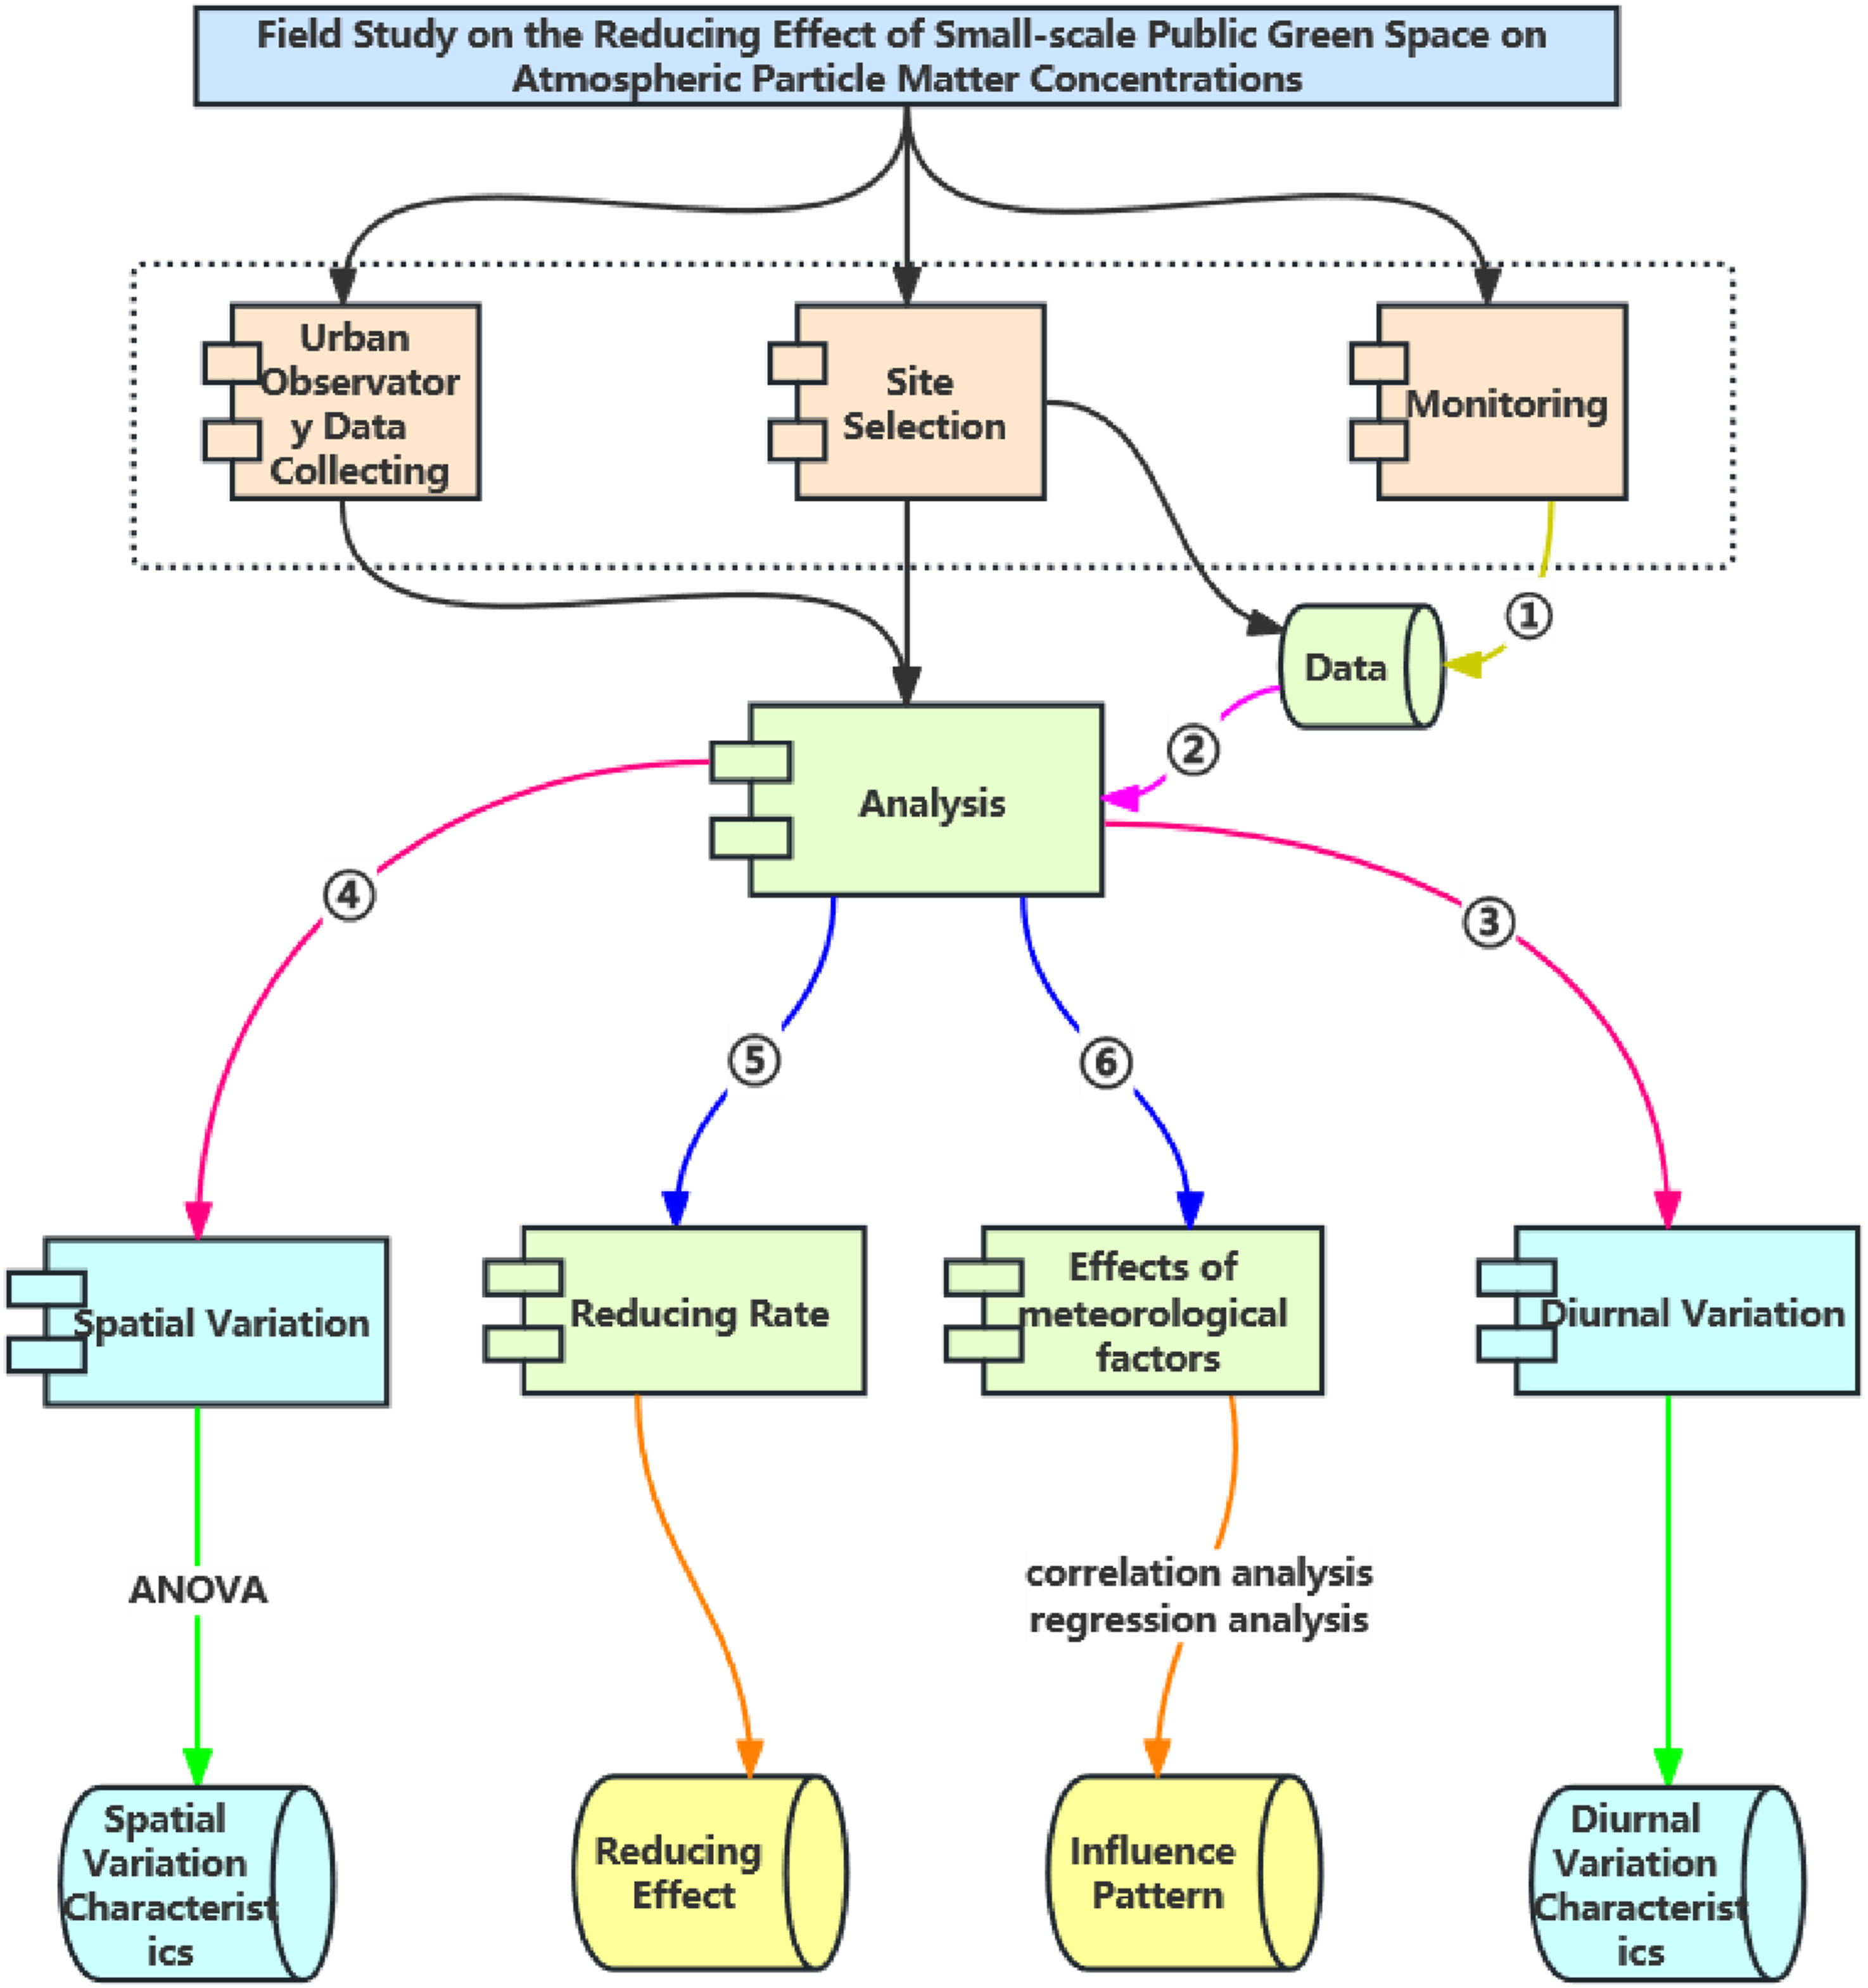
Results and analysis
Diurnal cycle of atmospheric particle matter concentrations
Diurnal cycle of PM2.5 concentrations
Throughout the monitoring period from 7:00 am to 6:00 pm, trends of PM2.5 concentrations at sample sites 1–6 in the experimental group, sample site 7 in the control group, and the nearest urban sample site followed a similar pattern. The diurnal trend typically peaked in the morning, followed by a decline. PM2.5 concentrations during each subsequent period were lower than in the morning. There was a noticeable increase around noon and in the evening, although PM2.5 concentrations in the evening remained lower than at noon. This pattern aligned with typical daily human activities. PM2.5 concentrations were highest during the morning rush hour from 7 to 8 am, at midday from 10 am to 12 pm, and again at 6 pm in the evening, reflecting a pattern of “highest in the morning, second highest at noon, and rising again in the evening,” as depicted in Figure 4. Diurnal cycle of PM2.5 concentrations at each sample site.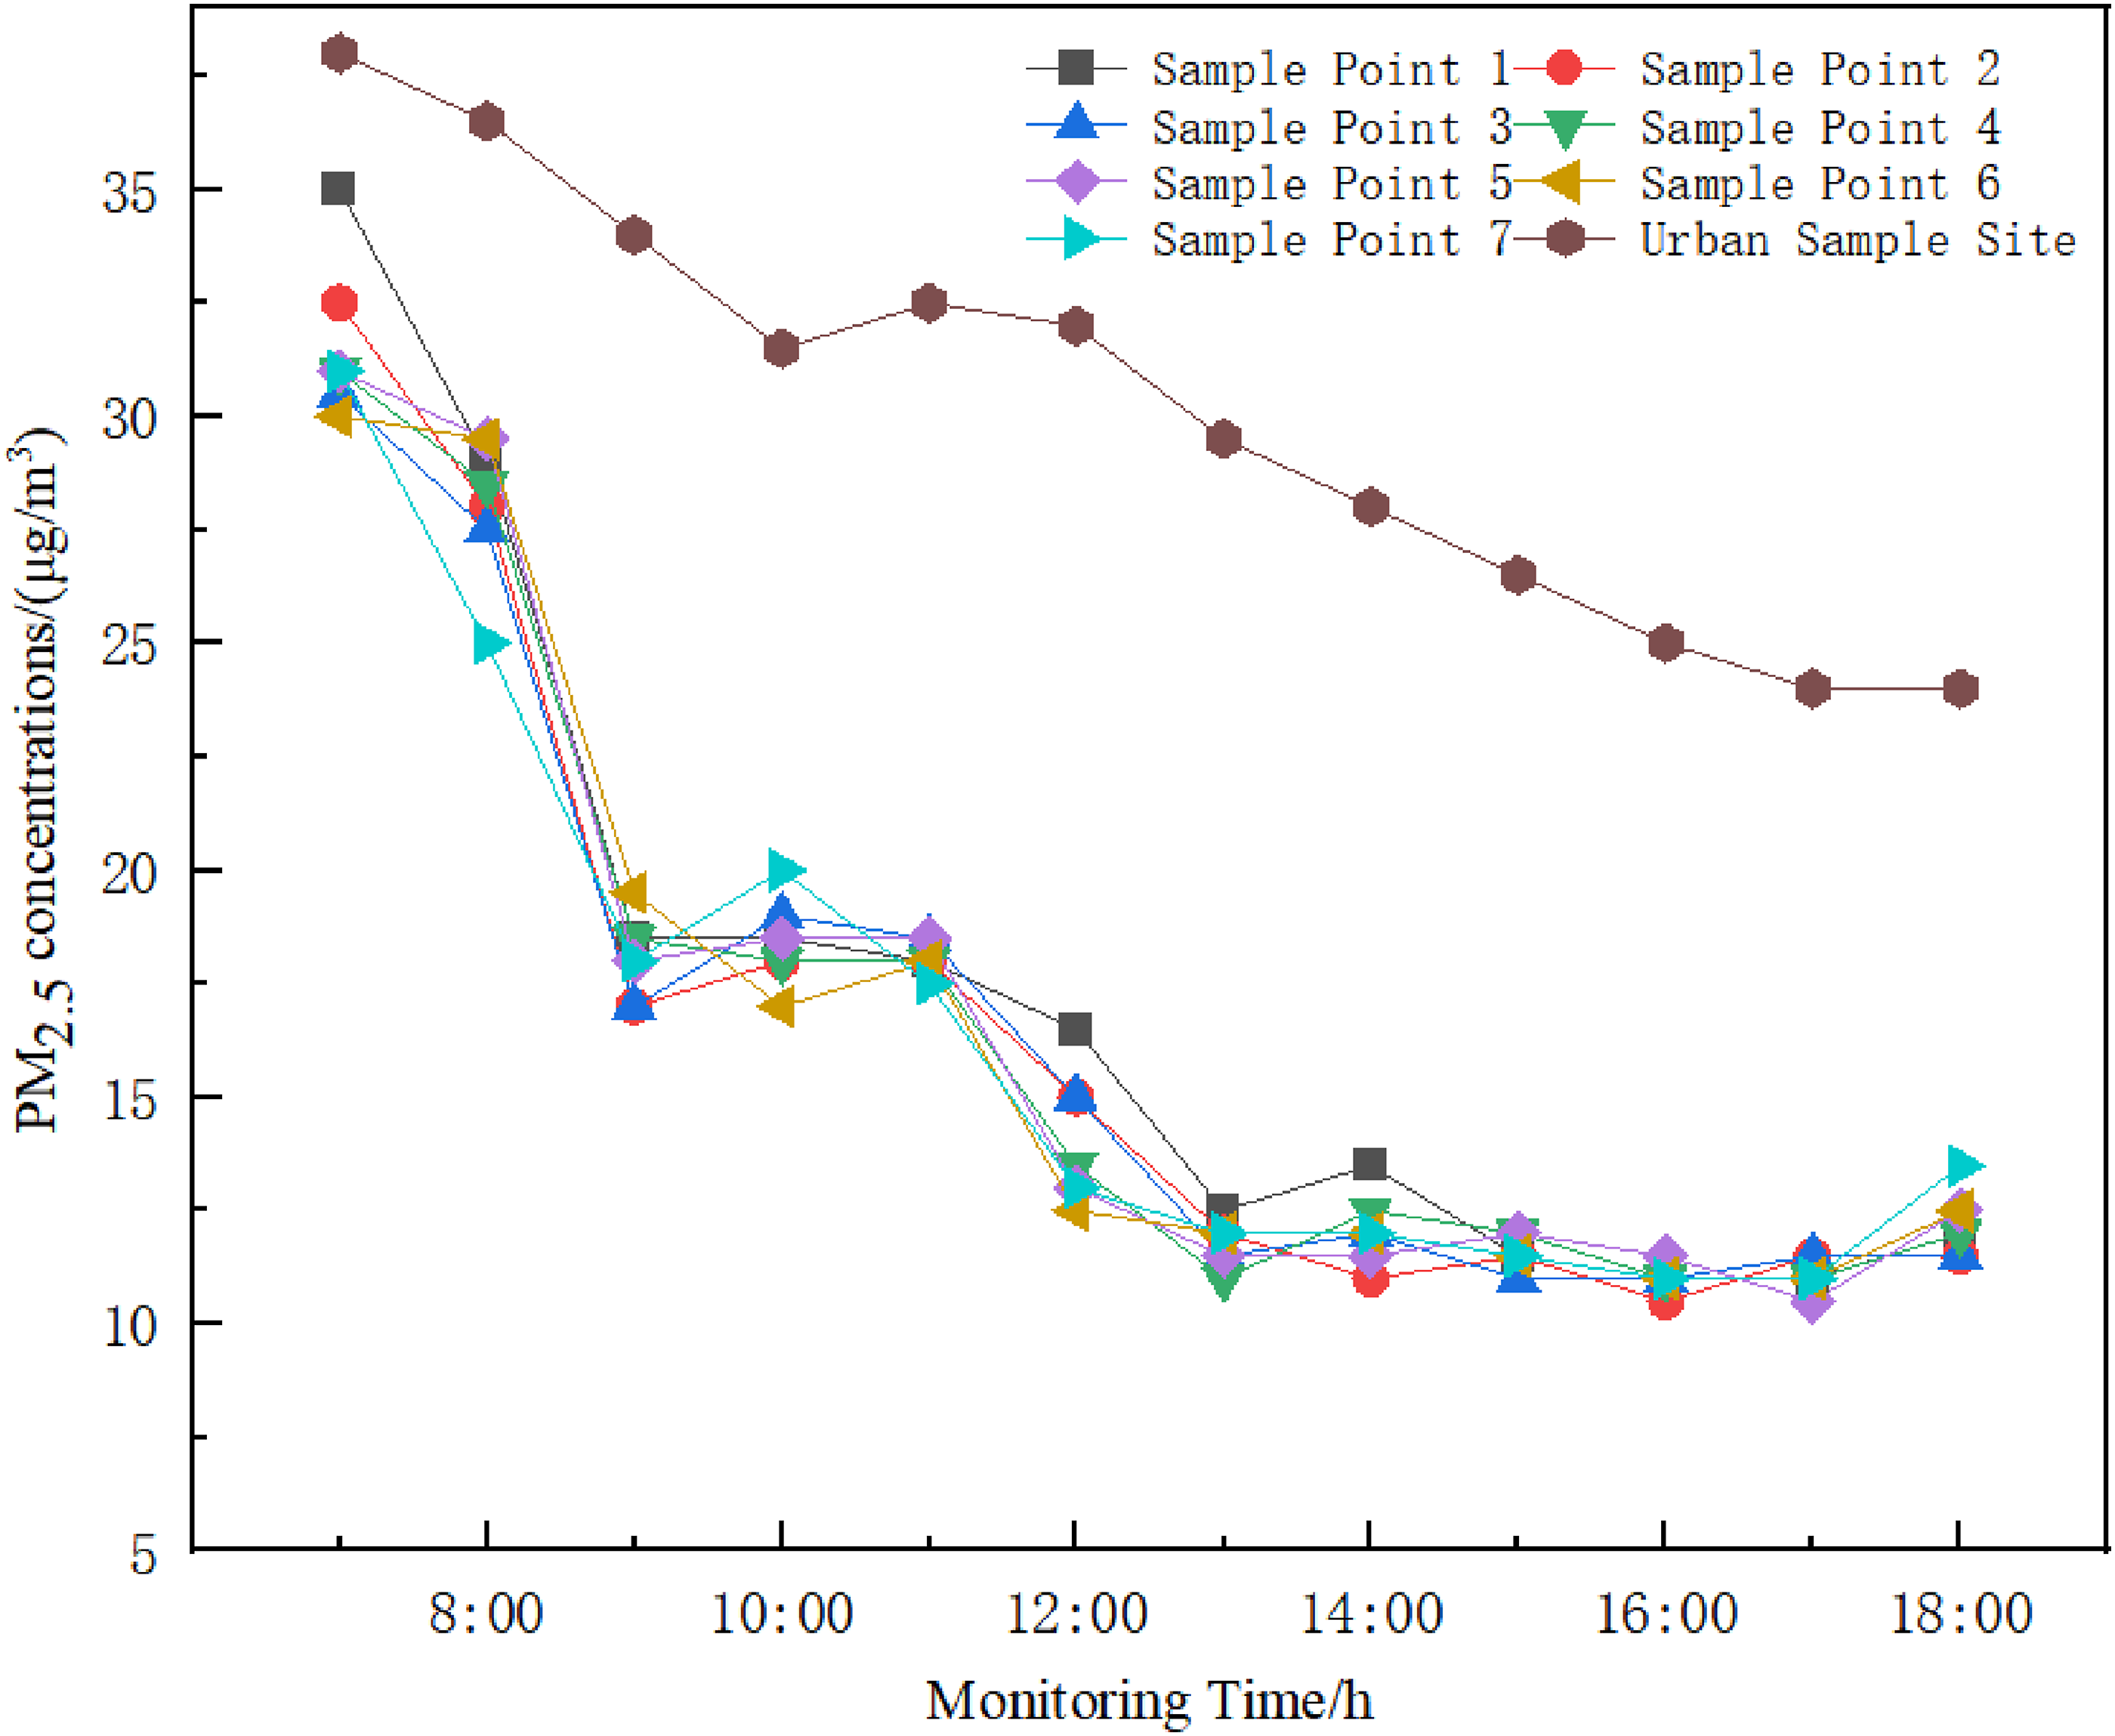
Diurnal cycle of PM10 concentrations
The trends of PM10 concentrations at sample points 1–6 in the experimental group and point 7 in the control group were alike, yet they markedly diverged from the trend at the nearest urban sample site, with anomalies due to incidental factors. The overall PM10 concentrations at sample points 1–7 exhibited a gradual declining pattern: peaking at 7–8 am, leveling off with a minor decrease from 9 am to 12 pm, stabilizing with minor fluctuations from 1 to 5 pm, followed by a subtle ascent and descent at 6 pm, as depicted in Figure 5. Diurnal cycle of PM10 concentrations at each sample site.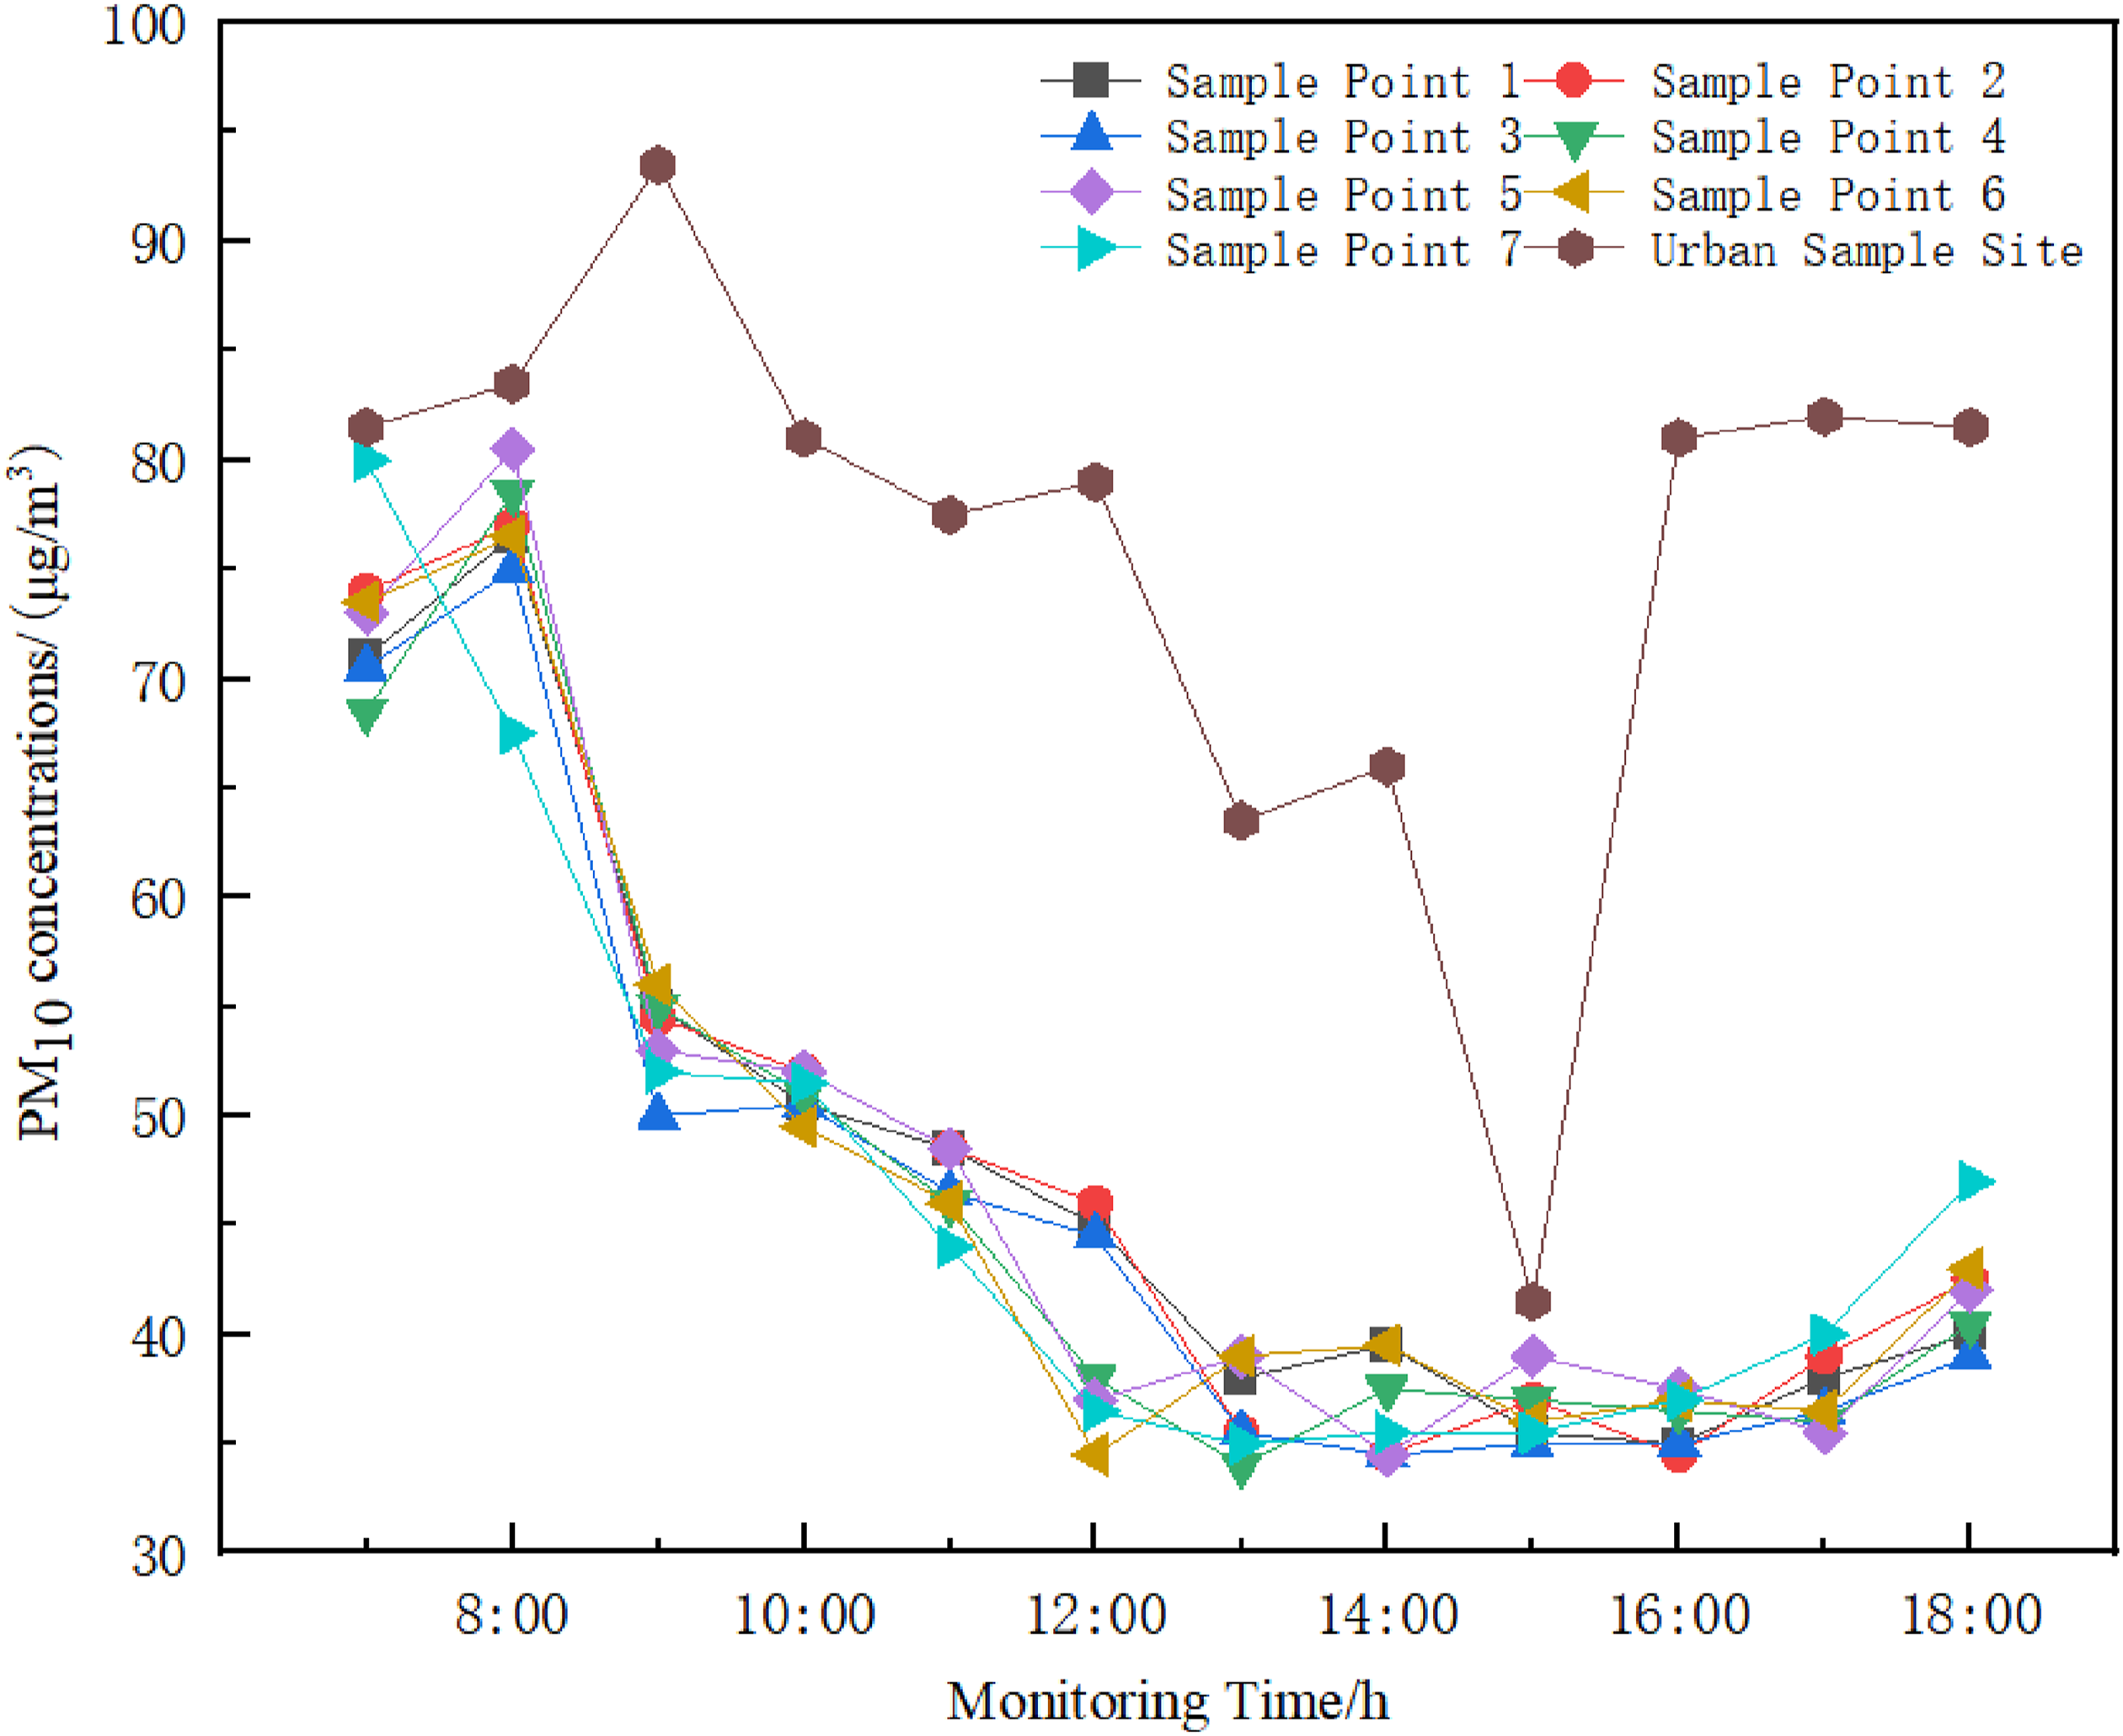
During the observation period, the average PM2.5 and PM10 concentrations at the sample sites in the experimental group and control group, and urban sample sites all remained below the 24-h average concentration limits of 75 μg/m3 and 150 μg/m3, respectively, as set for the second-class ambient air functional zone by the Ambient Air Quality Standard (GB 3095-2012). 20 This indicated that the atmospheric particulate matter concentration was at a low level.
Spatial dynamic changes in atmospheric particle matter concentrations
Spatial dynamic changes in PM2.5 concentrations
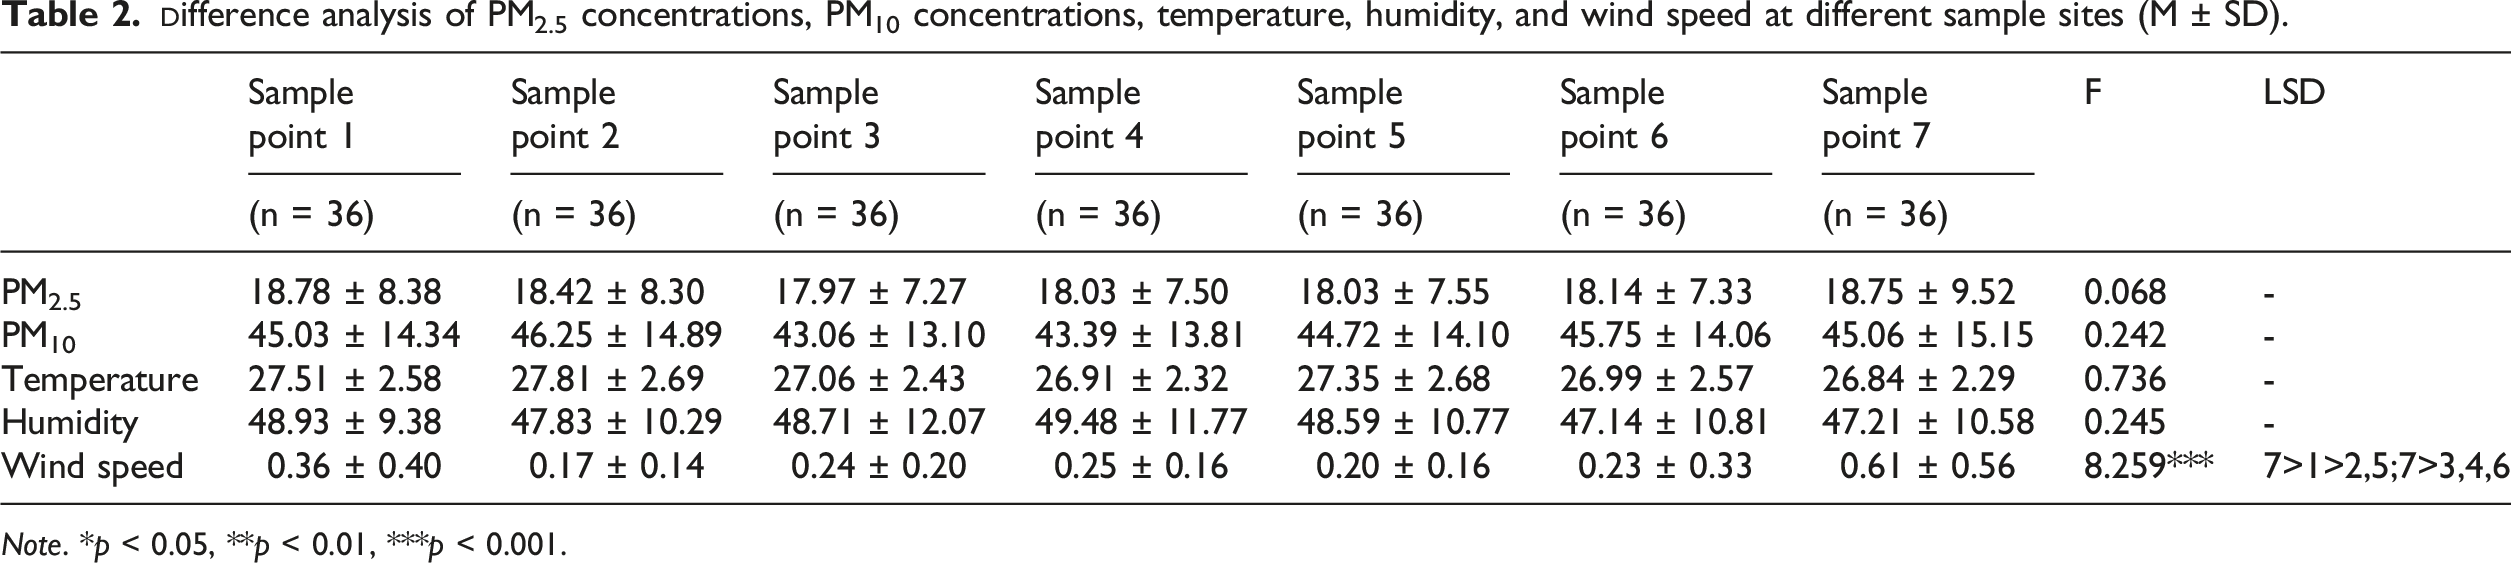
The PM2.5 concentration data from seven sample sites during the observation period were compared and analyzed. It was observed that the PM2.5 concentrations at control site 7 differed slightly from that of the experimental group, as depicted in Figure 6. SPSS software was utilized to conduct a one-way ANOVA on the PM2.5 concentrations at the seven sample sites. The findings, presented in Table 2, p > 0.05, indicating no significant variance in PM2.5 concentrations across the sample sites. This suggested that the PM2.5 concentrations were consistent across the spatial structures within the small-scale green space and the adjacent streets. PM2.5 concentrations at each sample site. Note. *p < 0.05, **p < 0.01, ***p < 0.001.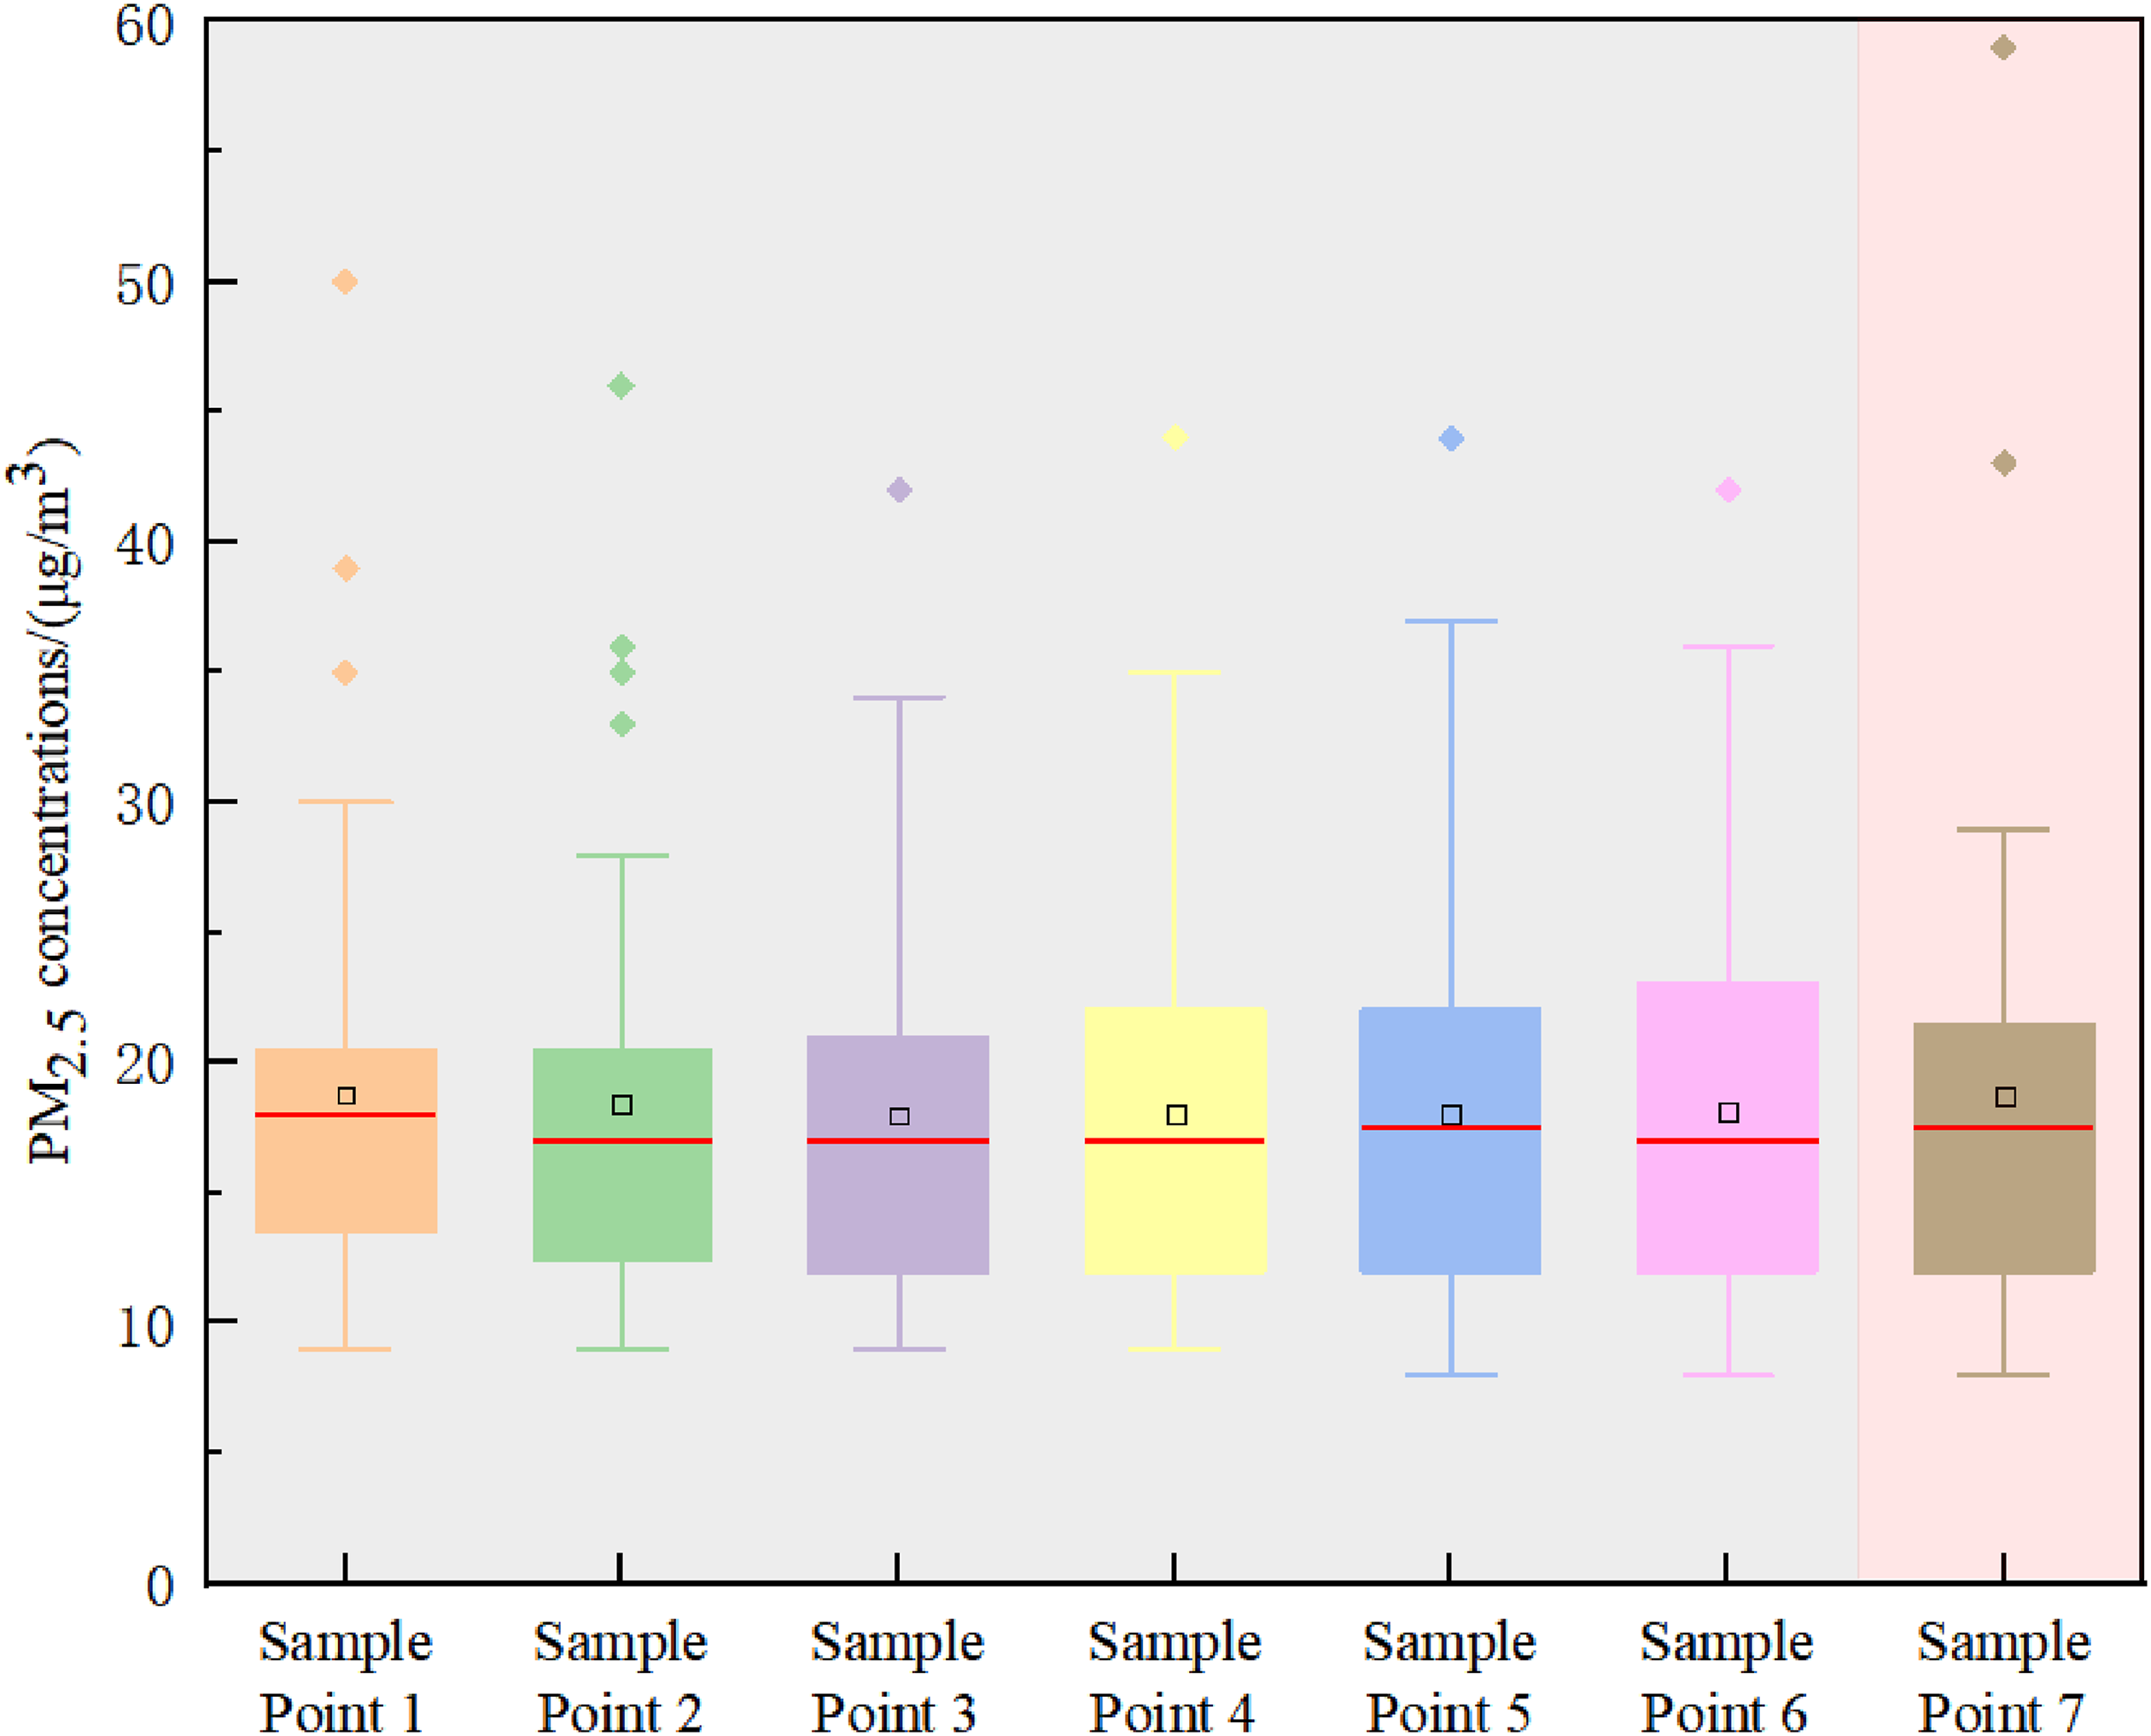
Spatial dynamic changes in PM10 concentrations
The PM10 concentration data from the seven sample sites during the observation period were compared and analyzed. It was observed that the PM10 concentrations at sample site 7 in the control group differed slightly from that of the experimental group, as depicted in Figure 7. SPSS software was utilized to conduct a one-way ANOVA on the PM10 concentrations at the seven sample sites. The findings, presented in Table 2, p > 0.05, indicating no significant differences in PM10 concentrations across the sample sites. This suggested that the PM10 concentrations were consistent across the spatial structures within the small-scale green space and the adjacent streets. PM10 concentrations at each sample site.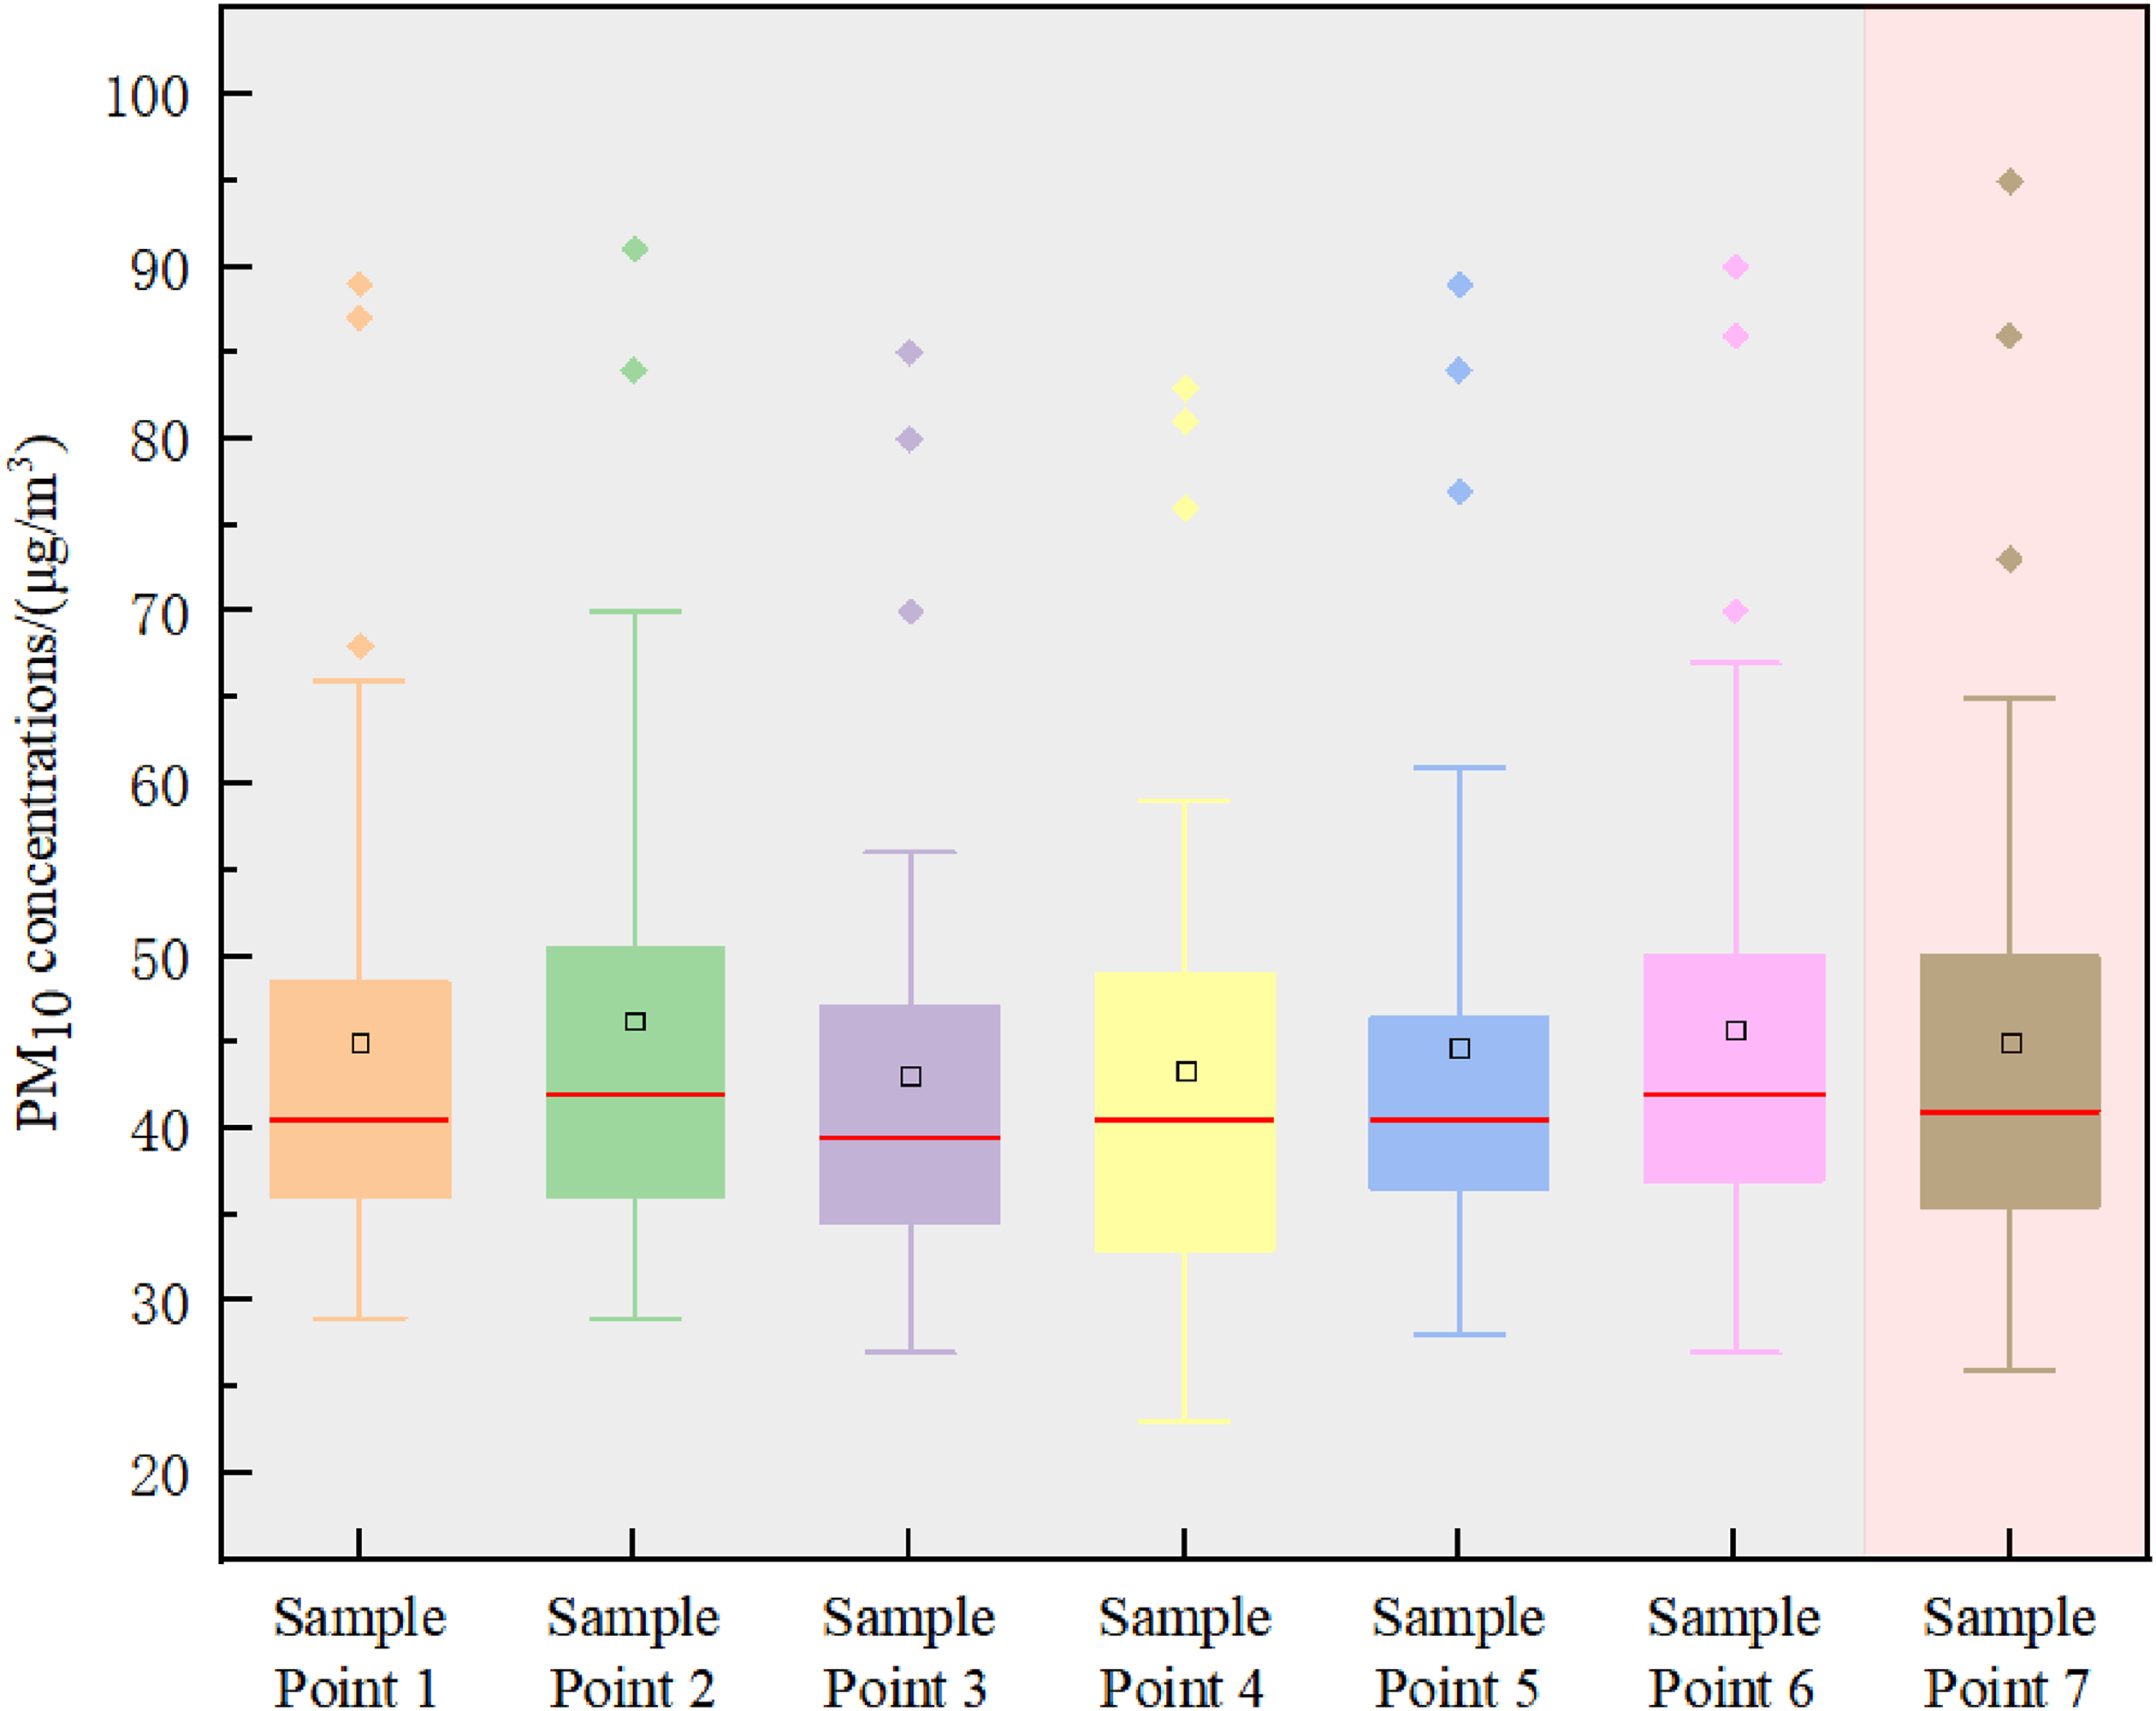
Spatial dynamic changes in meteorological elements
A one-way ANOVA conducted in SPSS on the observation data for temperature, humidity, and wind speed at seven sample sites revealed the following results, as displayed in Table 2. Temperature and humidity showed no significant differences (p > 0.05); however, wind speed differed significantly across the seven sample sites, with F (6, 107) = 4.6, MSE = 0.099, p < 0.05, r = 0.41.
Multiple comparisons revealed that the wind speed at sample site 7 in the control group was markedly higher than at any sample site in the experimental group, and the wind speed at sample site 1 was significantly greater than at sample sites 2 and 5. These findings indicated that wind speeds within the green space were substantially lower than at the plant-free intersection selected in the control group. Wind speed in the small-scale green space appeared to be less influenced by the enclosed and open spatial structures created by the layers of greenery, and more by location. Specifically, wind speeds were lower in corners than in central areas.
Reducing effect of small-scale public green space on atmospheric particle matter concentration
The calculation formula for PM2.5and PM10 reducing rate is:
The daily average reducing rates of PM2.5 and PM10 concentrations at the six sample sites during the observation period were compared and analyzed, with the results displayed in Figure 8. The reducing rates of PM2.5 concentrations are ranked in descending order as follows: sample site 3 > sample site 4 = sample site 5 > sample site 6 > sample site 2 > sample site 1. This can be translated into the following order of effectiveness: semi-open space in square under the shade of trees > closed space of trees, shrubs and grass = semi-open space of trees, shrubs and grass > closed space of bamboo forest > semi-open space of lawn > open space in a hard-surface square. Similarly, the reducing rates of PM10 concentrations are ranked from highest to lowest as: sample site 3 > sample site 4 > sample site 5 > sample site 1 > sample site 6 > sample site 2, corresponding to semi-open space square under the shade of trees > closed space of trees, shrubs and grass > semi-open space of trees, shrubs and grass > open space in a hard-surface square > closed space of bamboo forest > semi-open space of lawn. In small-scale public green spaces, the reducing effect of both PM2.5 and PM10 concentrations is associated with the proximity to the pollution source and the density of the spatial canopy. Reducing rate of PM2.5and PM10 concentrations at each sample site.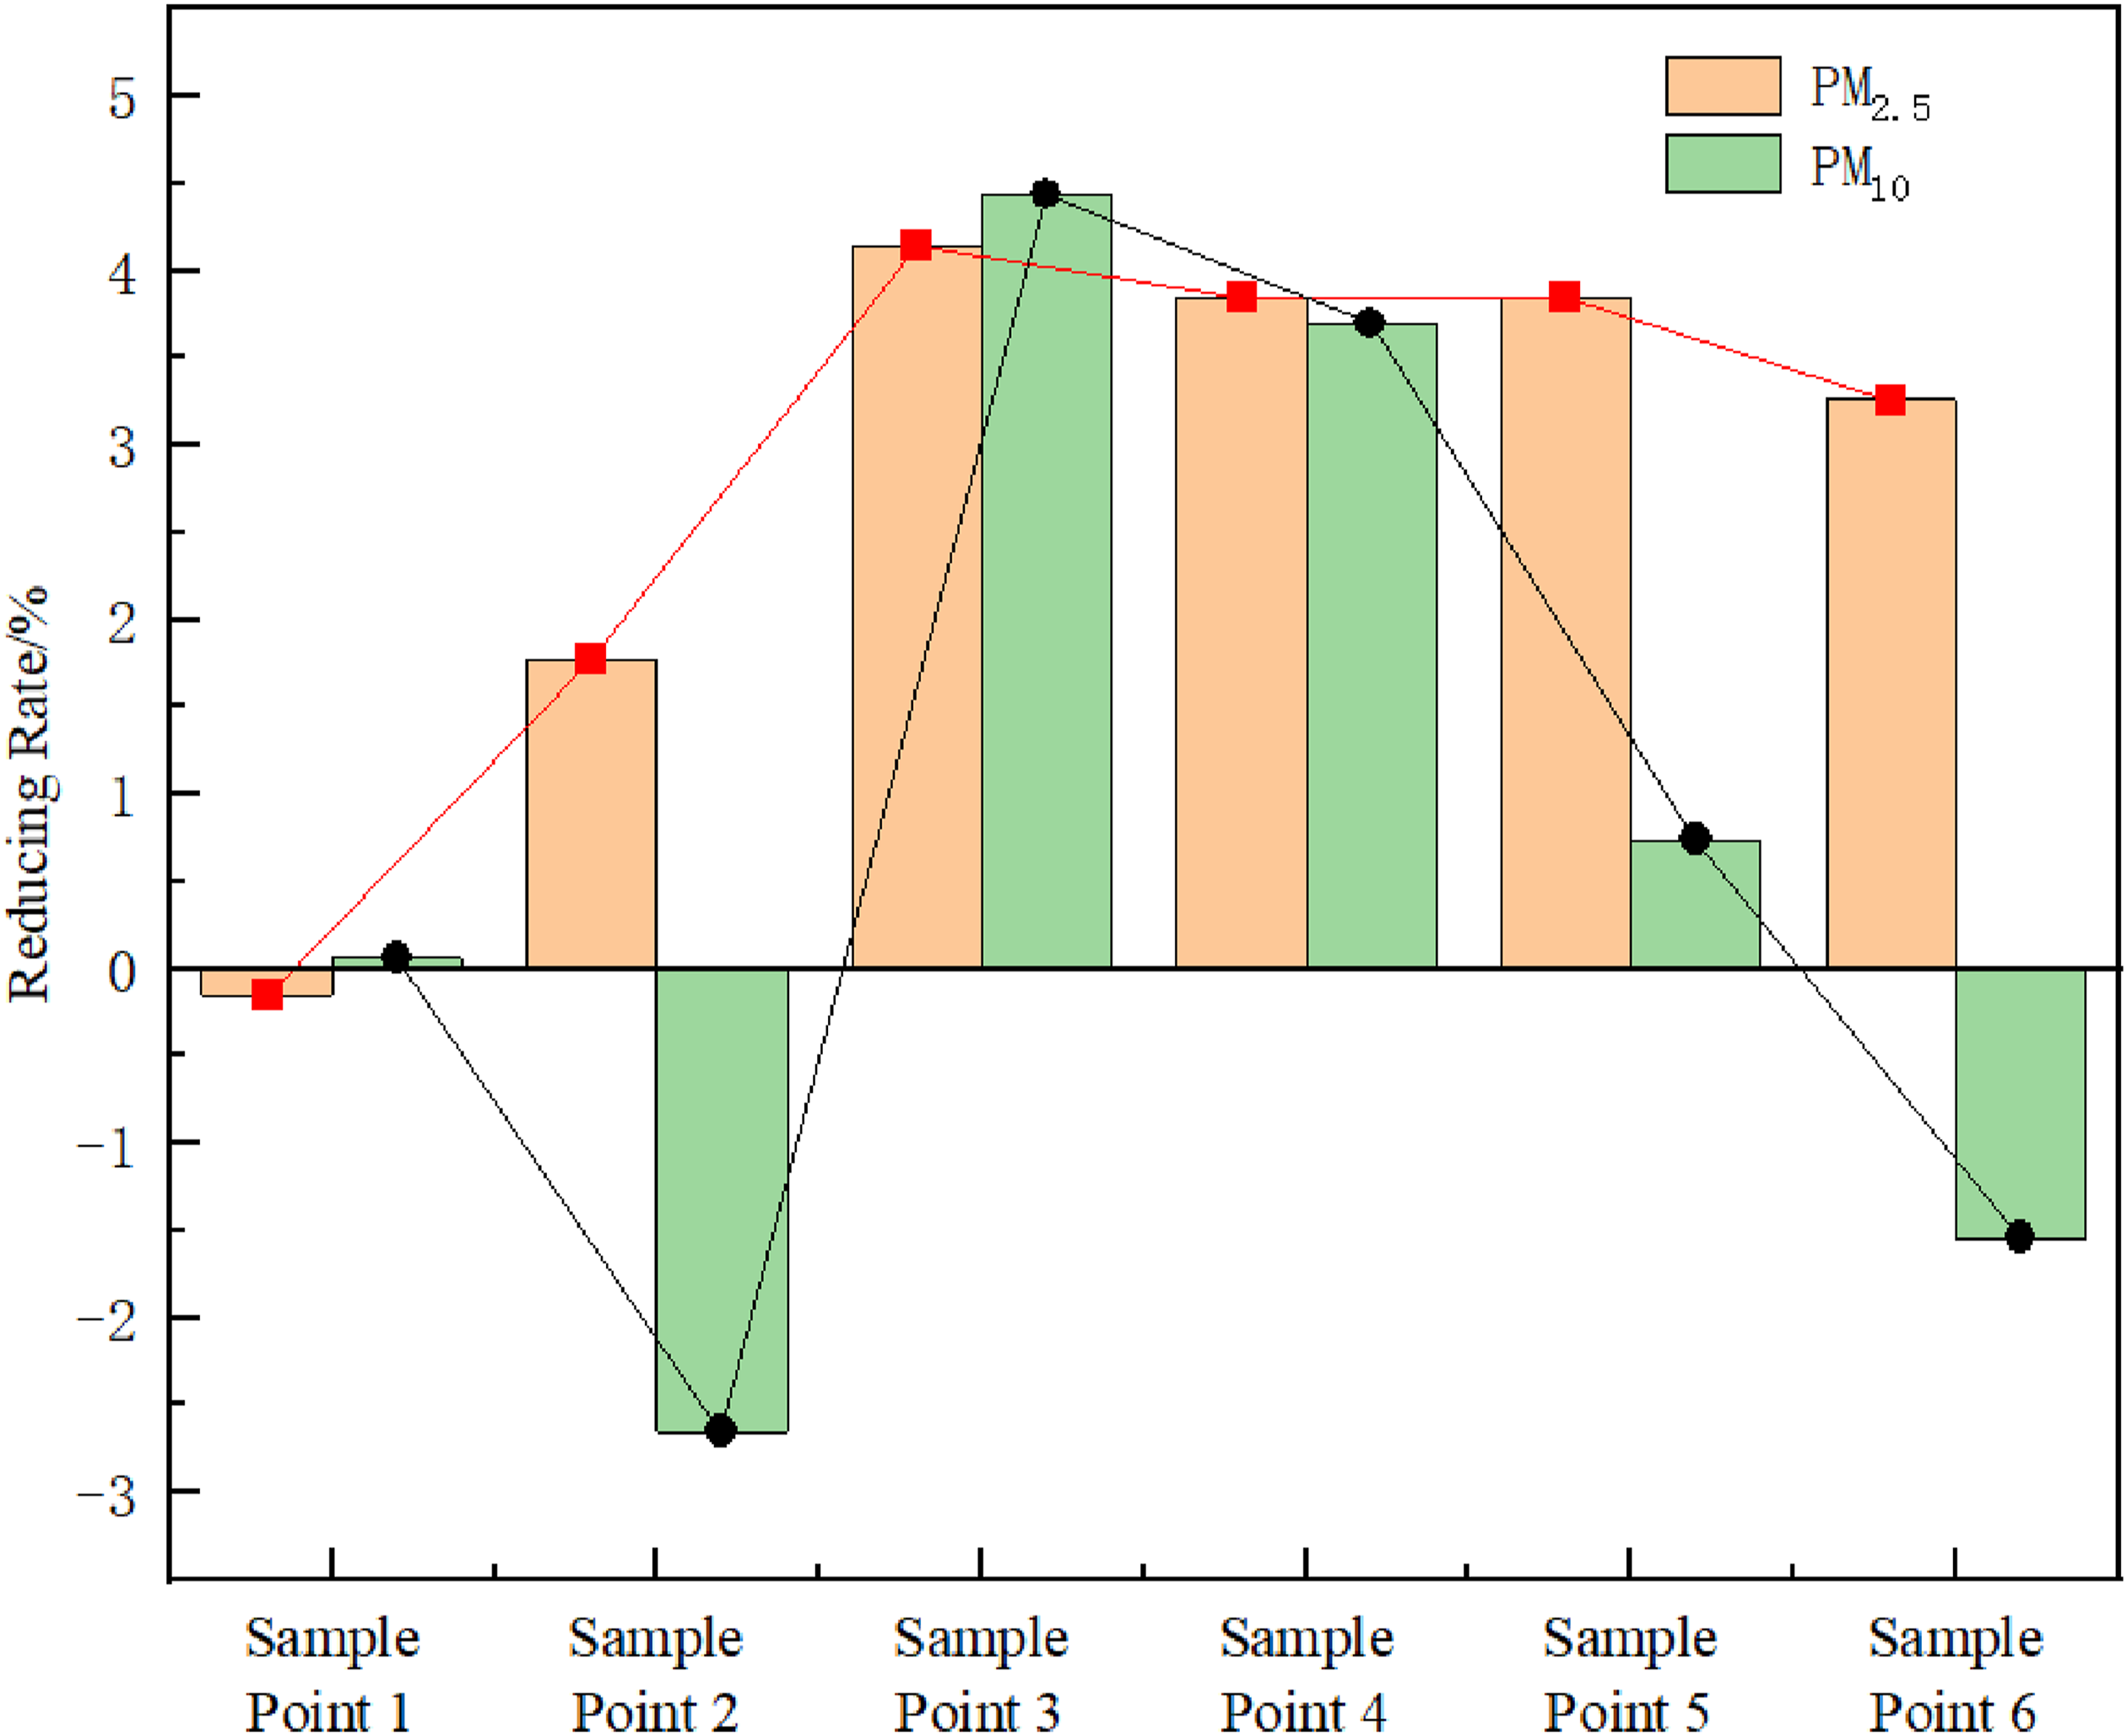
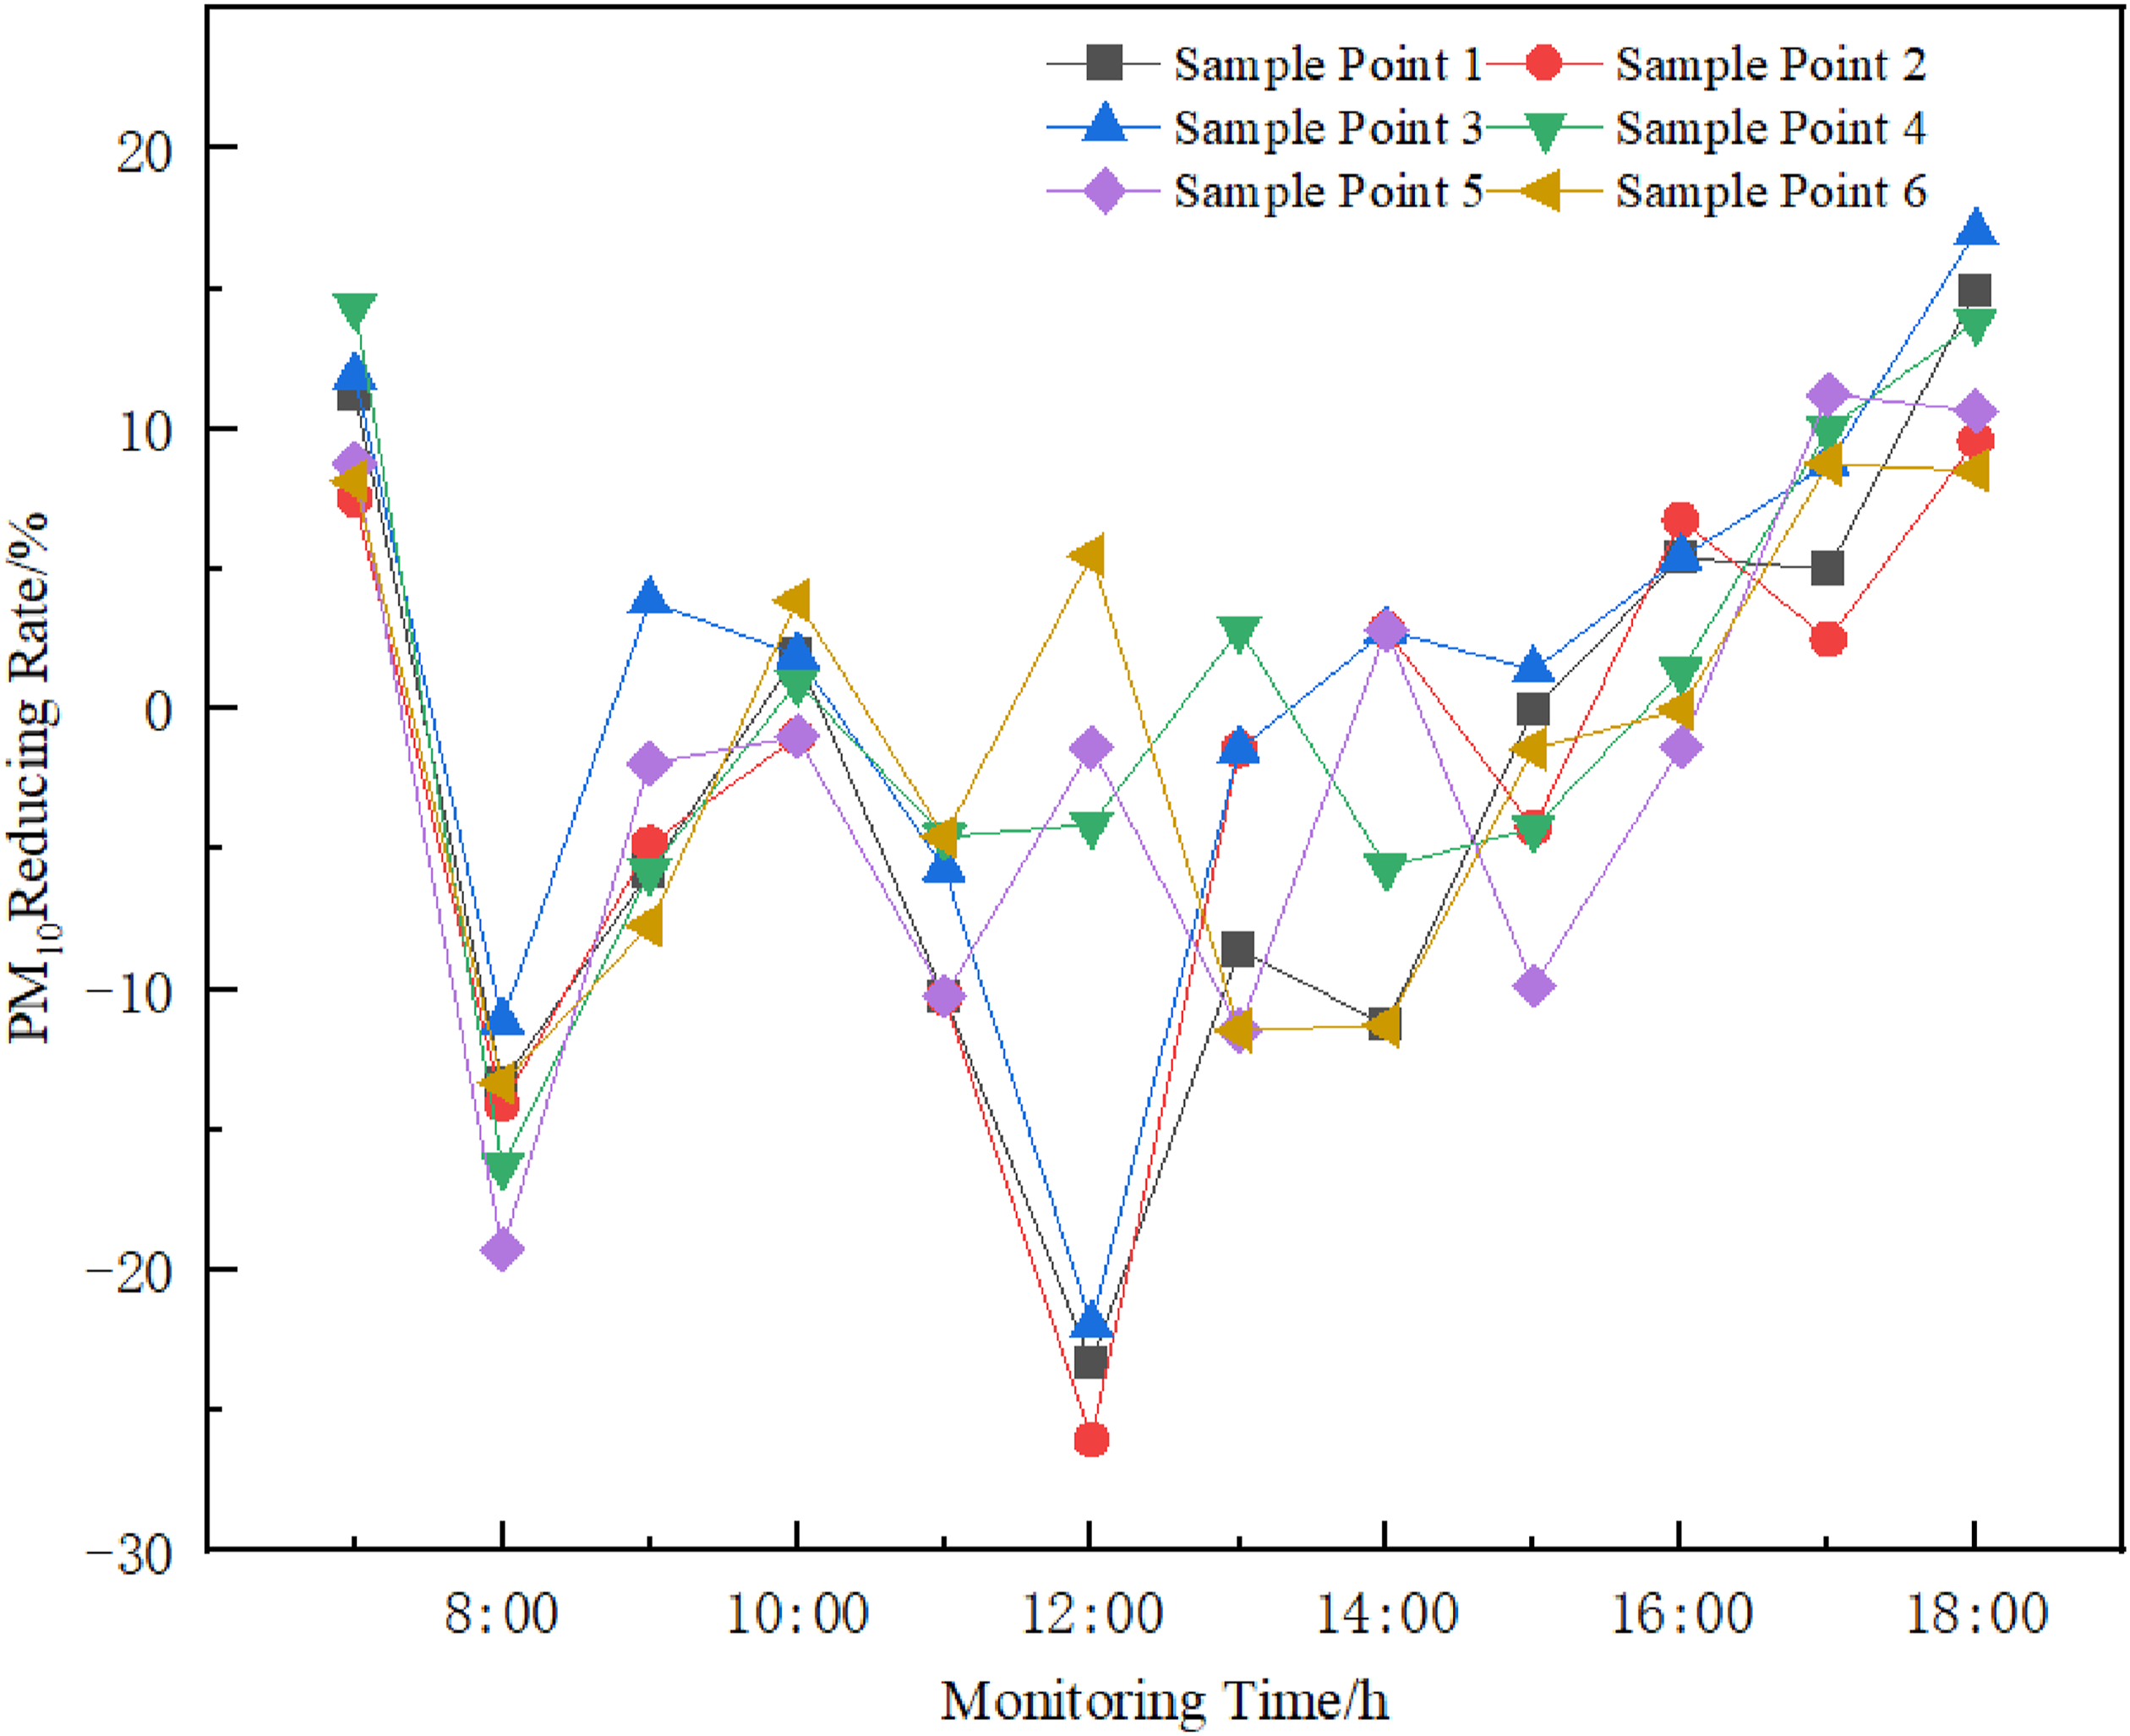
A comparative analysis on the diurnal cycle of the reducing rates of PM2.5 and PM10 concentrations at six sample sites within the sample plot revealed varying rates at different times, as depicted in Figures 9 and 10. The reducing effect on PM2.5 concentrations was more effective at 10 a.m. and 6 pm, while the reducing effect on PM10 concentrations peaked at 7 am and again at 5 and 6 pm. This suggested that the atmospheric particle matter concentrations in small-scale public green spaces were lower than those on surrounding roads during these times, making them more conducive to vigorous aerobic activities. Conversely, the reducing effect on PM2.5 and PM10 concentrations was less effective at 8 am, indicating higher atmospheric particle matter concentrations in these green spaces compared to adjacent roads, thus rendering them less suitable for intense aerobic activities. Diurnal cycle of the reducing rate of PM2.5 concentrations at each sample site. Diurnal cycle of the reducing rate of PM10 concentrations at each sample site.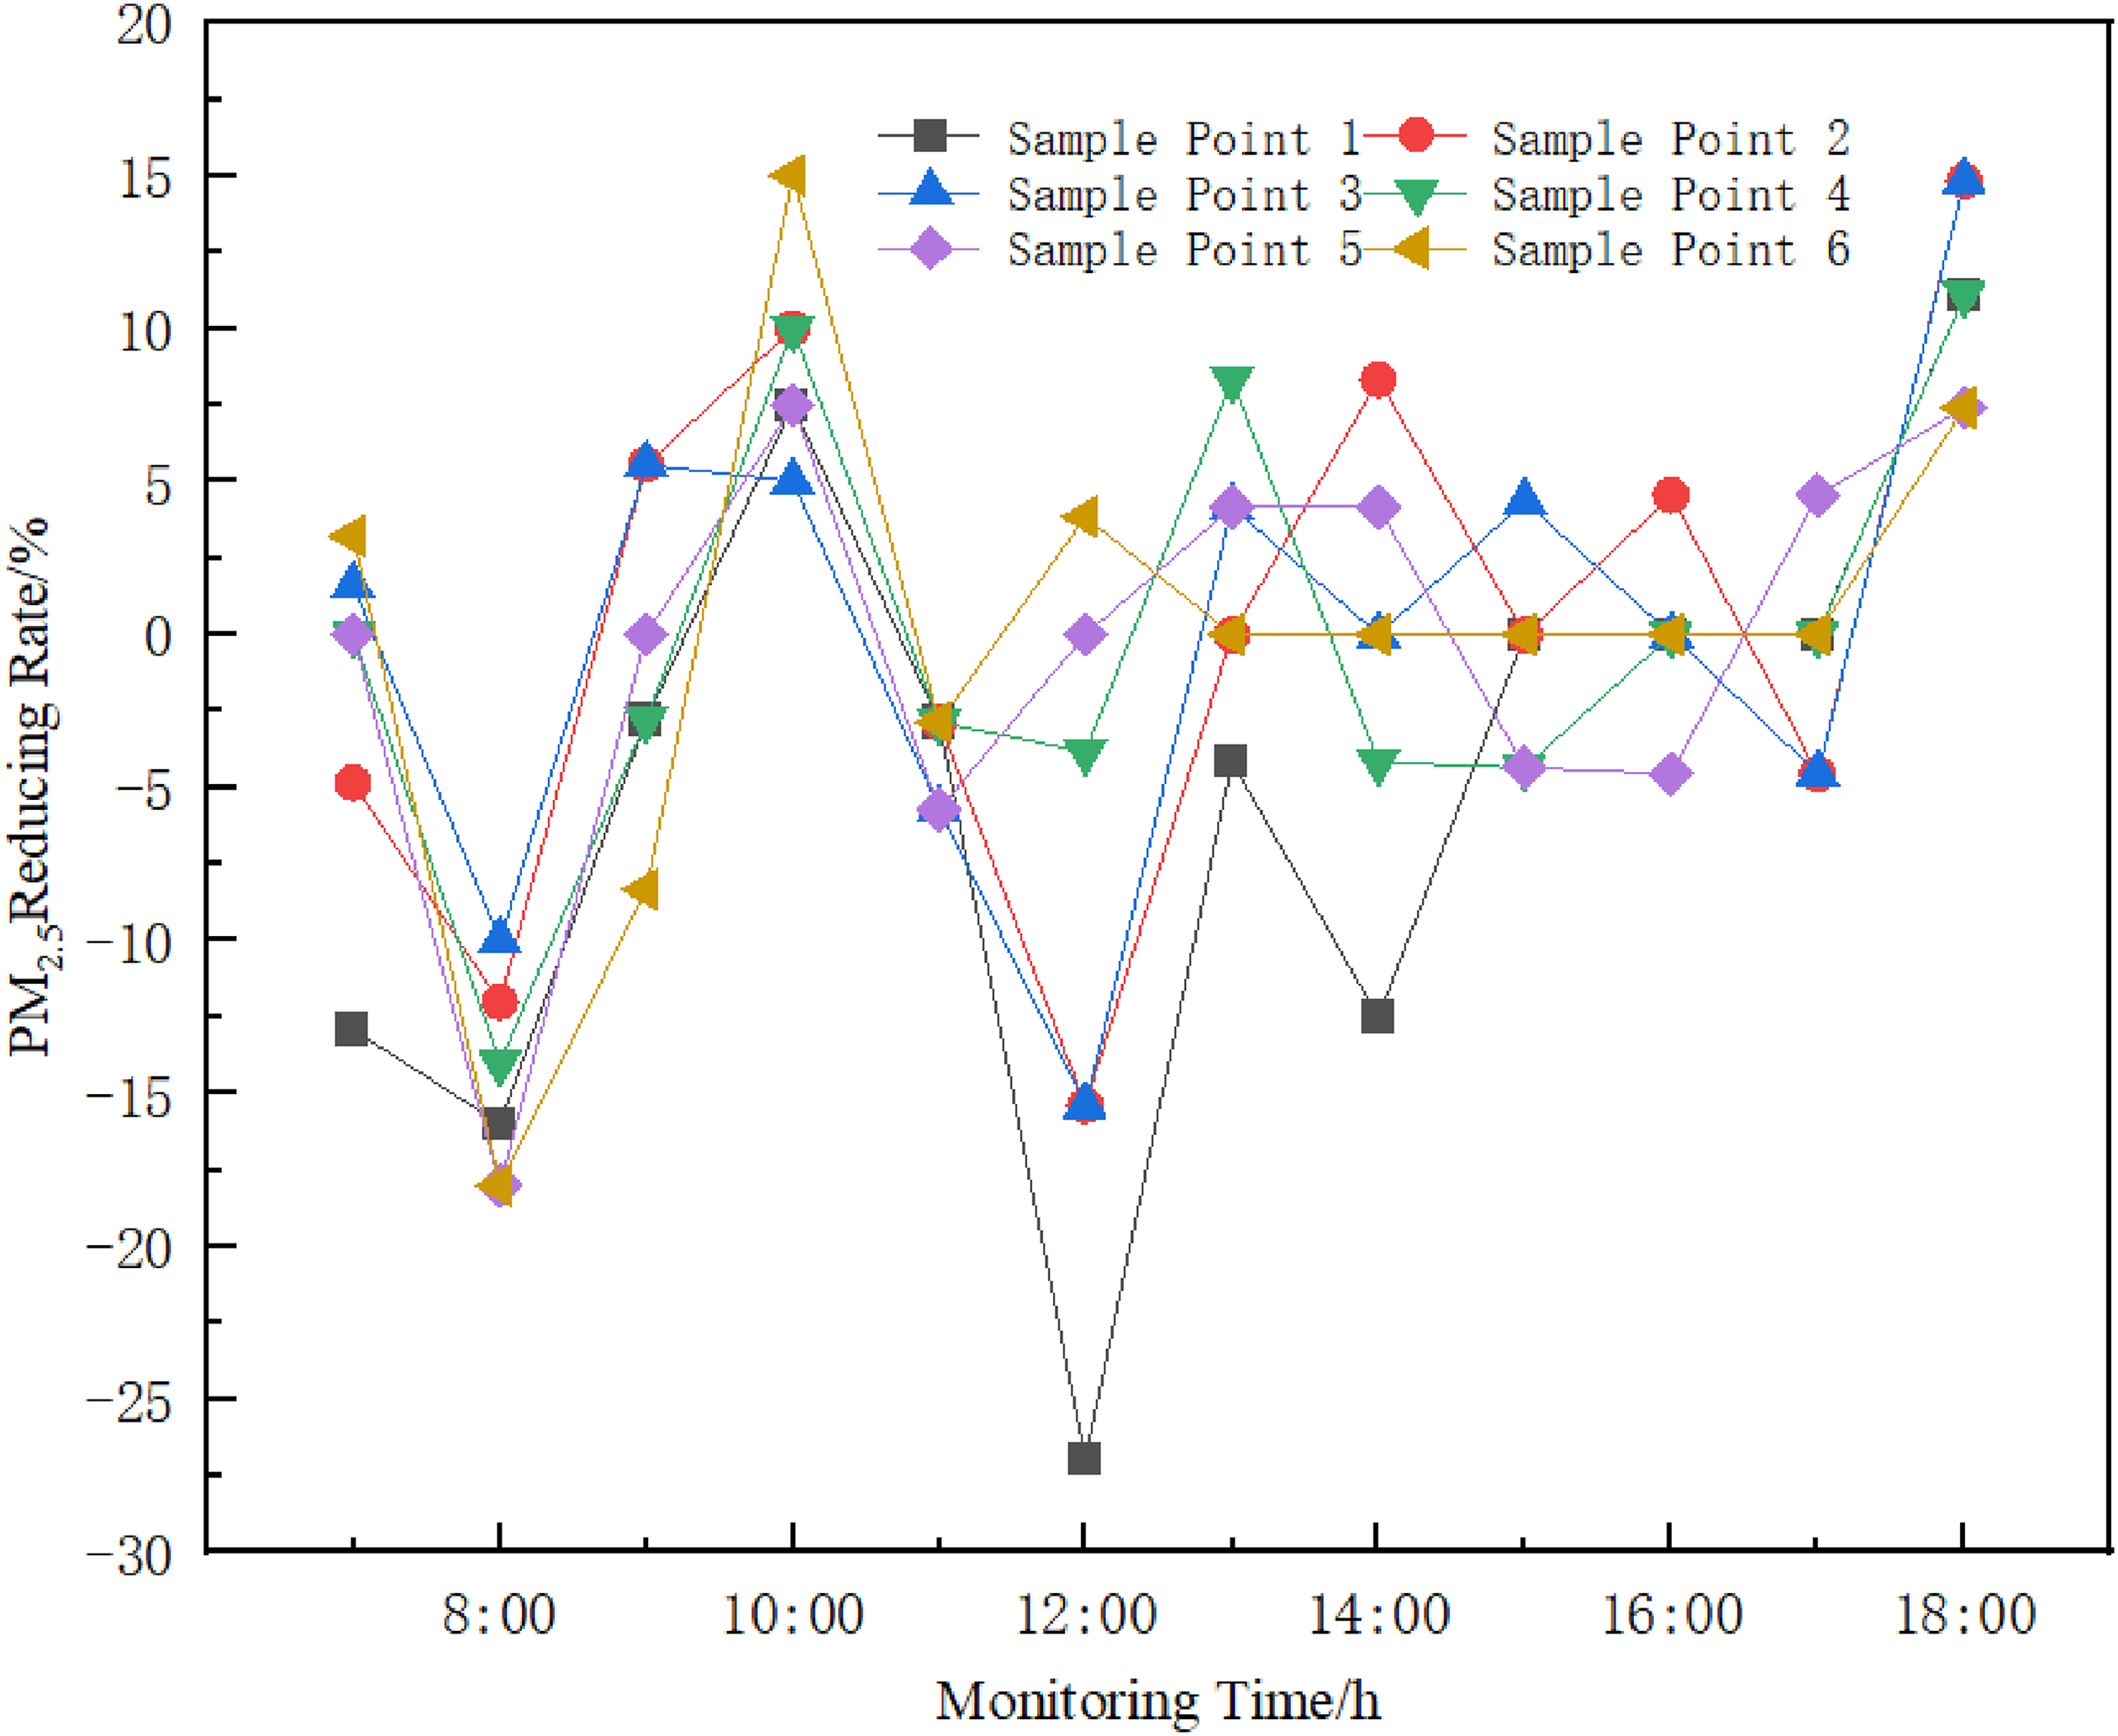
Effects of meteorological factors on atmospheric particle matter concentrations
Correlation test between PM2.5 concentrations, PM10 concentrations and temperature, humidity, wind speed (r).
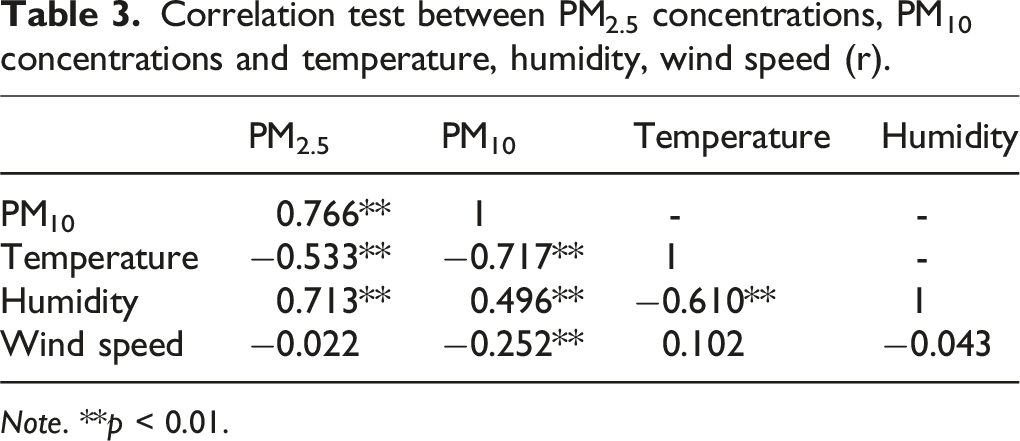
Note. **p < 0.01.
Summary of PM2.5 concentrations regression model.
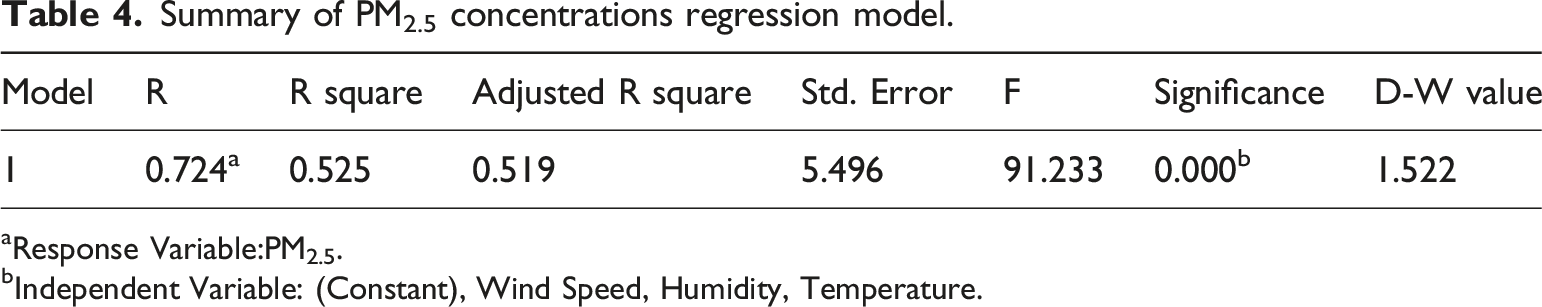
aResponse Variable:PM2.5.
bIndependent Variable: (Constant), Wind Speed, Humidity, Temperature.
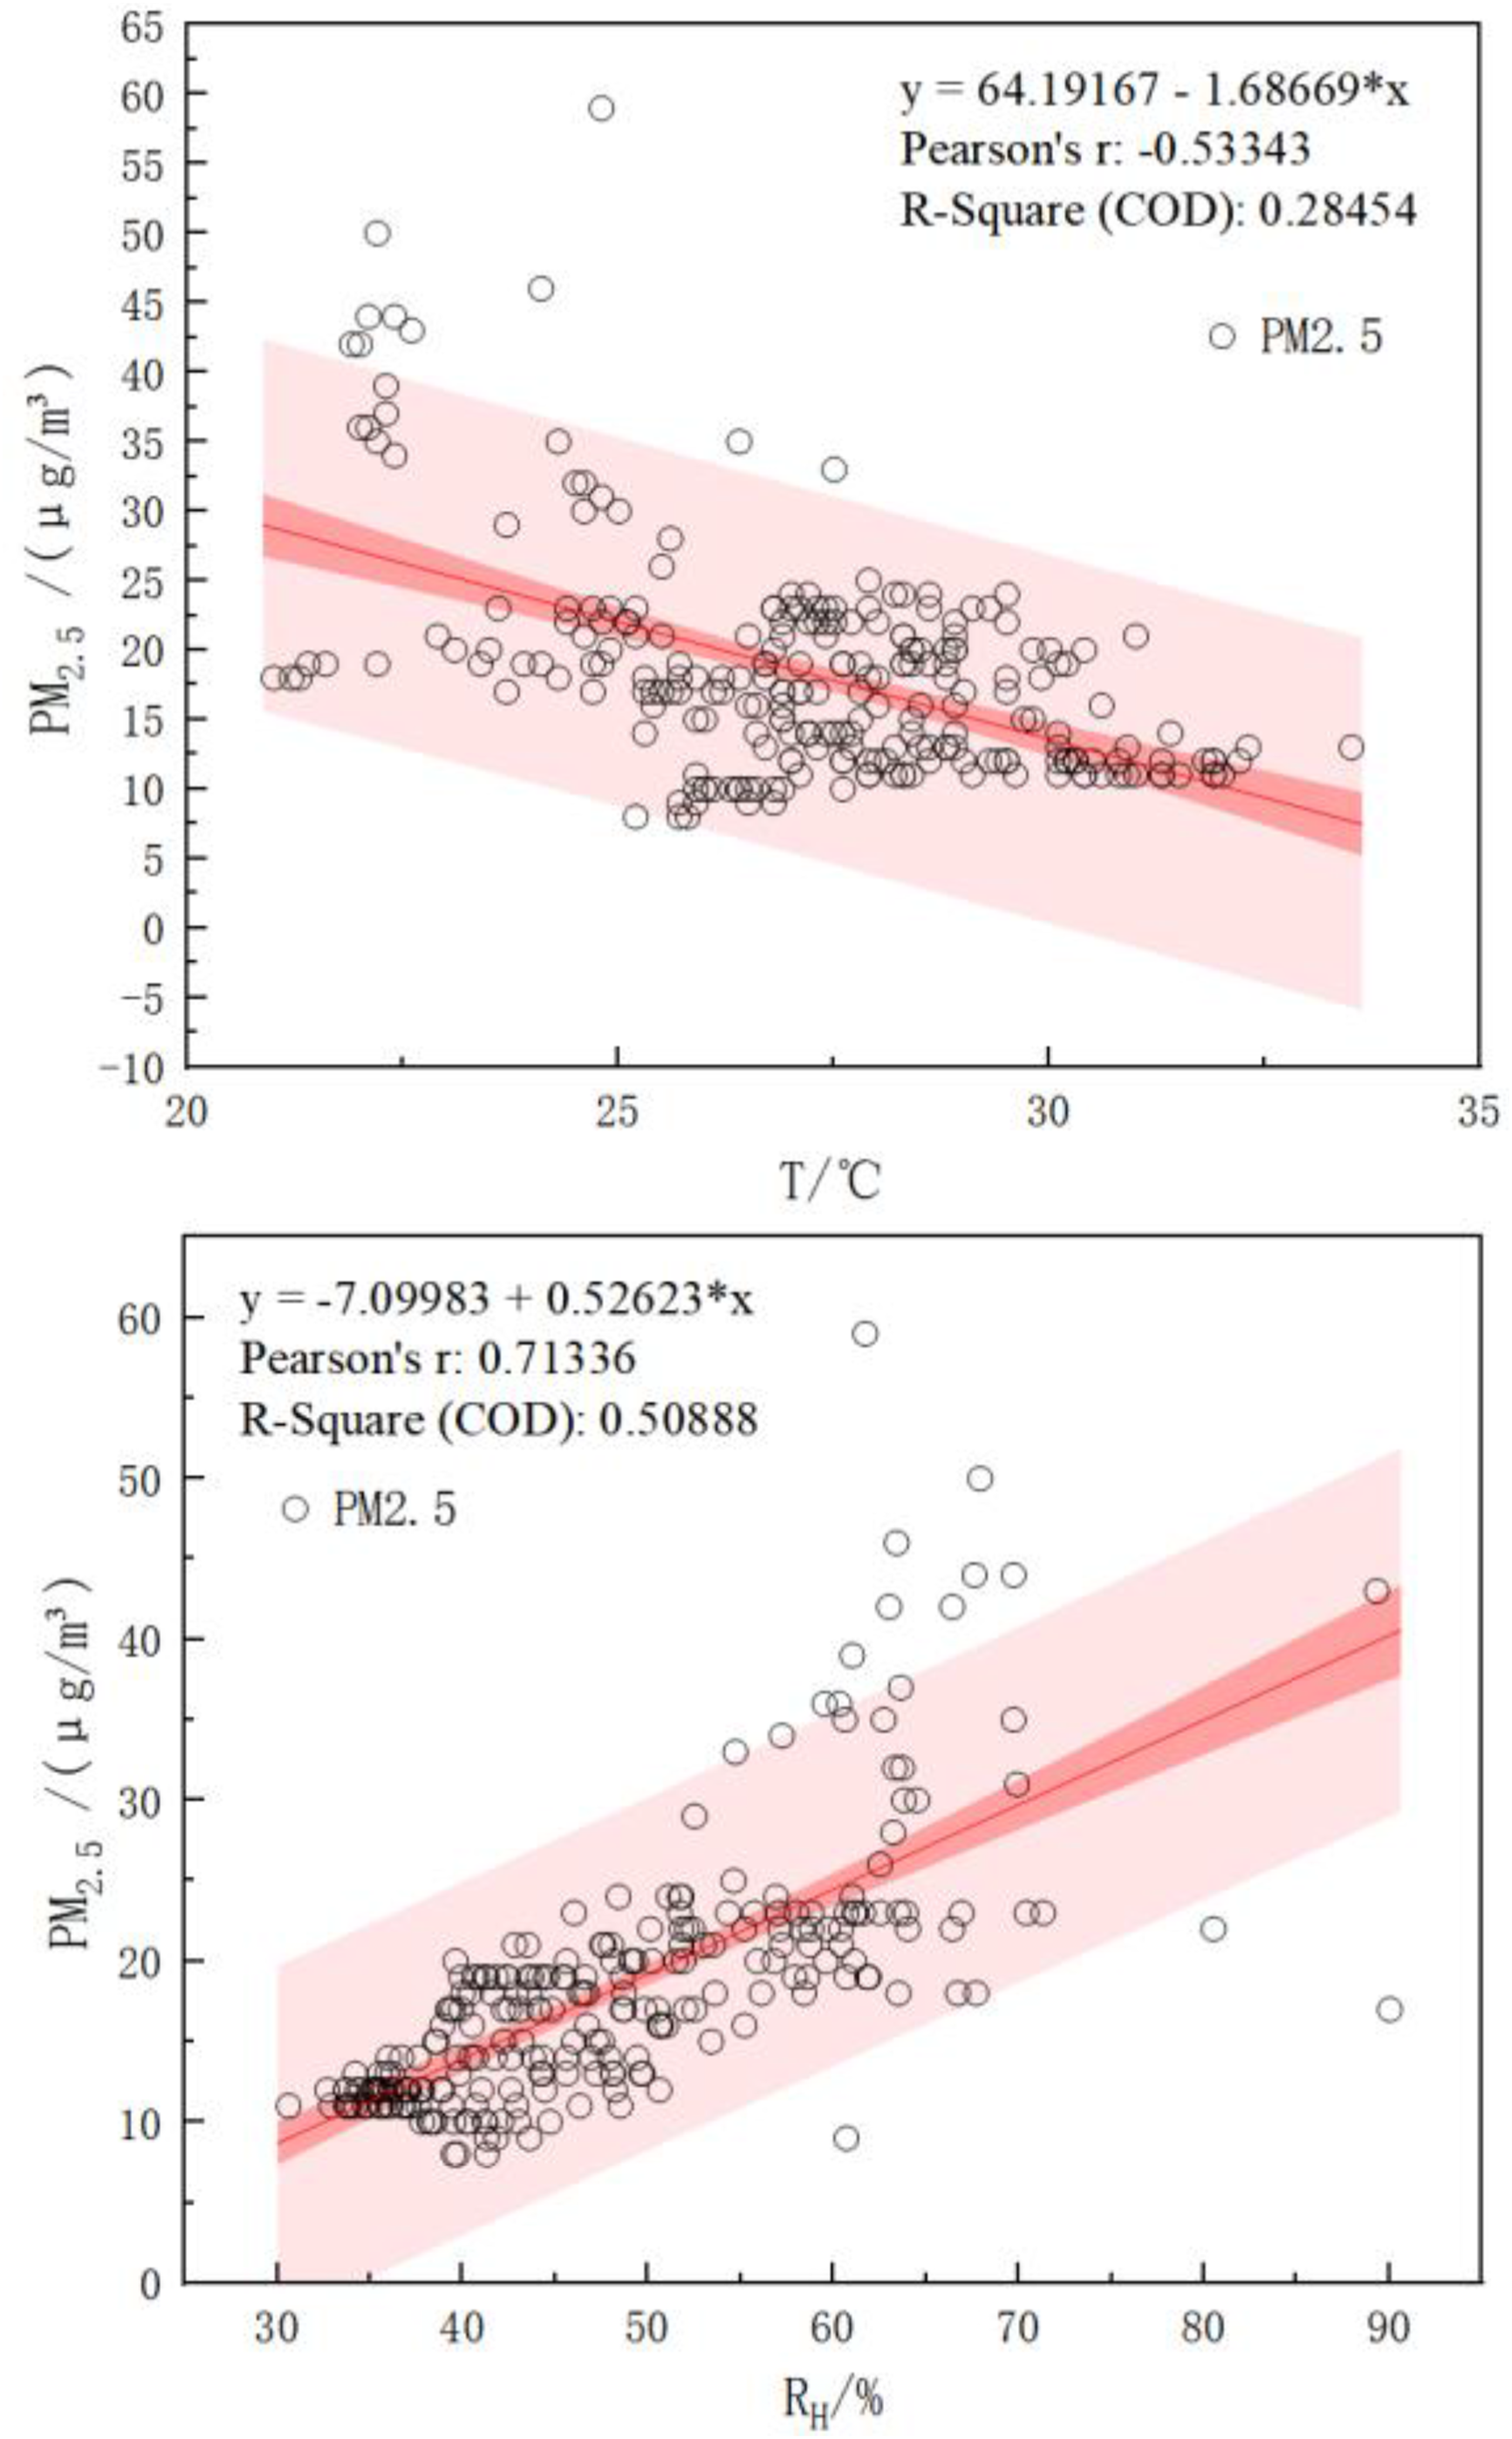
Linear regression diagram of PM2.5 concentrations, temperature, and humidity.
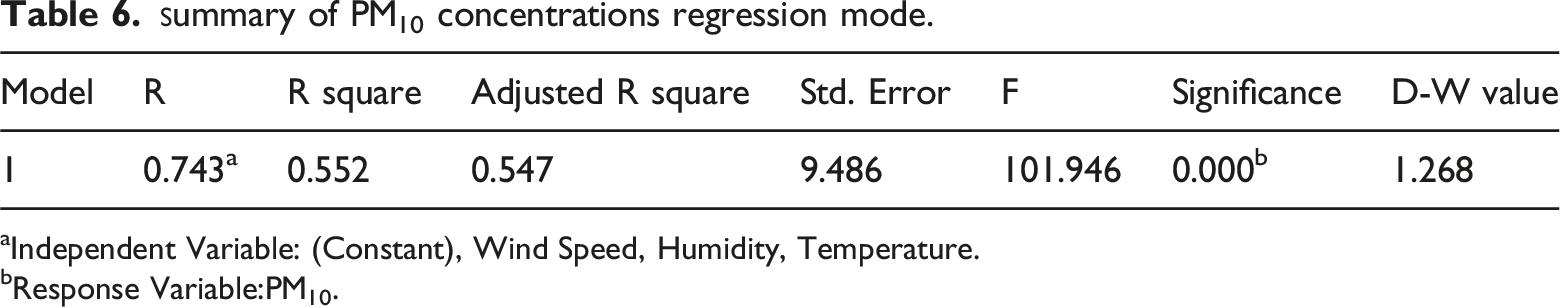
aIndependent Variable: (Constant), Wind Speed, Humidity, Temperature.
bResponse Variable:PM10.
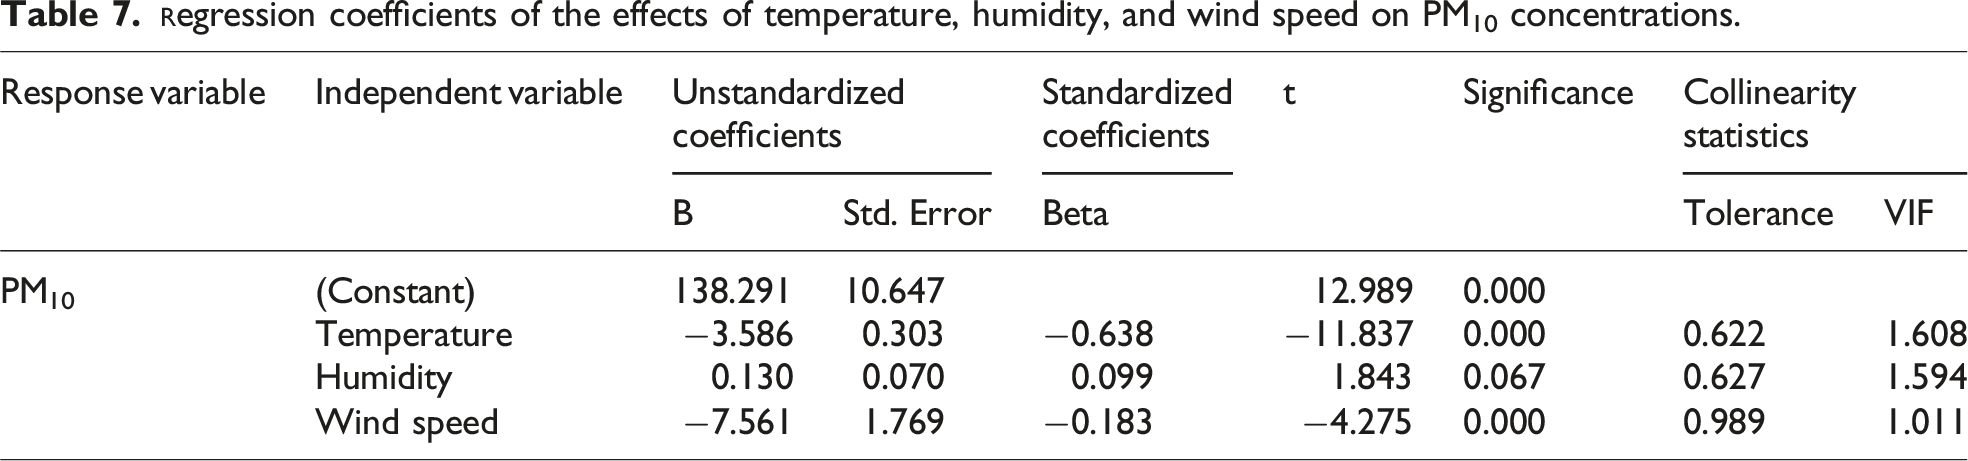
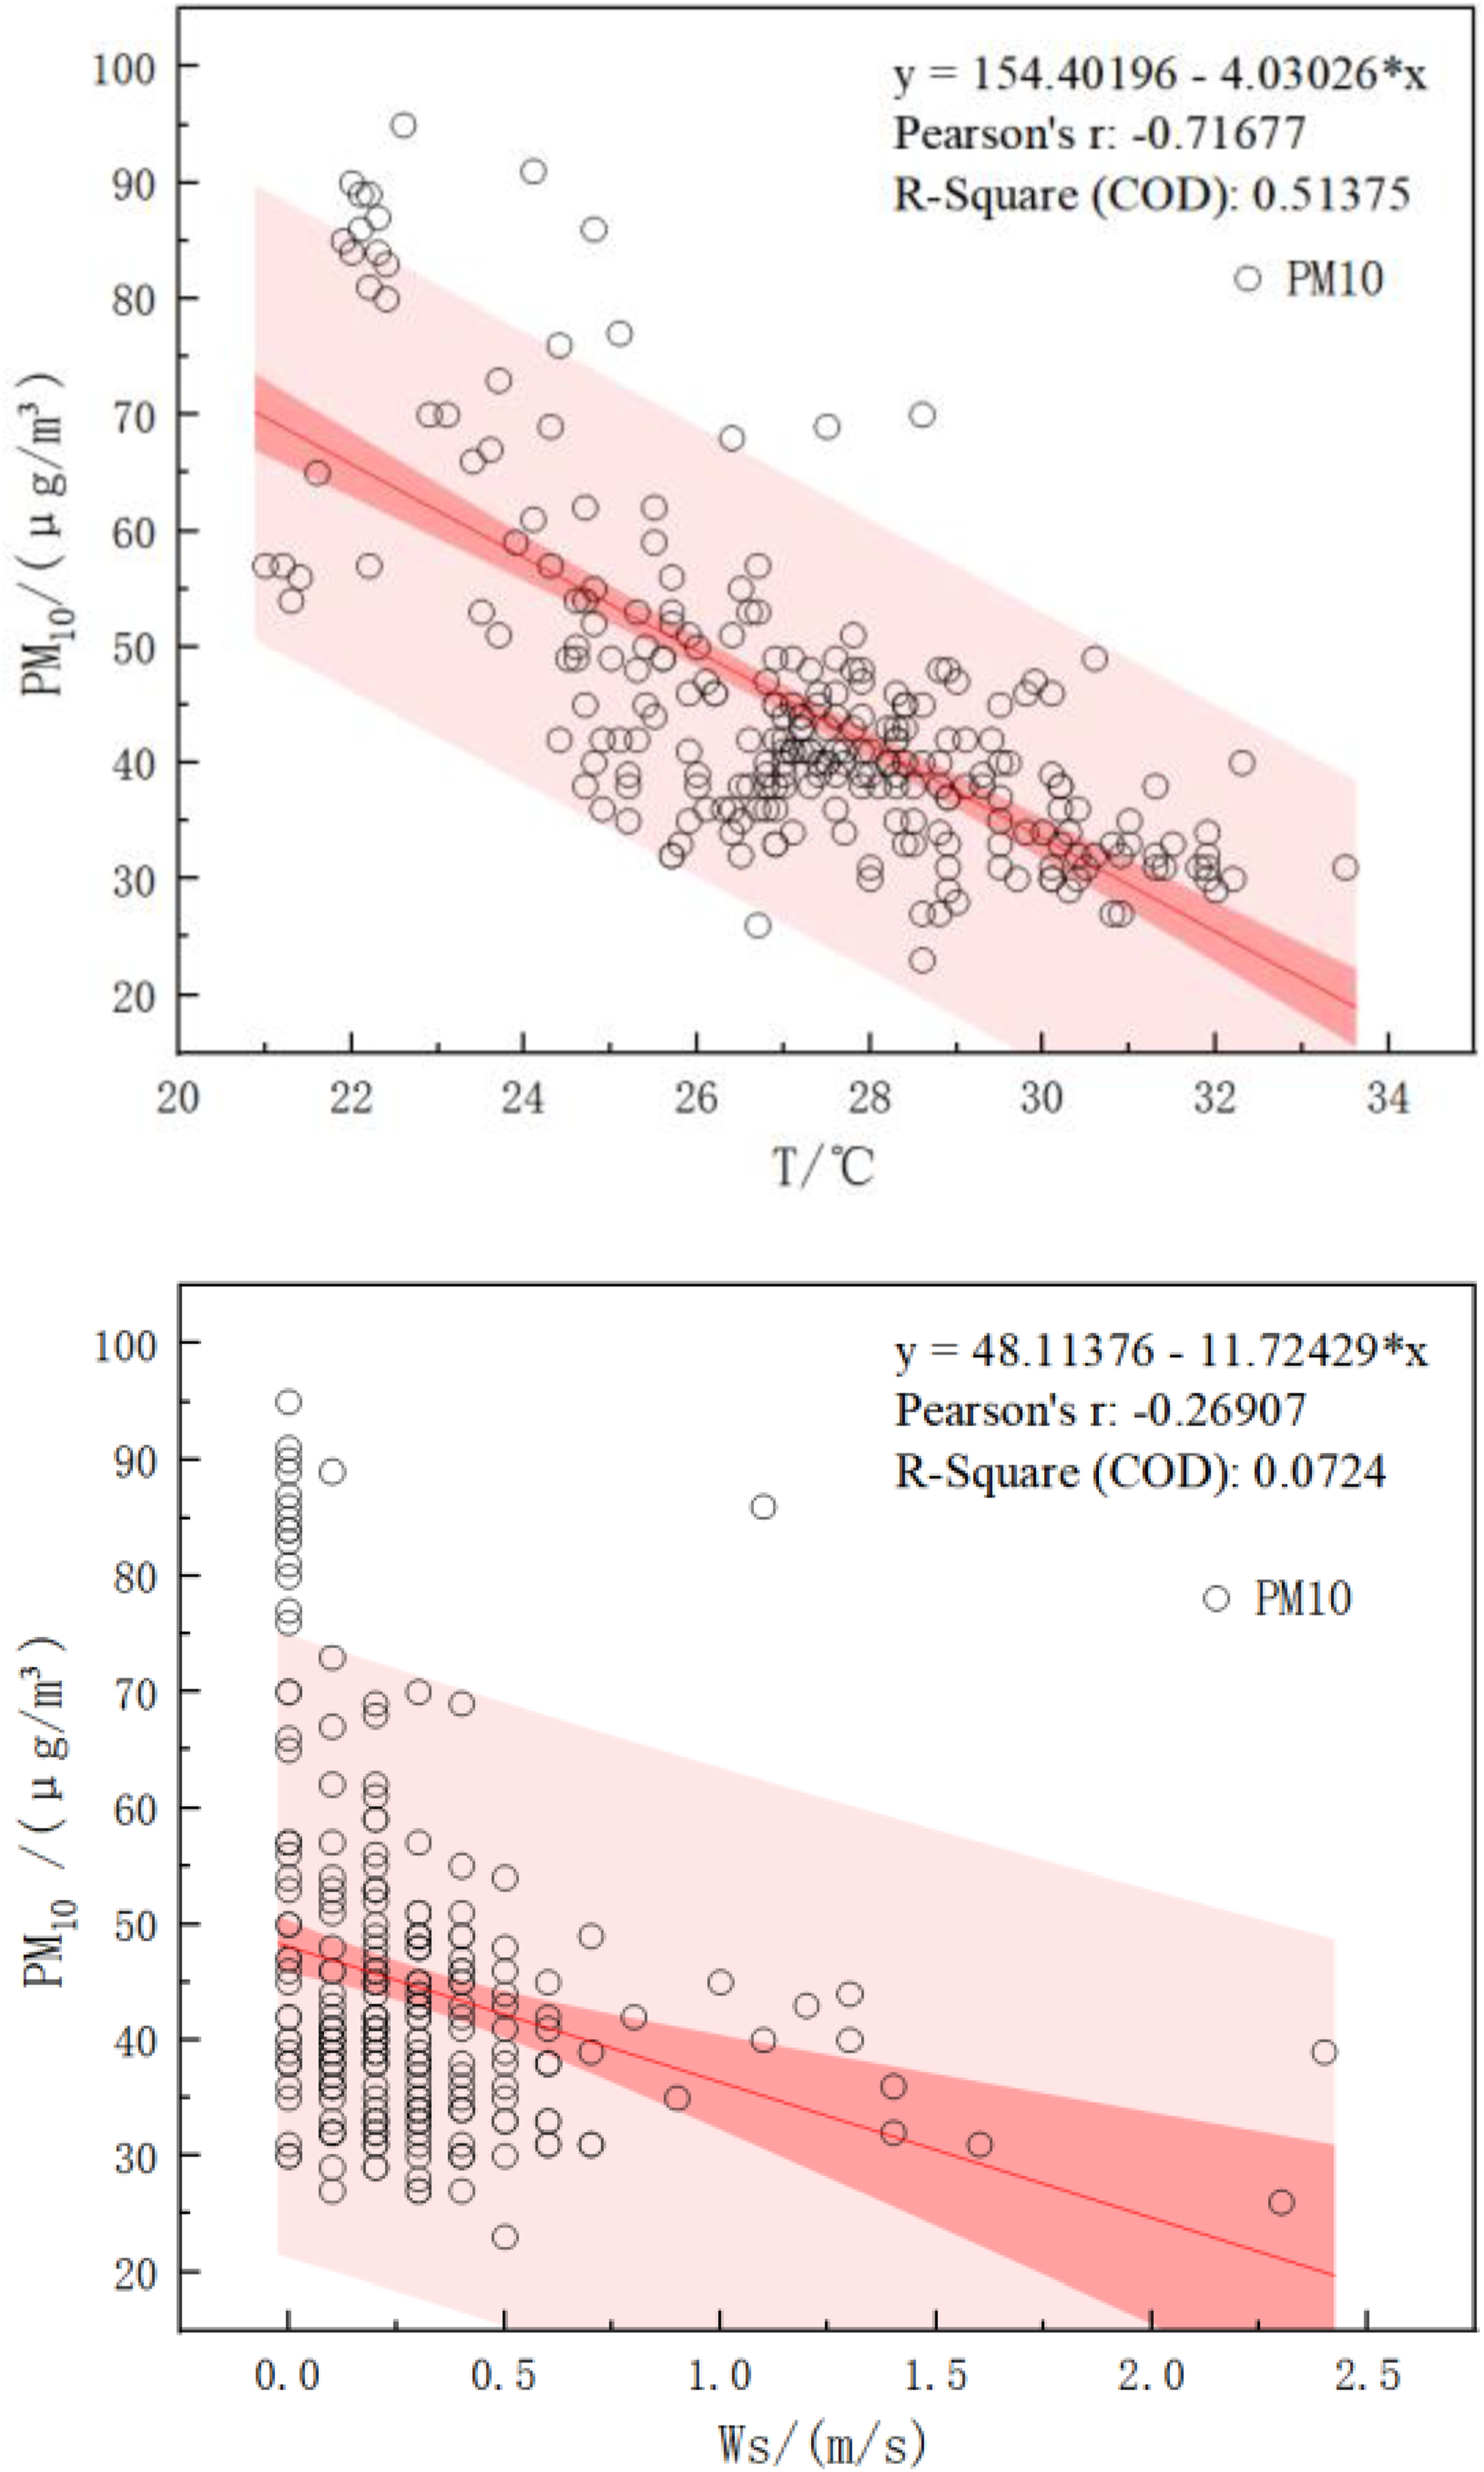
Linear regression diagram of PM10 concentrations, temperature, and wind speed.
Conclusions and suggestions
Trends in PM2.5 and PM10 concentrations of small-scale public green space
Regarding the diurnal trends, the trends in PM2.5 and PM10 concentrations across various small-scale green spaces are aligned. PM2.5 concentrations exhibit a generally declining trend with peaks in the morning, slightly lower levels at midday, and an uptick in the evening. PM10 concentrations decrease in a more stepwise fashion. Although the rates of change for PM2.5 and PM10 concentrations differ among the various spatial configurations, the specific times of daily fluctuations vary. Nonetheless, the overarching diurnal trends are consistent.
Regarding spatial variation characteristics, variance analysis results indicate no significant differences in PM2.5 and PM10 concentrations among spatial structures within small-scale green spaces, or between the interiors and exteriors of these green spaces. Atmospheric particulate matter concentrations within each area of small-scale green spaces are primarily associated with proximity to pollution sources; concentrations increase as the distance to the pollution source decreases.
Spatial changes in temperature, humidity, and wind speed of small-scale public green space
Variance analysis results indicate that temperature and humidity do not significantly differ within spatial structures of the small-scale green space or between the interior and exterior of the green space. However, significant differences are observed in wind speed. Factors such as position and canopy density influence wind speed magnitude. Wind speeds are lower in corners than in the center of the sample site, and reduced in enclosed spaces compared to open areas. Additionally, wind speeds within the small-scale green space are notably lower than the sample sites set in the control group. Consequently, when designing small-scale public green spaces, primary consideration should be given to wind direction and protection, with temperature and humidity as secondary factors.
Reducing effect of small-scale public green space on PM2.5 and PM10 concentrations
In small-scale public green spaces, the reducing effect of PM2.5 and PM10 concentrations is linked to the distance from the pollution source and the density of the canopy cover. The greater the distance from the source of pollution and the sparser the canopy, the lower the concentration of particles. The reducing rates of PM2.5 and PM10 concentrations at each sample site within these small-scale green spaces are all under 5%, suggesting that such spaces have a limited capacity to reduce atmospheric particle matter concentrations. Moreover, the reducing rates in areas of green spaces that are close to pollution sources are negative, which indicates that these areas do not contribute to reducing atmospheric particulate matter.
Regarding the diurnal trends of the reducing rate, the reducing effect varies at different times throughout the day. Typically, within the 12-h span from 7 am to 6 pm, the strongest reducing effect for PM2.5 and PM10 concentrations occurs at 10 am and 6 pm. Consequently, these time slots are more optimal for activities demanding high air quality, such as vigorous aerobic exercises like running, in small-scale public green spaces. Conversely, at 8 am, both the reducing rates of PM2.5 and PM10 concentrations are negative, indicating poor air quality in the green spaces, making them unsuitable for activities that require cleaner air.
Effects of meteorological factors on PM2.5 and PM10 concentrations
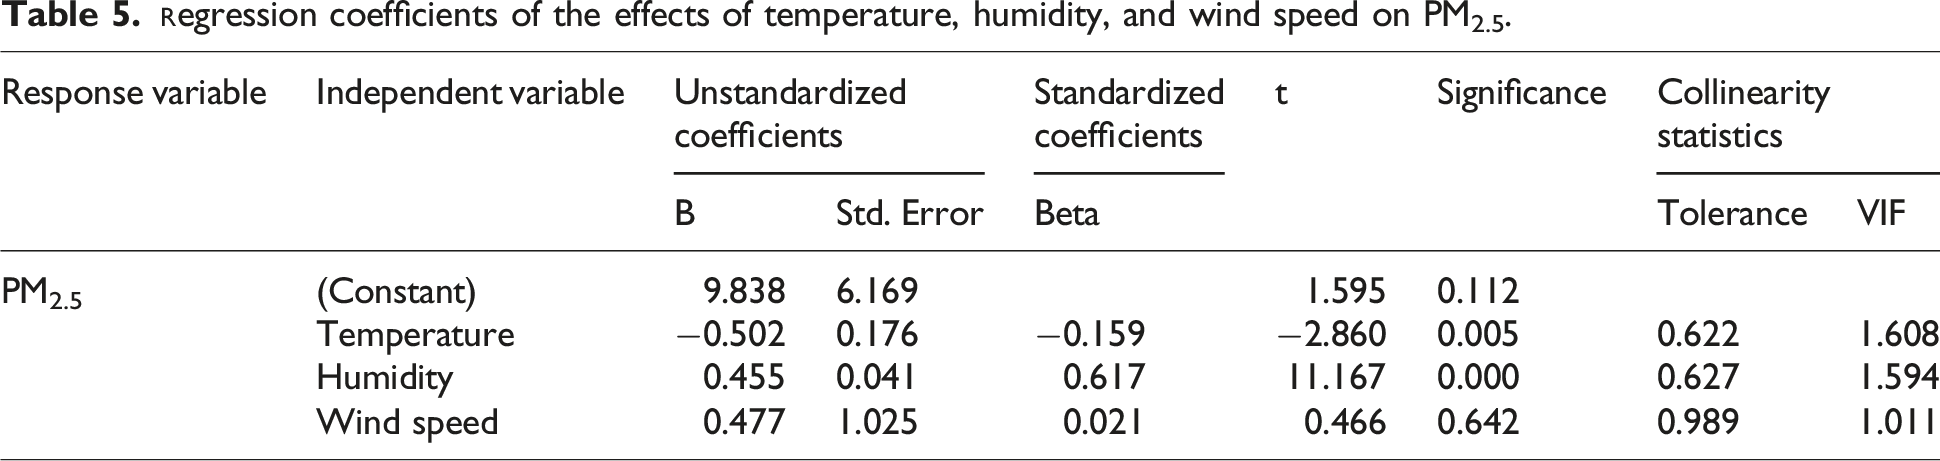
Correlation analysis results indicate that PM2.5 concentrations have a significant negative correlation with temperature and a significant positive correlation with humidity. It is also negatively correlated with wind speed, although not significantly. Humidity is the primary meteorological factor influencing PM2.5 concentrations, followed by temperature, and then wind speed. Conversely, PM10 concentrations show a significant positive correlation with humidity and a significant negative correlation with both temperature and wind speed. The predominant meteorological factor for PM10 concentrations is temperature, then humidity, and finally wind speed. An increase in temperature or a decrease in humidity can significantly lower the atmospheric particulate matter concentrations, and a rise in wind speed can also contribute to reducing the atmospheric particulate matter concentrations. For instance, the regression equation suggests that a 1°C increase in temperature could decrease PM2.5 concentration by 0.502 μg/m3 and PM10 concentration by 3.586 μg/m3.
Design strategies for small-scale public green space
In the context of urban renewal projects, small-scale public green spaces adjacent to pollution sources must be prioritized for renovation. Given the weak reduction effect (reduction <5%), the design of small-scale public green spaces should prioritize spatial layout. Given that the variations in atmospheric particulate matter concentrations, temperature, and humidity within these green spaces are generally minimal, the design should focus on optimizing the spatial hierarchy (tree-shrub-herb layers) while ensuring the layout and functional requirements are met when designing the details of all kinds of spaces in green spaces. When planning the functional zones and spatial arrangement of these green spaces, it’s important to take into account factors such as wind protection and the atmospheric particulate matter concentrations. Areas that demand a higher level of environmental comfort, like spaces designated for children’s activities or senior fitness, should be strategically placed away from sources of pollution. Additionally, when selecting plants and determining the degree of openness or enclosure, the design should primarily address the functional needs and wind protection for local residents, while also considering the impact on atmospheric particulate matter concentrations, temperature, and humidity. Notably, this study is constrained by its single-city context and unaccounted seasonal vegetation dynamics, warranting further validation across diverse climatic regions.
Footnotes
Consent for publication
All authors consent to publish.
Funding
The authors disclosed receipt of the following financial support for the research, authorship, and/or publication of this article: This work was supported by Science and Technology Project Plan of Henan Province (212102310230).
Declaration of conflicting interests
The authors declared no potential conflicts of interest with respect to the research, authorship, and/or publication of this article.
Data Availability Statement
All data generated or analyzed during this study are included in this article.