
Abstract
This study investigates the driving effects of Intelligent MICE tourism on regional economic development, with Guizhou Province as the research focus. Using tourism economic data from 2009 to 2019, combined with geographic information analysis and an input-output model, we examine the spatiotemporal evolution of Guizhou’s tourism industry and its impact on regional economic growth. The results indicate that after 2016, Guizhou’s total tourism revenue and visitor numbers entered a phase of rapid expansion, with annual growth rates averaging 36.96% and 32.15%, respectively. Spatial analysis reveals that tourism revenue distribution across county-level administrative divisions follows a diffusion pattern, expanding from core cities such as Guiyang and Zunyi to surrounding areas. Furthermore, an analysis of industrial structure indicates that Guizhou’s economy is primarily driven by the secondary and tertiary sectors, with the tourism industry’s backward linkages within the industrial chain strengthening over time, positioning it as a key catalyst for growth in related industries. Model validation results demonstrate that both the influence and sensitivity coefficients of the tourism industry significantly exceed the national economic average, underscoring its substantial stimulative effect on regional economic expansion. Geographic detector analysis further reveals that policy regulation, advancements in information technology, and regional industrial structures play a critical role in the coupled and coordinated development of the tourism economy and the broader regional economy. Based on these findings, this study proposes policy recommendations to optimize Guizhou’s tourism industry structure, enhance tourism service infrastructure, and promote integrated regional development. By integrating spatiotemporal pattern analysis with industrial chain effect evaluation, this study highlights tourism’s core role in regional economic development and quantitatively assesses its contribution from a geographical perspective.
Introduction
The accelerating pace of economic globalization presents both unprecedented opportunities and significant challenges for socio-economic development. Understanding the patterns of regional economic development and implementing practical strategies are crucial for accelerating economic growth. Entering the new century, regional socio-economic development has encountered unparalleled opportunities. 1 During China’s “Tenth Five-Year Plan” period, rapid national economic growth created favorable external conditions for regional economic expansion. The government’s implementation of the Western Development Strategy and poverty alleviation initiatives introduced a series of preferential policies to support economic growth in western regions. 2 Additionally, the relocation of industries from developed areas has opened new development avenues, while strong governmental support at all administrative levels has further propelled regional economic growth. The collective ambition of officials and local communities for prosperity and economic advancement has emerged as a powerful driving force. 3
Beyond policy-driven economic growth, cultural influences—such as media and entertainment—have also emerged as key factors shaping tourism dynamics. Faruk et al. (2013) 4 investigated the relationship between Turkish soap opera broadcasts in source countries and inbound tourism to Turkey, concluding that increased exposure positively impacted tourist numbers. Expanding on this, Kim 5 analyzed the effects of popular television dramas on tourism flow patterns, demonstrating that Korean dramas not only influence tourists’ socio-cultural experiences but also shape their economic behaviors, thereby contributing to spatial behavior models of tourism flows. Jie et al. 6 examined the supply-side determinants of international tourism flows, identifying resource endowments, infrastructure, and technological advancements as critical drivers of tourism growth in destination countries. Glauco 7 explored the impact of long-term exchange rate regimes on international tourism, emphasizing that exchange rate stability plays a significant role in attracting tourists. Jameel K et al. 8 conducted a bilateral tourism flow analysis across 28 countries, underscoring the importance of transportation infrastructure as a key determinant of inbound tourism. Additionally, Bruee P et al. 9 highlighted the multifaceted influences on inbound tourism, including personal characteristics, tourism demand, economic development, government policies, external political conditions, and socio-cultural factors. While extensive research has been conducted both domestically and internationally on the relationship between tourism flows and regional economic development, deeper and more comprehensive investigations are still needed to fully elucidate these dynamics.
Intelligent convention and exhibition tourism has become a new engine of regional economic growth. Elucidating its operational mechanisms is essential for optimizing industrial structure and fostering coordinated regional development. As a leading province in mountain tourism, Guizhou’s development experience provides valuable insights for other regions with similar geographic conditions. This study offers a scientific foundation for government policy formulation and industrial planning, providing a crucial reference for fostering high-quality regional economic growth. Building upon these insights, this study systematically analyzes the driving effects of intelligent convention and exhibition tourism on regional economic development, highlighting its significant academic and practical value. The fundamental contributions of this find out about are as follows: Integrating spatiotemporal sample evaluation with industrial chain impact evaluation to quantitatively identify the core driving forces of the tourism enterprise in regional financial development. Employing geographic records structures (GIS) and input-output methods to exactly measure the spatial evolution traits of the tourism enterprise and its spillover results on associated industries. Applying the geographical detector technique to systematically observe the have an effect on of coverage regulation, industrial structure, and technological development and digitalization on the coordinated improvement of tourism and the regional economy. Unlike traditional tourism, Intelligent MICE tourism emphasizes digital interconnectivity, personalized experiences, and real-time services. This study fills a gap by examining its quantitative impact on regional economics using geographic detectors and industrial linkages.
Tourism development and geospatial patterns
Geospatial patterns
Guizhou Province, located in the hinterland of southwestern China, serves as a primary transportation hub and a world-famous province for mountain tourism. It administers 88 county-level divisions, inclusive of 50 counties, 10 county-level cities, 16 districts, one self-sufficient district, one exclusive district, and eleven self-sufficient counties, jointly referred to as the “88 counties” in this study. Geographically, Guizhou is located between 24°37′N–29°13'N latitude and 103°36′E–109°35′E longitude. It is domestic to various ethnic groups such as the Miao, Buyi, and Dong, recognized for their wealthy cultural heritage. The province’s subtropical plateau monsoon local weather gives a favorable ecological environment and first-rate conditions for tourism. 10 Based on Digital Elevation Model (DEM) data, Guizhou’s common altitude exceeds 1000 m, with greater elevations in the west. The province’s panorama is predominantly mountainous, with restricted plains. Positioned at the confluence of the Yangtze and Pearl River basins, Guizhou boasts a dense river community and special geomorphological formations, contributing to its considerable tourism resources. As of 2020, Guizhou had seven countrywide 5A-rated vacationer attractions, such as Huangguoshu Waterfall, Xijiang Qianhu Miao Village, and Fanjing Mountain. This study selects administrative divisions based on 2019 county-level classifications, with data sourced from the Guizhou Macro Database.
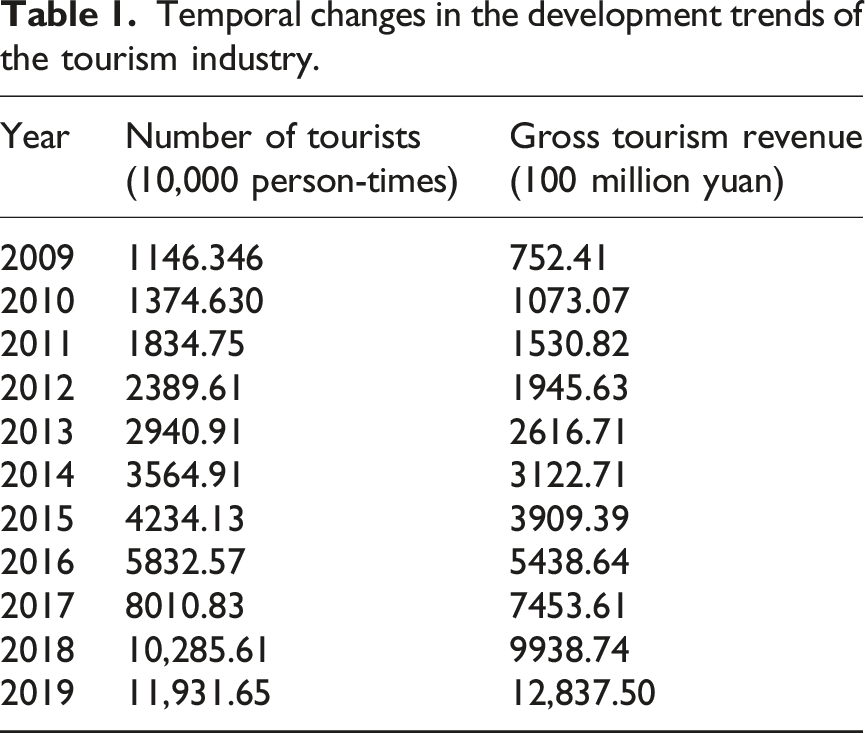
Temporal changes in the development trends of the tourism industry.
Spatial Evolution of County-Level Tourism Development in Guizhou (2009–2019). To analyze the spatial evolution of county-level tourism development in Guizhou, three representative years—2009, 2014, and 2019—were selected at equal intervals from the 11-year period (2009–2019). The natural breaks classification method was employed to categorize county-level tourism revenue for each selected year, and the results are illustrated in Figure 1. Overall, county-level tourism revenue exhibited a significant upward trend over the decade. In 2009, total tourism revenue across Guizhou’s 88 counties ranged from ¥0.56 billion to ¥75 billion, with most counties reporting revenues below ¥8 billion. By 2014, revenue increased to ¥1.99 billion–¥265.18 billion, with most counties falling within the ¥11.49 billion–¥48.62 billion range. In 2019, tourism revenue further expanded to ¥10.47 billion–¥845.30 billion, with most counties exceeding ¥58.48 billion. County-Level Tourism Revenue Distribution by Year. Spatial and temporal patterns of regional tourism development.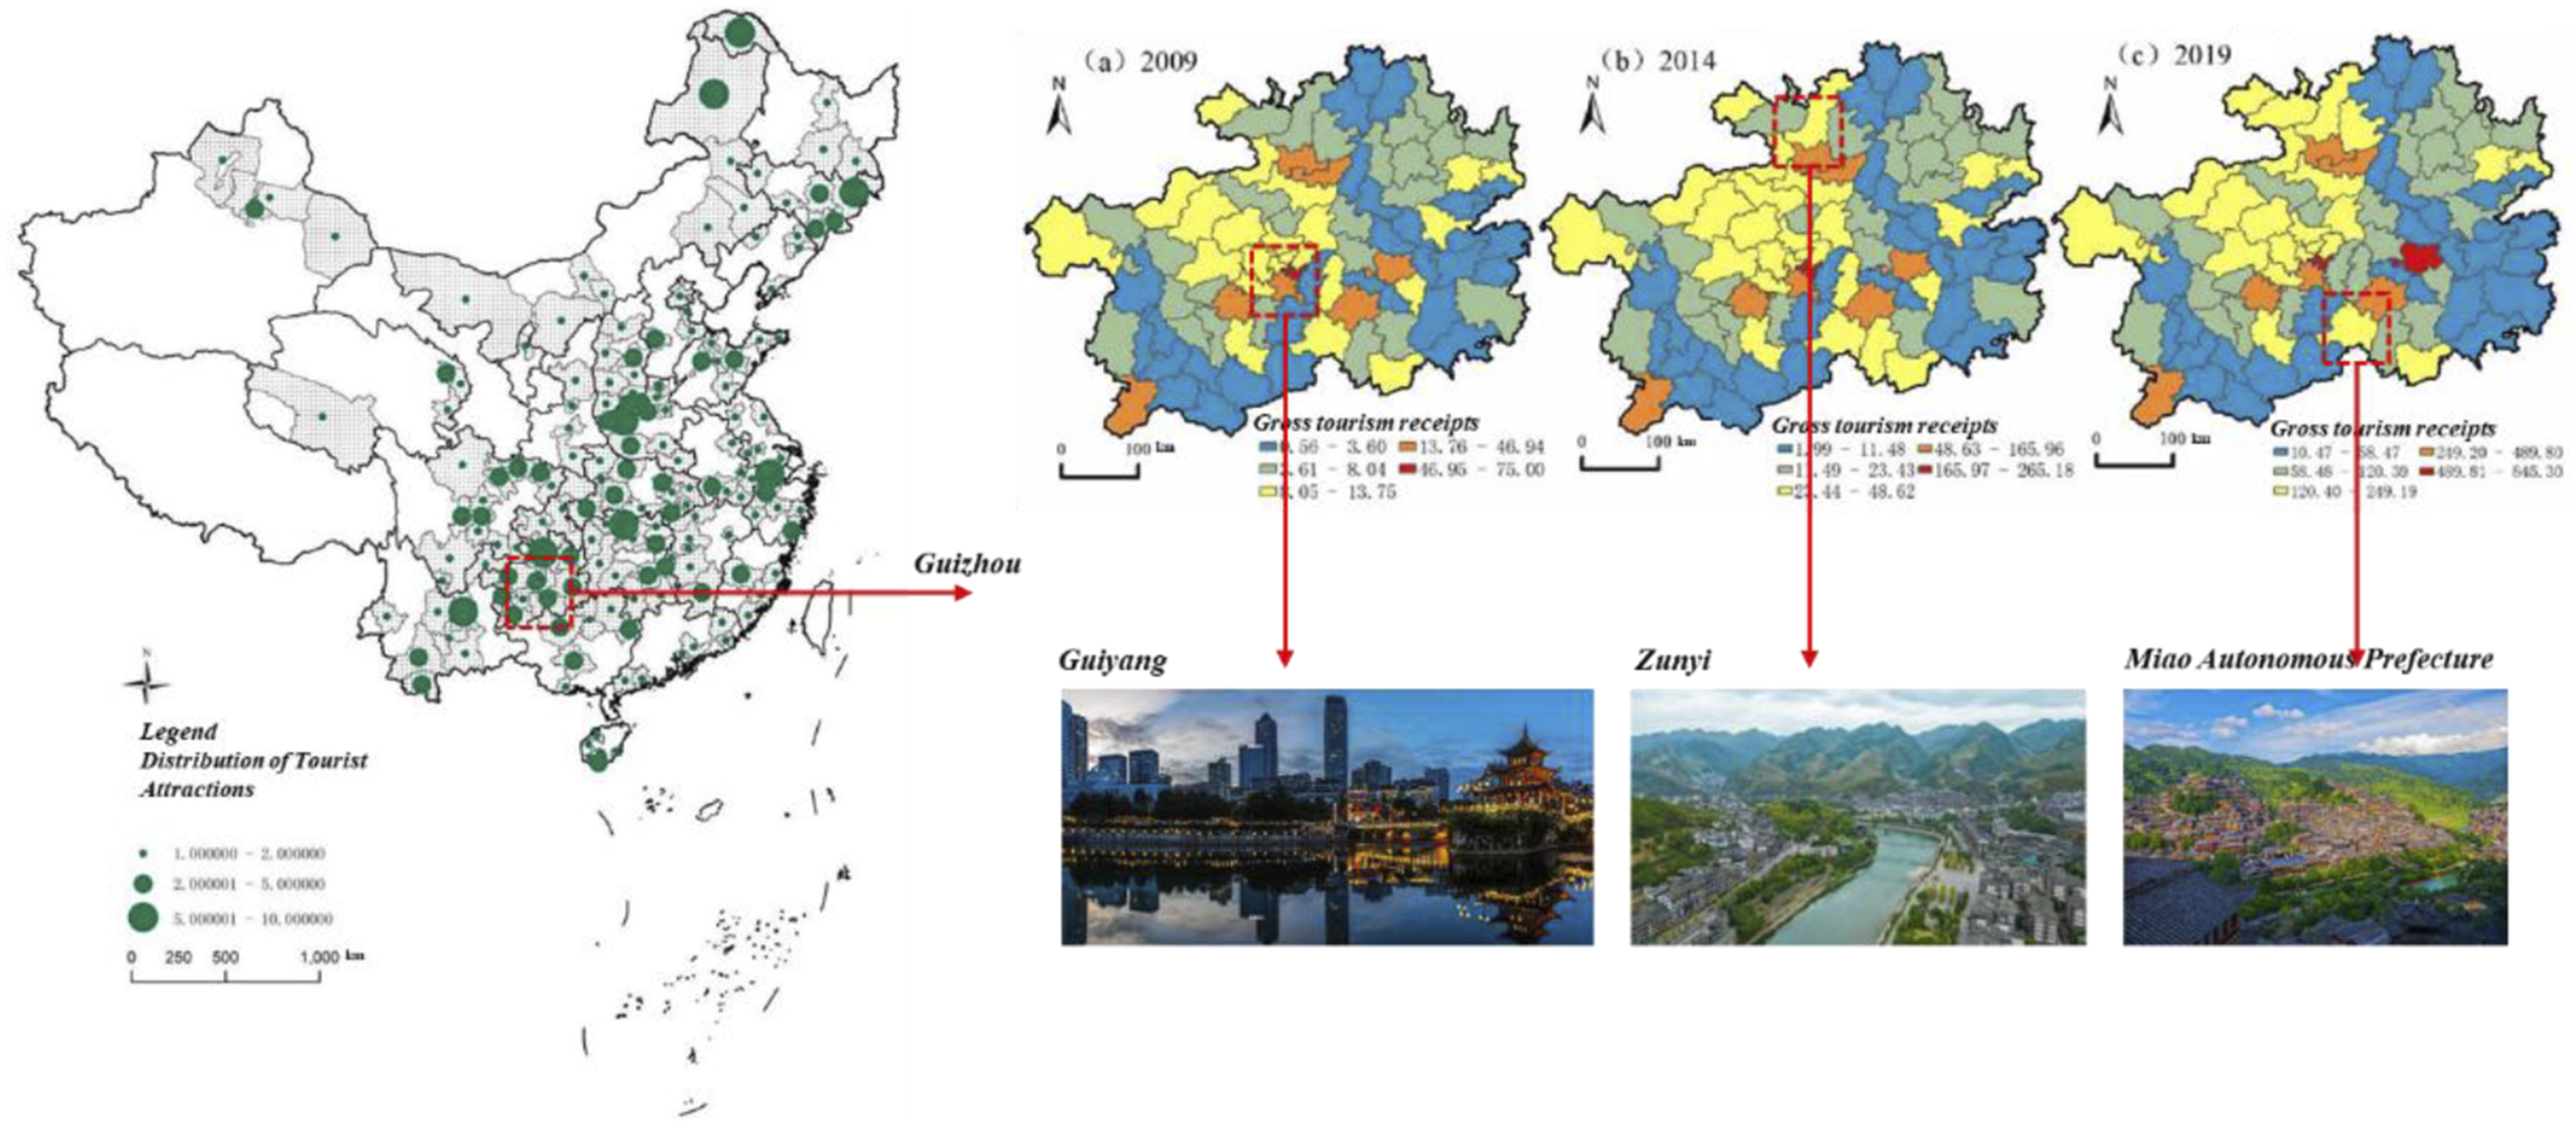
Industrial structure of Guiyang
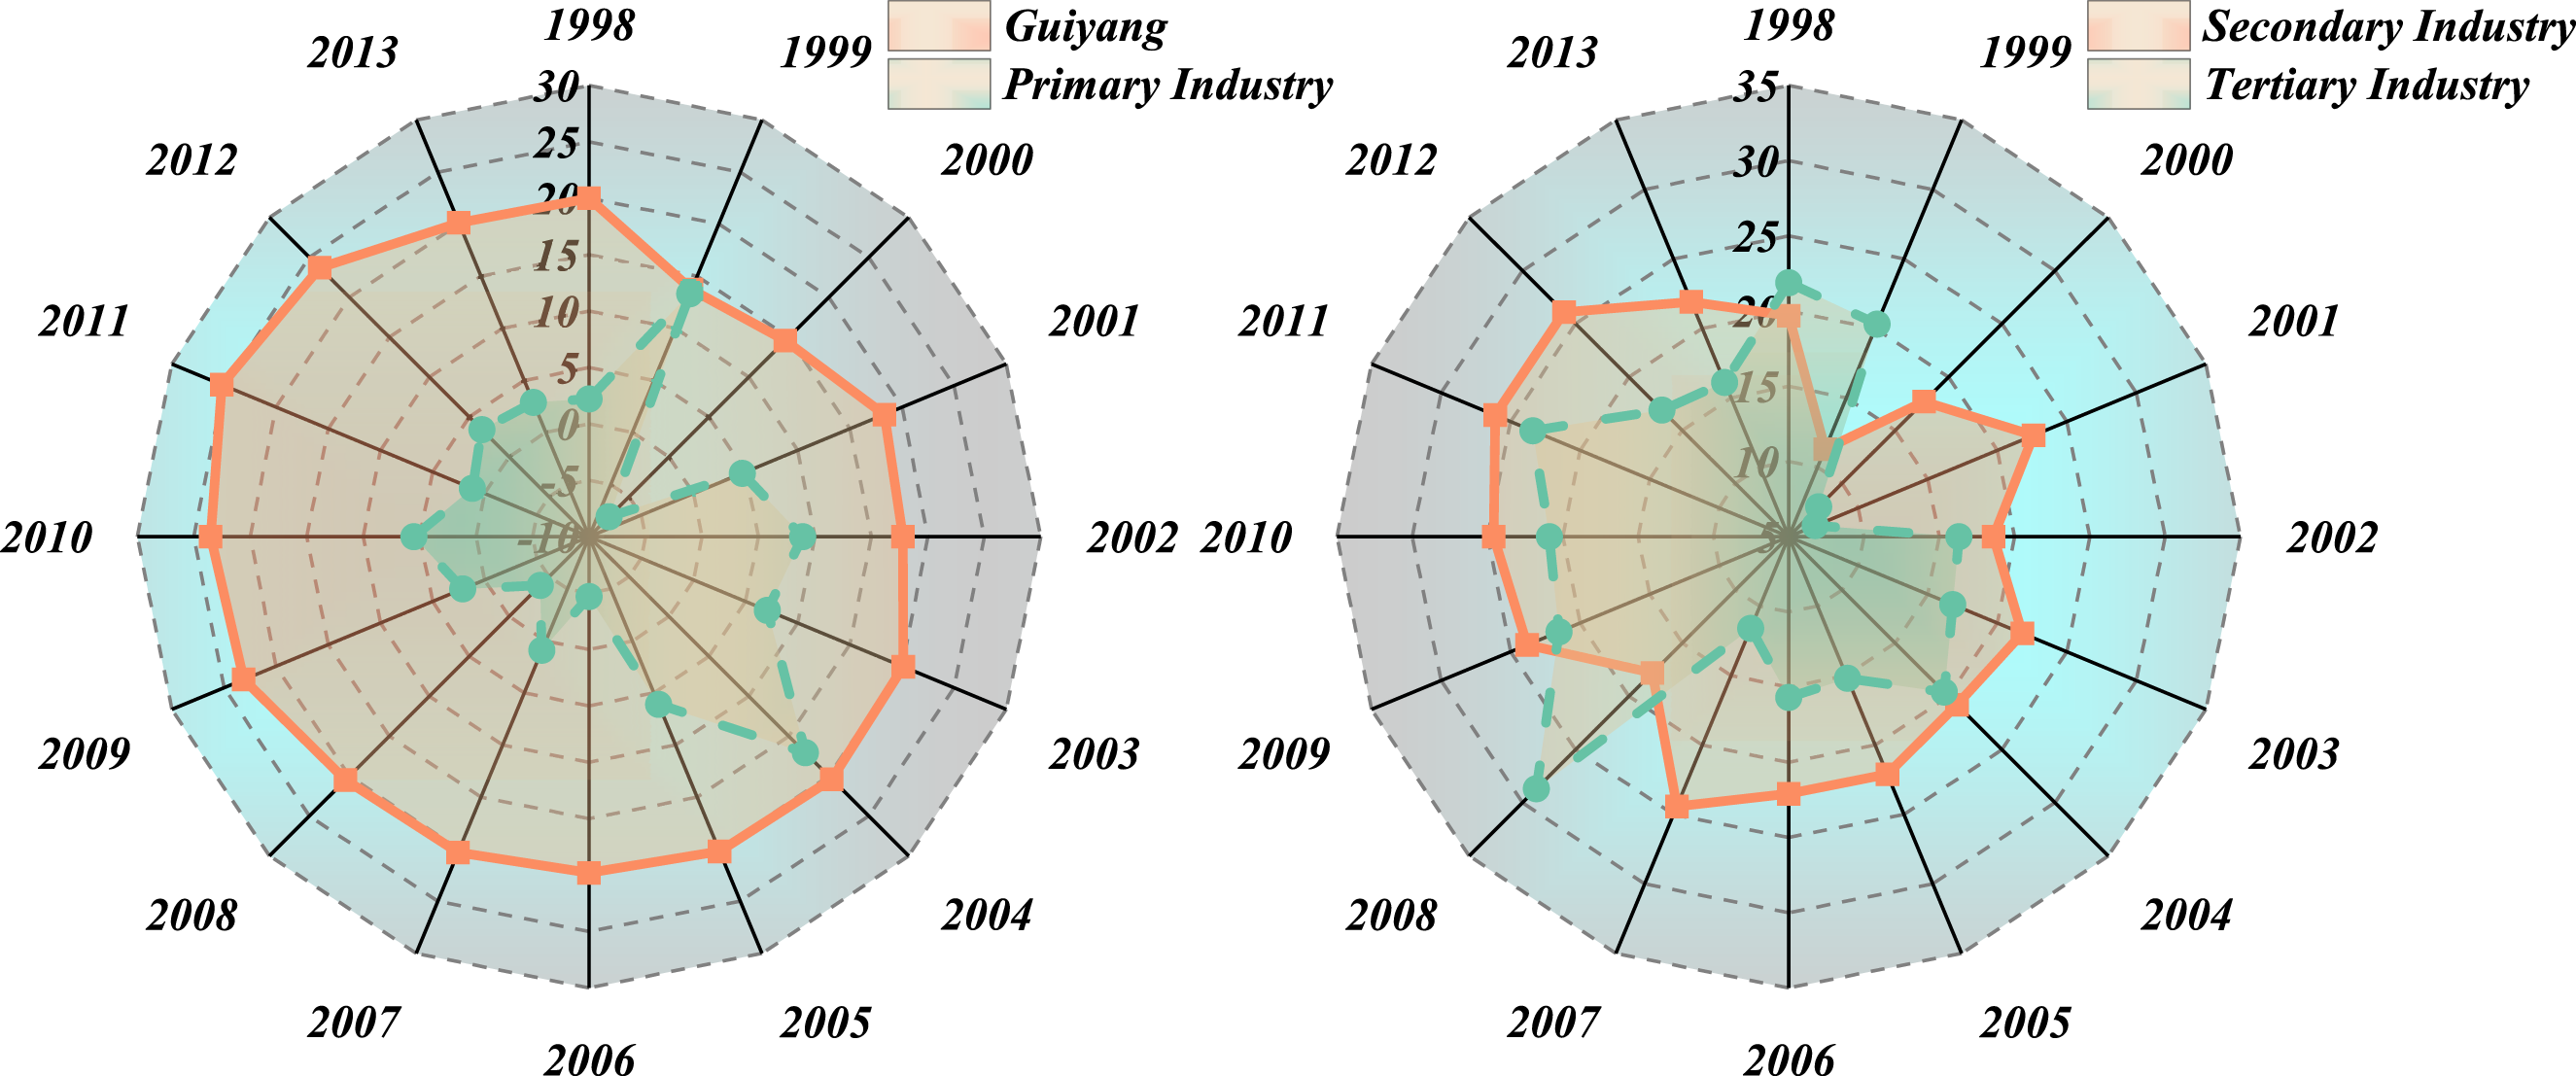
From the data presented in Figures 2–4, it is evident that the gross output of Guiyang’s primary industry has been declining annually, with its proportion remaining relatively low. In contrast, the secondary and tertiary industries have become the dominant sectors. Based on the provided data, the average industrial structure ratio over the years is calculated as 0.26:67.77:31.97, indicating a general “secondary-tertiary-primary” industrial development pattern in Guiyang. Gross product. Share of tertiary industries. Chain growth rate of tertiary industries.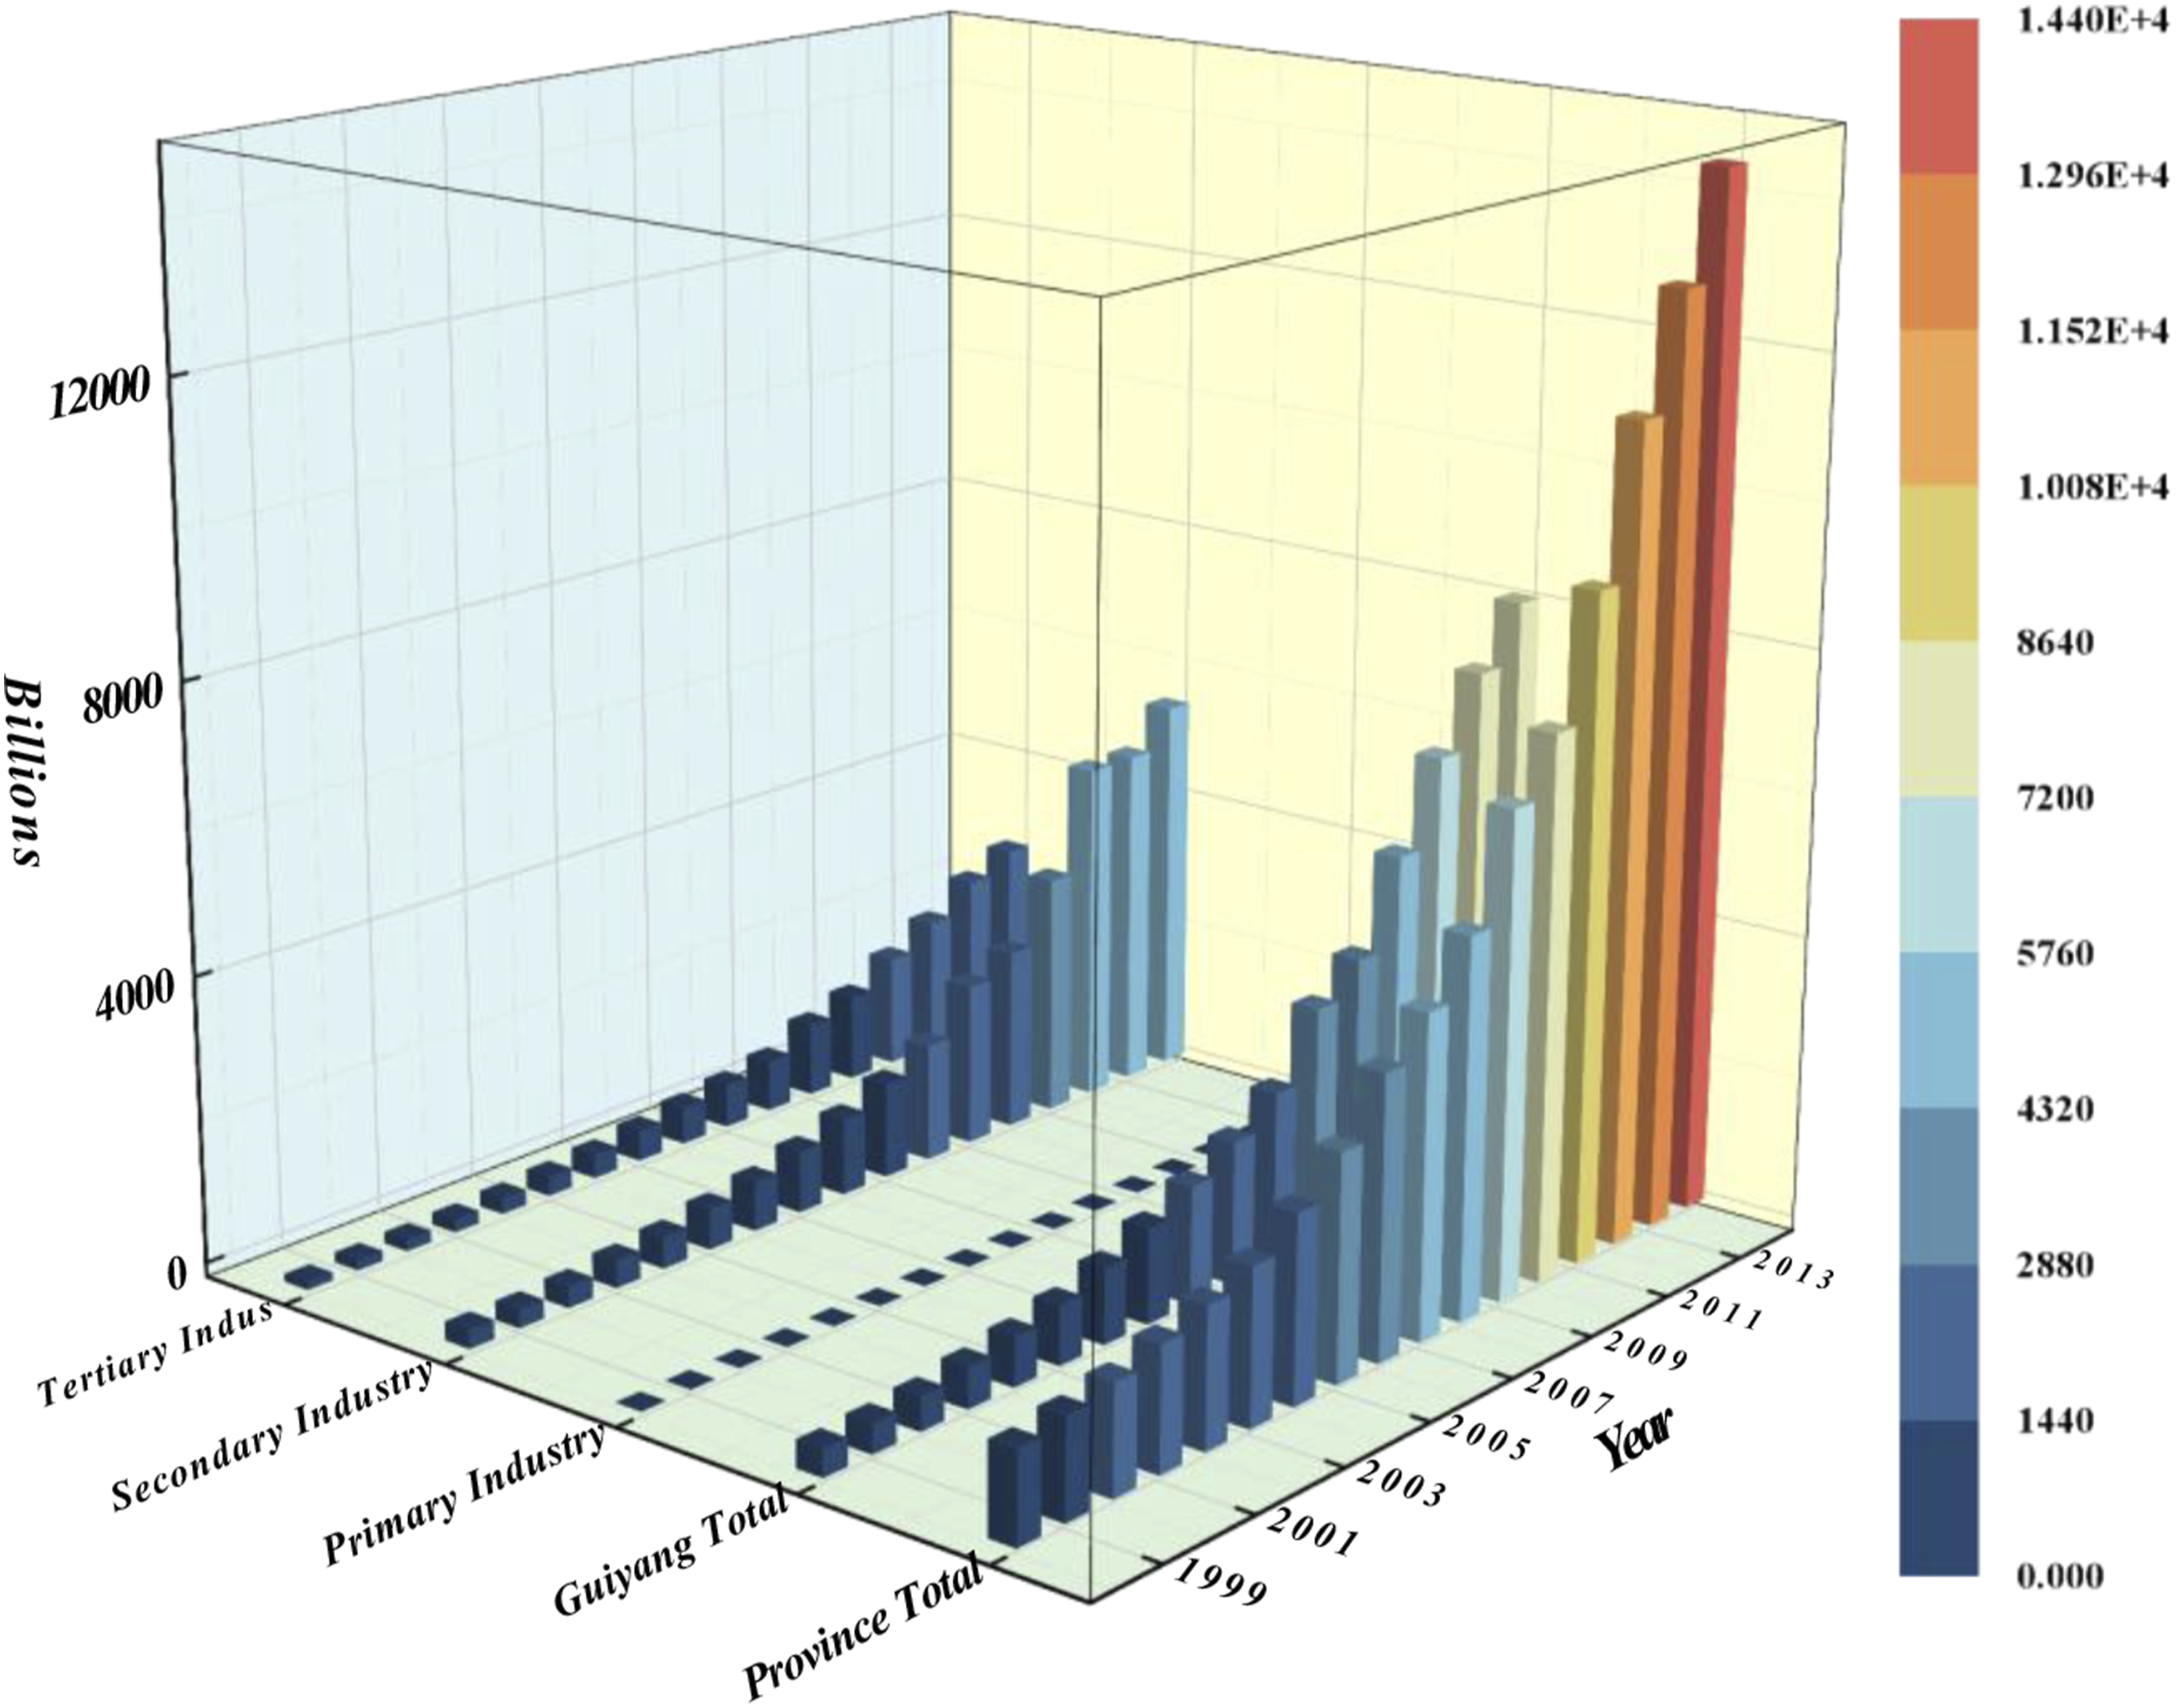
Declining share of the primary industry
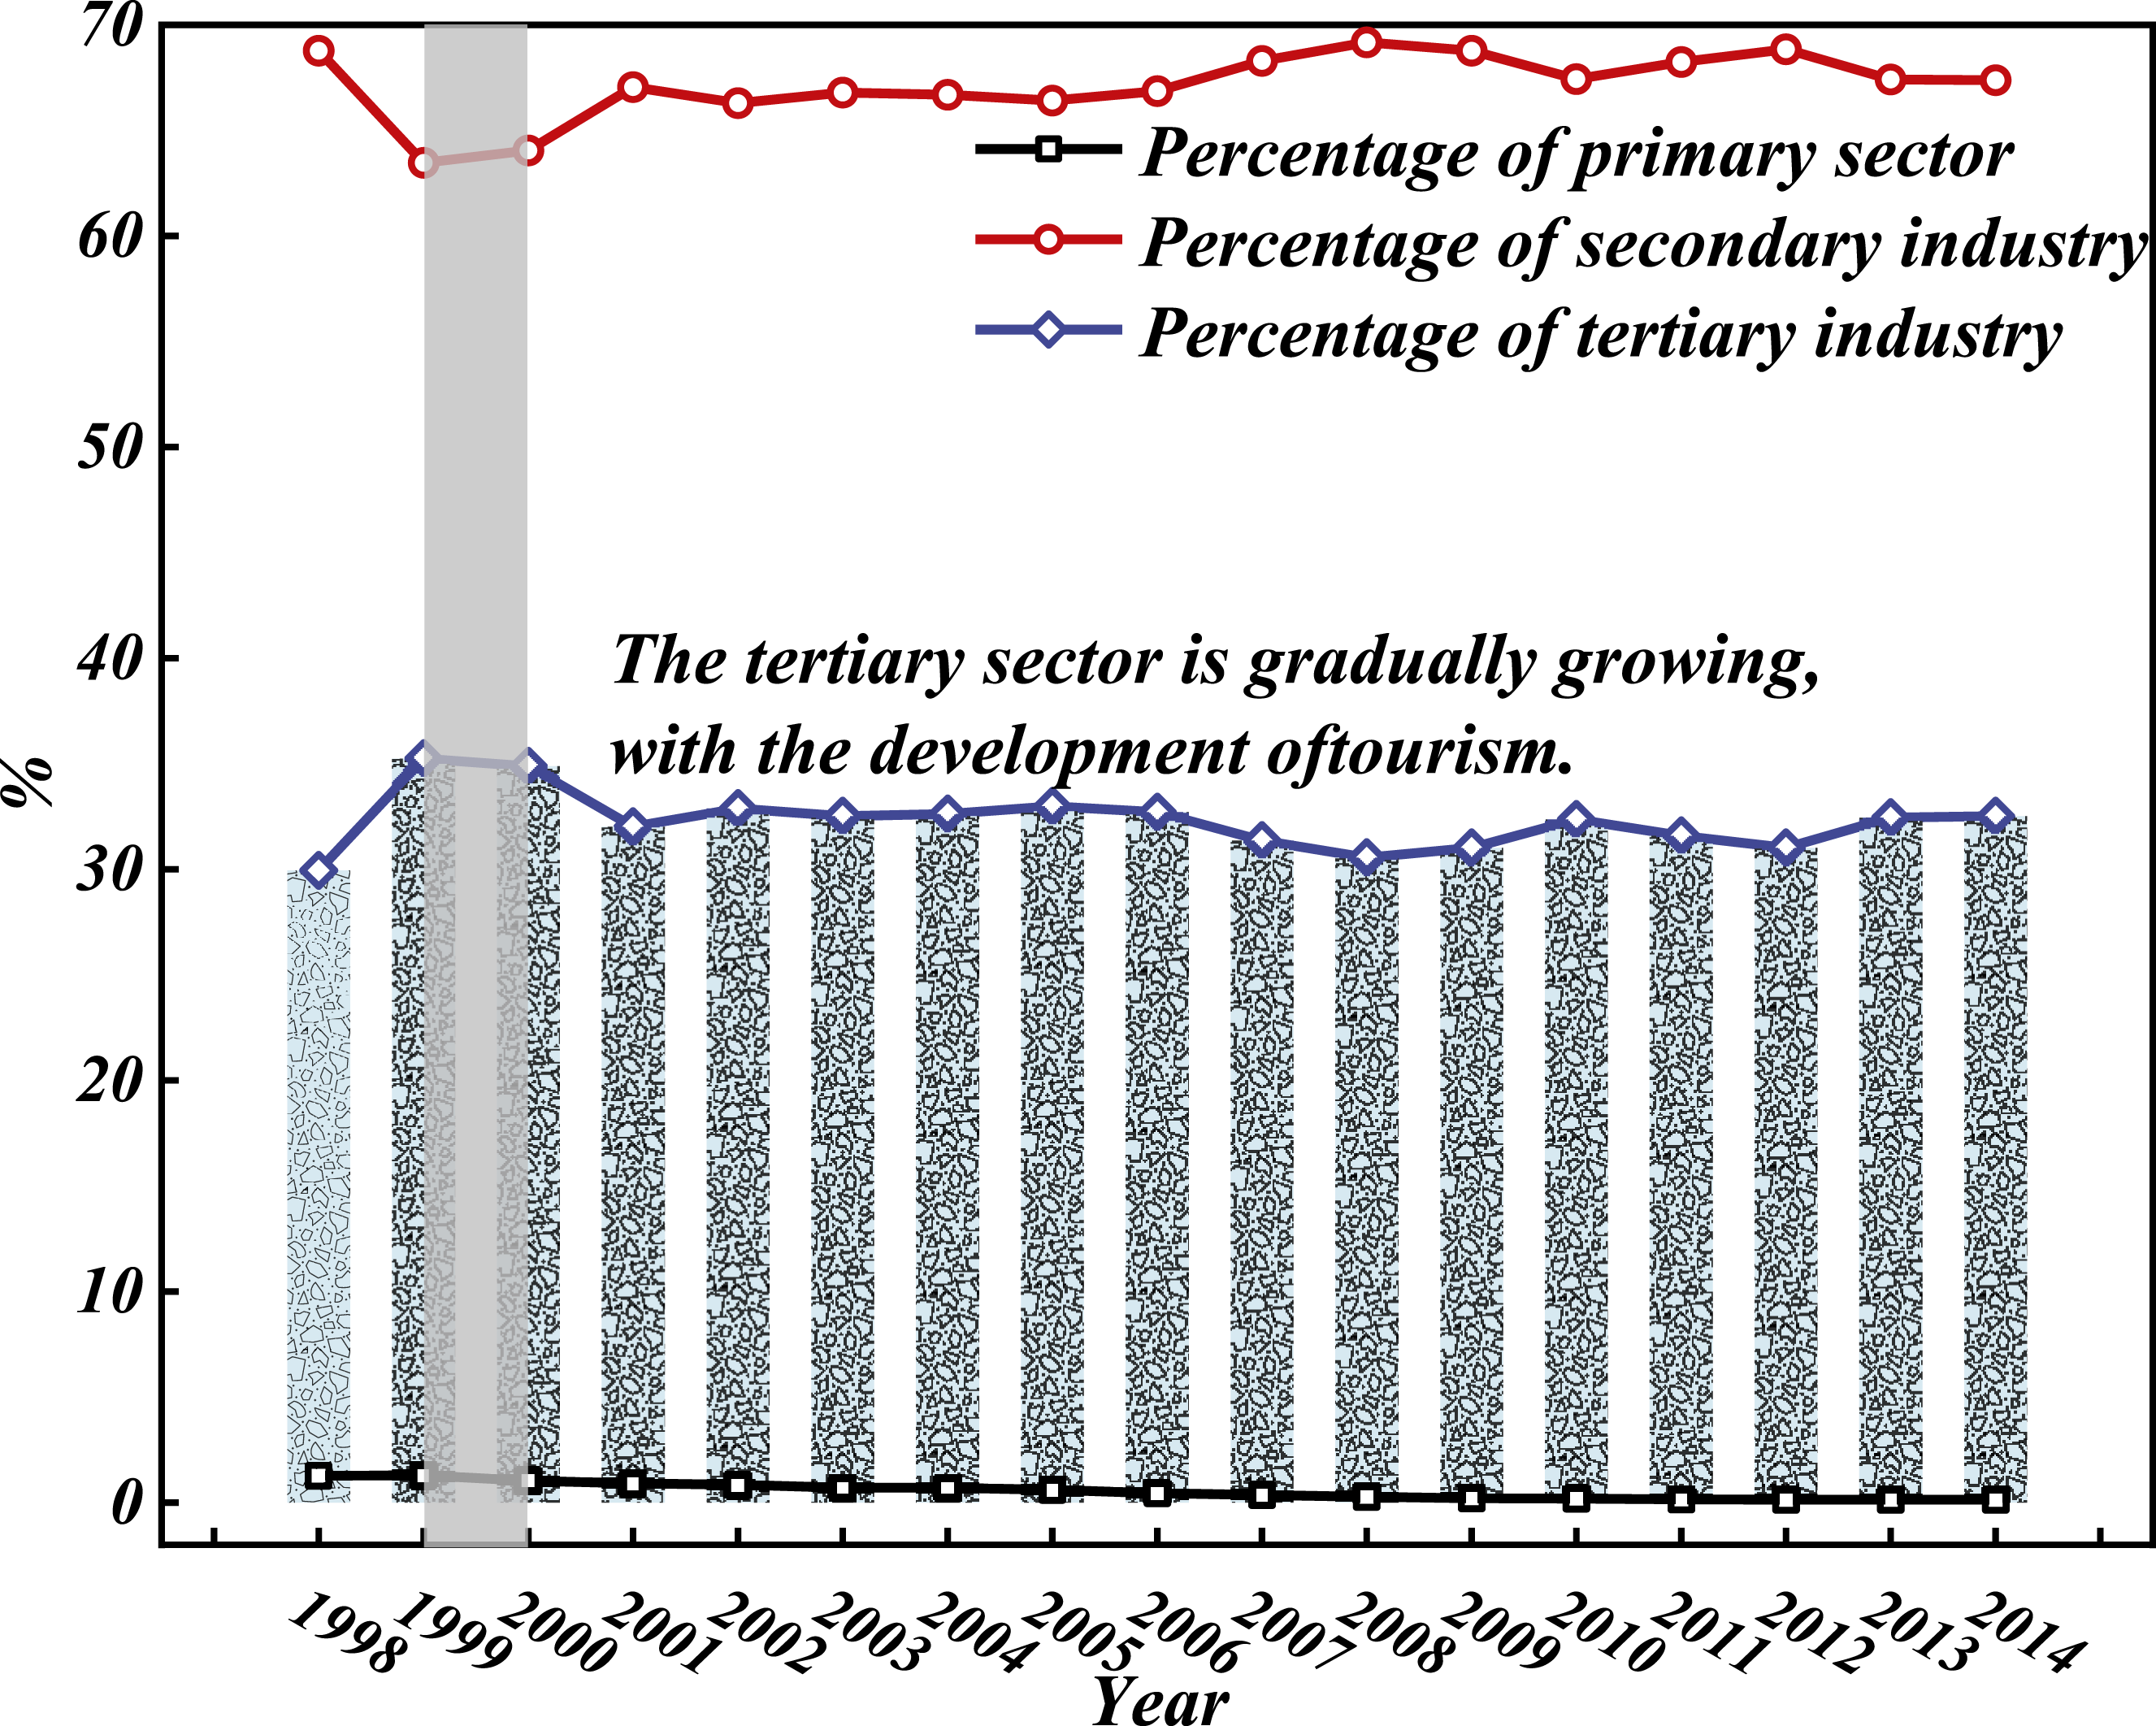
Building on the previous findings, the next section analyzes that the proportion of the primary industry in Guiyang has decreased steadily from 1.28% in 1998 to 0.13% in 2014. Several key factors contribute to this trend: Unsuitable Agricultural Conditions: Guiyang’s agricultural production conditions are relatively poor, making it less favorable for crop growth. This is mainly reflected in factors such as heavy soil texture, low organic matter content in cultivated land, and a high degree of salinization. Weak Comprehensive Agricultural Productivity: Guiyang’s agricultural structure is unbalanced, and industrialization remains underdeveloped. The limited productivity conditions result in low crop yields and poor economic returns. Lack of Unified Agricultural Development: While Guiyang is rich in agricultural resources, its development lacks large-scale integration. Certain crops, such as kiwifruit, Rosa roxburghii (cili fruit), plums, and grapes, stand out as key products, but the absence of an overarching strategic plan has led to a fragmented development model rather than a cohesive industry strategy.11–13 Limited Presence of Leading Agribusiness Enterprises: The number of leading agricultural enterprises in Guiyang is relatively low, resulting in weak industrial support. Furthermore, the national influence of Guiyang’s agribusiness brands remains limited, making it difficult to drive farmer participation and enhance overall production efficiency. These factors collectively contribute to Guiyang’s slow agricultural development and low production levels. 14 In recent years, however, Guiyang has been leveraging its unique resource advantages to develop specialized agriculture, particularly focusing on urban and sightseeing agriculture, which has gradually strengthened the role of leading agricultural industries in new development zones.
The secondary industry has experienced rapid development and has remained the dominant sector
Over the past two decades, the secondary industry has consistently accounted for a far larger share than the primary and tertiary industries, maintaining a proportion of 60%–70%. It has been the primary driver of Guiyang’s economic growth. In 1998, the gross output of the secondary industry was 26.272 billion yuan, which surged to 540.303 billion yuan by 2014, reflecting nearly a 20-fold increase. The peak proportion of the secondary industry was reached in 2008, at 69.17%, cementing its role as the main engine of economic growth in Guiyang.
Steady growth of the tertiary industry
In terms of growth rate, the gross output of the tertiary industry has shown consistent growth, maintaining a share of approximately 32%. The highest share was recorded in 1998, at 35.24%. The fastest growth occurred in 2007, at 28.6%, surpassing both the overall city and new district growth by 13.4 percentage points and 8.1 percentage points, respectively. In Guiyang’s overall industrial structure, the share of the tertiary industry is slightly lower than the secondary industry, remaining above 40%. In 2014, the industrial structure was 1.3:50.6:48.1, with the tertiary industry accounting for 16 percentage points less than the secondary industry. Nonetheless, since 2001, the growth rate of Guiyang’s tertiary industry has consistently outpaced the city’s average, with the exception of slight declines in 2004 and 2006. This indicates that the tertiary industry has gradually developed and has been a significant force in driving the economic growth of the new district, with substantial potential for further growth.
In terms of fixed asset investment, the acceleration of investments in the tertiary industry has provided a solid foundation for its rapid growth. In 2009, investment in fixed assets in the tertiary industry for the first time surpassed that in the secondary industry, reaching 139.218-billion-yuan, accounting for 55.6% of Guiyang’s total investment. Since then, investments in the tertiary industry have surged, outpacing the secondary industry and creating favorable conditions for the continued development of Guiyang’s tertiary sector. It is clear that the tertiary industry will be the primary driving force behind the development of the new district.
Spatial and temporal evolution of tourism for regional economic development
Model analysis
The direct consumption coefficient, also known as the technical coefficient, indicates the quantity of product i consumed for every unit of product j produced. It represents the production technology structure of the regional economy and reflects the direct interconnection between different economic sectors within the region. The calculation formula is as follows
X j represents the total input value of the j-th sector, while X ij denotes the value of the i-th type of product directly consumed by the j-th sector.
The full consumption coefficient (b
ij
) refers to the sum of both the direct and indirect consumption of product or service i when producing one unit of final product in sector j.
15
Therefore, the full consumption coefficient offers a more comprehensive view of the interconnections between economic sectors. A higher bij indicates a stronger complete dependency of sector j on sector i. In essence, calculating the full consumption coefficient is the summation of a “geometric series with decreasing terms.”
The direct distribution coefficient (d
ij
) represents the proportion of the output of sector i allocated to sector j for its use. A larger d
ij
indicates a higher intensity of direct demand for sector i’s products by other industries. The calculation formula is as follows
The full distribution coefficient (w
ij
) represents the amount of value transferred to sector j when sector i increases its output by one unit, whether directly or indirectly.16,17 It reflects the total contribution of sector i to sector j. A larger w
ij
indicates stronger overall demand from other sectors for products from sector i. By analogy with the full consumption coefficient (b
ij
), the calculation formula is as follows
Geospatial temporal evolution
The backward linkage of an industry refers to the dependency relationship between upstream industries that exchange consumed products with that industry, primarily reflecting the input structure characteristics of that industry. Therefore, the backward linkage effect of tourism reflects the output value of products consumed by tourism from other industrial sectors and the payment structure of product elements across these sectors (Jaelani et al., 2020). The backward linkage intensity of tourism can be divided into direct backward linkage and full backward linkage, typically measured using the direct consumption coefficient and the full consumption coefficient of the tourism industry. The higher the backward linkage intensity, 18 the closer the dependency between tourism and the industry, and the stronger the demand-pulling effect of tourism development on that industry.
By calculating the basic flow table of the adjusted input-output for the region, the direct consumption coefficient reflecting the direct backward linkage intensity of regional tourism is obtained, as shown in Figure 5. Regional tourism consumption factor analysis.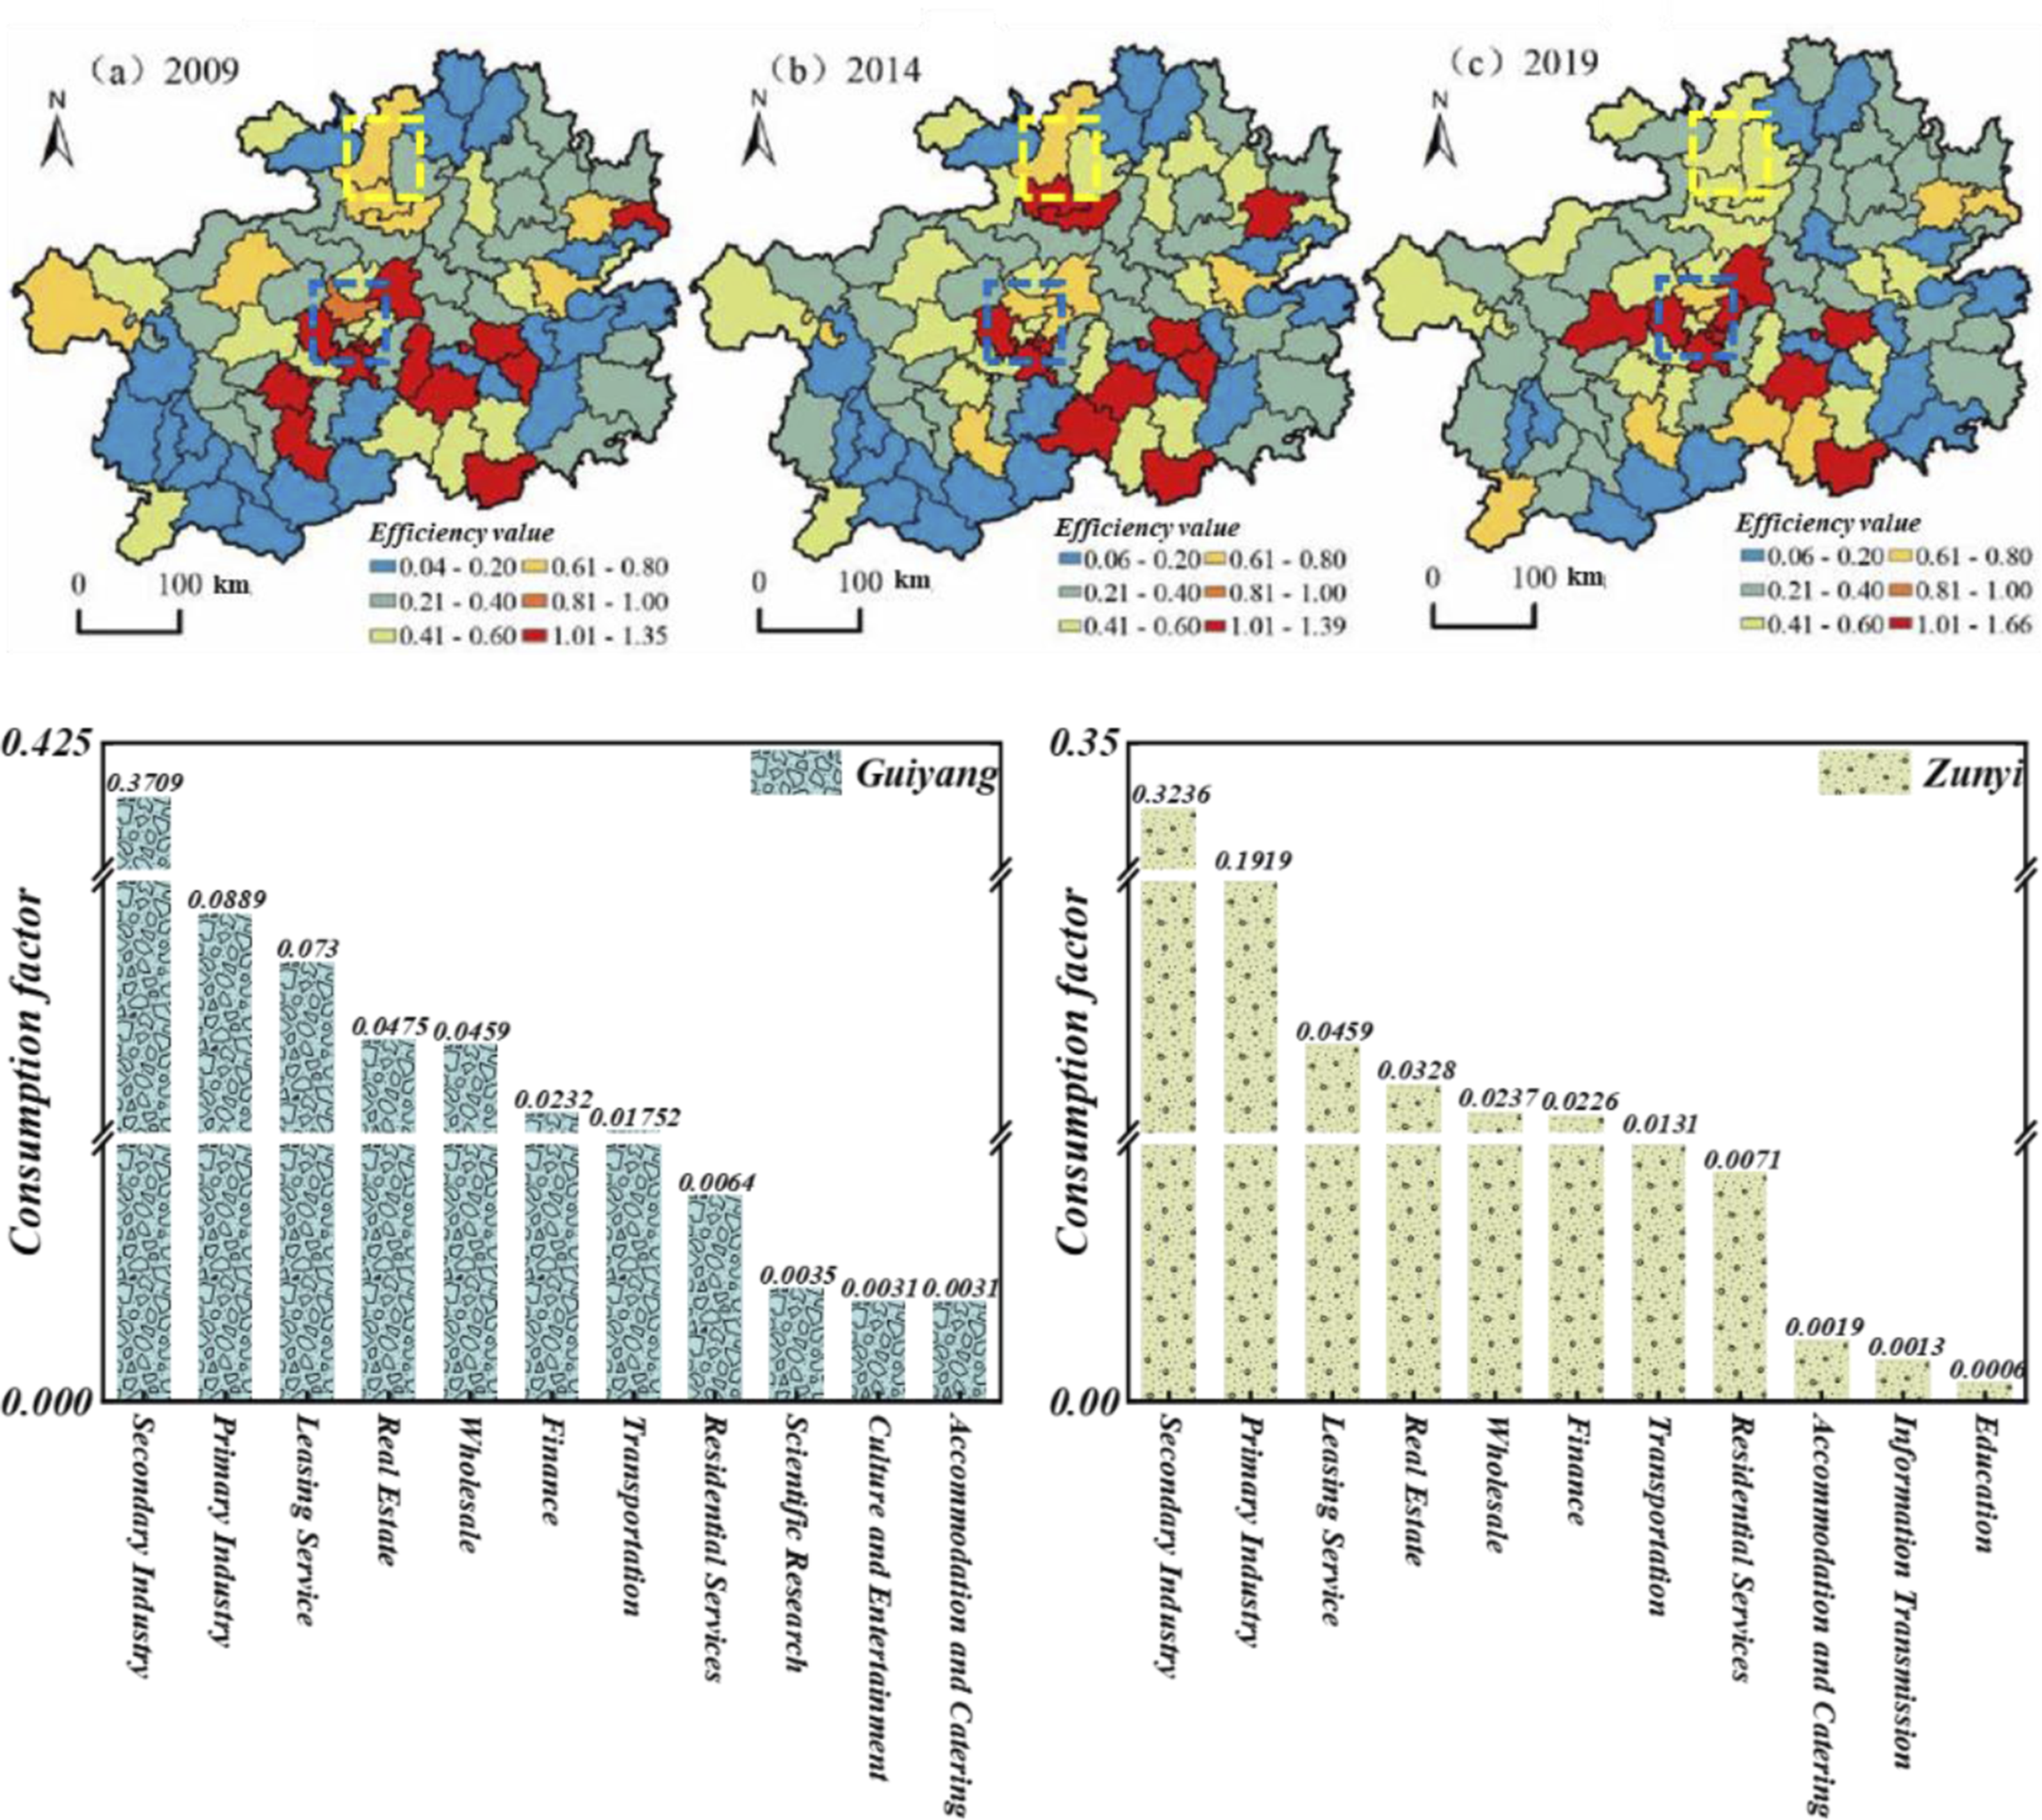
As shown in Figure 5, in 2019, the top six industries with the highest dependence on regional tourism accounted for over 53% of the direct consumption products of tourism. These industries are the primary consumers for the tourism sector, and tourism development has the strongest driving effect on these six sectors, which are concentrated in this group. Furthermore, the types of these six sectors are identical across the region. This indirectly reflects the consistency of the industries that support or are most influenced by tourism development in the region, providing a strong foundation for future exploration of coordinated regional tourism development. It is worth noting that, in the subsequent analysis of the region’s input-output data for 2009, the top six or even top eight industries with the highest direct backward linkage intensity were not the same. This may indicate the progress made in regional integration efforts by both the central and local governments from 2009 to 2019, especially in the coordinated development of tourism.
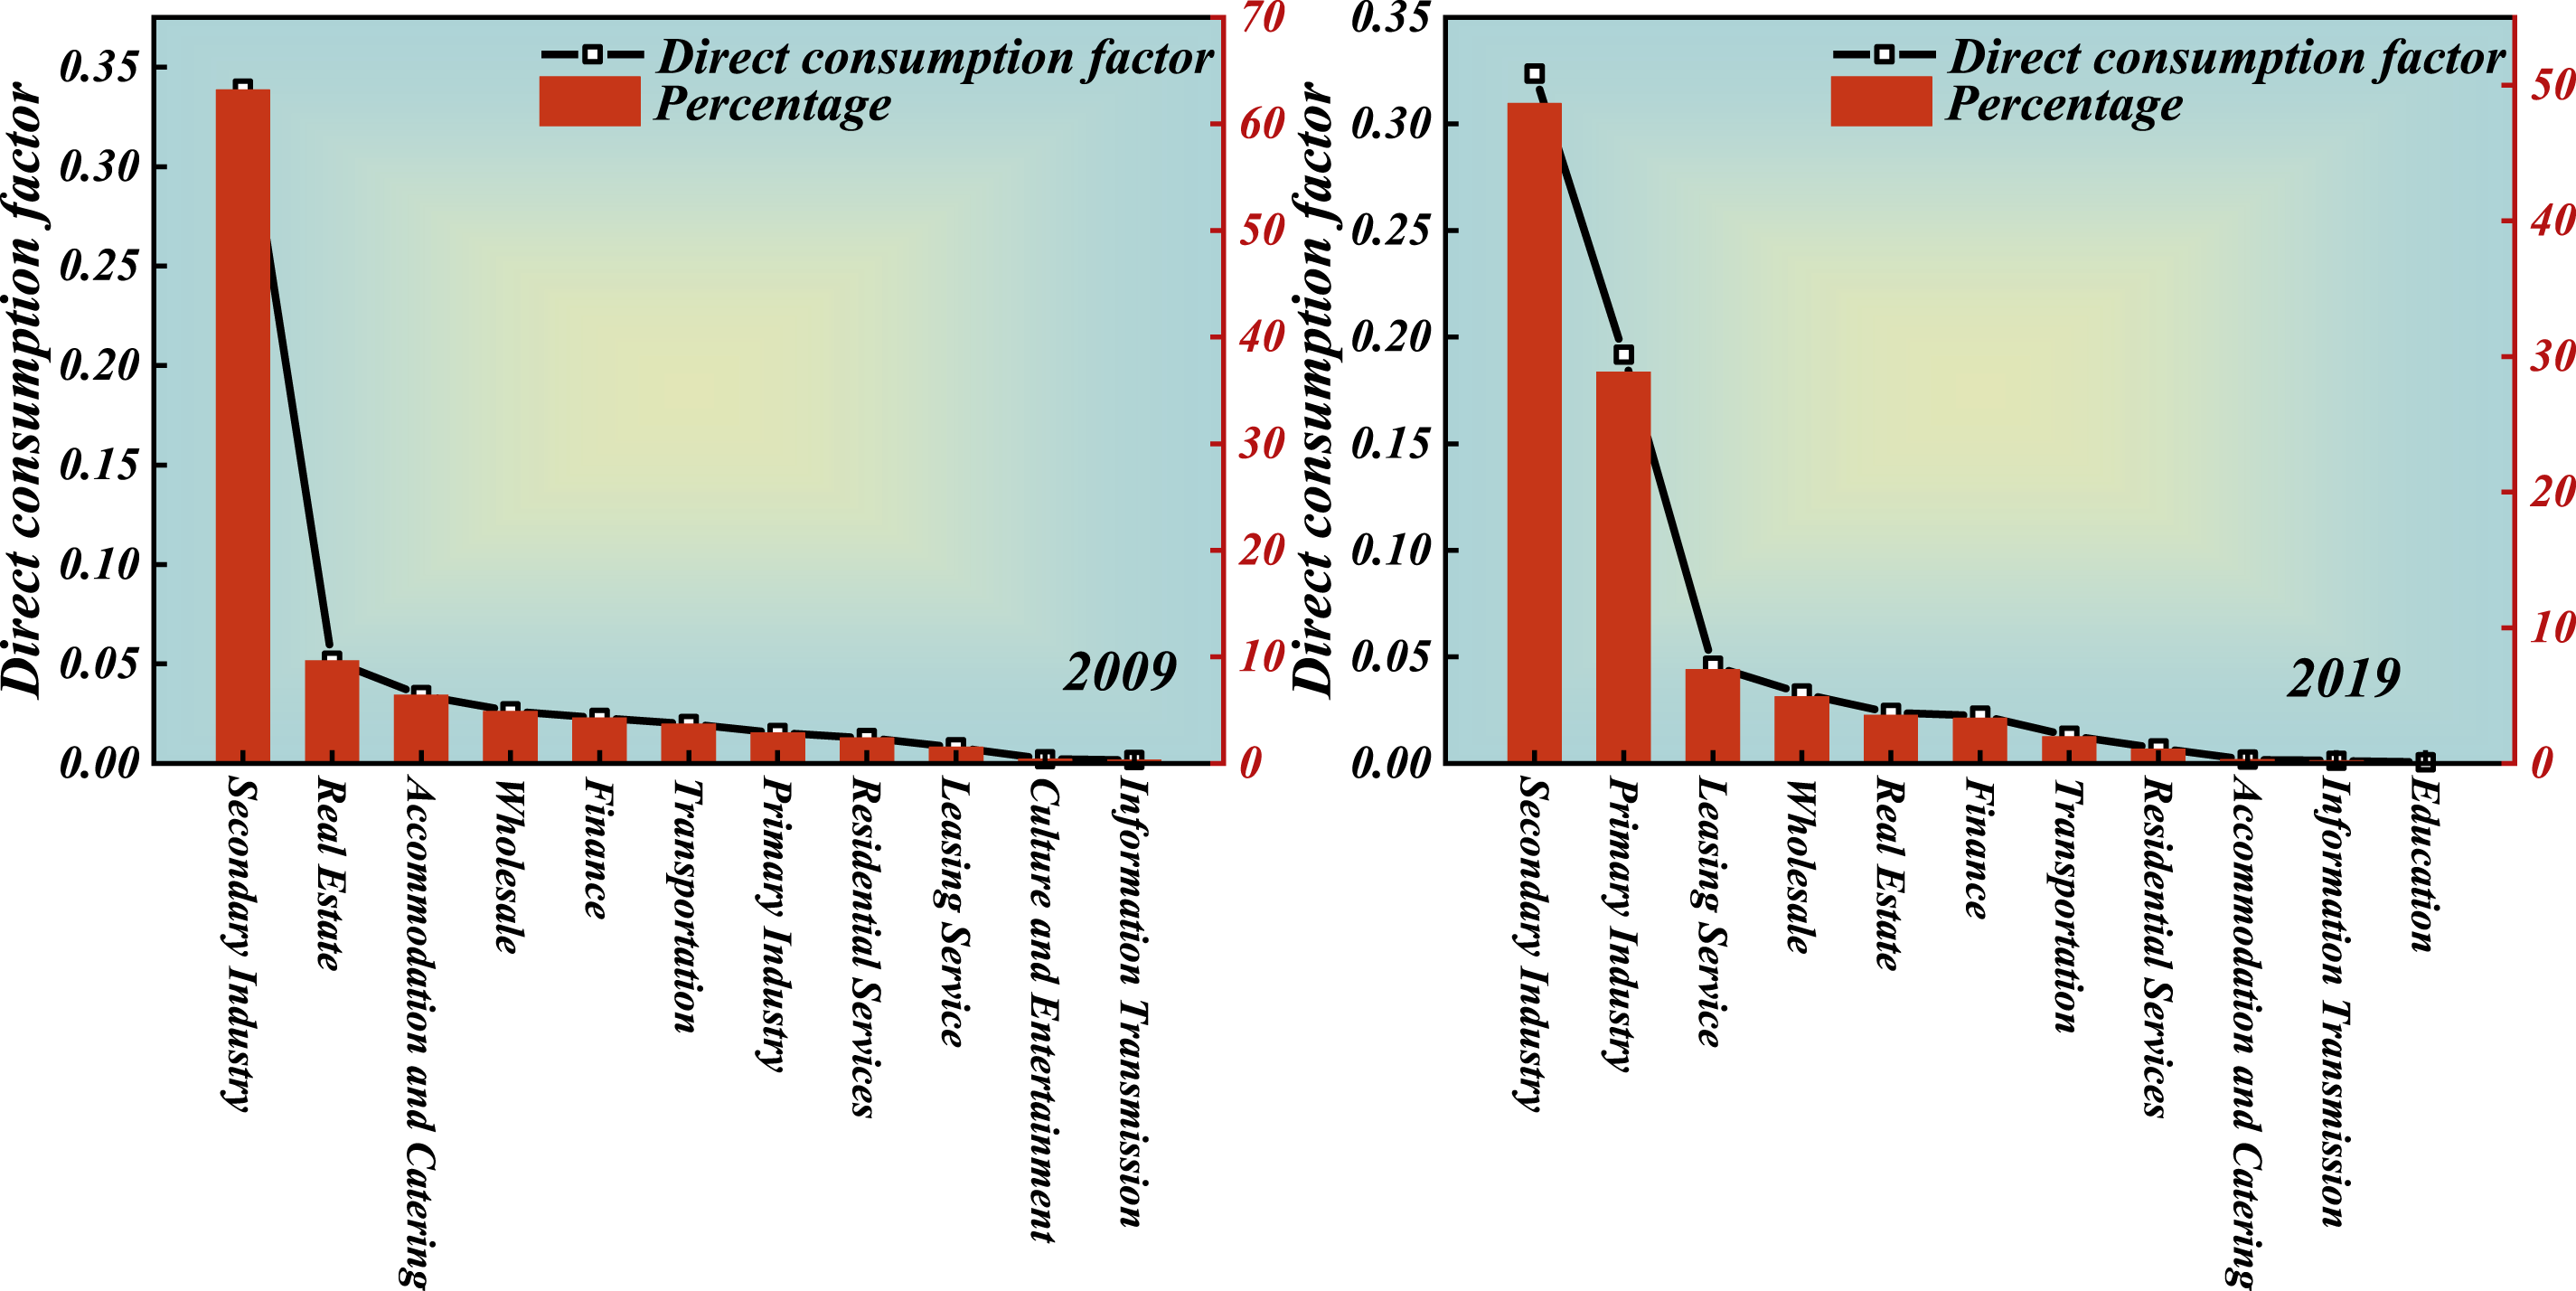
Based on Figure 5, this paper incorporates the national economic input-output basic flow table, revised in 2009 for the region, to calculate the direct consumption coefficients that reflect the direct backward linkage intensity of tourism in different regions and at different time points, as shown in Figures 6 and 7. By comparing the changes in the direct backward linkage coefficients of regional tourism between 2009 and 2019, this paper analyzes the evolution patterns over time. Changes in direct consumption coefficients of tourism in Guiyang, 2009 and 2019. Change in direct consumption coefficient of tourism in Zunyi, 2009 and 2019.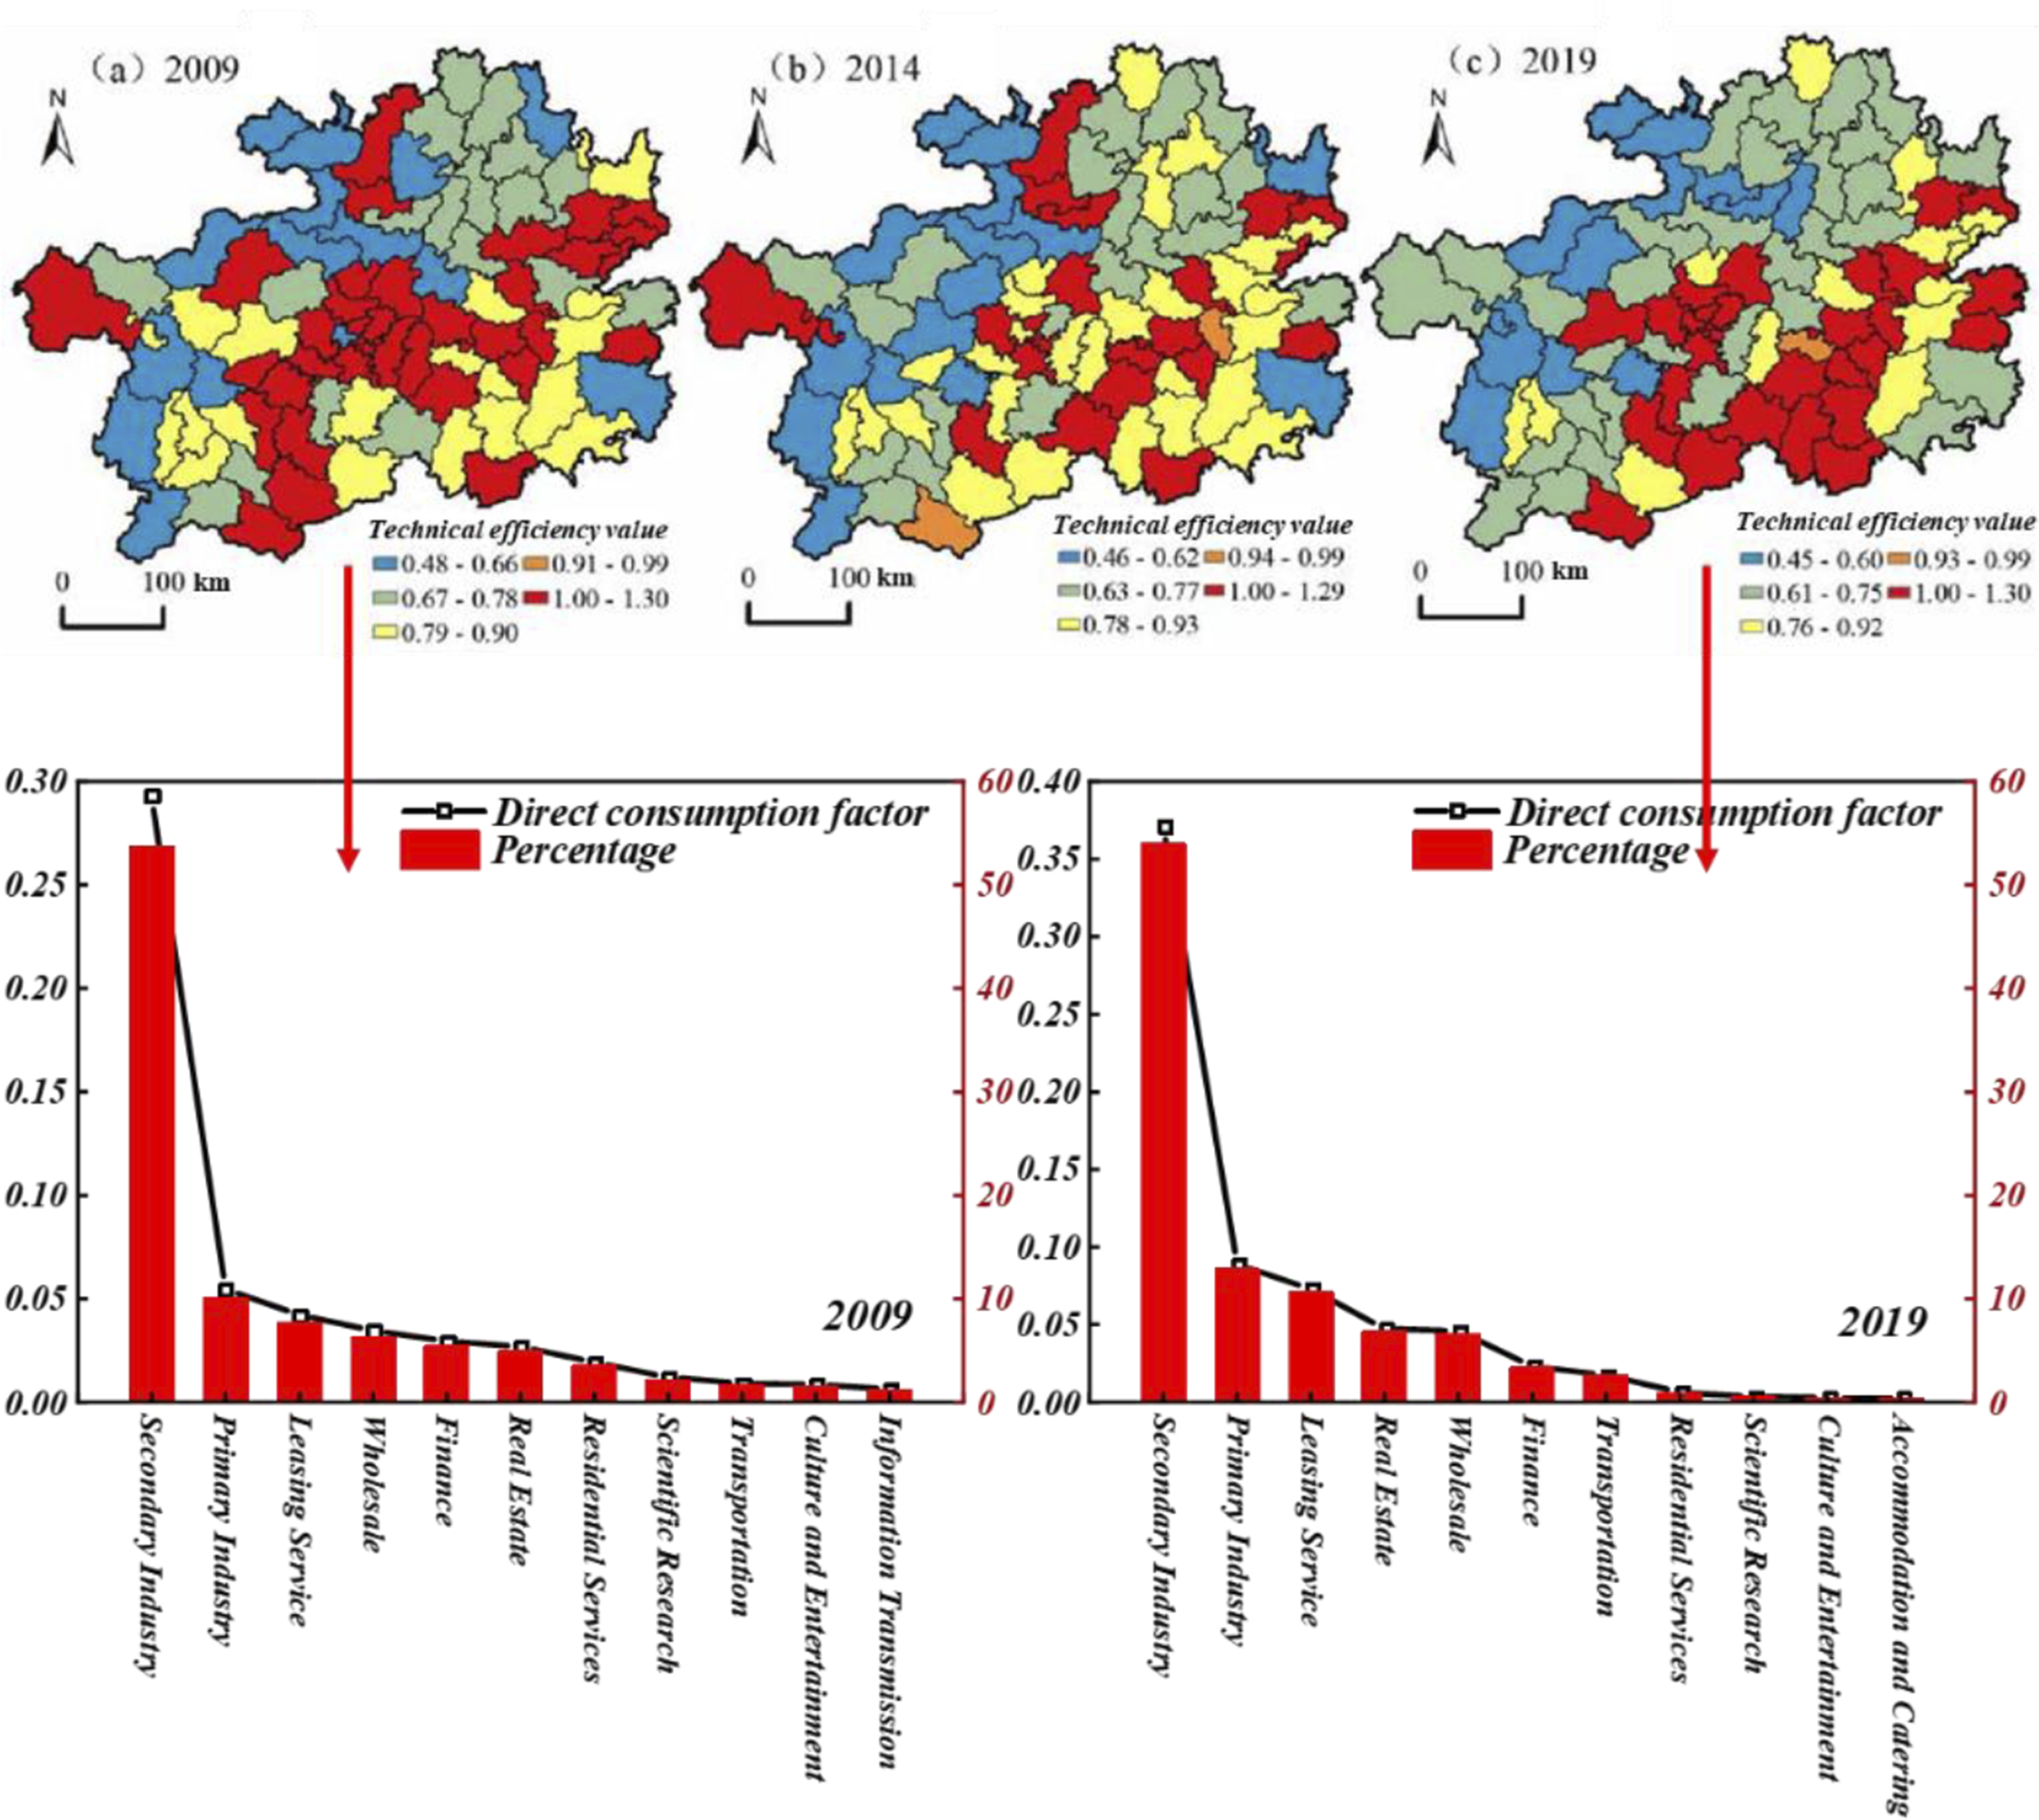
Firstly, the backward linkage intensity of tourism in Guiyang has undergone the following significant changes between 2009 and 2019. In 2019, the total direct driving intensity of tourism on multiple sectors significantly exceeded that of 2009, with an average annual growth rate exceeding 5%. This reflects the increasingly substantial impact of tourism on national economic development. Additionally, the concentration of industries with backward linkages to tourism continued to rise. In 2009, the top nine industries provided more than 95% of the tourism industry’s product consumption. By 2019, the same consumption could be met by just the top six industries, four of which, apart from the primary and secondary industries, exhibited high added-value characteristics. This demonstrates the increasing stability and maturity of Guiyang’s tourism industry input structure.
The changes in the backward linkage intensity of tourism in Zunyi between 2009 and 2019 are mainly as follows. First, similar to Guiyang, the total direct driving intensity of Zunyi’s tourism on 16 sectors in 2019 significantly increased compared to 2009, with an average annual growth rate approaching 5%. Second, while the concentration of backward-linked industries in Zunyi remained relatively stable, the composition of these industries changed significantly. In 2019, the accommodation and catering industry, along with the transportation, storage, and postal services sectors, were replaced by leasing and business services. Additionally, the backward linkage intensity to the primary industry was notably strengthened. This shift indicates the growing role of tourism in driving both basic industries and modern business services in Zunyi.
As shown in Figure 8, the regional tourism industry influence coefficients are relatively high and significantly exceed the average impact level across all sectors of the national economy (with deviations exceeding 10 percentage points). Shaded areas represent ±1 standard deviation. This suggests that tourism industries in various regions have substantial demand for products from other industrial sectors, with long industrial chains and a significant upstream industry spillover effect. The rapid development of the tourism industry can drive synchronized rapid growth in many associated sectors. Therefore, it is essential to recognize the strategic importance of the tourism industry in the national economic development process, strongly support its rapid growth, prioritize its development, and further enhance its internal and external driving capabilities to increase its contribution to the overall national economic development. Tourism influence coefficient vs. induction coefficient.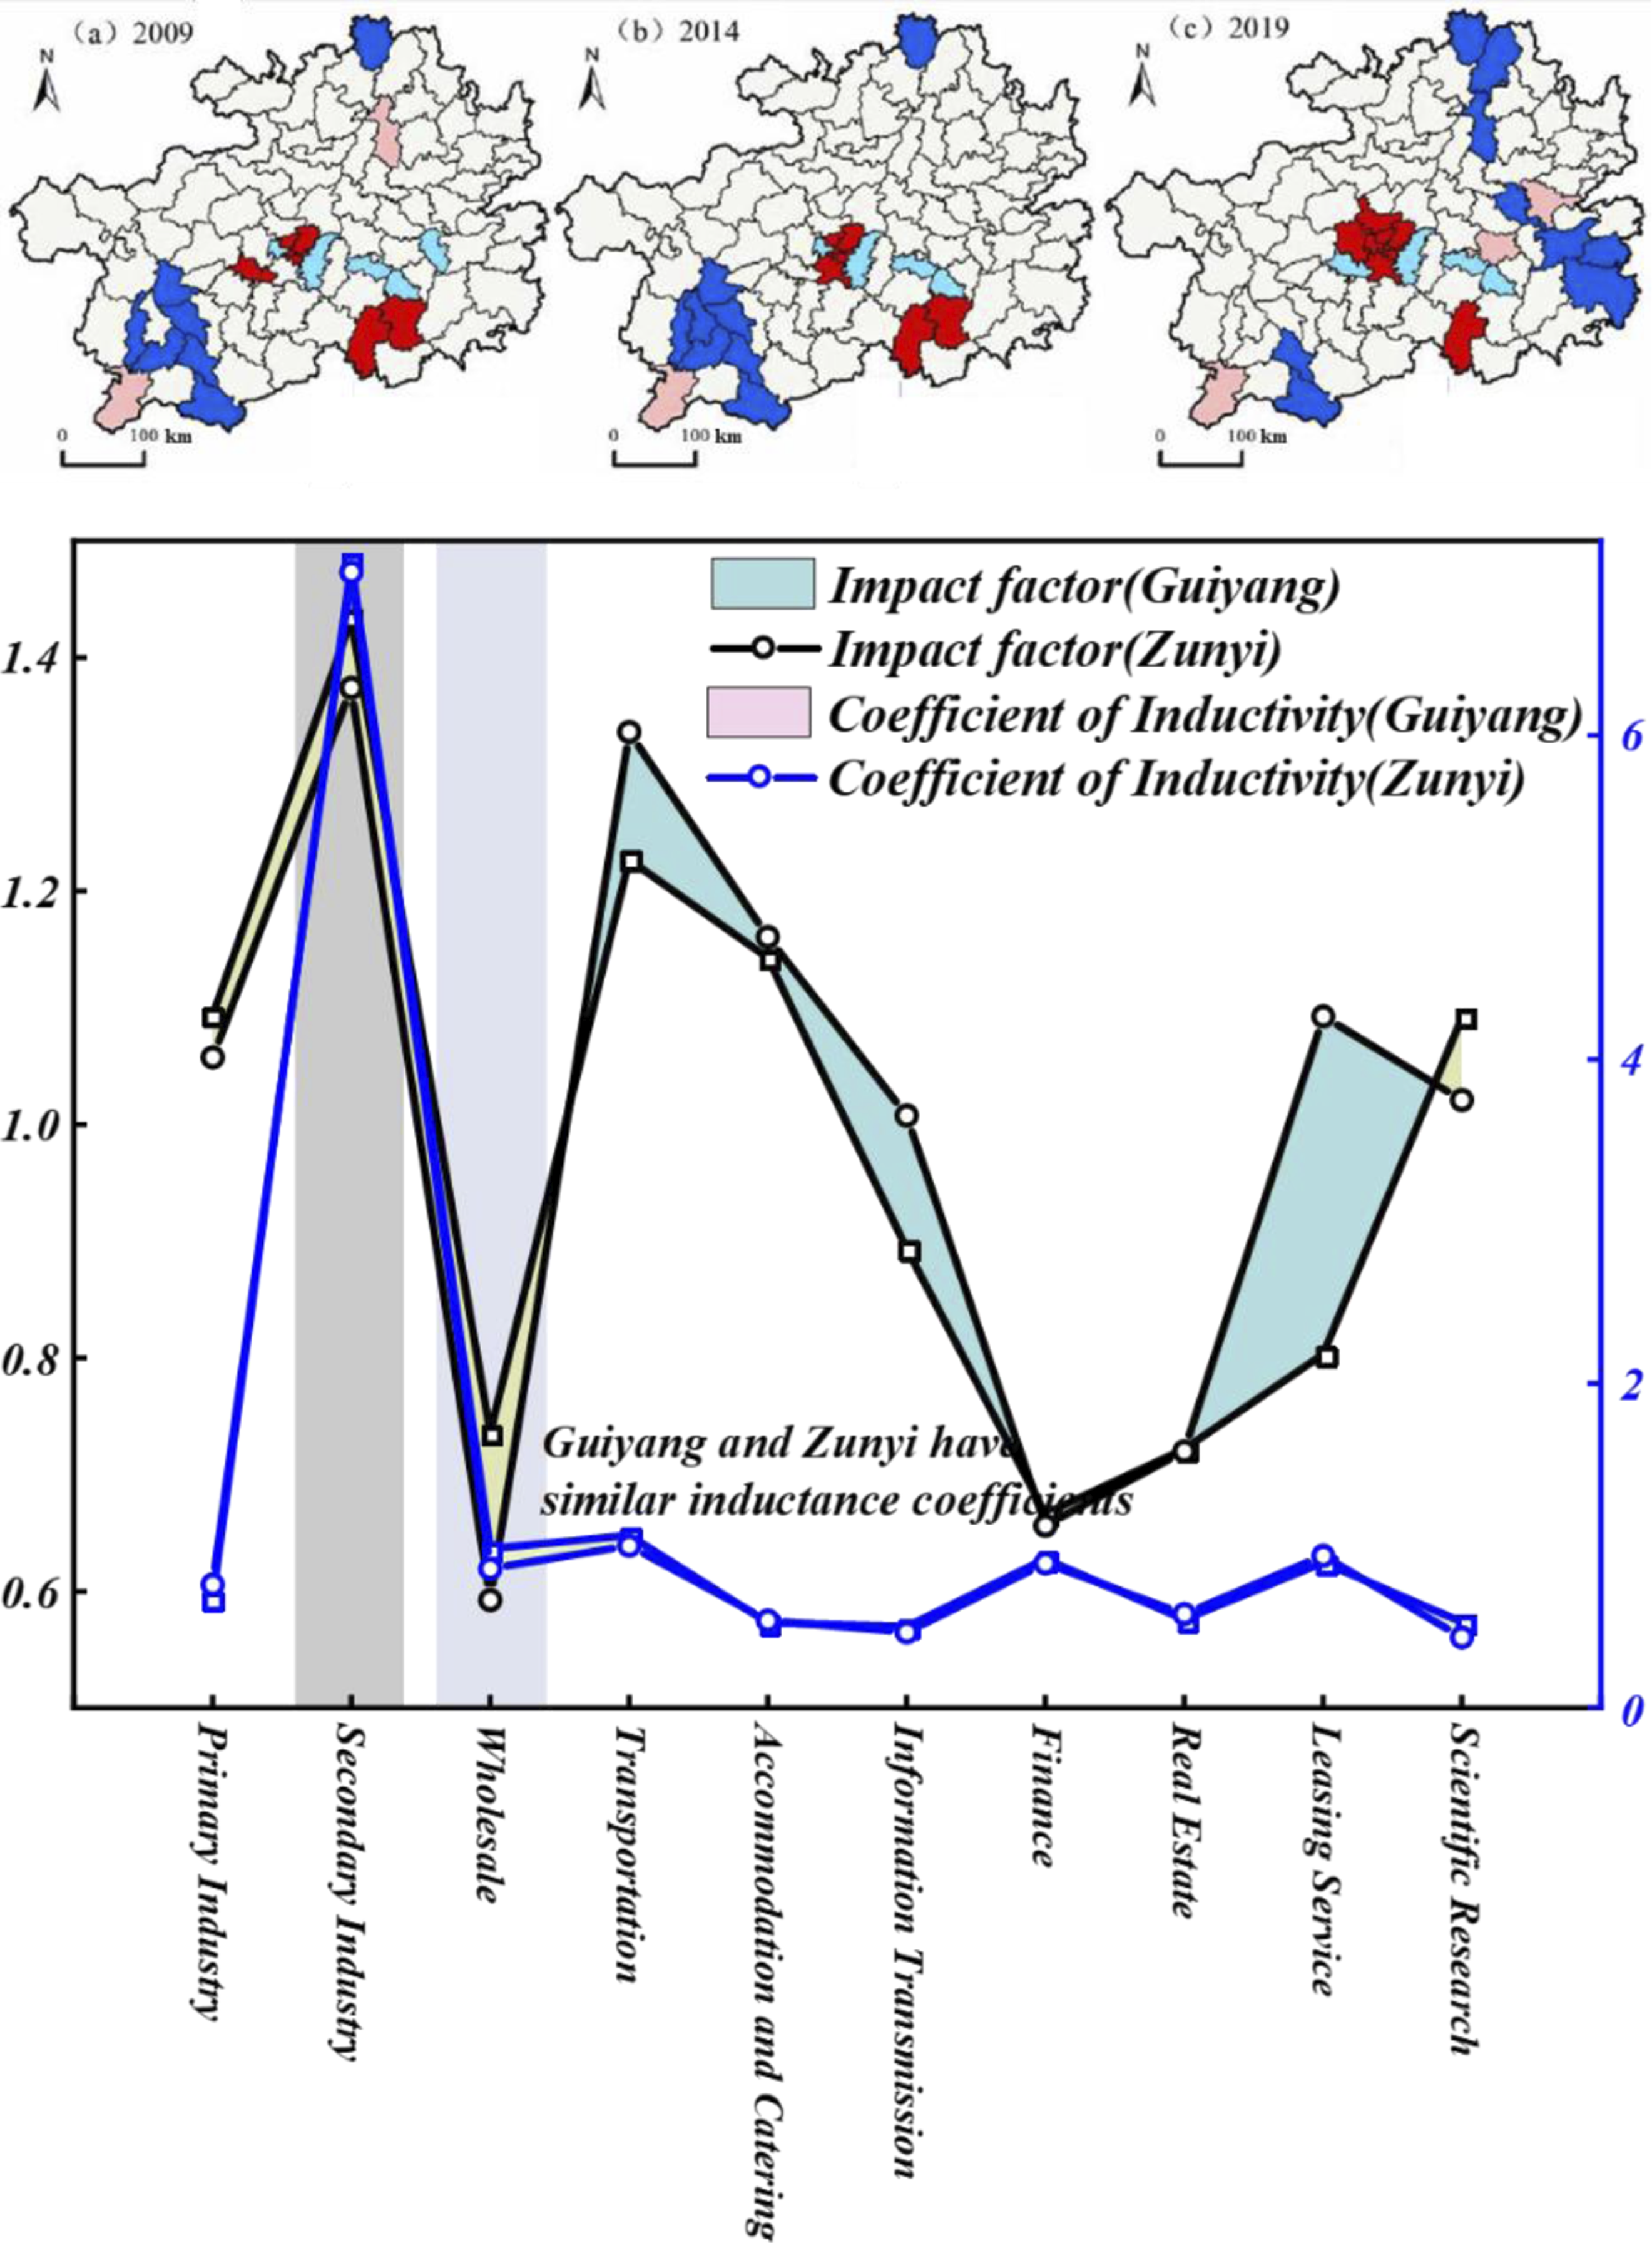
The sharp increase in tertiary industry output correlates with policy-led tourism promotion campaigns, infrastructure investment, and digitalization of services. Similarly, the rising influence coefficient of tourism in Figure 8 is largely attributed to improved accessibility and targeted policy incentives.
Model test
This study assumes that exogenous shocks such as epidemics or natural disasters are exogenous random disturbances not systematically affecting the underlying data trends from 2009 to 2019, and thus are not explicitly modeled.
In comparing the models, the R-squared values are 0.7238 and 0.7261, indicating that both models exhibit good fit performance. The fixed effects model was then subjected to an overall effect test, with an F-statistic value of 88.25. At a 5% significance level, Prob>F = 0.0000, and the p-value is significant. The random effects model for panel data was tested using the Wald (WD) test, yielding a test value of 353.49, which is also significant at the 5% significance level. These results indicate that the model is significant at the 5% level, accepting the alternative hypothesis and rejecting the null hypothesis.
Regional economic development impact analysis.
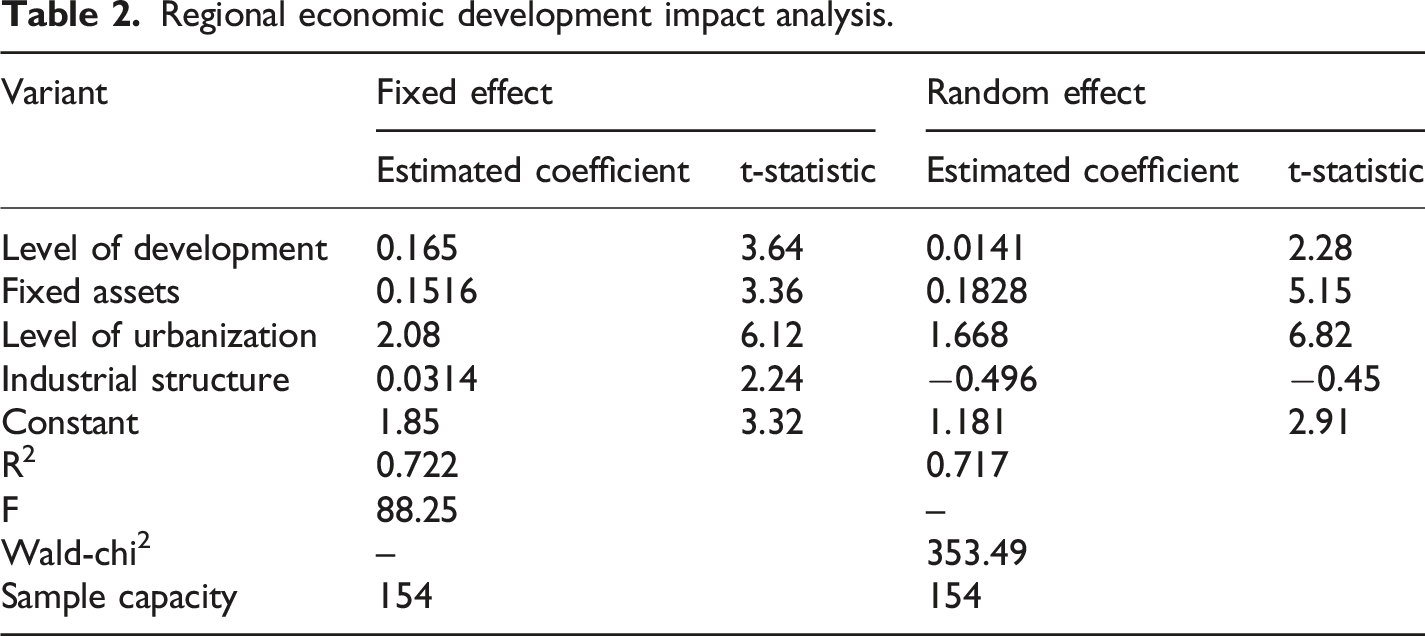
From the overall regression results, it is evident that the significance levels of all variables are highly significant, which indicates that, over the 11 years, the integration of the three industries, fixed asset investment, urbanization level, and industrial structure development have all significantly contributed to promoting the regional economy in Guizhou Province. The primary reason for this is that various industries have achieved market complementarity, technological integration, and regional convergence. The increase in the level of integration among the three industries suggests that Guizhou has effectively advanced inter-industry cooperation over the years, creating new avenues. The rise in fixed asset investment has improved infrastructure, changed residents’ lifestyles, and reduced production factor costs. The increased proportion of urbanization indicates that significant progress has been made in the construction of new-type urbanization. Moreover, the development of industrial structure has a significant impact on per capita GDP, highlighting that the growing share of the tertiary industry has played a key role in promoting the integration and upgrading of the industrial structure.
Driver analysis
Geographical probes
In recent years, the geographic detector—a new statistical method for detecting spatial differentiation and its driving factors—has a clear theoretical foundation, explicit physical meaning, simple model construction, and low requirements for application conditions. It has been widely used in fields such as public health, population distribution, land use, and urbanization to reveal the spatial differentiation characteristics of various phenomena and the magnitude of their driving forces.19,20 The geographic detector is based on the assumption that two variables with a causal relationship will exhibit similar spatial distributions. It divides the study area into several sub-regions and quantifies spatial differentiation by calculating the variance differences between sub-regions and the total variance within the region. Examining the consistency of the spatial distribution of different variables helps assess their interactions. 21 It also has the capability to detect interaction effects, identifying changes in the strength of the relationship between independent and dependent variables, without needing to consider the issue of multicollinearity among multiple variables. 22 Additionally, the geographic detector does not require a large sample size and can meet econometric analysis requirements even when the sample size is less than 30.
This paper uses the geographic detector to analyze regional economic development factors. The model is as follows
The detection of interaction effects between two factors begins by calculating the individual q values for each factor, followed by the calculation of the q value when the two factors interact. By comparing the two, the nature of the interaction is determined. The interactions are categorized into five types: nonlinear attenuation, single-factor nonlinear attenuation, dual-factor enhancement, independence, and nonlinear enhancement.
Compared with geographically weighted regression (GWR), the geographic detector method does not require linear assumptions or large sample sizes, and is more suitable for detecting spatial differentiation and interactions in tourism development patterns with limited regional data. Its interpretability and robustness in identifying the driving factors of spatial heterogeneity justify its selection in this study.
Analysis of regional economic mechanisms for tourism coordination
Based on the preliminary identification of the using elements for the coordinated improvement of the tourism enterprise and tourism surroundings device in Guizhou Province, and the use of the impediment diploma mannequin to investigate the consultant symptoms for every using factor, a complete evaluation is carried out to discover the essential elements with robust terrible riding results (obstruction). As proven in Figure 9, the coupling coordination degree between the tourism enterprise and tourism surroundings gadget in Guizhou Province is strongly influenced via four elements: policy regulation intensity (PORL, 87.5%), degree of openness (OPEN, 87.5%), technological and informational level (INFO, 87.5%), and regional industrial structure (INST, 75%). These factors account for over 60% of the total occurrences, with each averaging around 15%. This indicates that these factors currently have a relatively low level of development and weak support for relevant tourism flows, and they have not yet generated significant positive driving effects. As such, they represent the primary weaknesses in the coordinated development of the tourism industry and tourism environment system in Guizhou. These areas should be prioritized for improvement in the future development of tourism in the region. Harmonization of development drivers.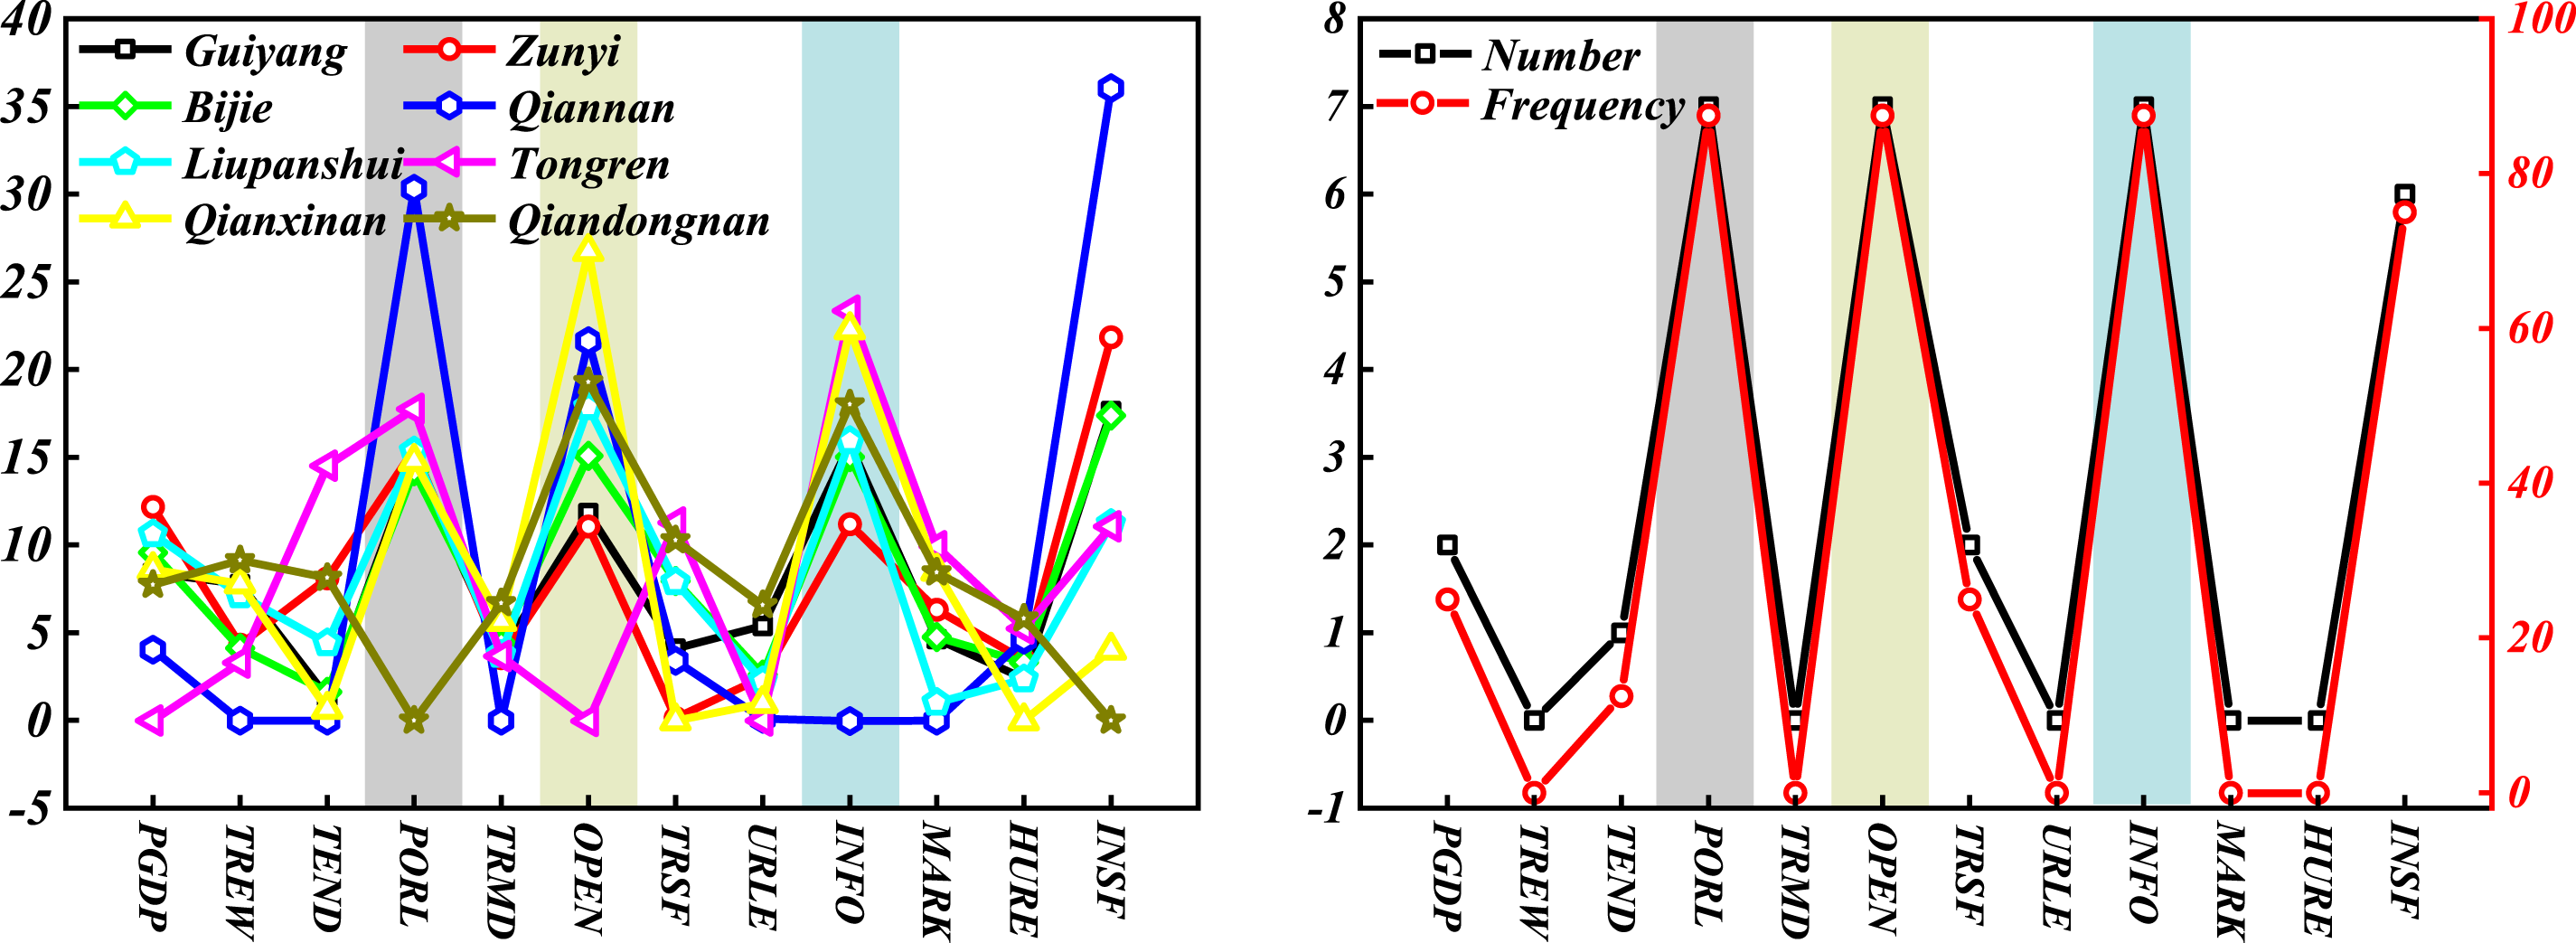
Based on the obstacle degree model results, four factors with strong negative driving effects (obstruction) on the coordinated development of the tourism industry and tourism environment system in Guizhou Province—policy regulation intensity (PORL), degree of openness (OPEN), technological and informational level (INFO), and regional industrial structure (INST)—are excluded. Using the natural breakpoint method in ArcGIS 10.2 software, the raw data for each driving factor is categorized into four groups from high to low and converted into types (independent variables). The original data of the coupling coordination degree is used as the dependent variable. The factor detector and interaction effect detector in the geographic detector are then employed to further explore the positive driving effects of eight factors: regional economic base (PGDP), tourism resource endowment (TREW), transportation network density (TEND), tourism market demand (TRMD), tourism service facilities (TRSF), urbanization level (URLE), regional market scale (MARK), and human resources support (HURE).
In general, as proven in Figure 10, the using results of these factors on the coupling coordination diploma between the tourism enterprise and tourism surroundings device in Guizhou Province are enormously strong. The detection values of all riding elements exceeded the magnitude take a look at the 99% self-assurance level. However, the standard energy of the riding outcomes varies. The urbanization level (0.968) has the strongest driving effect, followed by regional economic base (0.799), regional market scale (0.748), tourism market demand (0.747), human resources support (0.730), tourism resource endowment (0.720), tourism service facilities (0.611), and transportation network density (0.591), in descending order. This confirms that the coordinated development of the regional tourism industry and tourism environment system is driven by multiple factors. The growth and development of these factors deeply influence the quality and level of the regional tourism system’s development. Interaction detection results of harmonized development drivers.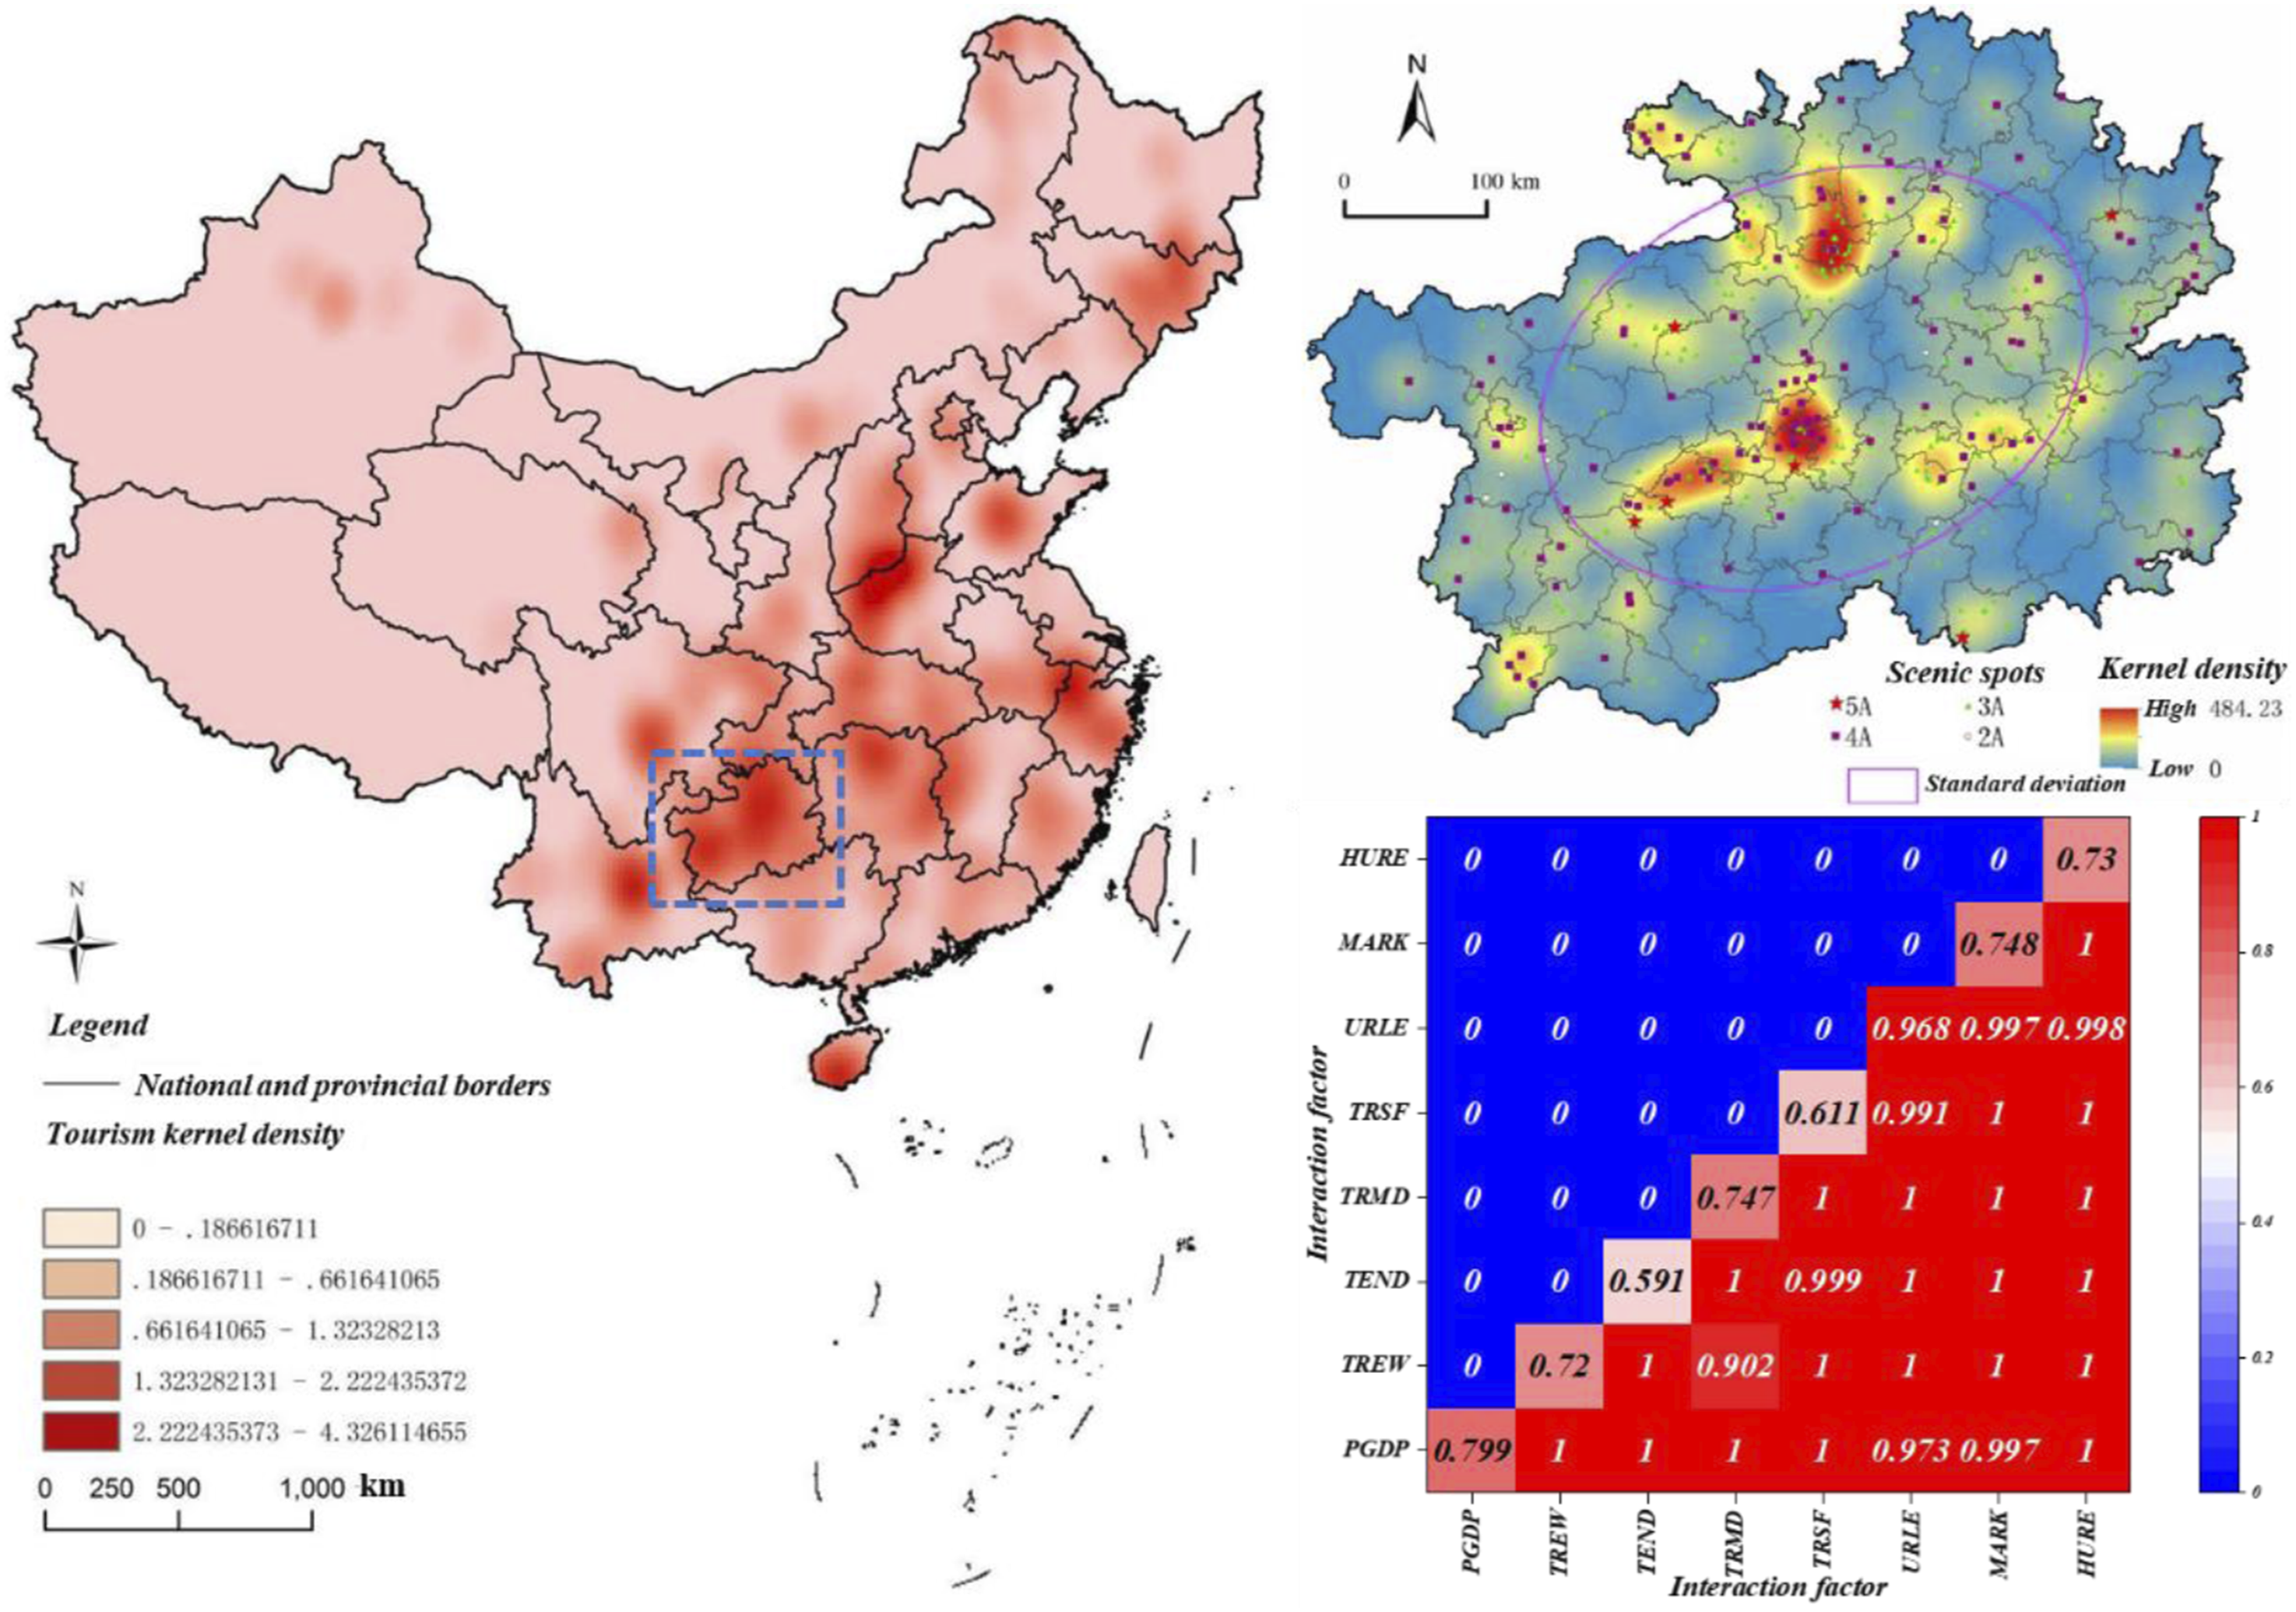
Influencing factors
As proven in Figure 11, the influence of more than a few elements on the complete improvement degree of the tourism enterprise in Guizhou is ranked as follows: the wide variety of star-rated accommodations > tourism aid blessings > the variety of home and overseas vacationers obtained > whole tourism enterprise earnings > home tourism consumption, with everything having an common weight increased than 0.1. These elements specifically mirror the factor shape of the tourism enterprise and the market measurement at the tourism enterprise standards level, whilst the indications associated to the tourism industry’s advantages have a lesser impact. This shows that, in the procedure of tourism enterprise improvement throughout Guizhou, extra interest needs to be given to the factor shape and market measurement of the tourism industry, mainly the wide variety of star-rated hotels, the improvement of tourism resources, and the enchantment of home and overseas tourists. Over the previous 11 years, the areas with the very best will increase in tourism income, exceeding 10 billion yuan, are Guiyang, Zunyi, Anshun, Liupanshui, Qiannan Buyei and Miao Autonomous Prefecture, and Qiandongnan Miao and Dong Autonomous Prefecture. These six regions are currently experiencing rapid tourism industry development. Among them, Anshun, Liupanshui, and Zunyi are classified as tourism industry lagging coupling-coordination transition types. These regions should continue to attract more domestic and foreign tourists, expand the tourism market, remove barriers to tourism industry development, and advance towards higher coupling coordination types. Tourism industry and regional economic indicator weights.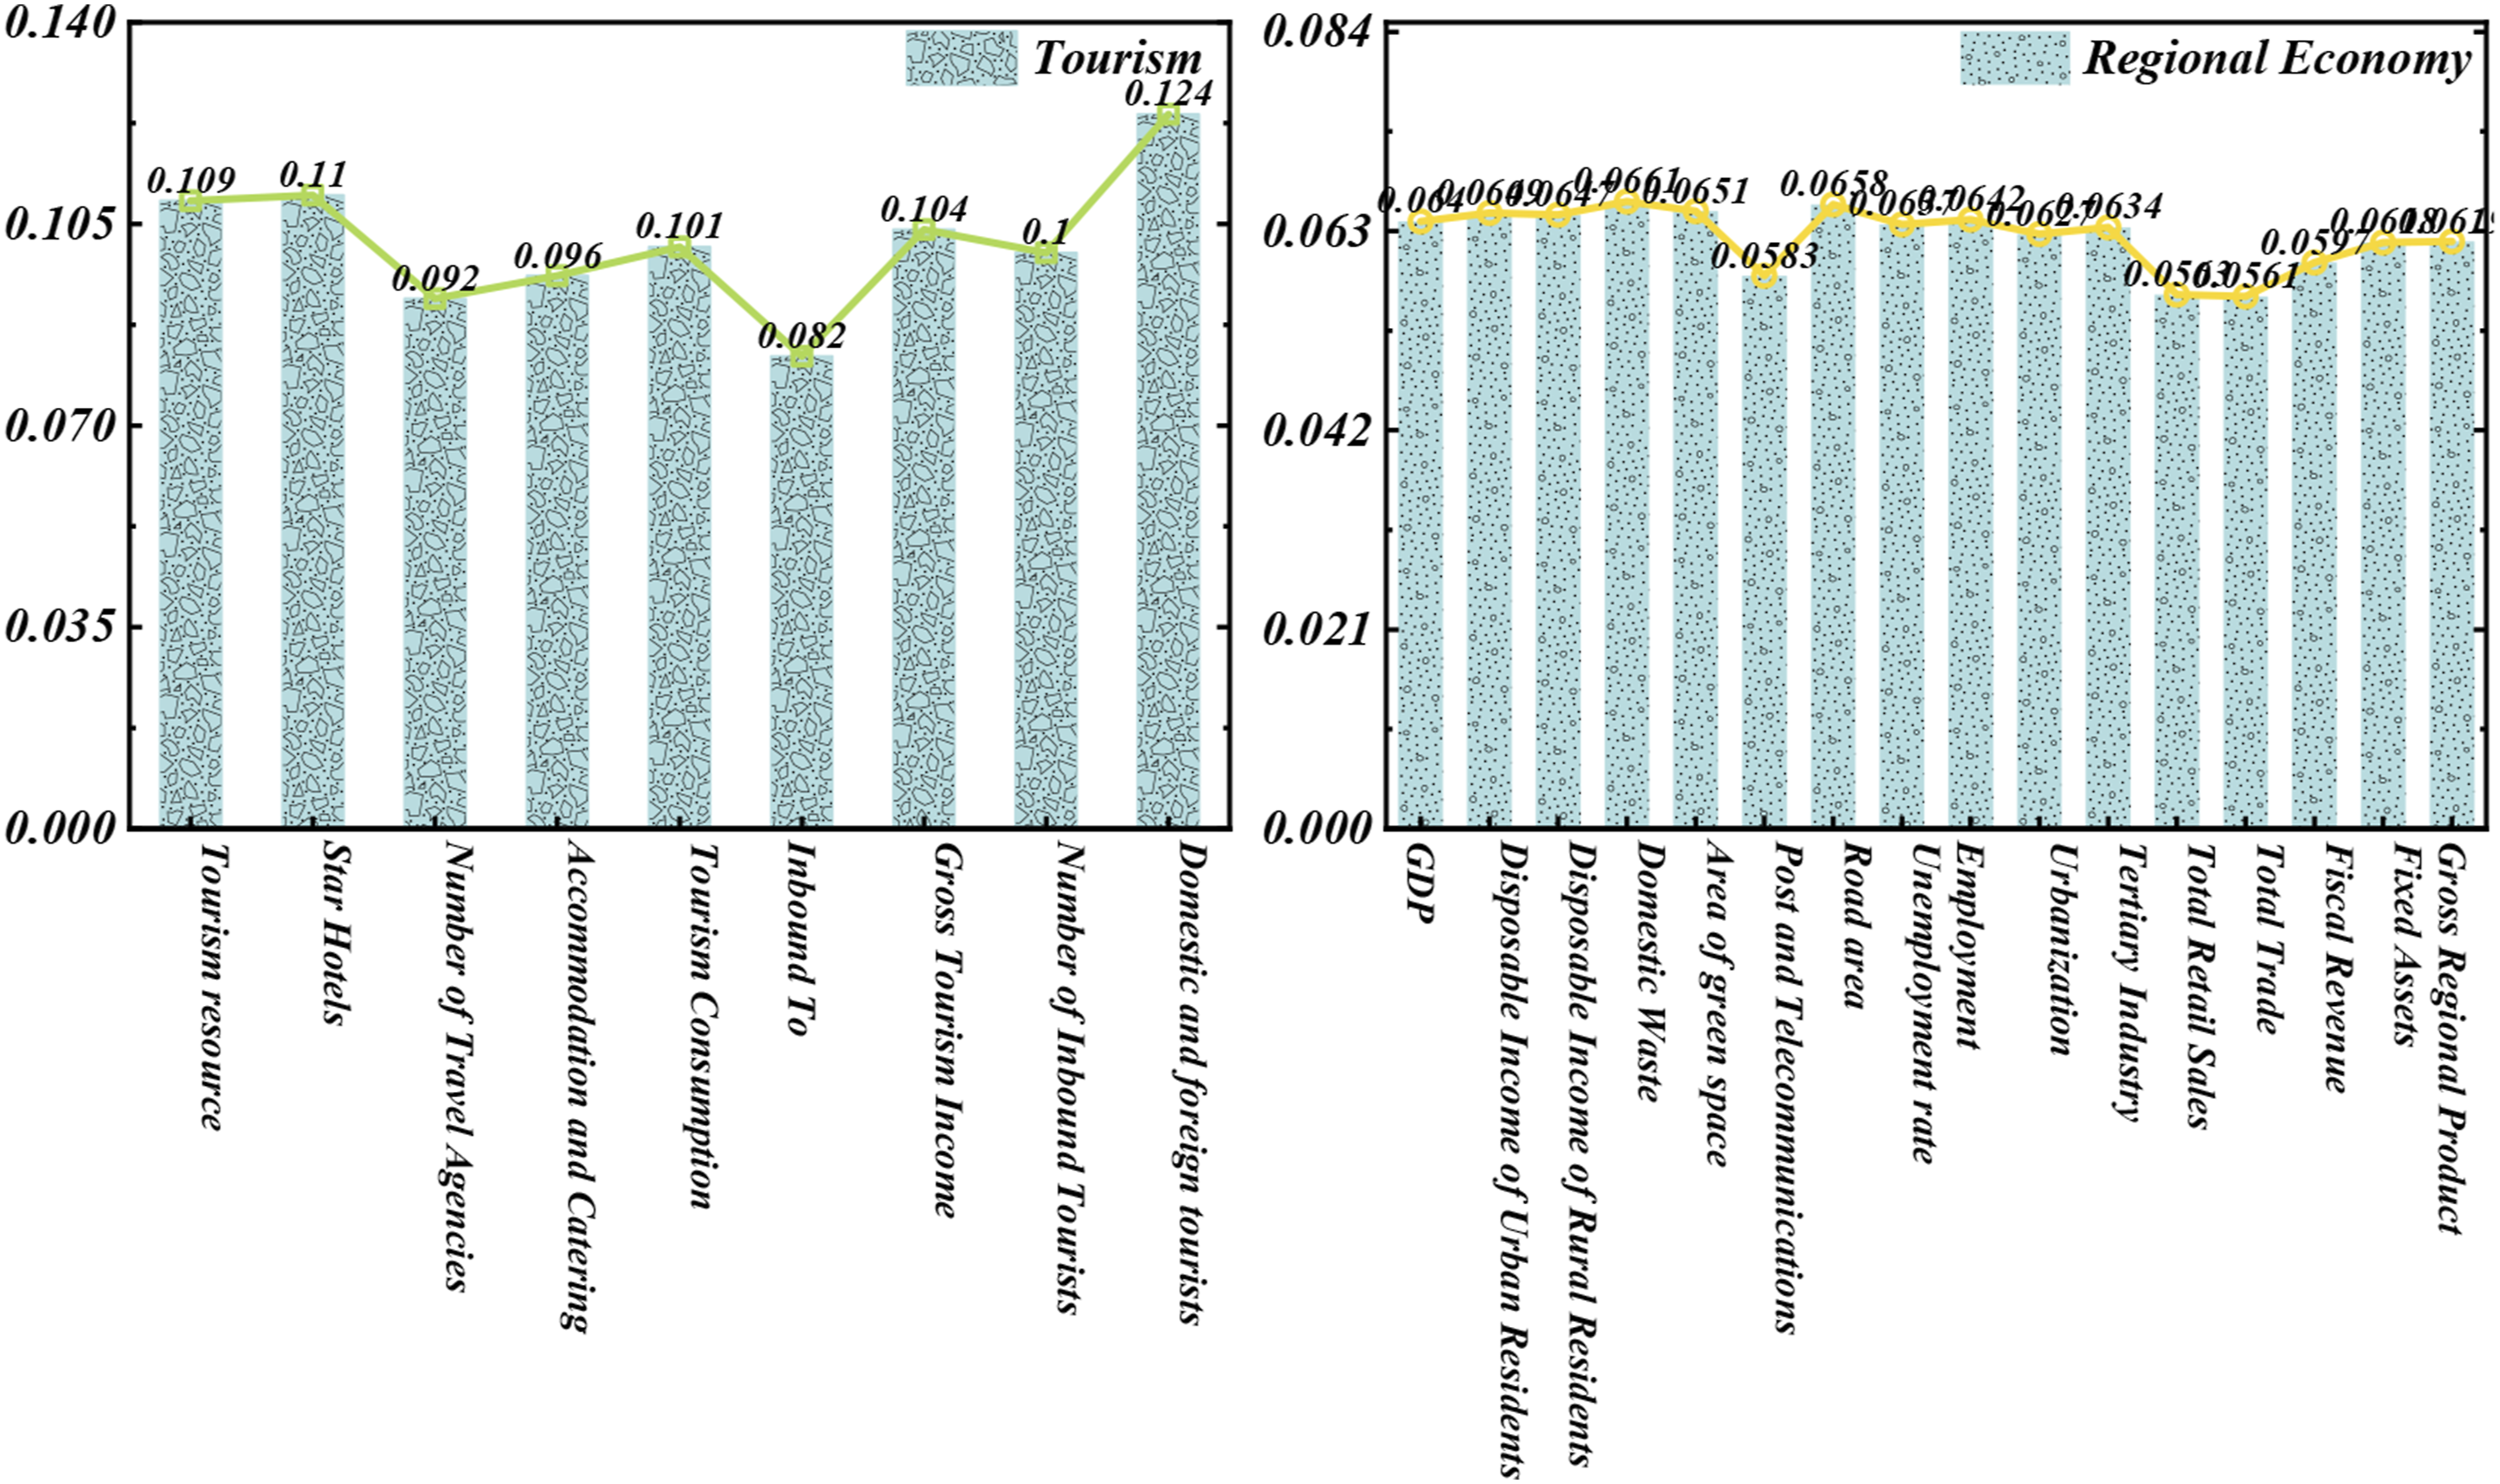
An analysis of the factors influencing the coupling coordination degree in Guizhou reveals that the following indicators have a significant impact on the coupling coordination degree of regional economic systems in Guizhou: urban household waste collection and treatment, per capita urban road area, per capita disposable income of urban residents, per capita disposable income of rural residents, and the proportion of the workforce in the tertiary industry. Each of these factors has an average weight greater than 0.064, highlighting the importance of economic quality in regional economic development, while indicators related to economic scale and structure have a relatively weaker impact. This suggests that, in the process of regional economic development in Guizhou, greater emphasis should be placed on the quality of economic development, specifically the internal construction. Among the regions with higher coupling coordination types, only Bijie and Qiannan Buyei and Miao Autonomous Prefecture are classified as regional economic development lagging types. Their urban and rural per capita disposable incomes rank third and seventh among Guizhou’s cities. These two regions, especially Qiannan Buyei and Miao Autonomous Prefecture, should focus on increasing both urban and rural residents’ incomes, narrowing income gaps, and enhancing employment, particularly in the tertiary sector. Guiyang and Zunyi, which rank first and second in per capita disposable income of urban and rural residents, belong to the tourism industry lagging coupling-coordination transition types, showing that their tourism industries are underdeveloped in relation to their regional economies.
“In addition to the direct economic contributions, intelligent MICE tourism synergistically promotes industrial restructuring and technological upgrading by enhancing regional connectivity, fostering cross-sectoral innovation, and accelerating digital service infrastructure deployment. These advantages contribute to the overall integration of tourism, technology, and public services, amplifying its multiplier effect.”
This study is subject to several limitations. First, the data period ends in 2019 and does not reflect the post-pandemic tourism landscape. Second, model accuracy may be influenced by regional data granularity. Third, the focus on Guizhou limits generalizability to other regions.
Optimization of countermeasures
Short-term Strategies:
Analysis of the tourism index for this city cluster shows that cities such as Guiyang and Zunyi have higher total tourism revenues, accounting for a large share of the regional total. In contrast, cities like Tongren and Anshun have lower tourism revenues, with a smaller share in the region. Domestic tourism income and the number of tourists are also significant factors influencing total tourism revenue. To strengthen the coordinated development of tourism and the economy in this area, it is essential to improve the quality of tourism products and further explore their potential.
A rational division of labor and strengthening the coordinated development of the industrial structure are critical. High coordination between tourism and economic development is only achievable when both industries are at high levels. Therefore, in addition to accelerating tourism development, efforts should also be made to promote regional economic growth. Based on the regional economic development index calculation, it is evident that the cities and areas surrounding Guiyang, which are experiencing the fastest economic growth, should assume more responsibility for driving the development of neighboring cities. For the entire Guizhou region to achieve economic development, it is crucial to adhere to sustainable development principles and strengthen the division of labor between regions.
Long-term Planning:
The development of the tourism industry and regional economy is uneven across the north-south and east-west areas of the study region, with significant disparities. Tourists are more inclined to visit cities like Guiyang and the Miao Autonomous Prefecture. While the surrounding regions also boast rich tourism resources, their development has been limited due to insufficient promotion of tourism products, a lack of distinctive tourism routes, and the failure to connect local tourism offerings with regional resources. To promote the tourism industry in these surrounding areas, it is essential to break regional boundaries, enhance inter-regional connectivity, and reduce the tourism gap between the eastern and western regions.
Practical implementations include AI-based exhibition navigation systems in Guiyang, online ticketing platforms, real-time visitor heatmaps, and intelligent payment infrastructure for local services. To enhance the sustainability of intelligent MICE tourism, we recommend increasing investment in tourism talent development through vocational education, AI training programs, and partnerships with local universities to cultivate digitally skilled tourism professionals.
Conclusion
This study focuses on the driving effects of intelligent convention tourism on regional economic development, combining time-series data analysis, Geographic Information System (GIS) spatial analysis, and input-output models to systematically explore the spatial evolution and economic impacts of tourism in Guizhou. The research findings are as follows:
Tourism development in Guizhou exhibits significant spatiotemporal evolution characteristics. Between 2009 and 2019, total tourism revenue and the number of tourists experienced steady growth, entering a rapid development phase after 2016. Spatially, the tourism economy is primarily concentrated in core cities like Guiyang and Zunyi, gradually spreading to surrounding counties and cities. The uneven development of tourism across different regions is evident, with some areas rich in tourism resources but still not fully realizing their industrial potential. This suggests that regional coordinated development still requires optimization.
Tourism’s role in the regional industrial structure has gradually strengthened, becoming a key driver of regional economic growth. Input-output analysis reveals that the backward linkages of Guizhou’s tourism industry continue to grow, with significant increases in demand for industries such as infrastructure construction, accommodation, and transportation, thereby forming a long industrial chain. The contribution of tourism to regional economic growth has surpassed that of some traditional industries. The industrial structure is progressively optimizing into a “secondary, tertiary, and primary” model, with the proportion of the tertiary sector continuously increasing.
The coupling and coordination between tourism and regional economic development has significantly improved. Geographic detector analysis shows that factors such as policy regulation, openness, and technological informatization play a critical role in the coordinated development of the tourism economy and regional economy. Additionally, factors like urbanization level, market size, and tourism resource endowment have significant positive driving effects on tourism development, indicating that tourism development must be strategically integrated with regional economic plans.
Based on these findings, the study proposes the following policy recommendations for optimizing Guizhou’s tourism industry structure: First, enhance infrastructure construction to improve the tourism industry’s service capacity, particularly in underdeveloped areas, to promote tourism resource development. Second, foster the integration of tourism and technology to elevate intelligent tourism services and enhance the visitor experience. Third, strengthen regional cooperation, break down administrative barriers, promote interregional tourism collaboration, and form an integrated regional tourism development model. Finally, optimize government policy guidance to increase market-driven efficiency and support high-quality development in the tourism sector.
In conclusion, this study demonstrates the multi-level impact of the tourism industry on regional economic development through data-driven analysis, providing quantitative empirical support. It also deepens the intersection of tourism and regional economic development using GIS technology. The findings offer valuable insights for tourism industry planning, regional economic coordination, and policy formulation. Future research should incorporate post-2020 data to analyze the impact of external shocks such as pandemics. Additionally, integrating big data analytics and mobile tourism behavior tracking may further refine the spatial-temporal modeling of tourism flows.