
Abstract
With the accelerating pace of population aging, elderly individuals living alone face heightened risks in home-based care, necessitating integrated solutions for real-time health monitoring and adaptive residential design. This study proposes a computational framework that combines intelligent health monitoring with interior spatial optimization, leveraging data mining and wireless sensor networks (WSNs) to enable data-driven personalization. The framework includes WSN-based data acquisition, SOM-optimized K-Means clustering for behavioral feature extraction (achieving a 19% reduction in Davies Bouldin Index to 0.38 and 89.6% clustering purity), and spatial-behavior fusion using trilateration-based indoor positioning (error <0.5 m) to guide layout decisions such as emergency device placement. A multi-feature fusion algorithm integrates motion and appliance usage data to support real-time behavior recognition with 92.1% accuracy. Experimental validation demonstrates a 37% reduction in false alarms and 91% alignment of adaptive design recommendations with user preferences. The WSN maintains sub-280 ms latency, ensuring timely alerts. This framework advances computational gerontechnology by offering a scalable and practical solution for integrating intelligent monitoring with aging-in-place living environments.
Keywords
Introduction
In recent years, the proportion of China’s aging population continues to grow, and the degree of social aging is increasing. According to the survey data of the National Bureau of Statistics, by 2022, China’s population over 65 years old will account for 14% of the total population. It is estimated that by 2025, the elderly population will exceed 210 million, accounting for about 15% of the total population. If the age of 60 and above is taken as the standard, the number will be more. It is estimated that in 2050, the elderly population will account for about 35% of the total population, about 500 million people. Under the influence of the one-child policy and the rapid growth of the aging population, the family size has been reduced, and the social dependency ratio has been gradually out of balance.1,2 Although society is trying to solve the pension problem, it is difficult to meet the rapid growth of the elderly population either in the construction of nursing homes or in the number of nursing staff. Moreover, it is difficult for a newly built family to support the elderly on both sides, and it is not only the simple survival and health needs for the development of the elderly themselves, which is considered as a complex service demand and a variety of life forms. Therefore, the designers of the smart home system should not only pay attention to the physical condition of the elderly but also analyze and obtain their life and behavior rules, so that the elderly can enjoy more convenient, personalized, and intelligent services.3,4
Intelligent home monitoring is the application of new information technology, relying on the Internet of things and big data of the emerging pension housing mode, where sensors are deployed in smart home appliances and elderly care equipment, which connect the elderly with the living environment. Sensor networks can sense the physical signs and behavior dynamics of the elderly in real-time, and assist the elderly to complete the action objectives and difficult behaviors.5,6 In the current research and practice, the sensor information collected by the application system is a single information system service, and there is no comprehensive, real-time, adaptive, and linkage service. Various types of intelligent devices and sensors as well as the system application data aggregation with whose obtained information is cleaned, fused, and stored. 7 The habit model of the elderly is constructed through data mining and analysis. The real-time activity data of elderly users are tracked and collected, and the behavior characteristics and behavior trends of users are perceived and predicted so that the elderly people can enjoy more intelligence and active service.8,9 From the scattered fragmented demand, through the big data analysis technology, data integration, inductive analysis, and storage are carried out to provide support for the elderly’s intelligent housing needs. The IoT technology integrates big data technology to provide fast, accurate, intelligent, and effective comprehensive services for the elderly. 10
The problem to be solved in this research is to design a smart house based on data mining and wireless sensor network technology according to the needs and cognitive characteristics of the elderly. To this end, first collect the historical data used by the elderly users of the equipment, data preprocessing, and then use the improved clustering algorithm to extract the characteristics of the data, correlation algorithm to study the correlation of the data; Then, the internal relations, rules and patterns of the data are analyzed to establish the behavior analysis and prediction model of the elderly’s daily life. Finally, by detecting the abnormal behavior of the elderly and calculating and matching the most appropriate control instructions according to the similarity of the elderly’s habitual behavior pattern.
Recent research status of an intelligent monitoring system
With the rapid development of communication, sensor, the Internet, and other fields, many related technologies have also been widely applied in the research and development of health monitoring. At present, there are many types of research on smart home systems, such as the UK’s “Intelligent Home Interactive House System,” 11 which detects the health status of the elderly by comparing it with daily life data, and calls for help from the outside when there is any abnormality; Finland’s “Active Family life” home care technology products, sensors are installed in each room, and the location information of the elderly is analyzed through the sensor data to monitor whether the activity information is abnormal 12 ; China’s intelligent community home care system, 13 uses the IoT ZigBee technology to realize intelligent monitoring of the elderly’s physical condition, home safety, environmental energy consumption, etc., which can transmit the monitoring data to the community monitoring center in real-time. Zhou et al. 14 developed a set of an intelligent health monitoring systems based on the Internet of things. The system wears a physiological collector on the user’s ear, and the real-time collected physiological data is uploaded to the mobile phone carried by the user. The mobile phone then uploads the data to the remote health data center through the mobile communication network. As personal health data, the data has different permissions for different users, where users can check their own physiological parameters at any time through the app, and their family members can also know their latest health status. The responsible doctor will give certain health guidance according to the physiological data of users. In special cases, when data is abnormal or unexpected, the system can timely inform the family members of users.
Conventional wearable sensors can collect real-time physiological and motion data of the human body, but there is a lack of single information. According to the research results, the indoor monitoring system scheme can be divided into two categories: Based on indoor positioning and based on behavior recognition, and each has its own advantages. Li et al. reviewed the existing digital technology of abnormal behavior detection from three aspects: action detection, feature extraction, and behavior understanding. 15 To detect abnormal human behaviors and protect privacy to the maximum extent, Khan and Sohn studied the two-dimensional contour, extracted the geometric invariant characteristics of the human body through r-transform, and finally generated five kinds of abnormal human behaviors for analysis, including weakness, forward or backward dumping, vomiting, chest pain and headache. 16 For the difficulty to distinguish the forward dumping and vomiting behaviors, Khan and Sohn performed kernel discriminant analysis (KDA) based on r-transform extraction contour and generated 4-state HMM model through a k-clustering algorithm to improve the recognition accuracy. 17 In essence, human behavior contains temporal characteristics, Roshtkhari and Levine made a comprehensive analysis of different frames in the video 18 and used clustering to model the Spatiotemporal relationship of the human body and detect abnormal behaviors. This method can improve the learning rate and achieve real-time detection without background subtraction and feature extraction. This method can improve the learning speed, avoid background subtraction, and feature extraction, and achieve real-time detection. In addition, they also constructed spatiotemporal video volumes (STVs) 19 and analyzed the feature extraction feature histogram (HOG) in time and space to identify abnormal behavior. Guan used deep learning technology to analyze and study the interactive abnormal behavior in surveillance video. 20 In the video data preprocessing, the recognition rate of the background subtraction algorithm reaches 73%. Sun et al. proposed a recognition method for single-person behavior and multi-person interaction based on spatiotemporal key points. 21 Firstly, the Gaussian mixture algorithm was introduced to cluster the key point samples of each video frame to generate a word book containing spatiotemporal information. Then, the Gaussian mixture model was obtained by training spatiotemporal words. Finally, the model was used for training to recognize human behavior. According to the technical means of video, the user’s current behavior can be accurately captured. However, due to the influence of the blind area and partial occlusion of the human body, it is difficult to meet the practical application requirements.
The existing intelligent home monitoring system has not been able to integrate indoor positioning and elderly behavior recognition with multi-features, and has not realized comprehensive indoor health monitoring. To this end, this paper combines data mining with wireless sensor network technology, uses SOM based improved K-Means clustering algorithm to extract data features for indoor positioning design, and studies the behavior pattern of the elderly through association algorithm.
Design of intelligent home health monitoring system
Overall structure
Through the research of wireless sensor networks, big data analysis, and other technologies, we can build a space that can provide intelligent and healthy living for the elderly. The system uses an embedded processor and sensor to collect equipment and environment-related parameters. Through socket connection with the system platform, the control information is sent to the system platform, including the front-end interface and background management, which provides the front-end user interface, health control, and other functions. The back end mainly realizes the functions of request and data processing, behavior pattern matching, and health state prediction, and the front and back end communicate through HTTP protocol. The overall architecture of the system is shown in Figure 1. Overall system architecture.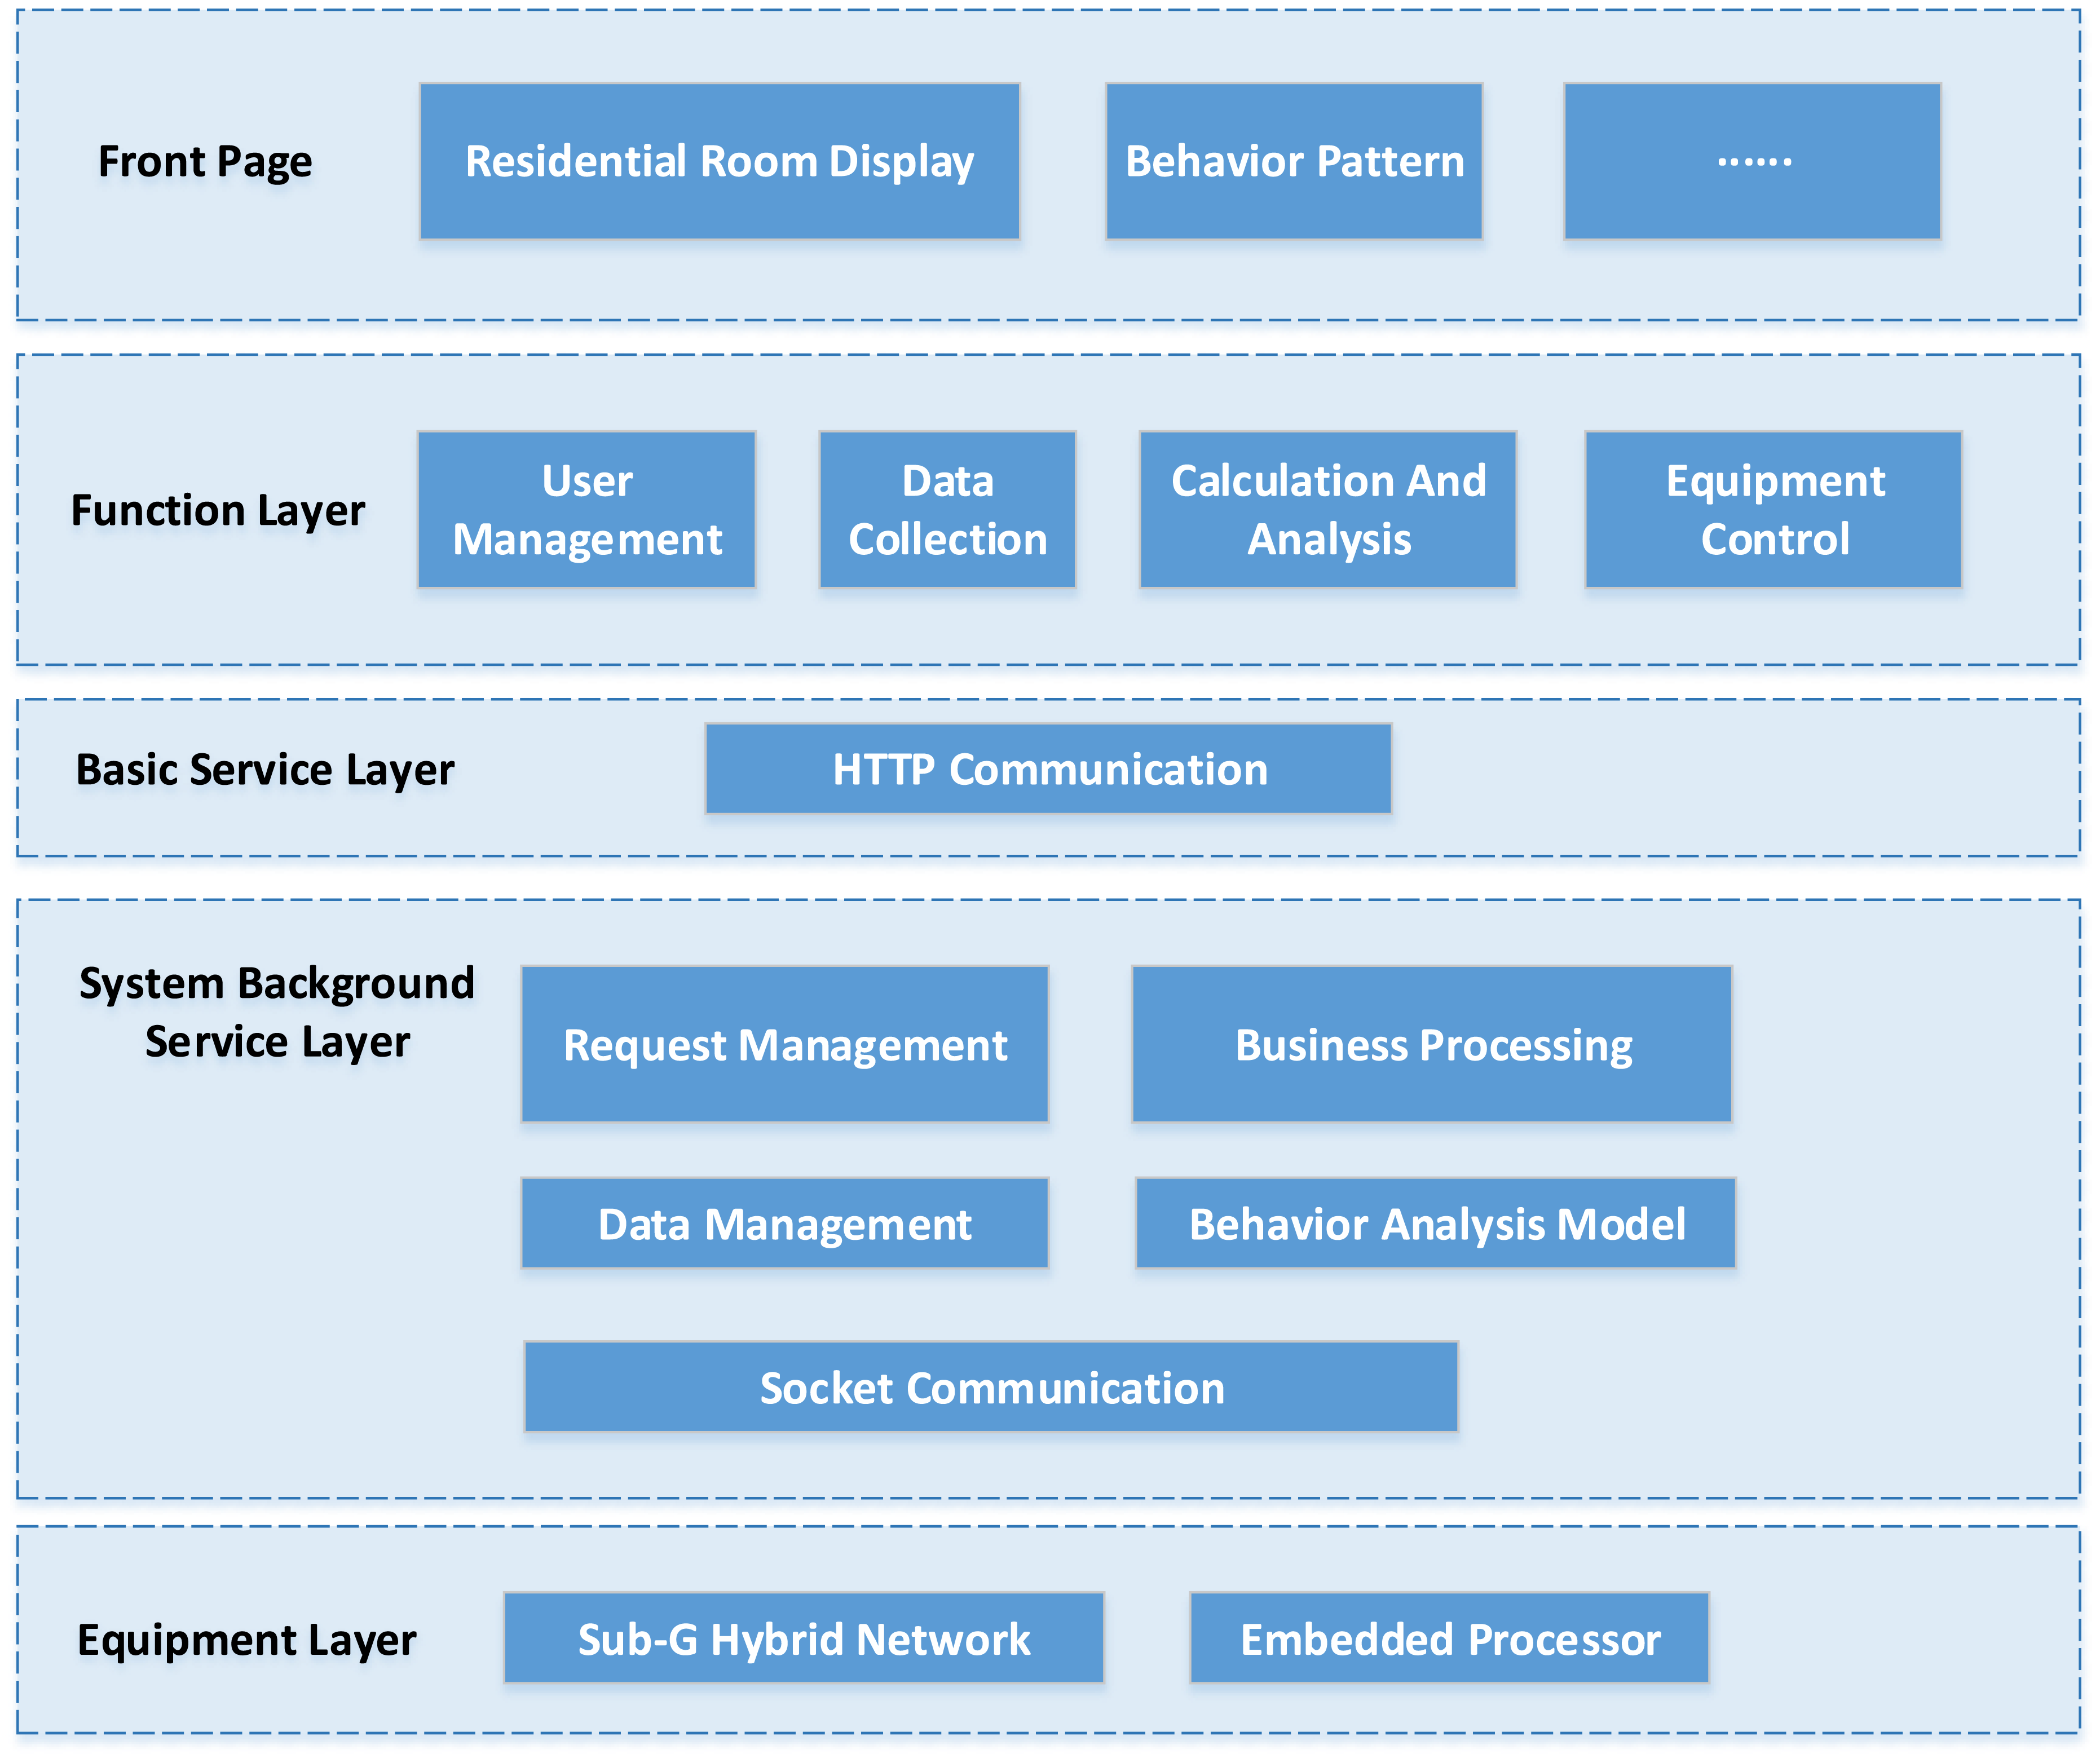
Functional design
Data acquisition and transmission
Data acquisition needs are divided into two parts: behavior data and health parameter data. Behavior data is the collection of environmental variables such as temperature, humidity, illumination, and the state and control properties of household appliances and lamps. The collected data need to be used for the subsequent behavior prediction and the establishment of the old people’s habit model, so the collected data should be preprocessed to eliminate isolated and sensitive data points; in the transmission process, the data collected synchronously can be stored in the server platform database without a loss for subsequent analysis and prediction.
The collection of health data contains four basic parameters of the elderly: blood glucose, blood pressure, pulse, and blood oxygen. Through the two-way binding of front-end data, the function of data collection, upload, rendering and display, and automatic push parameter abnormal information is completed.
To ensure the reliability of physiological signal monitoring, the system integrates certified medical-grade wearable devices for blood glucose, blood pressure, pulse, and blood oxygen monitoring. Specifically, pulse and SpO2 are measured via the MAX30102 optical sensor module (sampling rate: 25 Hz), blood pressure is captured through cuffless PTT-based estimation via a wearable armband (sampling interval: 1/min), and blood glucose is monitored using a Bluetooth-enabled glucometer synced daily. All devices undergo weekly calibration against benchmark hospital equipment. Data synchronization with behavioral data (e.g., motion or appliance use) is achieved through timestamp alignment on the central server, with latency kept under 100 ms to ensure real-time relevance.
Server data platform
The system adopts a multi-level alert mechanism to inform children or caregivers based on the severity of detected anomalies. Alerts are classified into three tiers: (1) Informational—non-critical pattern deviations; (2) warning—behavioral anomalies requiring attention (e.g., irregular sleep patterns); (3) emergency—fall detection or physiological alerts breaching critical thresholds. Alerts are delivered through SMS, mobile app push notifications, and automated voice calls. Each notification includes an acknowledgment request and delivery status is logged. To reduce false positives, a dynamic suppression algorithm evaluates signal stability, recent behavior trends, and confidence thresholds before escalating alerts.
User and data management
User management module: user types can be roughly divided into the elderly using the device, the elderly children, and the system administrator. In addition, the basic information of the user, and the saving of the user login status are also included.
Authority management module: assign different roles to different logins, and only view the page information under the corresponding roles.
Database management module: it is responsible for storing, checking, and updating all kinds of user information. The daily life data and health data of users are collected from a variety of sensors deployed, and the corresponding processing is carried out respectively. The intelligent monitoring system is designed and developed from the aspects of intelligent control and health management.
Given the sensitivity of data such as video feeds, skeletal pose estimations, and electricity usage logs, stringent data privacy and security protocols are enforced. All video and pose data are processed on-device using edge AI modules to avoid raw transmission. Personally identifiable information (PII) is stripped through anonymization, and all data are encrypted in both storage (AES-256) and transmission (TLS 1.3). Access to the data platform is role-based (RBAC) and requires multifactor authentication. Retention policies limit raw data storage to 30 days unless manually extended for research purposes.
Interior positioning design
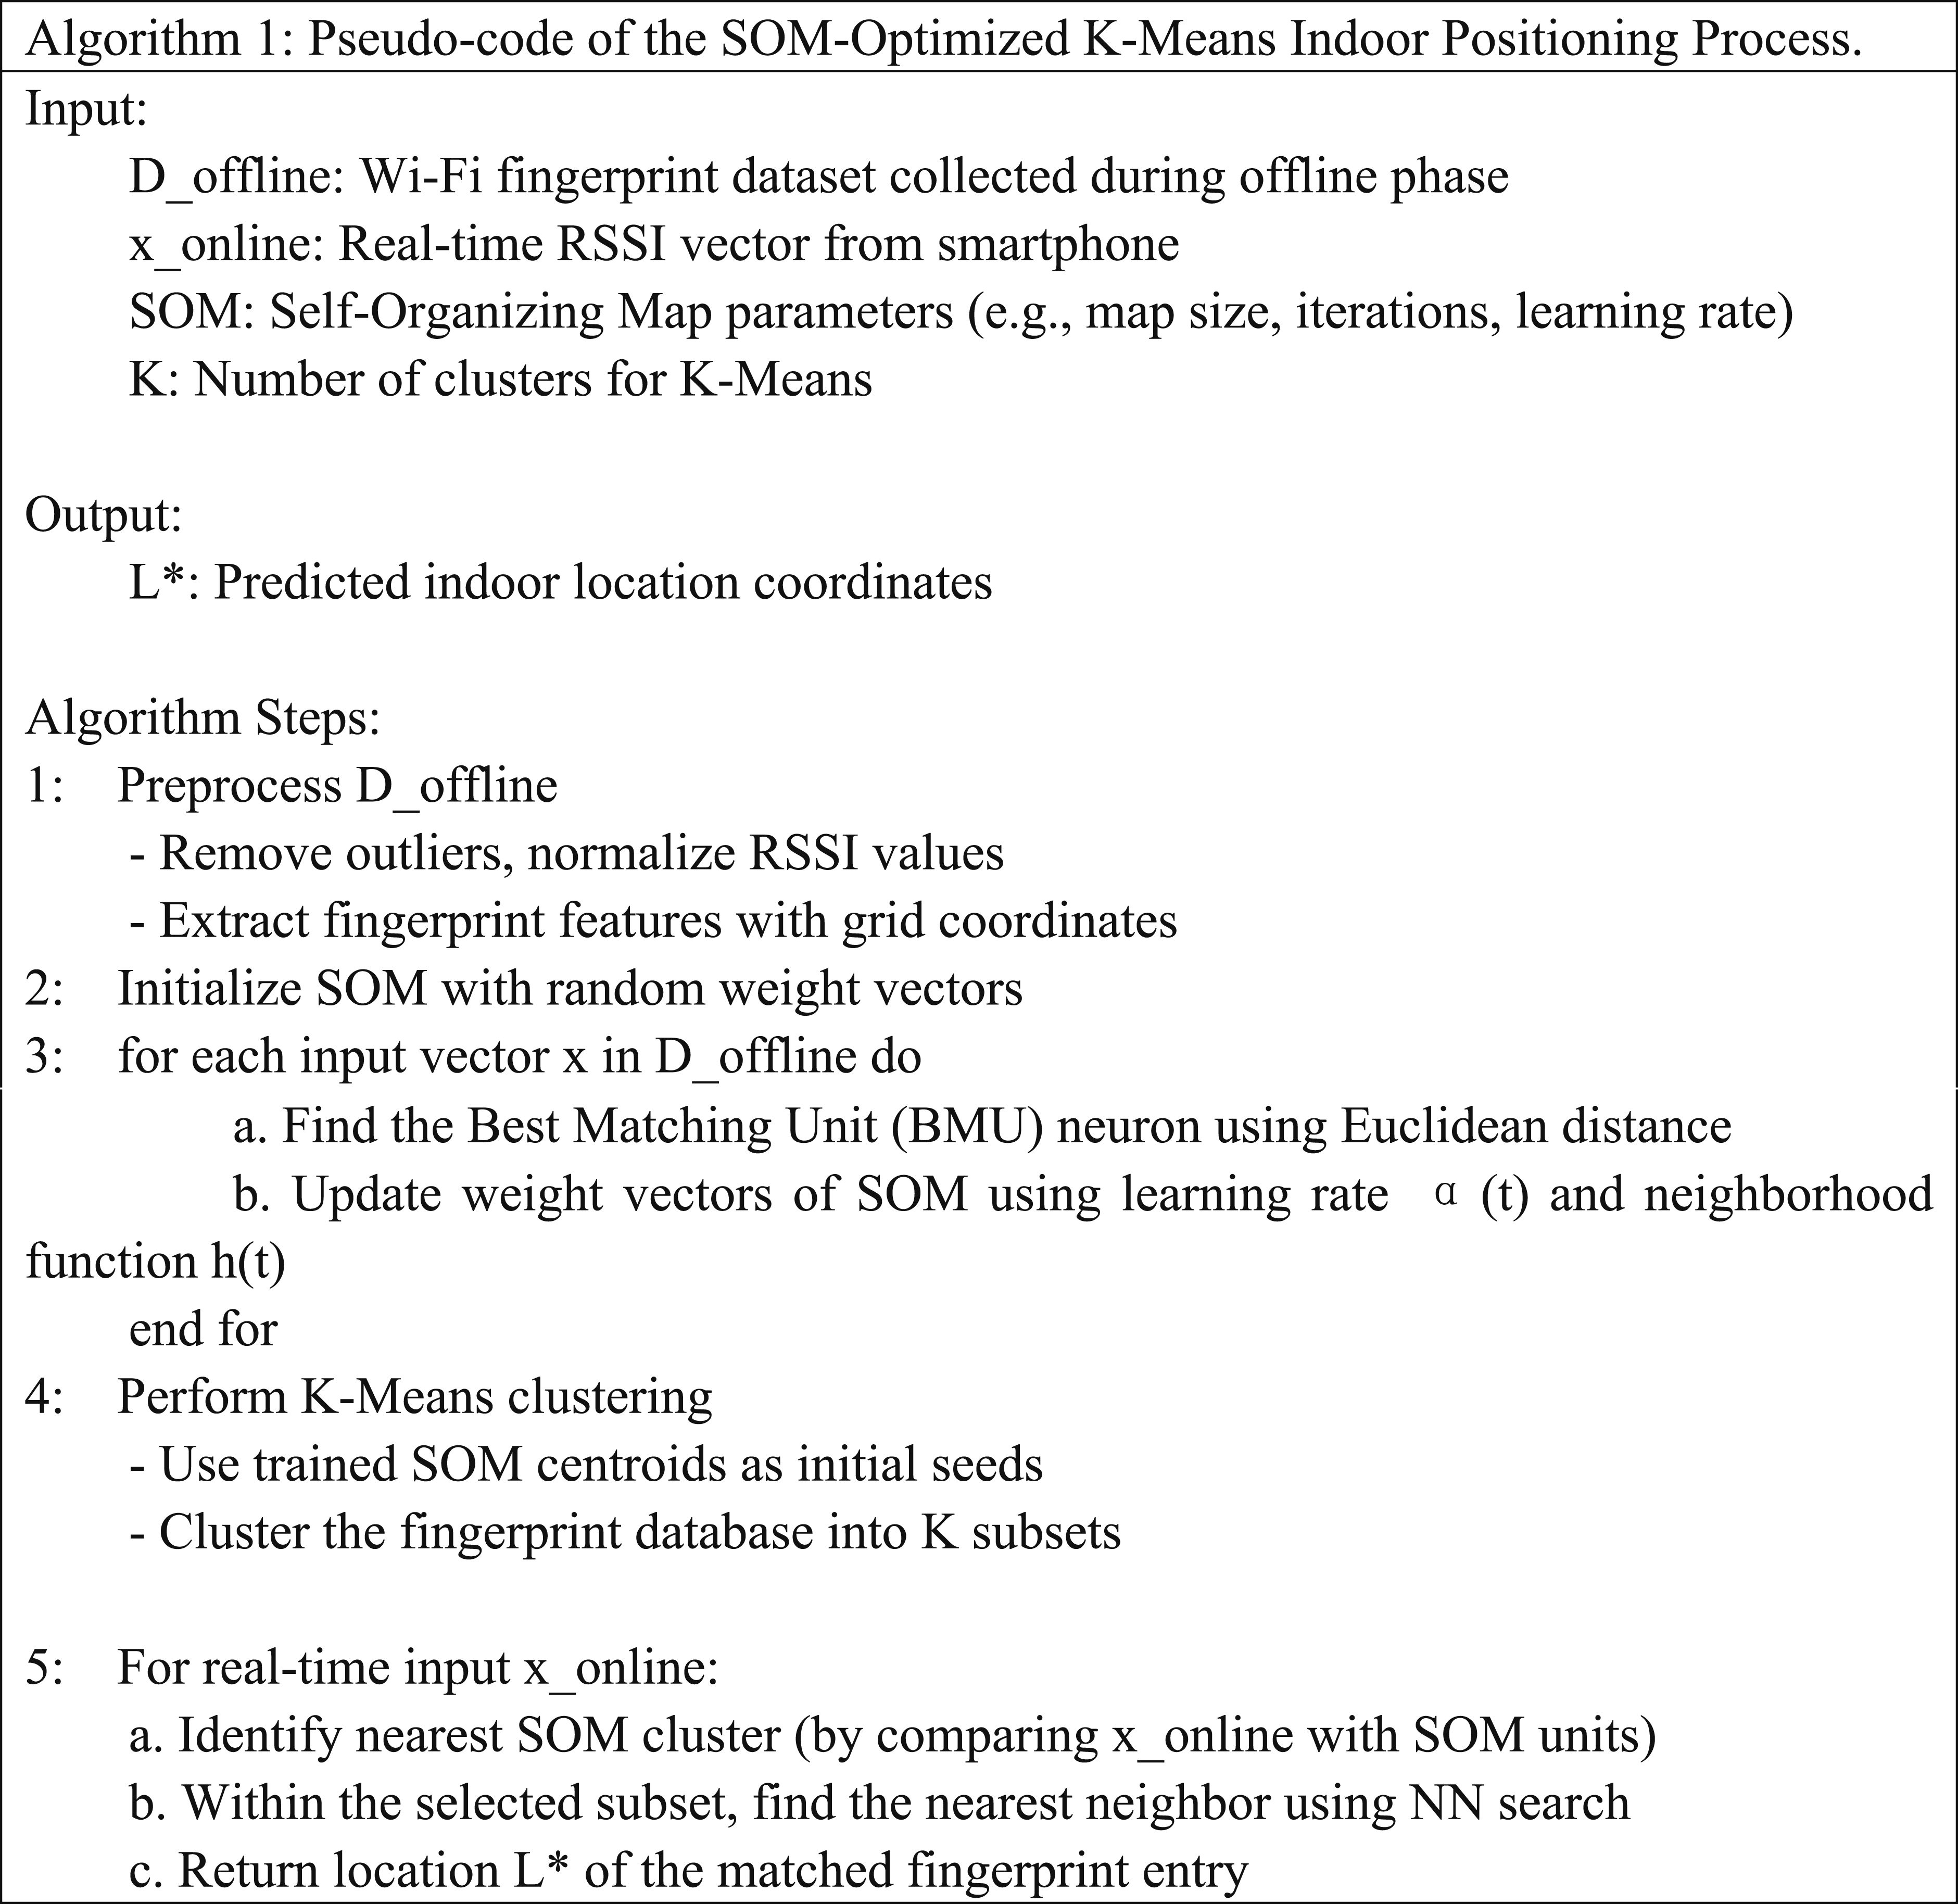
The smartphone is selected as the terminal to complete the collection and upload of Wi-Fi data. In the offline phase, outlier data is first deleted, and then the effective features of Wi-Fi data are extracted, finally, the Wi-Fi fingerprint feature database is constructed by combining the location information. In the online stage, according to the real-time Wi-Fi data uploaded by smartphones, the fingerprint matching algorithm is used to match the Wi-Fi location fingerprint feature library, and the location coordinates are calculated.
The amount of data collected by Wi-Fi offline is relatively large, and there is still a problem of too much data through the conventional nearest neighbor search (such as KD tree), and there is no good solution for mismatching the nearest neighbor sampling points far away from the sampling location. In view of the shortcomings of the above Wi-Fi location fingerprint matching algorithm, this paper proposes an improved k-means algorithm based on SOM, as shown in Figure 2. Interior positioning algorithm flow.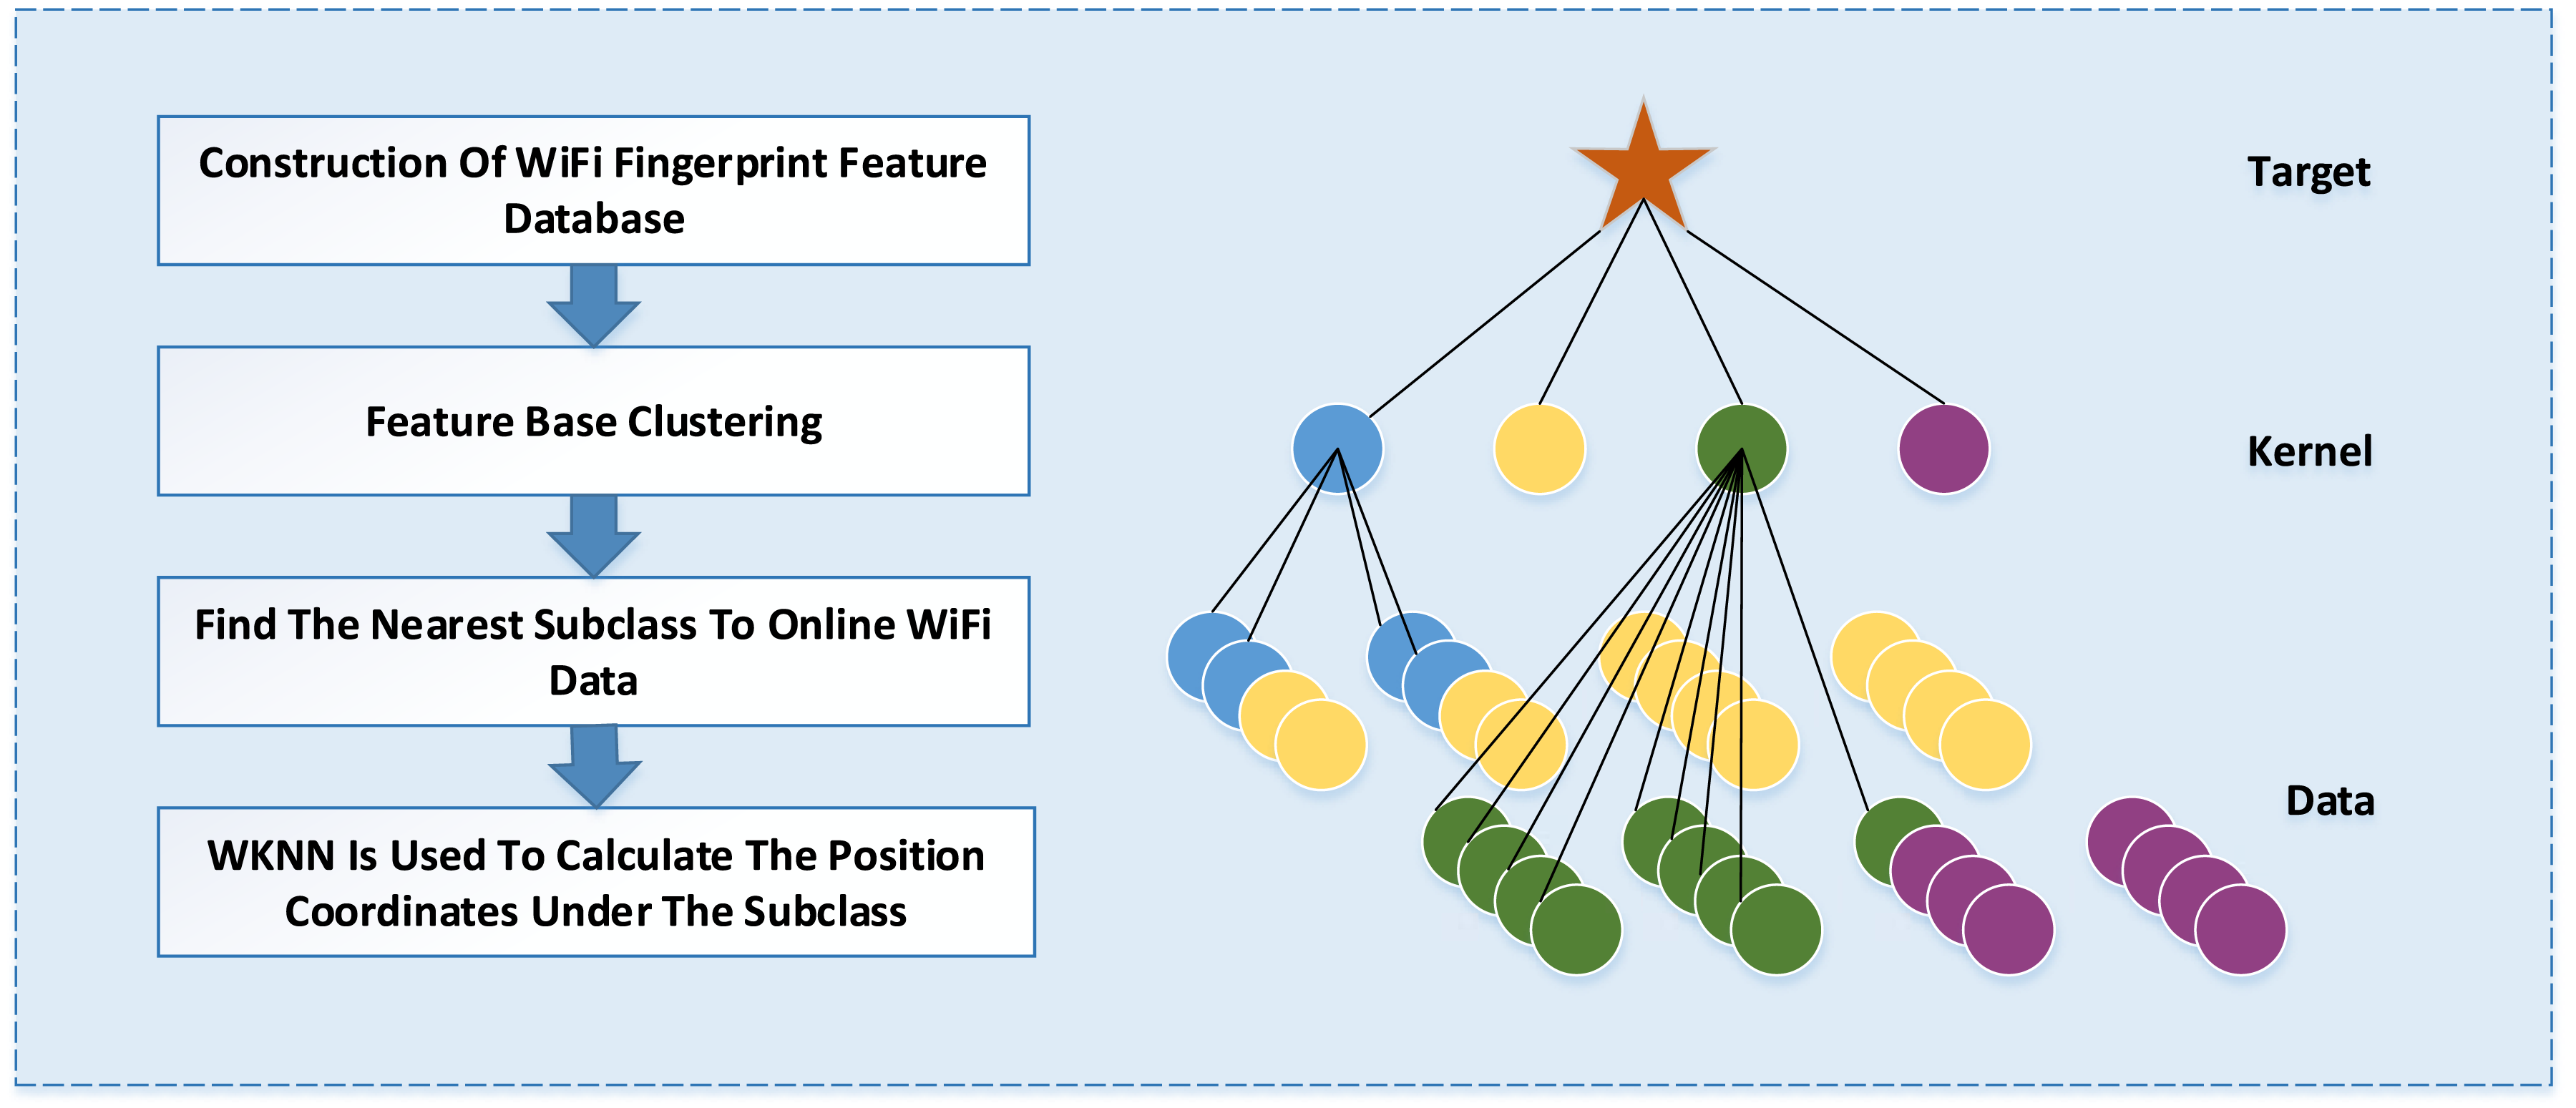
The algorithm uses a hierarchical data query mechanism to solve the problem of a large amount of data and mismatching of nearest neighbor sampling points. Firstly, the original data is preprocessed to construct the Wi-Fi location fingerprint feature database, and then the feature database is clustered according to the nearest neighbor algorithm to obtain different subsets of the fingerprint feature library and corresponding subset feature points, which are expressed as SOM. Through the nearest neighbor query between online Wi-Fi data and SOM of all subsets, the nearest SOM to Wi-Fi data is found. Finally, the K-Means algorithm is used to calculate the location coordinates in the subset containing the SOM.
In the offline phase, the Wi-Fi fingerprint data of each grid sample point is obtained, and then the probability distribution model of corresponding positions is calculated respectively; According to the real-time collected RSSI vector, the posterior probability of the target position is calculated by the Bayesian formula, and the coordinates of the sampling point with the maximum posterior probability are taken as the positioning result. The principle of the algorithm is as follows: If the initial prior probability distribution of the target follows the uniform distribution


This paper classifies the behavior activities of the elderly. The completion of this activity includes the use of each device, which has a data point, and each data point contains the influencing factors of the use of each device as its characteristic attribute, which is the basis of monitoring the behavior of the elderly, and the basis of simplifying an intelligent operation for the elderly. Combined with the advantages of SOM, the data can be input into SOM network for initial clustering, and then these results can be used as the initial clustering center of K-means algorithm to obtain the final clustering results.
For each neuron, the reference weight vector
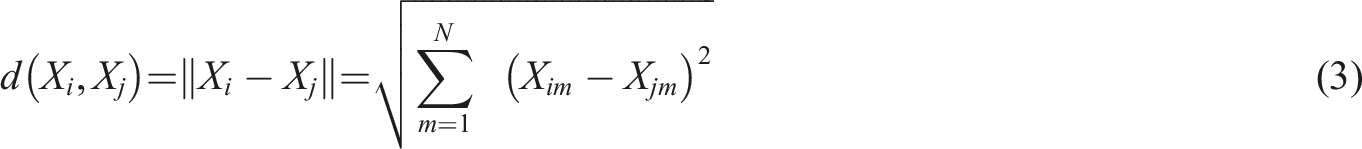
The Euclidean distance between the input sample and the reference weight vectors corresponding to all neurons is the Euclidean distance of two m-dimensional category vectors
The distance between the winner’s weight vector in

By expanding Formula (4), Formula (5) can be obtained:


The width

The SOM network is configured with a 10 × 10 hexagonal grid topology (100 neurons), trained over 1000 iterations with an initial learning rate of 0.5, decaying exponentially to 0.01. The neighborhood radius decays from 5 to 1 over time. The number of clusters K in K-Means is determined via the silhouette method, yielding optimal K = 6K = 6K = 6 for our dataset. Clustering performance was evaluated over 10 independent runs with different random seeds.
Behavior recognition of the elderly
In our system, binocular cameras (baseline = 20 cm) are deployed for synchronized image acquisition. MobileNet is used for real-time 2D keypoint detection (17 keypoints per frame, OpenPose format), followed by 3D reconstruction via stereo triangulation using calibrated intrinsic and extrinsic parameters. The average reprojection error during camera calibration was 1.6 pixels. Keypoint pairs with detection confidence below 0.5 are discarded. The full pose estimation pipeline operates at 15 FPS on NVIDIA Jetson Nano, with an average end-to-end latency of 87 ms per frame.
Firstly, based on CMU pose model, the optimization is carried out by mobilenet, and the training work is completed through coco data set, and the key points of human body skeleton under left and right cameras are obtained respectively. Then, a complete three-dimensional human skeleton is constructed through binocular camera calibration parameters. Finally, according to the angle characteristics of the three-dimensional human skeleton model, the random forest algorithm is used to complete the behavior recognition.
Human behavior recognition based on 3D human skeleton is more robust than 2D feature in multi view recognition and partial occlusion. To recognize human behavior in 3D space, binocular vision is used to construct 3D human skeleton. The overall algorithm flow is shown in Figure 3. Flow of behavior recognition algorithm.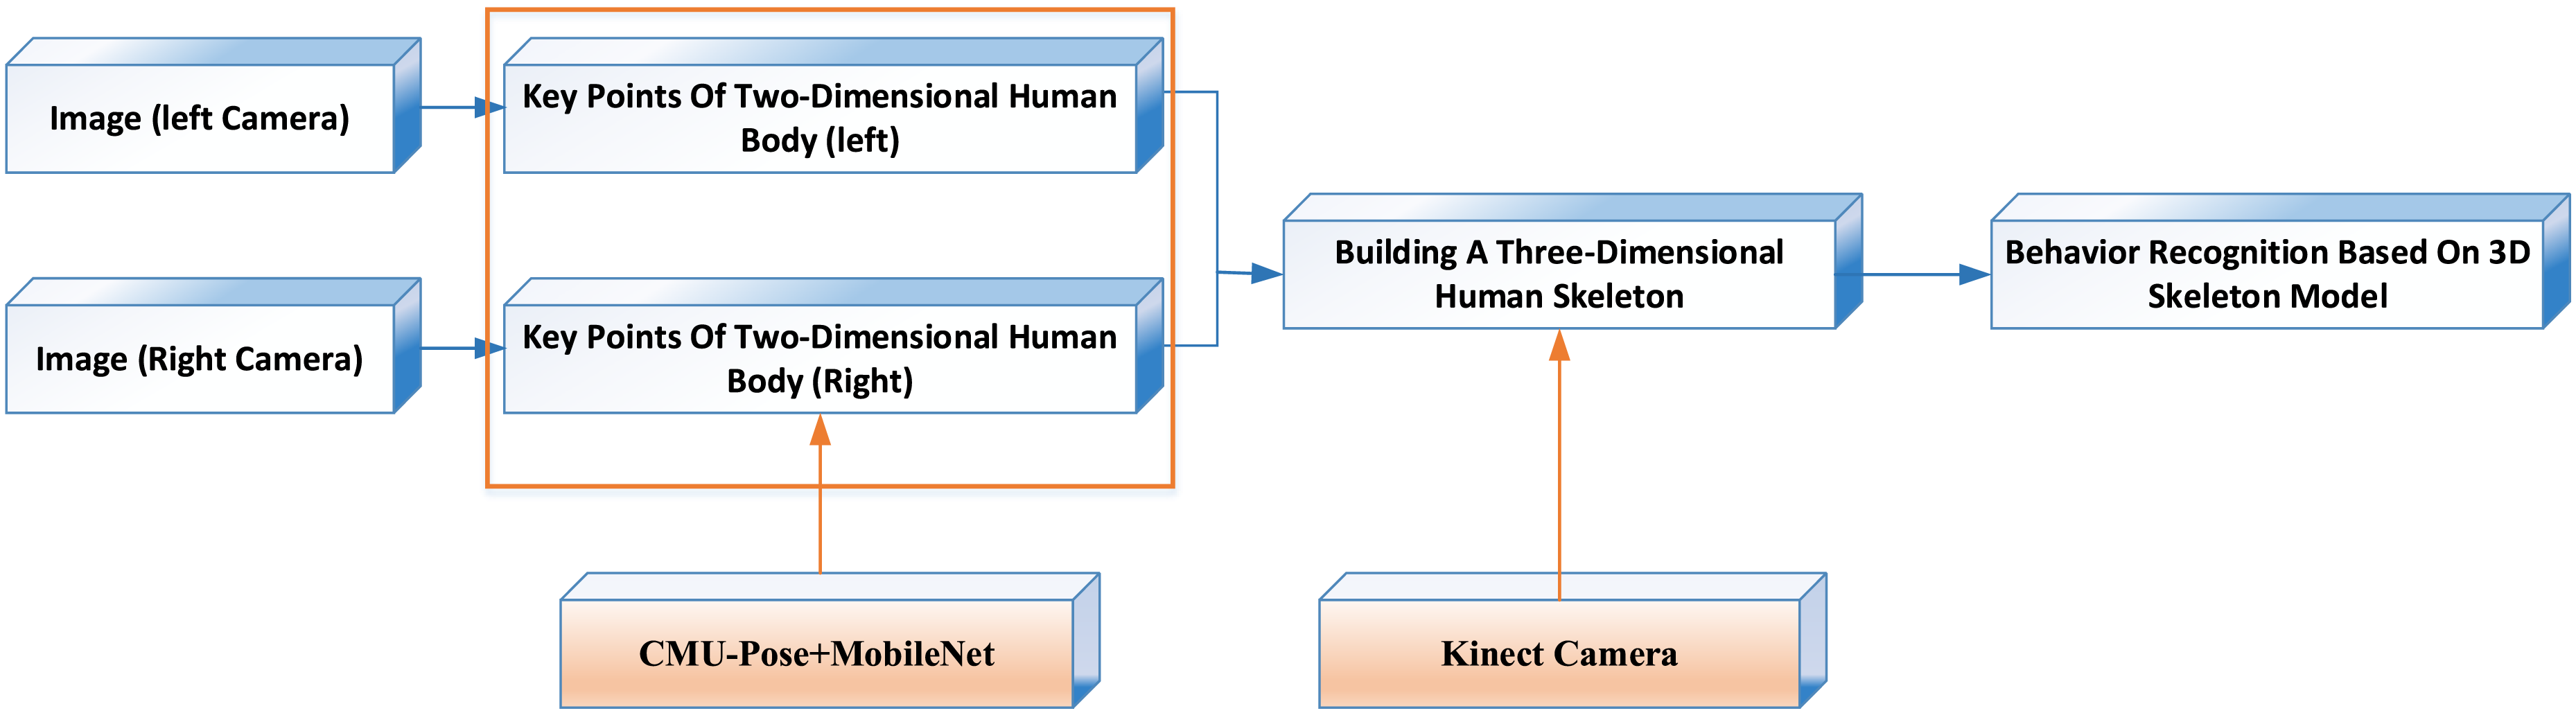
The 3D skeleton-based feature vector consists of 28 angles derived from 14 major joint pairs (e.g., neck–shoulder, hip–knee, knee–ankle), captured over a sliding window of 2 s (30 frames). The feature dimensionality is 28 × T, where T is the window length in frames. A Random Forest classifier is trained using 100 trees with a maximum depth of 15 and feature subsampling ratio of 0.6. To address the class imbalance in fall versus non-fall events, we apply Synthetic Minority Oversampling Technique during training and use class-weighted loss in the classifier. Based on CMU pose network model, the lightweight mobile net is used to optimize the speed of human body two-dimensional key point detection, replacing the feature extraction layer of the first ten layers of vgg-19 and the following two branch network optimization. Compared with the original model, the model scale is greatly reduced, and the detection speed is greatly improved. Then, according to the structural characteristics of binocular vision, the 3D point coordinates can be obtained by using the parameters of double targets and the corresponding 2D human body key point coordinates, and the 3D human skeleton model is constructed.
There are two kinds of fall state data based on 3D skeleton, such as velocity threshold and spatial angle. The acceleration threshold method uses the velocity of the center of mass in the process of human motion as the discrimination basis and sets the speed threshold of falling according to the measured data. The spatial angle method takes the relative position of the centroid, head, left and right shoulder, left, and right hip joint points as the basis for judging the falling behavior. This scheme requires high real-time performance. Generally, the framework of the 3D skeleton is realized by the Kinect depth camera, and it is difficult to establish an appropriate fall threshold due to individual differences of users in the actual application process.
Finally, the angle on the 3D human skeleton model is taken as the behavior feature, and the expression of the behavior action is formed by the angle vector. Finally, the behavior recognition based on the 3D human skeleton model is completed through the random forest classification algorithm.
Experiment and analysis
Interior positioning effect analysis
Due to the relatively complex indoor environment, there is a big difference between the actual Wi-Fi signal attenuation curve and the attenuation model, as shown in Figure 4. Wi-Fi Positioning effect.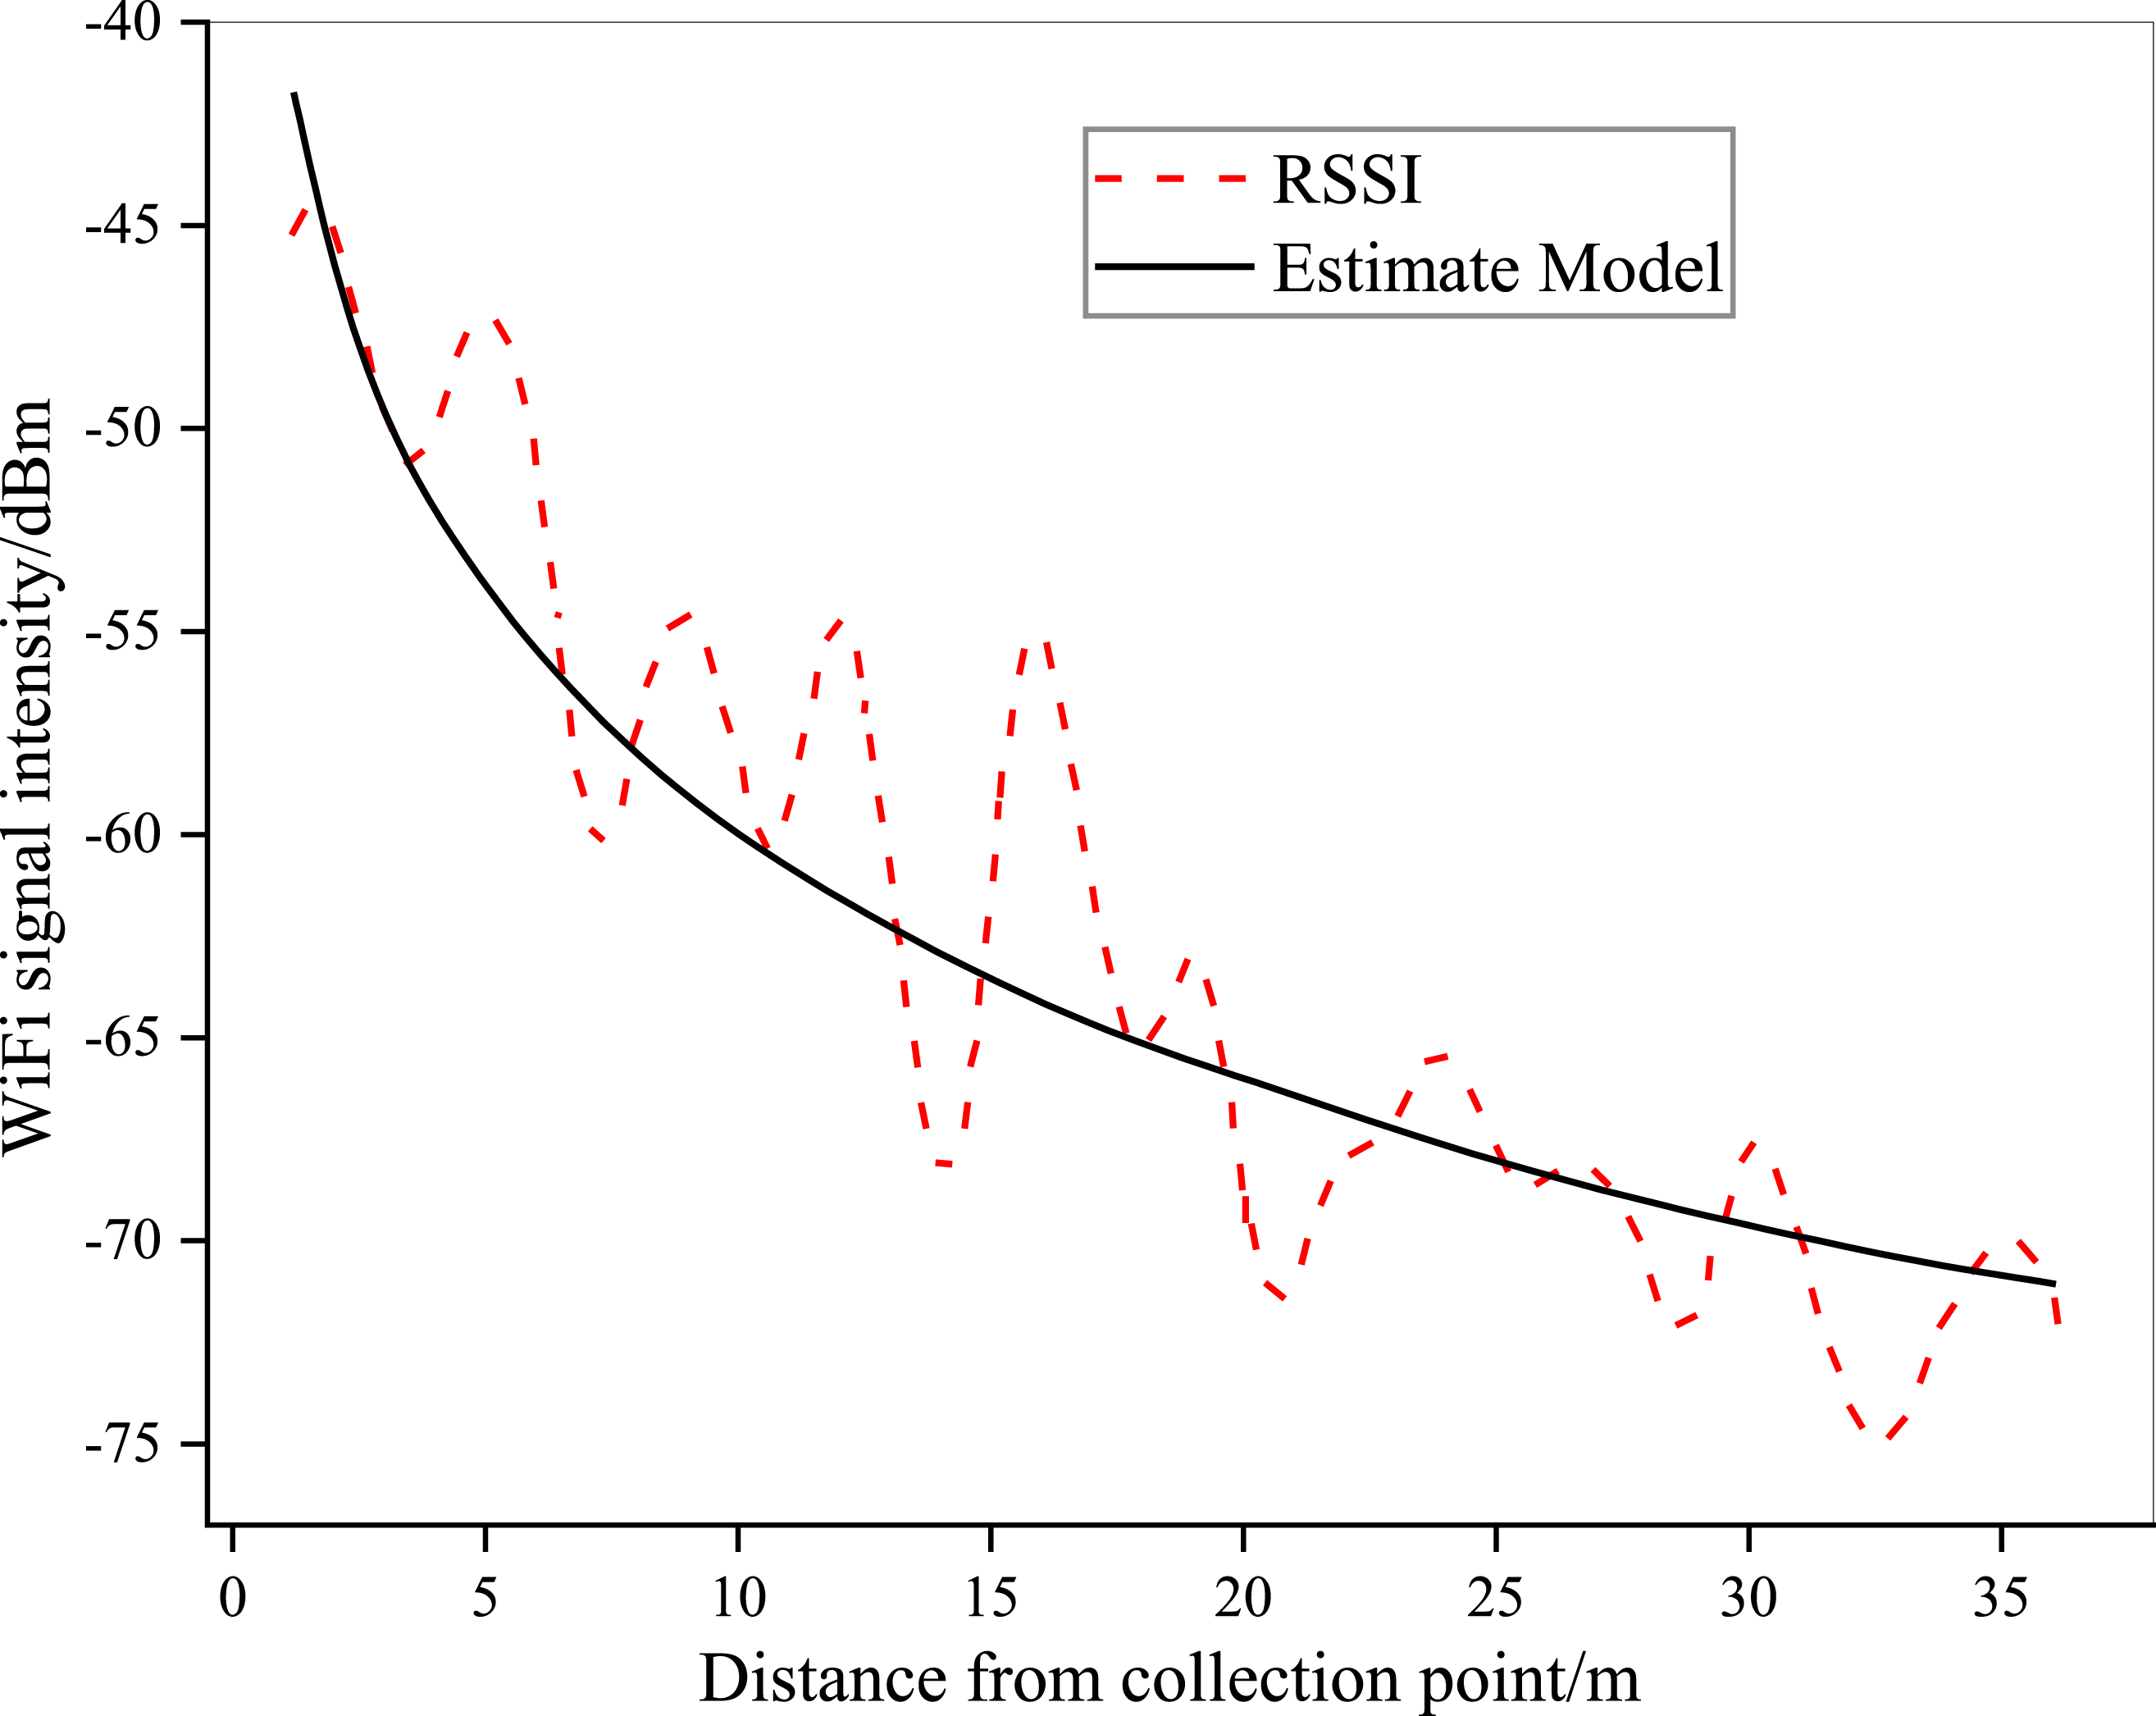
In addition, even in the same place, the Wi-Fi signal strength also fluctuates to a certain extent with the passage of time. The main factors affecting Wi-Fi indoor positioning accuracy are as follows: obstacles are the most important factors affecting Wi-Fi indoor transmission; various obstacles, such as walls, furniture decoration, human body, etc., can reflect, scatter, block and weaken Wi-Fi signals. In addition, the influence characteristics of various obstacles on Wi-Fi signal are not the same, some have strong signal absorption characteristics, some have strong reflection, human body disturbance to Wi-Fi signal is particularly obvious, these are factors that cannot be ignored to affect the positioning accuracy.
Generally, after the electromagnetic wave is emitted from the transmitter, it propagates outward in an isotropic manner. In the process of propagation, the initial transmitted signals reach the receiver in different propagation paths because of reflection, scattering and diffraction, etc., and these signals are independent from each other, so they are called multipath components. The strength of the signal received by the receiver is usually the result of the vector superposition of the initial signal through different paths to the receiver. Multipath propagation makes the received signal strength related to the phase of electromagnetic wave, so there are often amplitude fluctuations of a certain level in the process of Wi-Fi detection.
Analysis of behavior patterns of the elderly
UCI household electricity data are selected, including date, time, kitchen power, laundry power, water heater and air conditioning power and other attributes. Davies Bouldin Index (DB) is used to evaluate the effect of clustering algorithm, which represents the average distance between each data point and its class endoplasmic center. The calculation formula is shown in equation (8).

The clustering effect comparison of SOM-K-Means algorithm and other algorithms is shown in Figure 5. Comparison of clustering effect.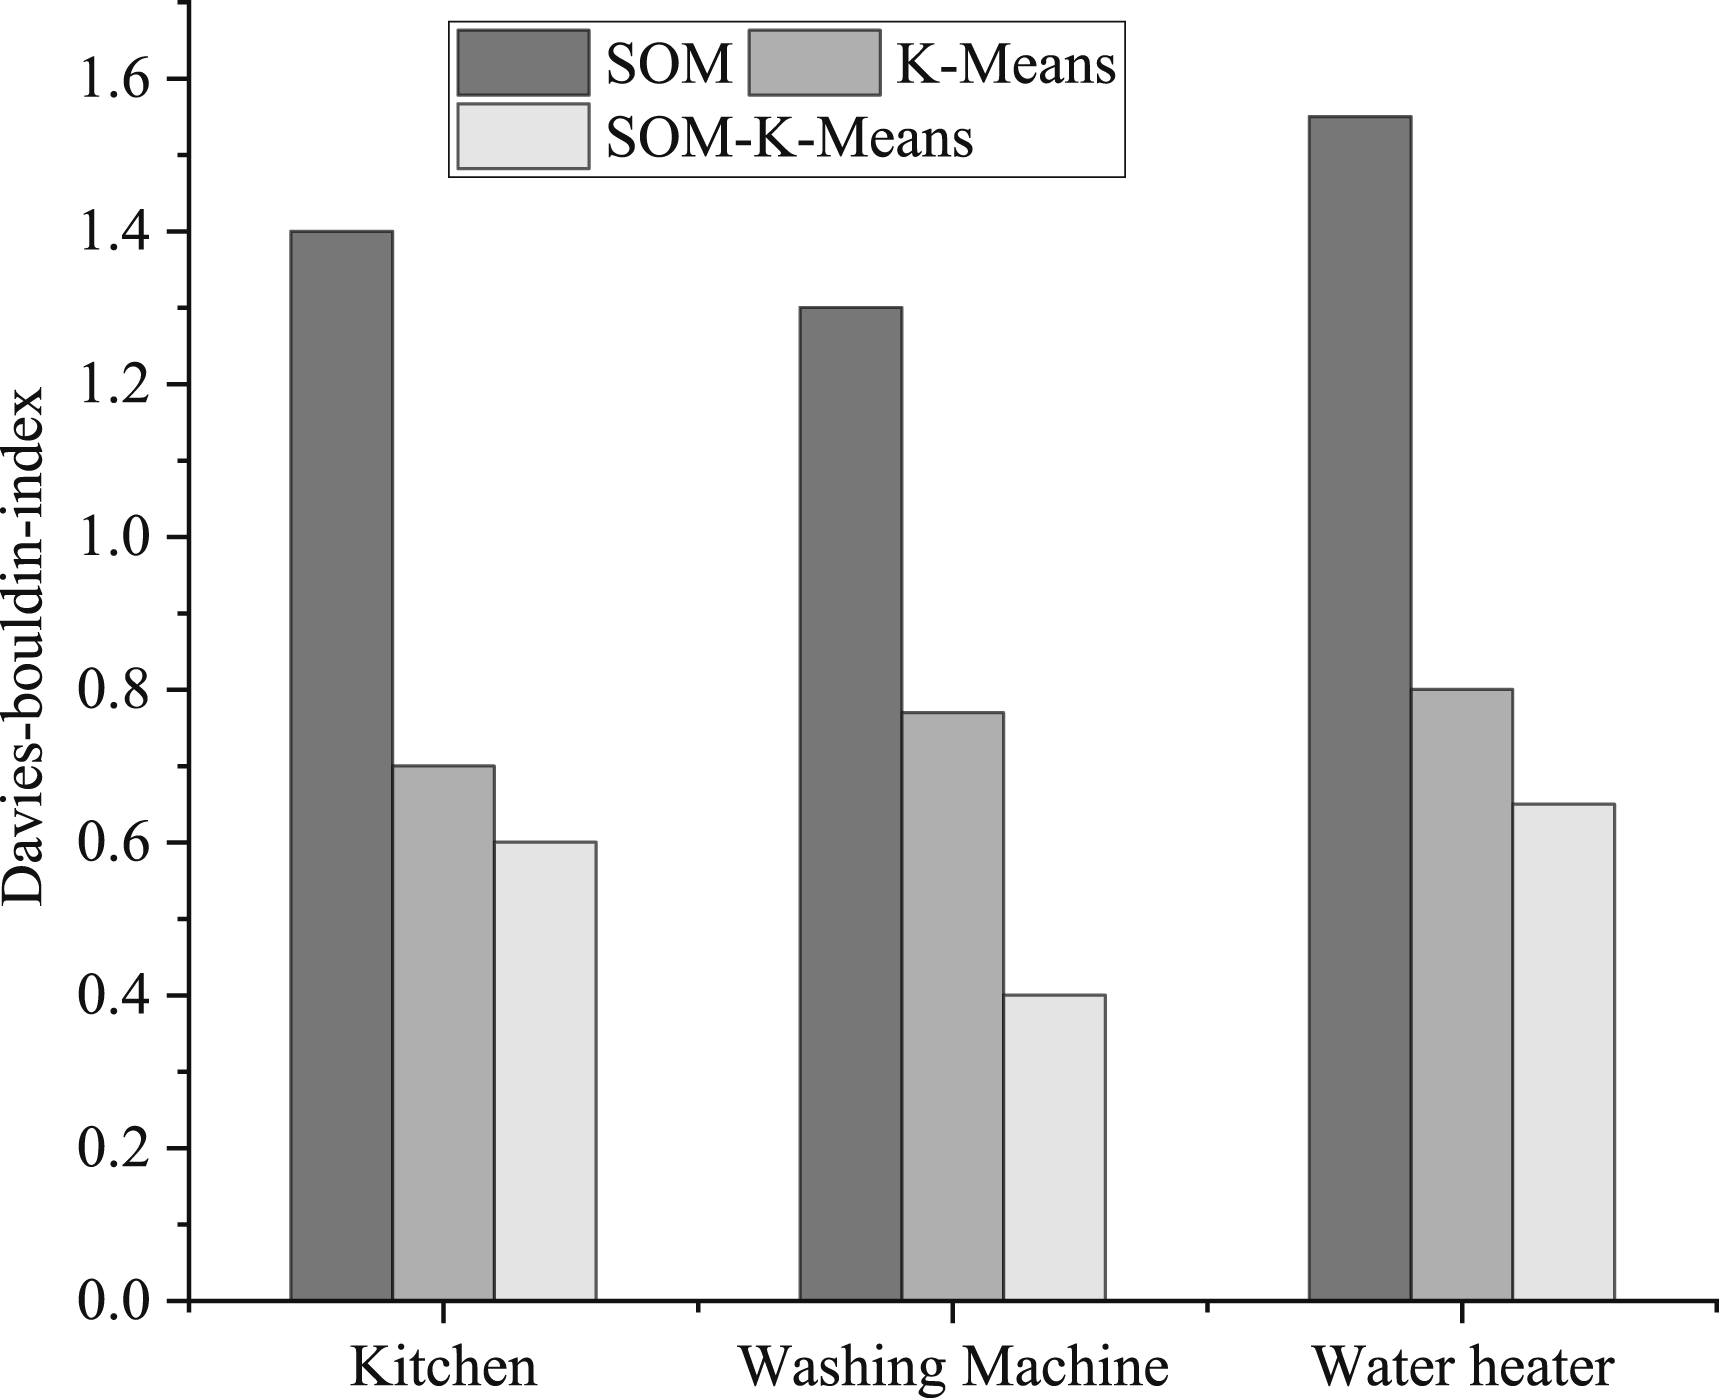
The smaller the DB value, the smaller the intra-class distance of data and the larger the distance between classes, which indicates that the clustering effect of the algorithm is good. As can be seen from Figure 5, the k-means algorithm improved by SOM has a better clustering effect.
To evaluate the performance and reliability of the proposed SOM-optimized K-Means positioning algorithm, a series of controlled experiments were conducted using Wi-Fi RSSI fingerprinting in a 90 m2 apartment with typical elderly indoor layout.
A total of 90 reference points were collected during the offline fingerprinting phase, with a sampling density of 1 point/m2. At each reference point, RSSI samples were recorded from 5 to 7 visible access points (APs) depending on local signal coverage. Temporal stability tests revealed a mean RSSI drift of ±3.6 dBm, measured over 72 continuous hours, with higher variance near corridor corners and window regions.
For online positioning, the average query response time was 104 ms on a Jetson TX2 embedded system, enabling near-real-time operation.
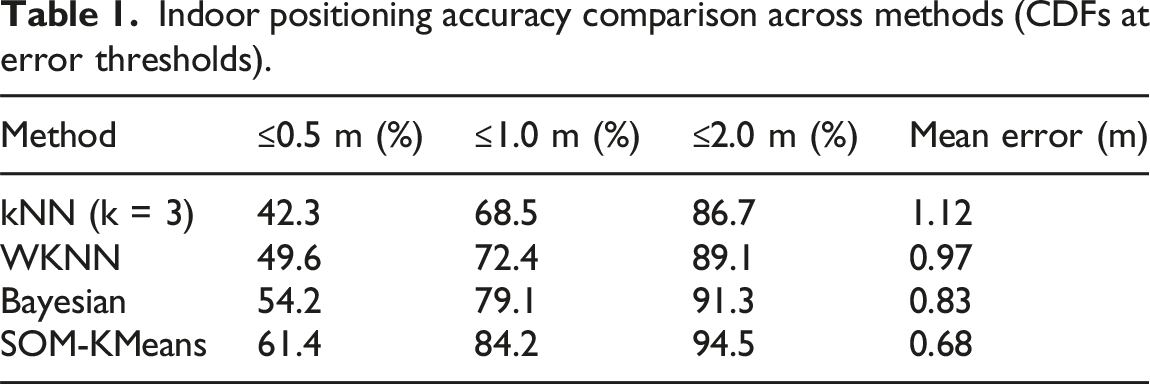
To compare positioning accuracy, Cumulative Distribution Functions (CDFs) were computed for error thresholds at 0.5 m, 1.0 m, and 2.0 m. The SOM-KMeans algorithm was benchmarked against traditional kNN (k = 3), weighted kNN (WKNN), and Bayesian fingerprinting.
Indoor positioning accuracy comparison across methods (CDFs at error thresholds).
By cluster analysis of 30-day data in three intervals, the power consumption data of the same equipment with the same power consumption curve will be classified into one category, which can obtain the user’s habits of using this equipment. As shown in Figure 6. Clustering effect of regional power consumption.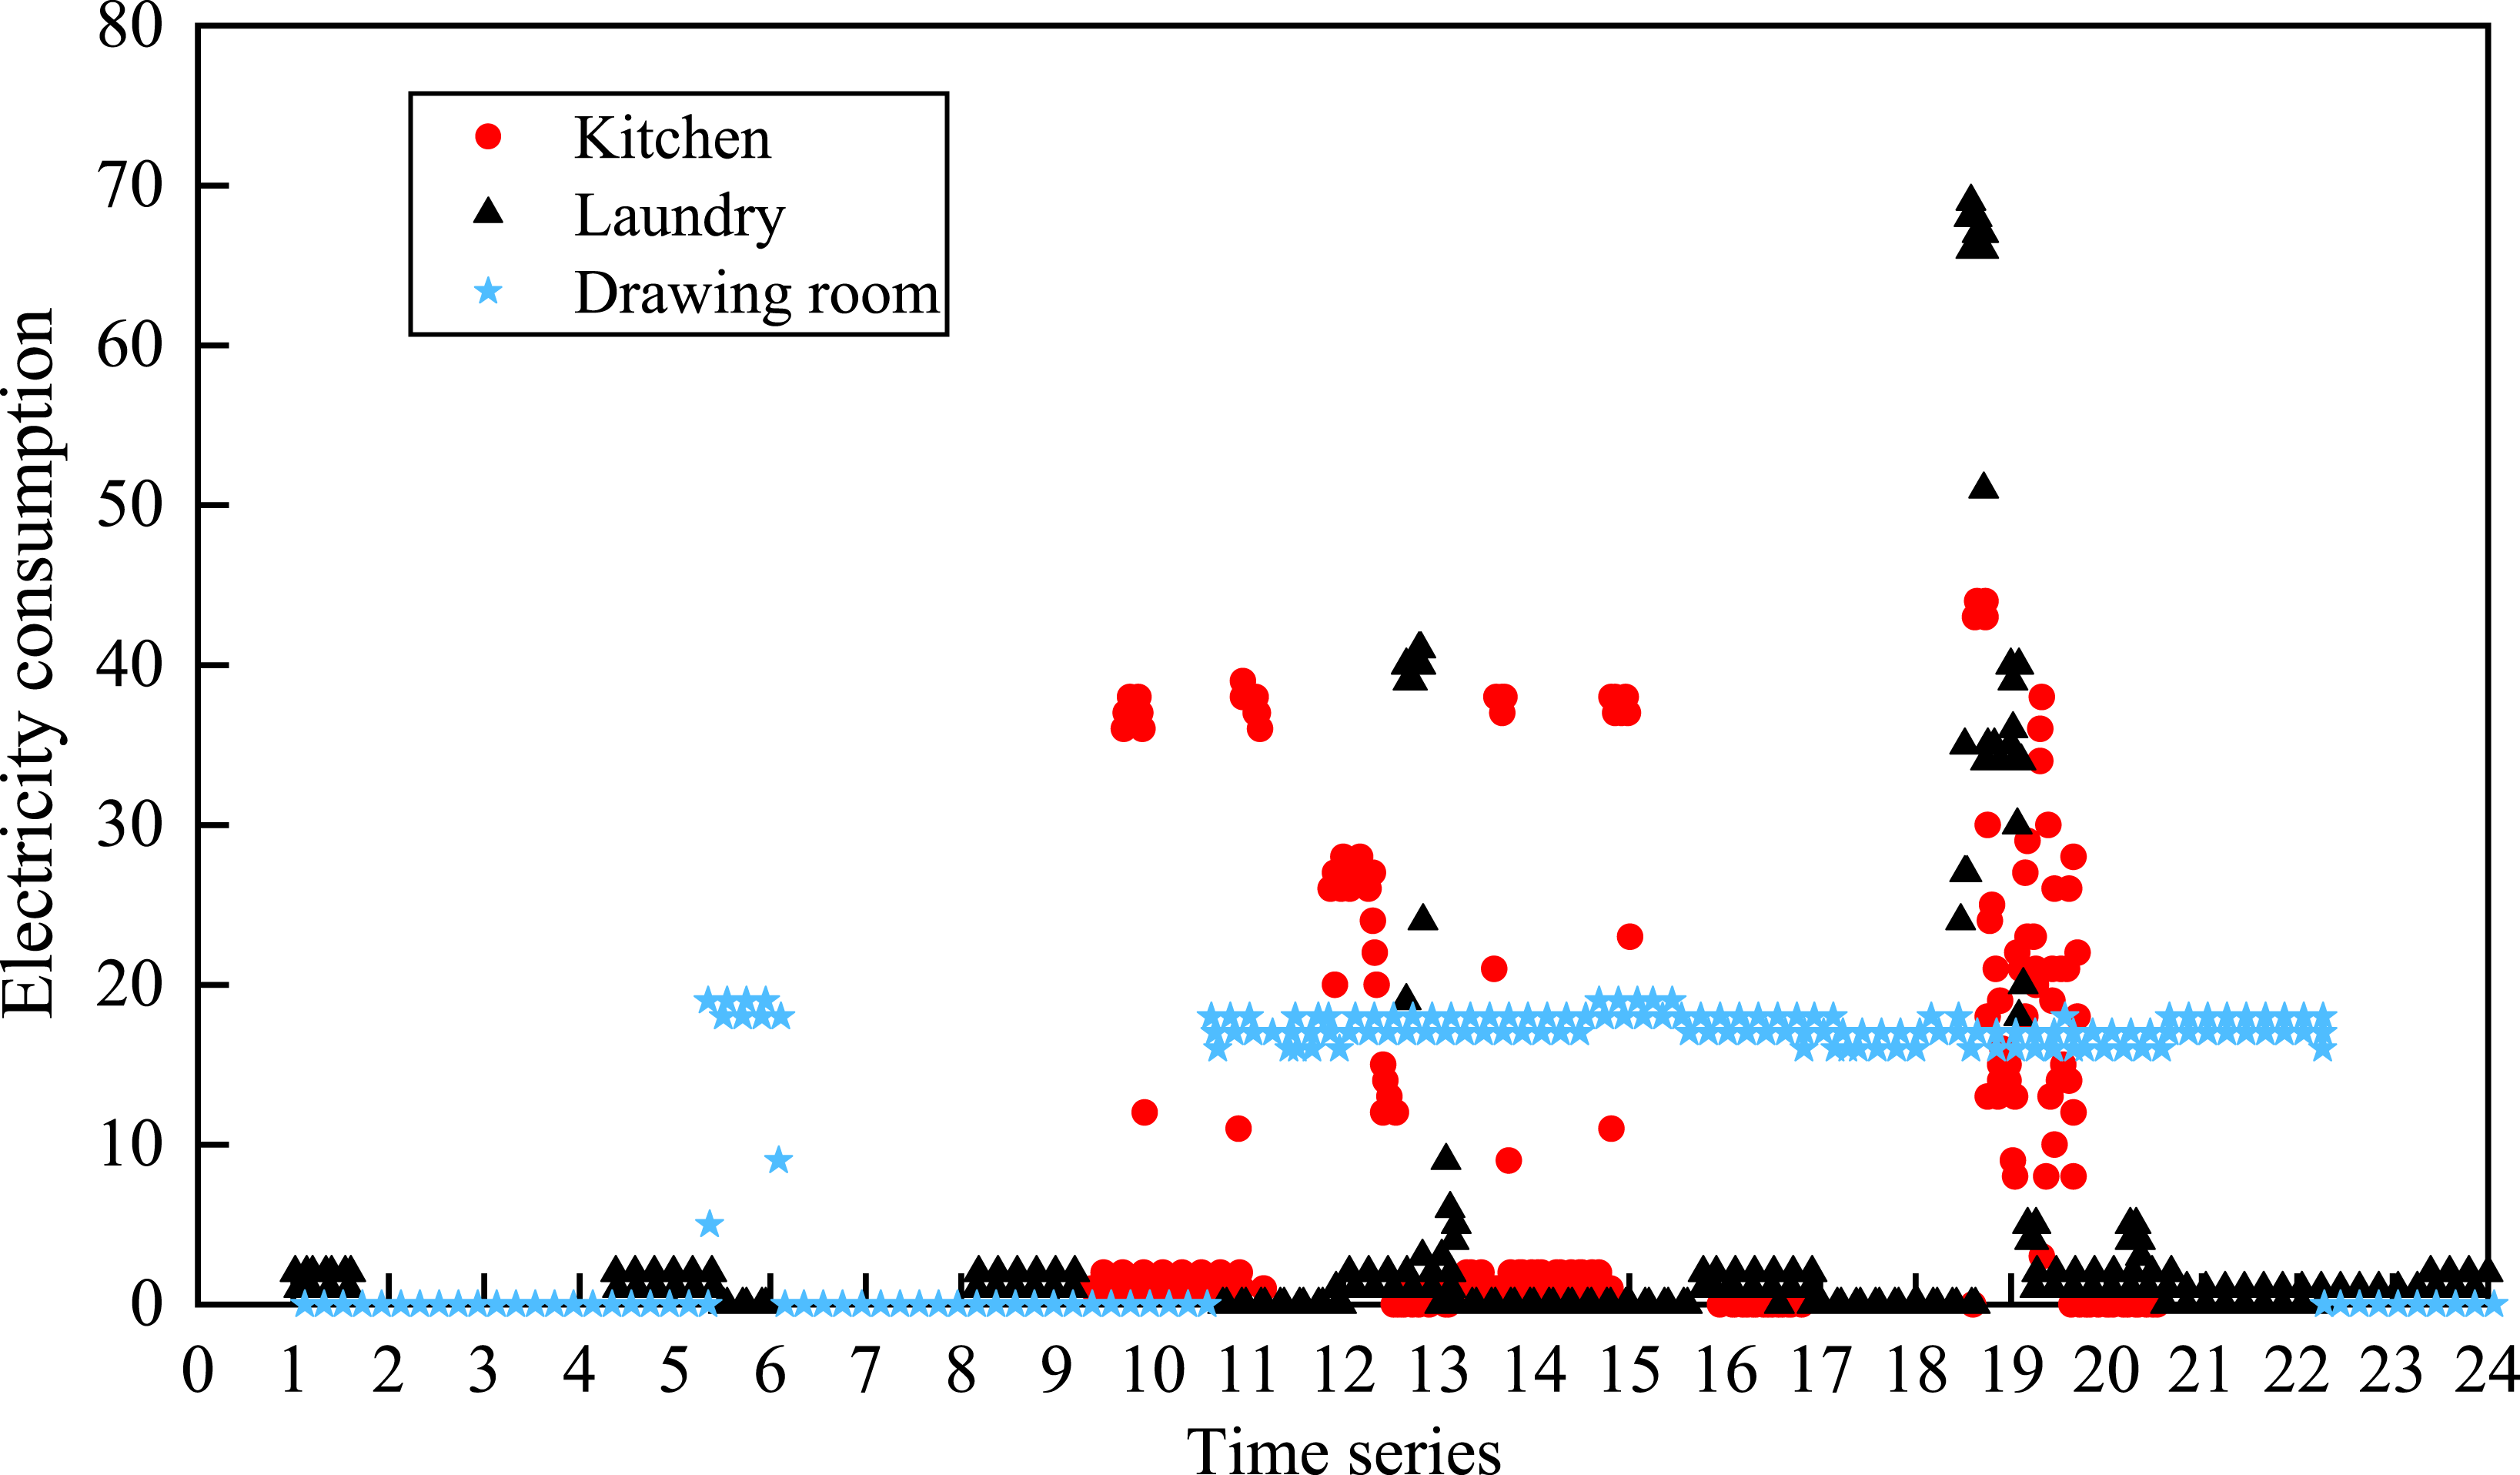
According to the user’s habits, we can set the corresponding control strategy of smart home appliances as follows: after taking a bath, the washing machine detects whether the weight of clothes reaches the threshold according to the pressure sensor. Moreover, the contact sensor automatically turns on the washing machine at the right time. If the cooking time of the user arrives and the infrared human body sensor detects the user entering the kitchen, the gas sensor of the kitchen starts to collect the relevant data in real time and monitors the safety of the kitchen. While when the user’s habitual bath time reaches, the water heater will heat up first, and in a certain period, when the infrared human body sensor in the bathroom has not detected the user’s entry, the contact sensor will automatically turn off the water heater and reduce the confidence level of the bathing event.
For clustering evaluation, clustering purity (89.6%) is calculated by comparing the algorithm’s output clusters against predefined behavior categories based on device usage profiles and time-of-day heuristics. For behavior recognition, the reported accuracy of 92.1% was obtained on a hold-out test set from a 30-day behavior dataset.
Conclusion
In this paper, the traditional indoor positioning scheme is combined with the elderly behavior recognition method, and the intelligent monitoring system for the elderly is deeply studied. SOM and K-Means algorithms are combined to carry out a double-layer clustering analysis on the elderly behavior data to improve the accuracy of clustering, and then the association rule analysis with time constraints is used to establish the user behavior pattern. The experimental results show that the clustering effect of the algorithm is excellent. The constructed system can find the instruction with the highest similarity in the instruction library combined with the environmental factors to respond to the user’s current operation. According to the user’s habits, it simplifies the operation complexity of the elderly on the smart home system. It provides personalized and modern intelligent services for the elderly and improves the safety and comfort of the elderly living alone. In addition, we only predicted the behavior pattern of users through electricity consumption. Subsequent studies will focus on more complex specific life scenarios.
Footnotes
Funding
The authors received no financial support for the research, authorship, and/or publication of this article.
Declaration of conflicting interests
The authors declared no potential conflicts of interest with respect to the research, authorship, and/or publication of this article.