
Abstract
We propose a method for automatically optimizing the layout placement of user interfaces in commercial applications. The proposed method suggests an optimal user interface component placement layout for an application by considering behavior cost, repeated user interface sequences, and preferred placement area. We used the Apriori algorithm and a genetic algorithm efficiently to optimize user interface component placement based on the evaluation of a keystroke-level model. We verified the effectiveness of the proposed method using a customizable user interface for three applications, namely, Adobe Photoshop, 3DS MAX, and the massively multiplayer online role-playing game “World of Warcraft.” Our experimental results show that the proposed system can both reduce the behavioral cost of an application at the user level and enable efficient user interface usage by considering interrelationship patterns among user interface components.
Introduction
It is very useful for user interface (UI) designers to be able to predict at an early stage of the design whether users will be able to navigate the software with optimized movements. Such predictions enable UI designers to verify early that their intended designs are suitable, with the overall verification process being streamlined around the user behaviors. However, detecting whether users will experience an optimized UI at the design stage is difficult because of the high cost of behavior analysis. 1 To check users’ UI experiences of applications, the test participants will typically need to use particular PCs or smart devices and be surrounded by various UI monitoring tools in sealed UI test rooms. The monitoring tools then record test participants’ reactions in real time and generate a large amount of log data. After the test participants have finished the software test, UI designers and analysts gather to examine the log data and feedback from the participants. Then, a manual survey is conducted. The analysis of the log data aims to identify statistical trends for further high-level behavior analysis. Based on these results, UI designers can redesign their products during development and even after release. This UI test approach has been applied to the commercial software and content development industries, and its usefulness has been verified. 2 However, it requires a substantial commitment by test participants and human–computer interface (HCI) experts over a long period. To address this problem, new UI design processes that use artificial intelligence (AI) technologies such as genetic algorithms (GAs) have been proposed. In particular, automatic design using an interactive genetic algorithm (IGA) has been proposed for a variety of application domains. Existing IGA methodologies attempt to optimize the UI based on manual selections by users, which enables rapid searching for candidate UI layouts. However, it still requires burdensome feedback by the users. Moreover, the functions of existing content production applications are becoming increasingly complicated, which results in a significant increase in UI complexity and interrelationships. In particular, traditional content creation tools now involve deep interrelationships between UIs as their functionality has expanded over time. In this article, we address for the first time the problem of UI optimization in an application environment that requires a series of consecutive UI behaviors by users. Most existing IGA-based UI research has aimed at creating an optimized UI during development from the designers’ side. However, we are proposing a new approach, whereby potential users discover UI layouts that are optimized with respect to their repetitive behavior patterns. To achieve this, we have developed an application-independent optimization tool. With this tool, we can analyze repeated UI behaviors and use the most repeated UI sequences in the optimization. To detect UI behavior sequences efficiently, we adopt a keystroke-level model (KLM). The input data required by our system involve only simple basic interactions: mouse trajectories and keyboard data. With these data, we use a GA as an optimizer to create an optimal UI layout. By considering the behavioral cost of this optimized layout, our system suggests an optimal icon placement. Because there is a growing need to optimize UIs in applications that support customizable UI functions, we investigated the proposed method using three commercial applications that have customizable UI support. Compared with the default UI settings for these applications, our research results demonstrated a reduction in behavior cost of 9%–18%. Because our system can be applied at the customer level, users can evaluate the behavior cost of their candidate UI layouts and achieve an optimal UI component placement. This can help reduce the manual monitoring and analysis costs of UI layouts for users and application designers.
Related work
In this article, we adopt a KLM 3 in calculating the estimated behavioral cost of UIs. Many UI evaluation tools use KLM and goals/operators/methods/selection (GOMS) models. These include efforts such as QGOMS, 4 CATCHI, 5 and APEX, 6 which provide scripting languages for developing models that can be applied in real-time simulations. CogTool 7 is a general-purpose UI prototyping tool that automatically evaluates designs using a predictive human performance model. It is an open-source tool for supporting KLM-GOMS analysis. KLM Form Analyzer 8 also automatically evaluates Web form filling tasks. It conducts KLM symbolic calculations of the time required to fill a specific Web form in a straightforward and automatic manner. The CRITIQUE usability evaluation tool 9 was developed to automate a number of evaluation tasks. It produces predictive models from demonstrations of sample tasks in a fraction of the time needed by conventional handcrafting methods. Cogulator 10 is a simple human performance calculator developed for building KLM, natural GOMS language, and cognitive perceptual motor (CMS) GOMS models. Users describe a task using Card–Moran–Newell GOMS and Cogulator returns task time predictions and working memory load estimates. KLM-Qt 11 is a tool that can generate KLMs and use them to evaluate certain mobile phones. SANLab-CM 12 is another tool that incorporates stochastic operations into activity network modeling. It shows critical paths with simple emergent properties of variability in elementary CMS processes. These evaluation tools are designed to provide support for a range of different UI usability evaluation methods and to integrate that support with UI implementation tools. However, these tools cannot generate the best candidate UI layouts for designers. To address this issue, automatic design concepts that use IGA have been proposed within the AI field.
The IGA has been applied to automatic design in many domains. Fashion design examples include modeling women’s dresses using 3DS MAX 13 and a system to model Japanese yukatas that are suited to the user’s taste. 14 There are other examples. A font generation system has been proposed that comprises a font definition phase and a font creation phase to create new font candidates based interactively on users’ subjective evaluation. 15 Colors used in the UI evolve in the search for a solution that provides a good trade-off between esthetic and accessibility requirements. 16 An office layout support system has also been proposed, which applies not only to square spaces but also to polygonal spaces. 17 It evolves its UIs in terms of XML User Interface Language (XUL). 18 A sign–sound system can generate melody-based sounds freely and easily. 19 Finally, there is a website design system that has its users involved in the process of generating the UIs for Web pages.20–22
Recently, a multistage IGA has been proposed for product design. 23 This divides the large population in traditional IGAs across several stages to capture better the knowledge of users’ personalized requirements. Such an IGA has been applied to interface exploration for the color palette space. 24 This considers two different factors, an objective evaluation that depends on color distances and a subjective factor that depends on scores given by users. Two-stage nature-inspired GA algorithms such as artificial bee-colony algorithms and charged-system search algorithms have been applied to the optimization of Web interfaces via their usability criteria. 25
Previous UI optimization studies have involved simple environments such as the Web or simple applications developed for research. Therefore, optimization could simply reflect the motor-level cost at specific points in the IGA-generated UI layout. However, with the software industry evolving, recent applications have become more complex. In software tools, many UI components may exist and most UI behavior will be strongly correlated. For UI optimization in these applications, any optimization algorithm should consider these interrelationships and the functional efficiency of the UIs. Furthermore, because recent applications now have customizable UI functions such as moving UI components and several layout options, there is a growing need for users to be able to optimize their UI layout for themselves.
This article proposes an automatic UI layout suggestion system that considers personalized interrelationships among UIs. Our system collects users’ UI input information from the client side and suggests an optimal UI layout for each application. To achieve this, we adopt a KLM model for evaluation and a GA for optimization that involves the Apriori algorithm 26 and the Maximal Rectangles (MR) algorithm. 27
This article is organized as follows. In section “The KLM model and methods,” we explain our KLM model for evaluating users’ behavioral costs. The repeated sequence detection method is detailed in section “Repeated sequence detection,” with optimization and layout placement methods being described in section “The optimization method.” The proposed system is explained in section “The proposed system” and the experimental results are provided in section “The experiment.” Finally, we discuss the results and offer our conclusions in sections “Discussion” and “Conclusion.”
The KLM model and methods
To encode UI interactions as a set of graphical user interface (GUI) sequences, we use KLM, which is the most widely used modeling method in the HCI domain. KLM predicts the time required for an expert user to accomplish a routine task without errors using an interactive computer system. In particular, it is used to develop a simple model that describes the time required to perform a task with a given method using an interactive system. If

where
The primitive operations comprise K (key/button press), P (point to target with a mouse), H (homing hand to the keyboard or mouse), D (draw a line with a mouse), M (mental preparation; pause), and R (system response time). The first four operations are physical motor actions and there is one mental action plus one system response element. If an operation is fully anticipated, M can be deleted. In general, the times required to complete the primitive operations can be predicted from experiments. The following is an example of a simple KLM encoding rule and its estimated execution time. The rule is “replace a three-letter word (ABC) with another (EDF)” (Te = 3tM + 9tK):
Substitute command—MK[s];
Enter new word—3K[EDF];
Terminate arg—MK[(return)];
Enter former word—3K[ABC];
Terminate arg—MK[(return)].
Because KLM uses only keystroke-level operators, the analyst simply lists the keystrokes, mouse movements, and mouse button presses that the user must perform to accomplish the tasks. In this article, we evaluate UI layouts that enable easy repetitive task sequences. To produce reliable encoding results for this study, we adopted previous results from the work of Card et al. 3 Table 1 shows our KLM operator descriptions and encoding styles. Because application experts almost simultaneously use both keyboard input operations and mouse operations while digitally painting and modeling, the traditional “Homing” operation can be ignored, enabling this study to assume that mouse and keyboard data can be sampled in parallel.
KLM operators in the proposed system.
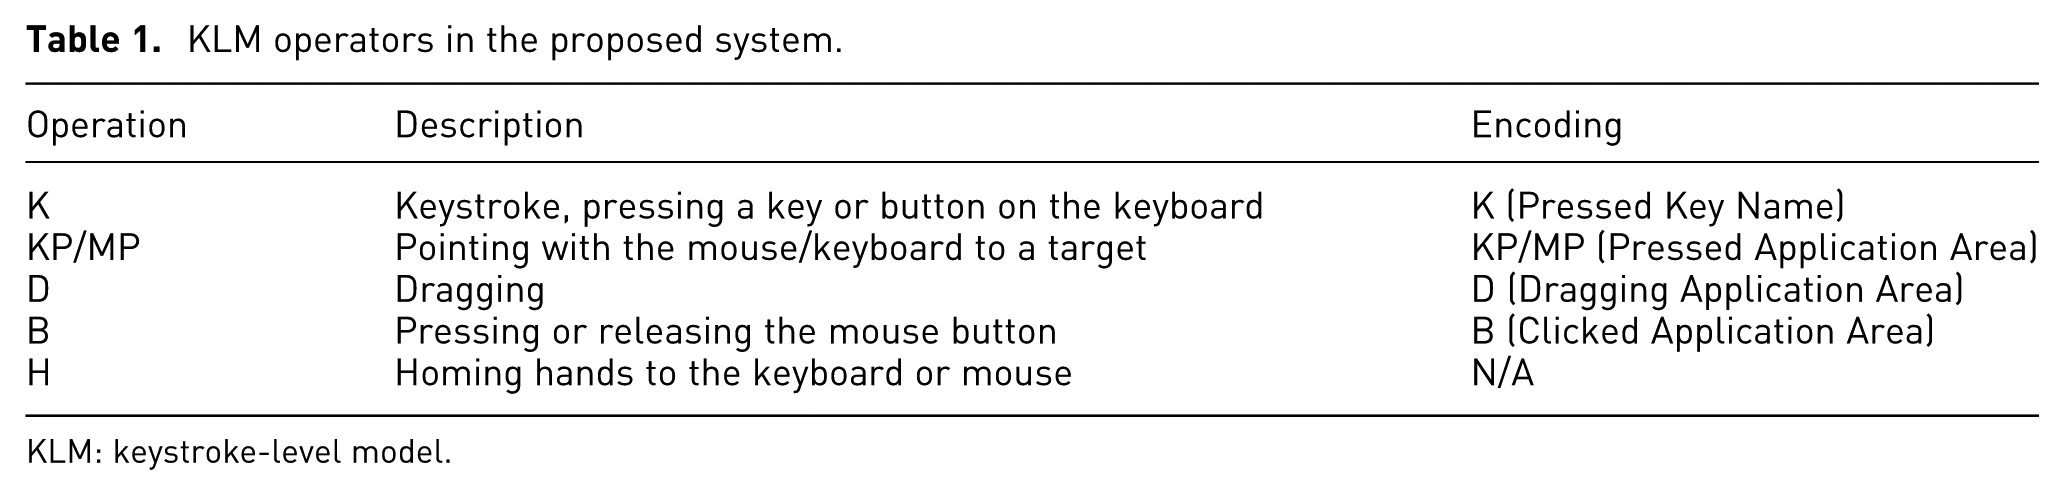
KLM: keystroke-level model.
KLM operation encoding
The transformation from event-oriented information to a KLM is performed primarily through simple pattern matching. Keystroke (K), mouse left button (B), and dragging (D) operations can be directly detected. Pointing (P) is measured by Fitts’ law. Each KLM operation is recorded in the “KLM operator (property)” format. Users manually assign the application area with a marking tool and drawing interface. In general, the application area is marked for each interactive UI component. For example, if a player types an “A” on the keyboard, the operation is marked as K(A). Although previous UI optimization methods handled mouse and keyboard data separately, we integrate the mouse and keystroke behavior into a single KLM model. Therefore, the behavior sequence can be efficiently recorded. However, it is difficult intuitively to understand the context because the sequences are marked as simple strings comprising keyboard characters and mouse movements. To provide a context for the sequences, the KLM sequence in the application log should be transformed into a more readable context. Accordingly, we use a heuristic replacement table that transforms the raw data into simple behavior units.
Repeated sequence detection
In many recent applications, the keyboard is repeatedly used, and the mouse is used with many repetitive movements, to correlate with UI components. In this environment, repetitive key values are often used in a sequence. This poses restrictions on the use of existing algorithms. To identify frequently used sequential association patterns, we adopt the Apriori algorithm. 26 This is an algorithm for frequent item set mining and association rule learning over transactional databases. It identifies the frequent individual items in the database and extends them to increasingly larger sets of items if the sets appear sufficiently often in the database. The frequent item sets determined by Apriori can be used to determine the association rules that highlight general trends in the data. The pseudo-code for our algorithm is as follows:
Expert users of digital painting or modeling software often employ their own sequential shortcuts to improve painting productivity. For example, in digital painting applications, the user may frequently employ specific repeated sequences (e.g. Press B (Brush), Scaling Size of Brush—Move to Color Pallet—Select Color). Such a sequence can be used as one of our targets for optimization. Accordingly, pattern tables with a code value of compressed KLM operations are created at each sample time. These n-gram codes, which may repeatedly appear, are then extracted. Each time a new code is output, a new pattern is added to the pattern table. After the pattern table has been created, the consecutive keyboard patterns and mouse movement patterns from 3-grams to n-grams are extracted.
The optimization method
The mouse trajectory should visit every UI component that is related to every basic task. This problem is similar to the traveling salesman problem (TSP) in the AI domain. Our system has whole task sequences and, by adjusting the UI component placement into several candidate regions, the system can calculate UI component placement layouts that have minimum distances in terms of the KLM evaluation cost. To achieve this, we used a GA, which is often a useful solution to optimization and search problems. 28 Because the KLM cost depends primarily on P (Mouse Pointing) and D (Dragging) operations, the key factor in reducing KLM cost is reducing mouse trajectory distances and angles. Therefore, we chose the following requirements for UI module placement optimization:
Related UI icons that have a strong sequential association should be located close together;
Related UI icons that have a strong sequential association should have directional accordance.
Optimization modeling
The main objective of the optimization module is to minimize the total summation time for all KLM operations by adjusting the position of the UI components (equation (1)).

where
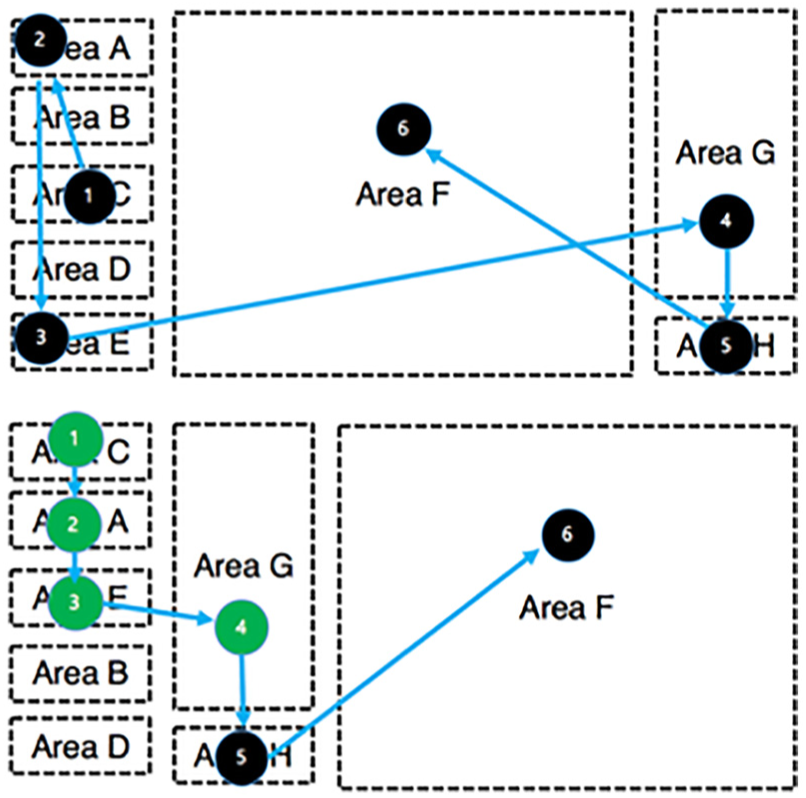
UI before layout optimization (top) and after optimization (bottom) that considers the most repeated sequence patterns (green indicates a repeated sequence).
The classical TSP requires finding the shortest overall route while visiting all cities one by one. It is a representative NP-hard problem for which the computational time increases exponentially with the number of cities. TSP solutions can be based on neural networks, simulated annealing, or GAs. The GA approach is often used in computing to find exact or approximate solutions to the optimization and search problems and can be categorized as involving global search heuristics. GAs are a particular class of algorithms that use techniques inspired by evolutionary biology such as inheritance, mutation, selection, and crossover. The TSP is a representative GA research area. Various GAs have been suggested for solving the TSP. The most representative examples include order crossover, 29 cycle crossover, 29 partially matched crossover, 30 and edge recombination. 31 In this article, we aim to achieve an optimized trajectory by adopting TSP models for our UI area adjustment. Among the possible models, precedence-constrained TSP models will be necessary to satisfy sequential patterns. We, therefore, used a precedence 32 for the TSP that uses a precedence operator. The GA cannot guarantee optimized solutions the whole time but can guarantee optimized solutions within a limited computational time. To find an optimized route, it is necessary to satisfy the following two constraints:
Precedence constraint. The trajectory is processed by sequential KLM operations. The later operations cannot be processed before preceding operations. This means that the optimized trajectory should be found via a precedence-constrained TSP. With this constraint, repeated sequences that are detected by the Apriori algorithm can be applied as precedence conditions for the GA.
Access constraint. There can be accessible (preferred) or unusable areas in every application. To reduce the size of the search space, we eliminated these areas for better GA efficiency. We generated the UI component position within an accessible area assigned by the user.
The GA process
For the optimization module, precedence- and position-constrained GAs are required. The system comprises the processes shown in Figure 2.
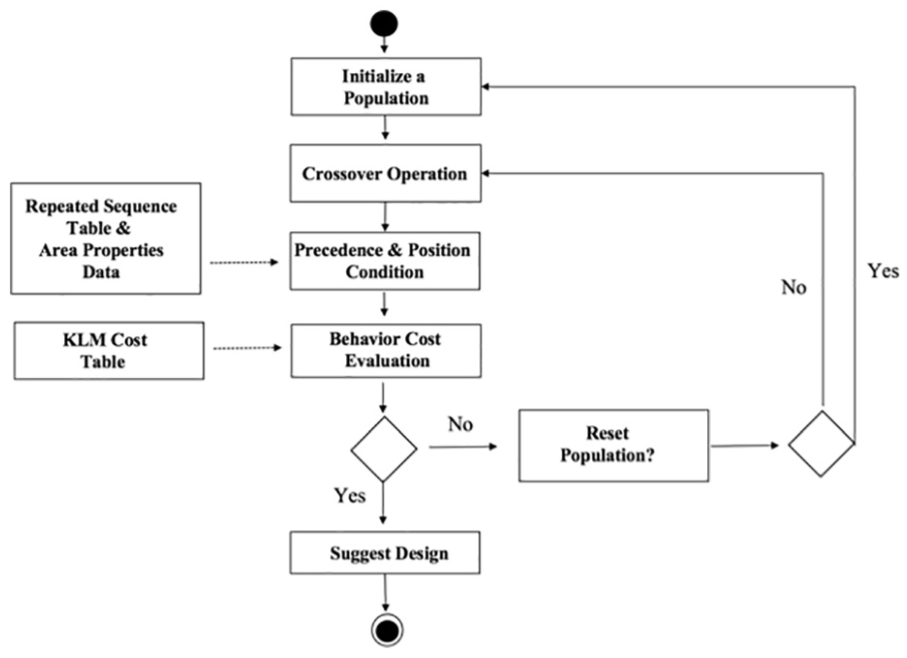
The GA process for the proposed system.
Chromosome expression
We used a UI component–based chromosome expression to solve the TSP problem. Every gene in a chromosome denotes a target visiting location for UI operations from left to right. Gene
Fitness evaluation
The key parameters for estimating the total time are the distances and angles between related genes in a chromosome. In this article, the system selects the combination of gene
The MR algorithm
Our system receives an input UI area in a rectangular form directly from the user and generates the result so that the UI layout is minimized within the area. For a given UI component to be placed in a given area without overlapping another component, a two-dimensional rectangular bin-packing problem must be solved. This is a classical problem in combinatorial optimization. Given a sequence of rectangles (
The proposed system
The main objective of the proposed system is to support the automatic design and evaluation of UI layouts. Its implementation comprises three modules: (1) the KLM operation encoding module, (2) the repeated sequence detection module with its replacement table, and (3) the GA optimization module with its MR algorithm. Figure 3 presents the main architecture of the system and its iterative design process. The transformation from event-oriented information to a KLM is achieved primarily through an event-hooking log system. For this, we developed a client-side log sampling system with functions for detecting input sequences in real time using event-hooking techniques. This system can run independently with the target application. Therefore, its behavior with any application can be measured easily. In addition, our system stores the mouse trajectory and length in a linked list. This enables calculations of the overall distance moved by the mouse and the distance moved per click, which are used in estimating efficiency. The sampled results can be exported to CSV files. The KLM operation encoding module generates a time-sensitive KLM operational log of keyboard and mouse events. All PC-related activities are transformed into KLM operations, as outlined in Table 1. There are some encoding exceptions that exist because of the physical limitations of the user. For example, in real event logs, a very small number of mouse motion events sometimes appear between a mouse click and some typing. To compensate for this, we include a postprocessing step that removes these extremely short mouse movements. When the sampling is completed, all the information is transformed into a series of KLM operators. The repeated sequence detection module analyzes the areas marked as KLM operation sequences to generate the table of the most repeated sequence patterns. In particular, the table lists the most repeated KLM operation sequences that are transformed into high-level context sequences using the replacement table. Users can save their repeated sequence pattern table with these three modules at the training stage.
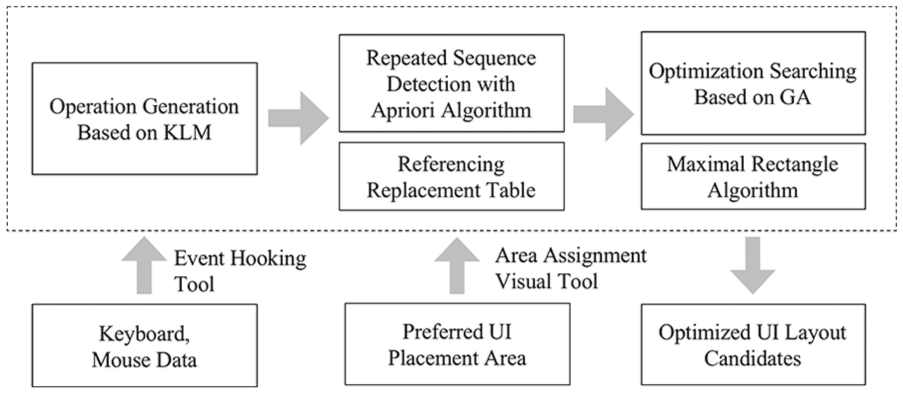
The proposed system process.
After repeated sequence training, the system has a repeated sequence table for the specific application. Area information for GA optimization at the same screen resolution is then provided by the designer or the user. The UI area assignment tool functions within the user’s UI area assignment. This is necessary because any external experimental system cannot access the internal UI identification of the application from the outside without the involvement of a software development kit for the application. Most applications do not support this type of access. The target UI component and preferred area are painted by this tool. Information about these areas is also saved to a CSV file. For the optimization tool, the user KLM data, the repeated sequence table, and the area information are taken as the inputs. GA optimization leads to a UI layout that is organized by considering the interrelationships within the UI that is generated. The designer or user can then adjust UI component positions using the application’s customization functions.
Experiments
To test the proposed system, three applications, namely, Adobe Photoshop, 3DS MAX, and the massively multiplayer online role-playing game (MMORPG) “World of Warcraft” (WOW), were selected. Because these applications require intensive, simultaneous UI interactions with the keyboard and mouse, UI sequences can be a key feature for behavioral feature authentication. Moreover, these applications are widely used in two-dimensional (2D)/three-dimensional (3D) digital content creation fields and are popular as commercial games. This means that the practical usability of the proposed method will be evaluated by testing it with such an application.
Table 2 summarizes the values of the parameters that were used during the experiments. The initial population was set to 100, while the number of generations ranged between 700 and 1000. The crossover probability was set to 0.8, while the mutation probability was set to 0.1. The termination criterion used to halt each run of the experiment was when the number of generations reached a set threshold. The proposed system generated the optimal UI layout within an average of 5 s using the GA algorithm.
GA parameter values used in the proposed system.
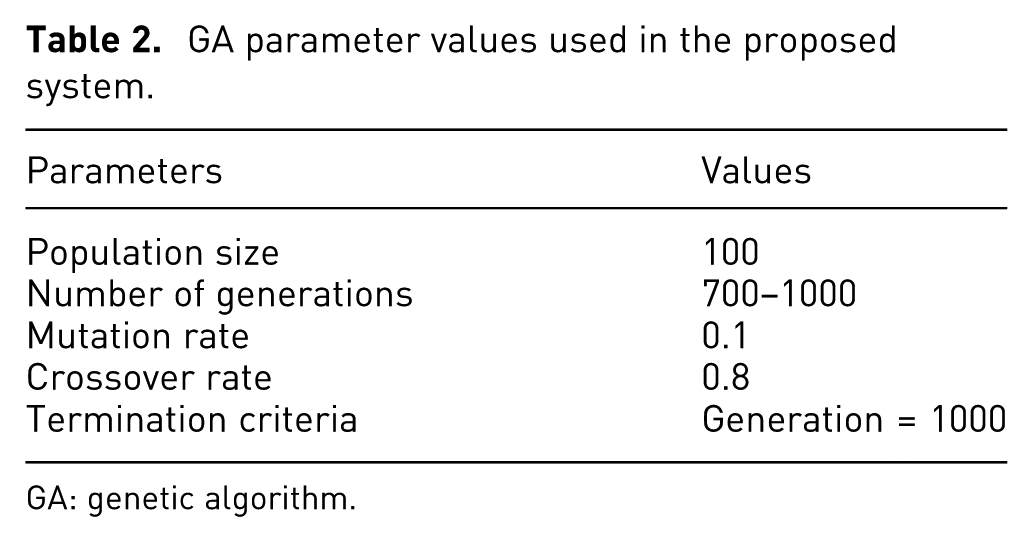
GA: genetic algorithm.
The Photoshop experiment
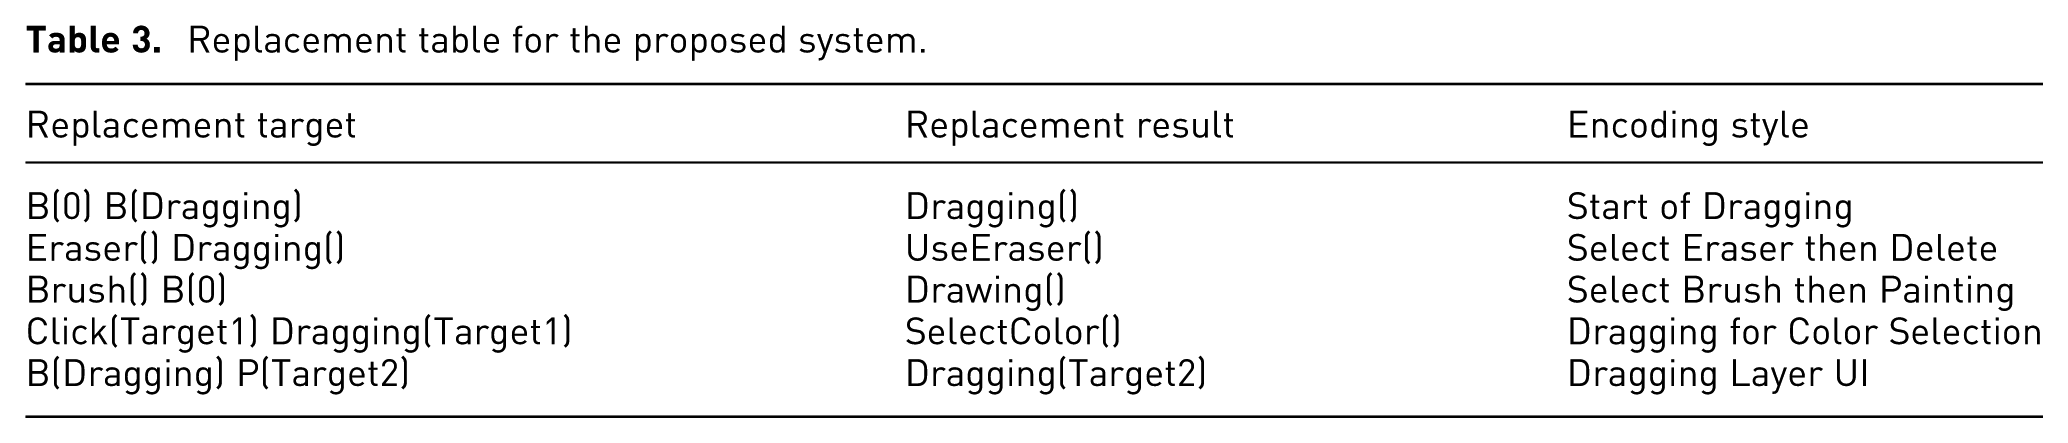
For the Photoshop application, three different painting experiments were conducted. A total of 20 test participants were recruited. Each had Photoshop experience of at least 3 months. The experiments were conducted as follows. First, the test participants drew three paintings using Photoshop’s default settings (the unoptimized UI). The UI areas containing user trajectories were then marked as target areas for GA optimization. User-preferred areas were also painted by the users, using visual assignment tools. Our system then analyzed the trajectories and generated the optimal UI placement. Because our system stores the visited UI areas as linked list data structures, the system was able to reuse this record for the evaluation of the optimization results. In this experiment, our image resolution was 1920 × 1080 pixels and the canvas size was 2000 × 2000 pixels at 300 dpi. A hue/saturation/brightness (HSB) slider was used as the color selection UI in Photoshop CC. To provide a context for the sequences, the KLM sequence in the application log was transformed into a more readable form, using a heuristic replacement table that transformed the raw data into simple behavior units. Table 3 shows part of the replacement table for the Photoshop experiment.
Replacement table for the proposed system.
From the experiments, there were repeated patterns commonly used by the test participants. For example, we found that color selection sequences were the most repeated tasks overall. The proportion can vary because it depends on the size of the painting but was found to range from 9% to 25% of all tasks. Because the 20 test participants had similar levels of Photoshop experience (at least 3 months), they tended to adopt mouse-centered painting behavior. With the most common repetition patterns having been detected from the experiment, the system then uses them to generate an optimal UI relocation. In particular, our system tried to optimize in terms of first minimizing the cost of the color selection behavior.
Figure 4 presents two of the Photoshop experiment results, showing the default UIs, the optimized UIs, and the trajectories. It shows the color HSB slider being moved to different areas. It was moved either to the center or to the bottom, with the second most visited UI components being located adjacent to it. From these results, we can assume that the color selection area is the key UI component for optimization because of its frequency of use. The system relocated it in the right center area because this was the nearest area to the dragging area. If the frequency of color selection is high compared with other sequences, it will have a high probability of being relocated to the center area.
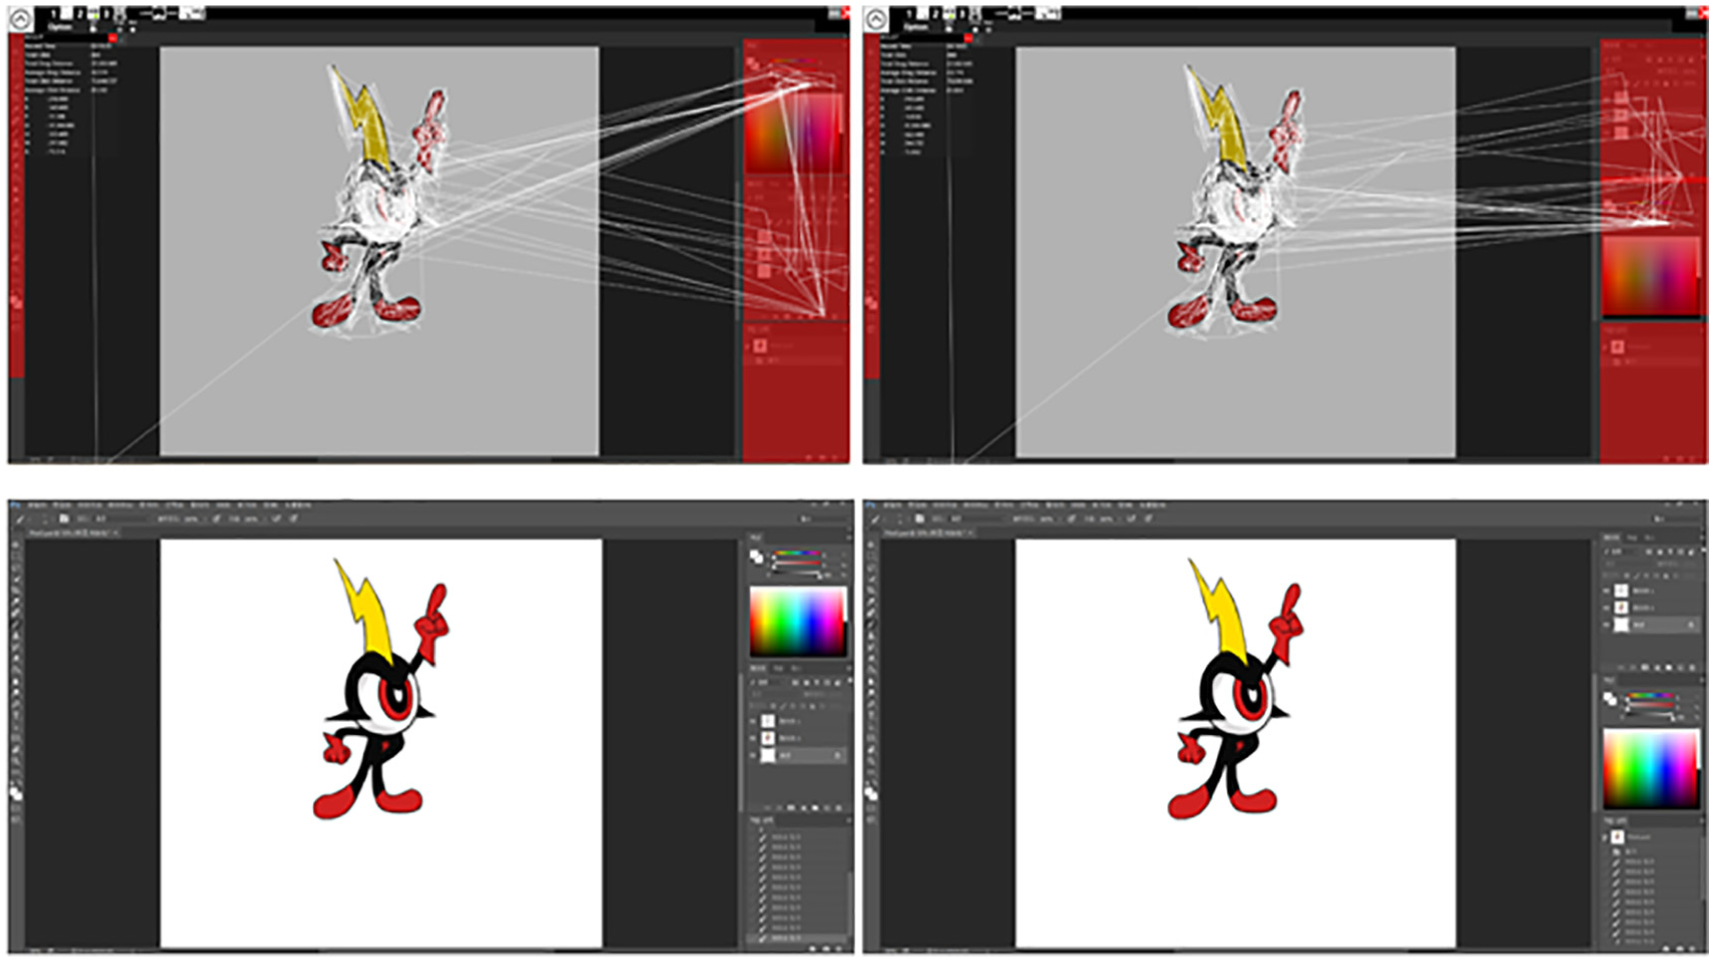
Photoshop experiment results: original UI (left) and optimized UI (right).
Figure 5 shows exceptional results from the Photoshop experiment. On the right side, history, layer, and color components have been rearranged. The color component was moved to the bottom, and the layer component was moved to the middle. The history component was moved to the top, as it was the least-used component. The left-side function components were not changed because most of these functions were conducted via keyboard shortcuts. In this experiment, the test participants added a new layer when we applied a bucket color to a new area. Therefore, “Add New Layer” and “Color Selection” sequences were the most frequent sequential behaviors.
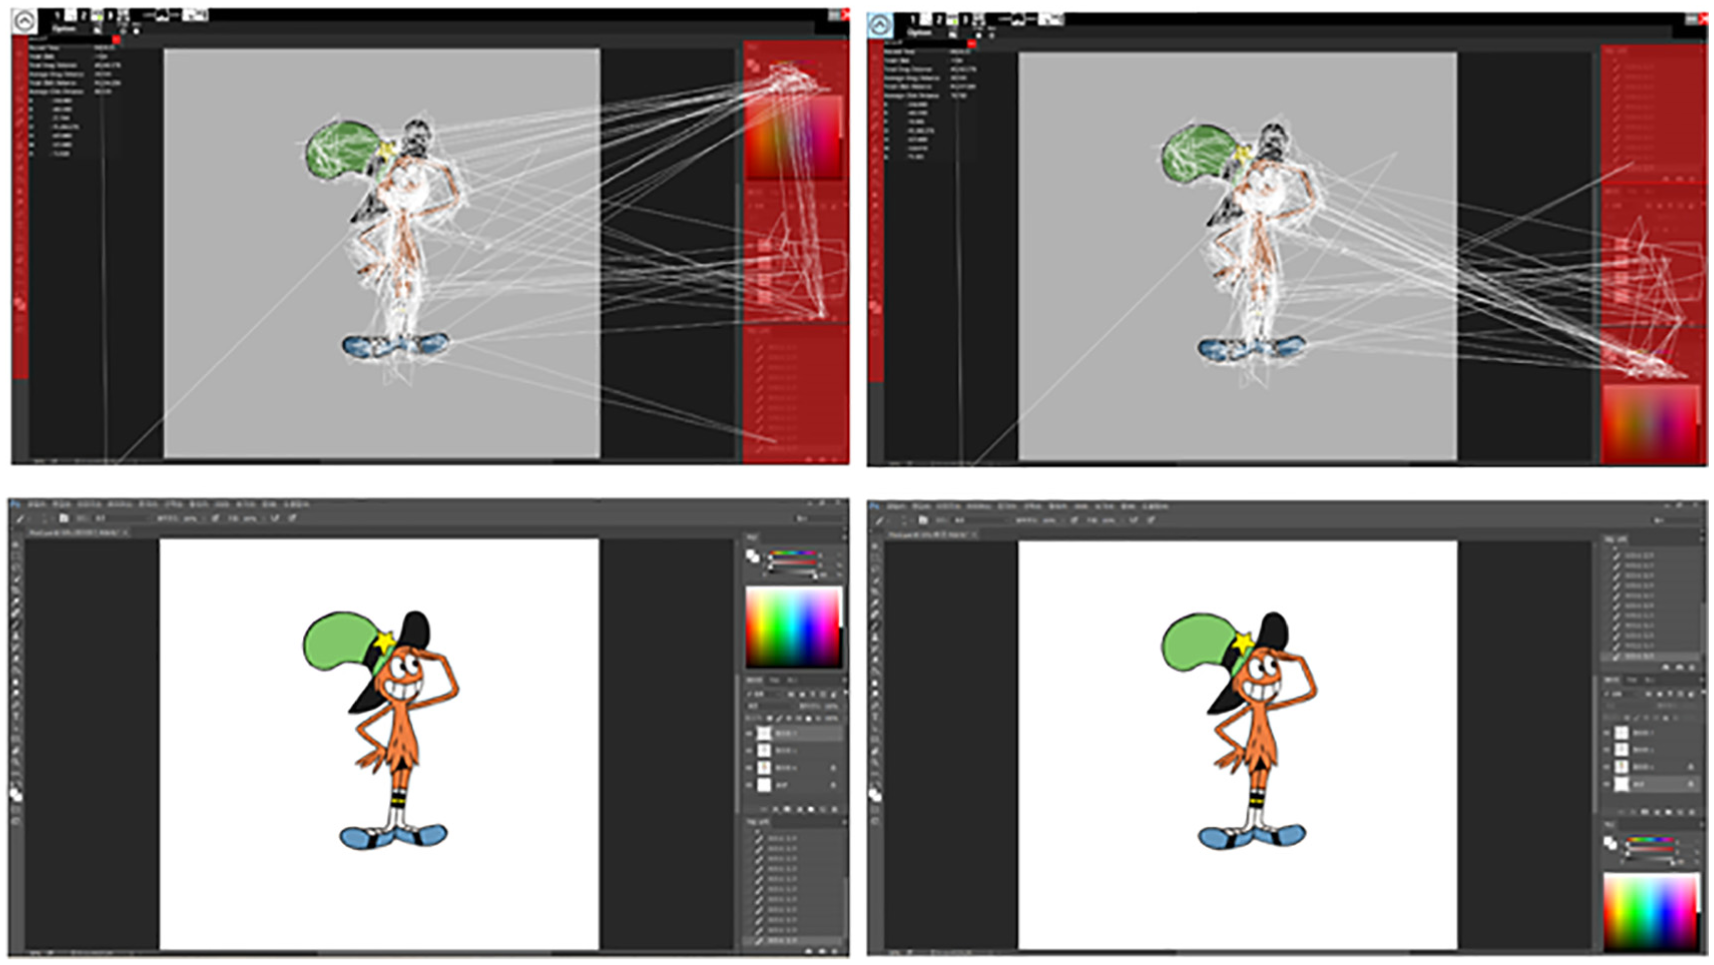
Photoshop experiment results (Exceptional Case): original UI (left) and optimized UI (right).
The more the angle optimization is applied, the more likely it is that the components will be arranged in a circle. Because Photoshop assumes a grid-like layout, we gave more weight to distance optimization than angle optimization. There was a greater difference in repetition patterns caused by the Photoshop usage pattern rather than by differences in the users’ pictures. It is reasonable to suggest that a user’s repetitive input patterns can be a characteristic of the user and the UI should be personalized accordingly. The more mouse usage a painting had, the more the efficiency of the proposed system increased. The use of other parameters gave the best performance when using a 4-gram sequence as the precedence condition in the GA. These results demonstrate that, when using the proposed system, a user may expect optimized UI layers offering up to a 12% behavior cost improvement.
The 3DS MAX experiment
Recent applications provide a variety of layouts (such as “2 by 3” and “4-split”). Users may select and use the layout that is easiest for them to use from among the available layouts. The results of our research can be used to suggest the best layout for a user to select to achieve a low behavior cost. To test this, three modeling experiments were conducted with the 3DS MAX system. A total of 20 test participants were recruited who had 1 or more months of 3DS MAX experience. The same experimental process was followed as for the Photoshop experiment (20 test participants and three models). The target models were simple box-style chair objects denoted by #1 to #3 (number of vertices: 300–350). Figure 6 shows the assigned UI areas in 3DS MAX and the layout candidates. Compared with Photoshop, 3DS MAX has more complex UI interfaces, with each component being separately positioned. We assigned six areas to determine the overall UI movement pattern. Among them, Areas 2, 4, and 5 were the key areas containing many functional components.
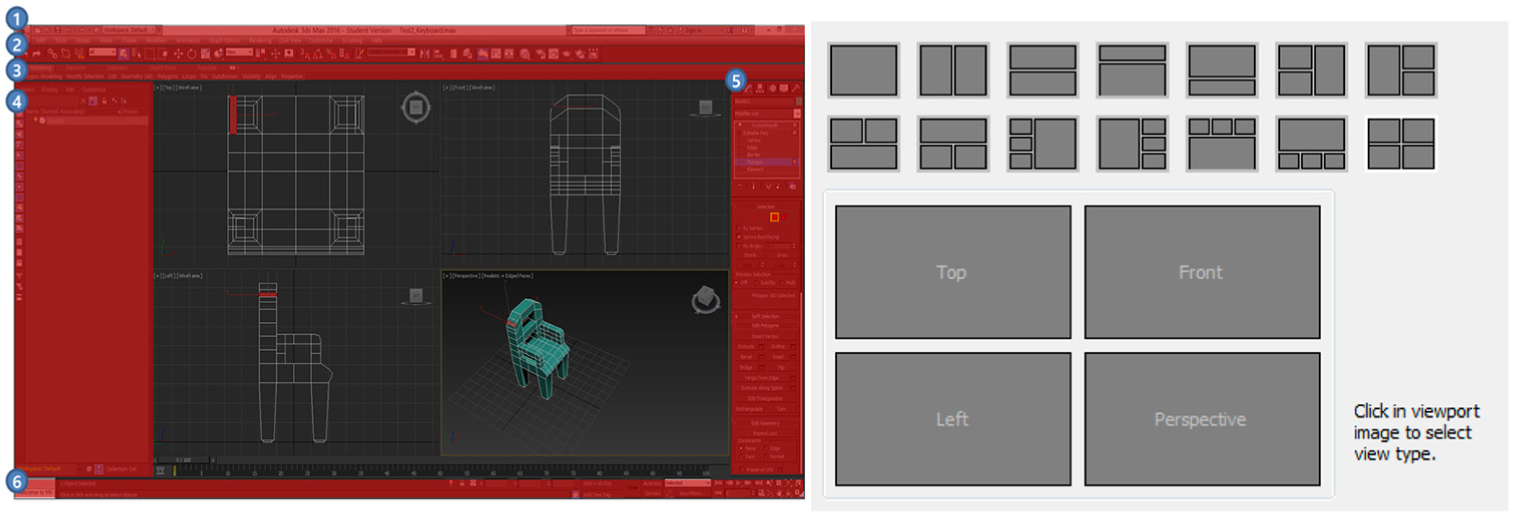
Area assignment for the 3DS MAX experiment (left) and candidate UI layout (right).
Table 4 shows the results for two representative owner-repeated sequences from the three modeling works. Because there were few differences in the target modeling in the 3DS MAX experiments, it was easier to determine the personalized UI sequences. We selected five repetitive sequences from the three experiments for each player. The results showed that there were characteristic differences in common modeling behaviors for each person. As presented in the table, the repetitive sequences for User1 included no K operations compared with those for User2. This means that User1 used the mouse interface as the main interface. According to the table, the most frequent pattern for User1 was to perform sliding operations in the left-side panel (P(Target4)—B(Dragging)—P(Target4)). According to the 3DS MAX manual, these operations involve the scaling/transformation/rotation of boxes, which the users invoked to create a chair. They were the most basic tasks when making the box-style 3D chair by “Adding box-style modeling.” For User1, our system recommended the layout with the top menu and a modeling window closest to the optimal UI.
Repeated sequence patterns in the 3DS MAX experiment.
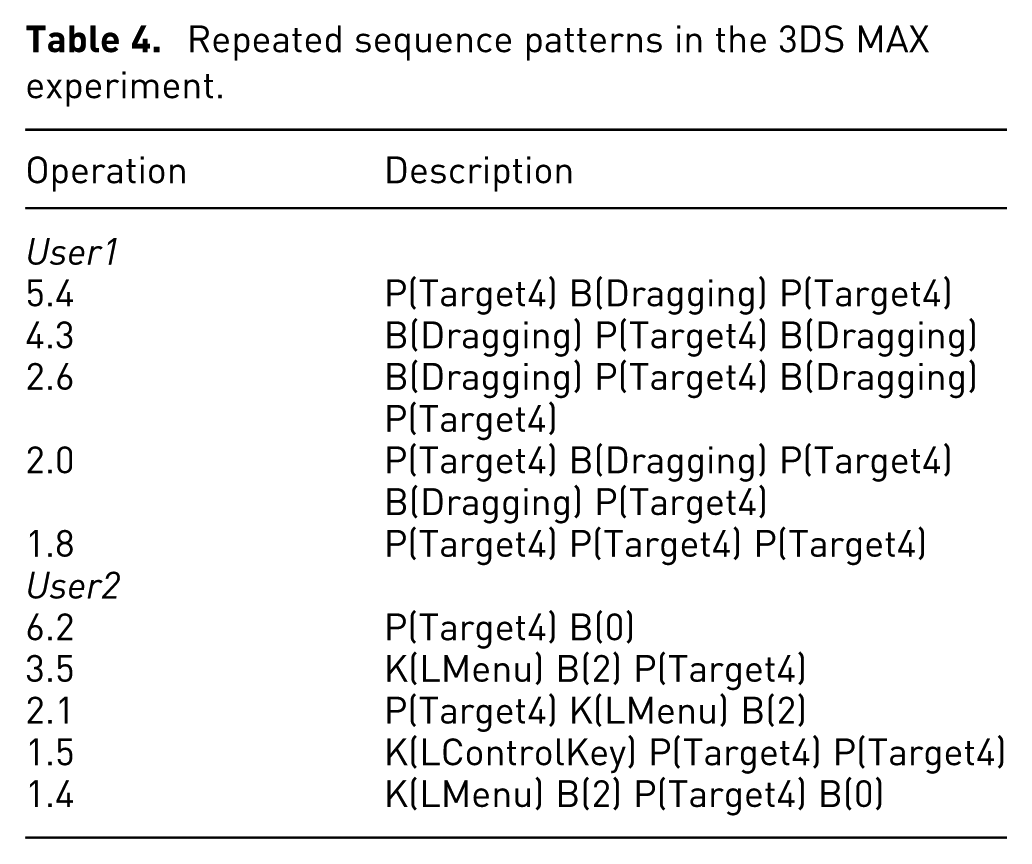
User2 showed some different UI sequences. In this user’s records, there was no B(Dragging). Instead, “K(LMenu)—B(2)” patterns were recorded. According to the 3DS MAX manual, a shortcut exists for converting a “Vertex selection area” into a “Polygon selection area.” Using this shortcut, User2 was able to simultaneously use the keyboard and the mouse as input interfaces. The 3D model was created not only by “Adding box style modeling” but also by “Polygonal editing,” which enabled vertexes to be freely selected in the editing window. This behavior was more frequent than using scaling/transformation/rotation operations. User2 performed much of the work in the main task window, interacting mainly with the left-side menu. Our system recommended the layout with a left-side menu and the modeling window closest to the optimal UI.
In the 3D MAX experiments, there was a notable difference in the adaptability of the test participants (from novice to 1 year of experience). This led to differences in using the keyboard shortcuts and the modeling style. Because the most frequent pattern involved scaling/transformation/rotation operations, our system suggested a layout with an optimal UI layout containing the main window and a top menu, but with no UI component on the left. Compared with the Photoshop experiment, the 3DS MAX experiment required more continuous UI interaction. However, the optimization efficiency decreased to 10%. This was because overall 3D modeling behaviors involve various unit behaviors (3D camera moving, vertex selecting, and dragging), which are fragmented compared with 2D painting behaviors (color selection and dragging).
The WOW experiment
Recent online games provide a variety of layout customizing options. Among them, MMORPGs such as WOW involve the most complex game systems. Players need to undergo long, repetitive UI interactions to take advantage of these systems, which in turn leads to high demand for optimized UIs. With the help of various plug-ins, players can place a UI component at a desired location in WOW, but it is very difficult to make a quantitative evaluation to help decide the optimal location for a player. The results of this study could be used effectively in such cases. To test this, an initial combat experiment was conducted. A total of 20 test participants were recruited who had at least 1 year’s experience. In this experiment, players attacked a target for 20 min with their favorite class of character. They concentrated on inflicting maximum damage using the sequential skills that their character usually uses. Because the mouse in a MMORPG trajectory is radially centered on the middle character, and UI components in WOW can be moved freely without grid-like UI alignment, we give more weight to angular optimization. This adjustment reduces the burden on the wrist caused by mouse rotation during game play. Figure 7 shows an example of the results. Here, the player’s class was “Druid” and the player’s favorite skills were “Normal Attack,”“Fear Skill,”“Normal Attack,”“Sleeping,” and “Healing.” The original skill icons were distributed across Panels 1, 2, and 6 by the default skill group. We assigned seven optimization target areas. The experimental results show that Panels 1, 2, and 4 were arranged in the bottom center, with Panels 6 and 7 being arranged at the left to reduce the sequential behavior cost. Compared with Photoshop and 3DS MAX, WOW required the most intensive sequential UI interactions in real time, with twice the number of KLM operations. In contrast to these other cases, the optimization efficiency was increased to a maximum of 16%.
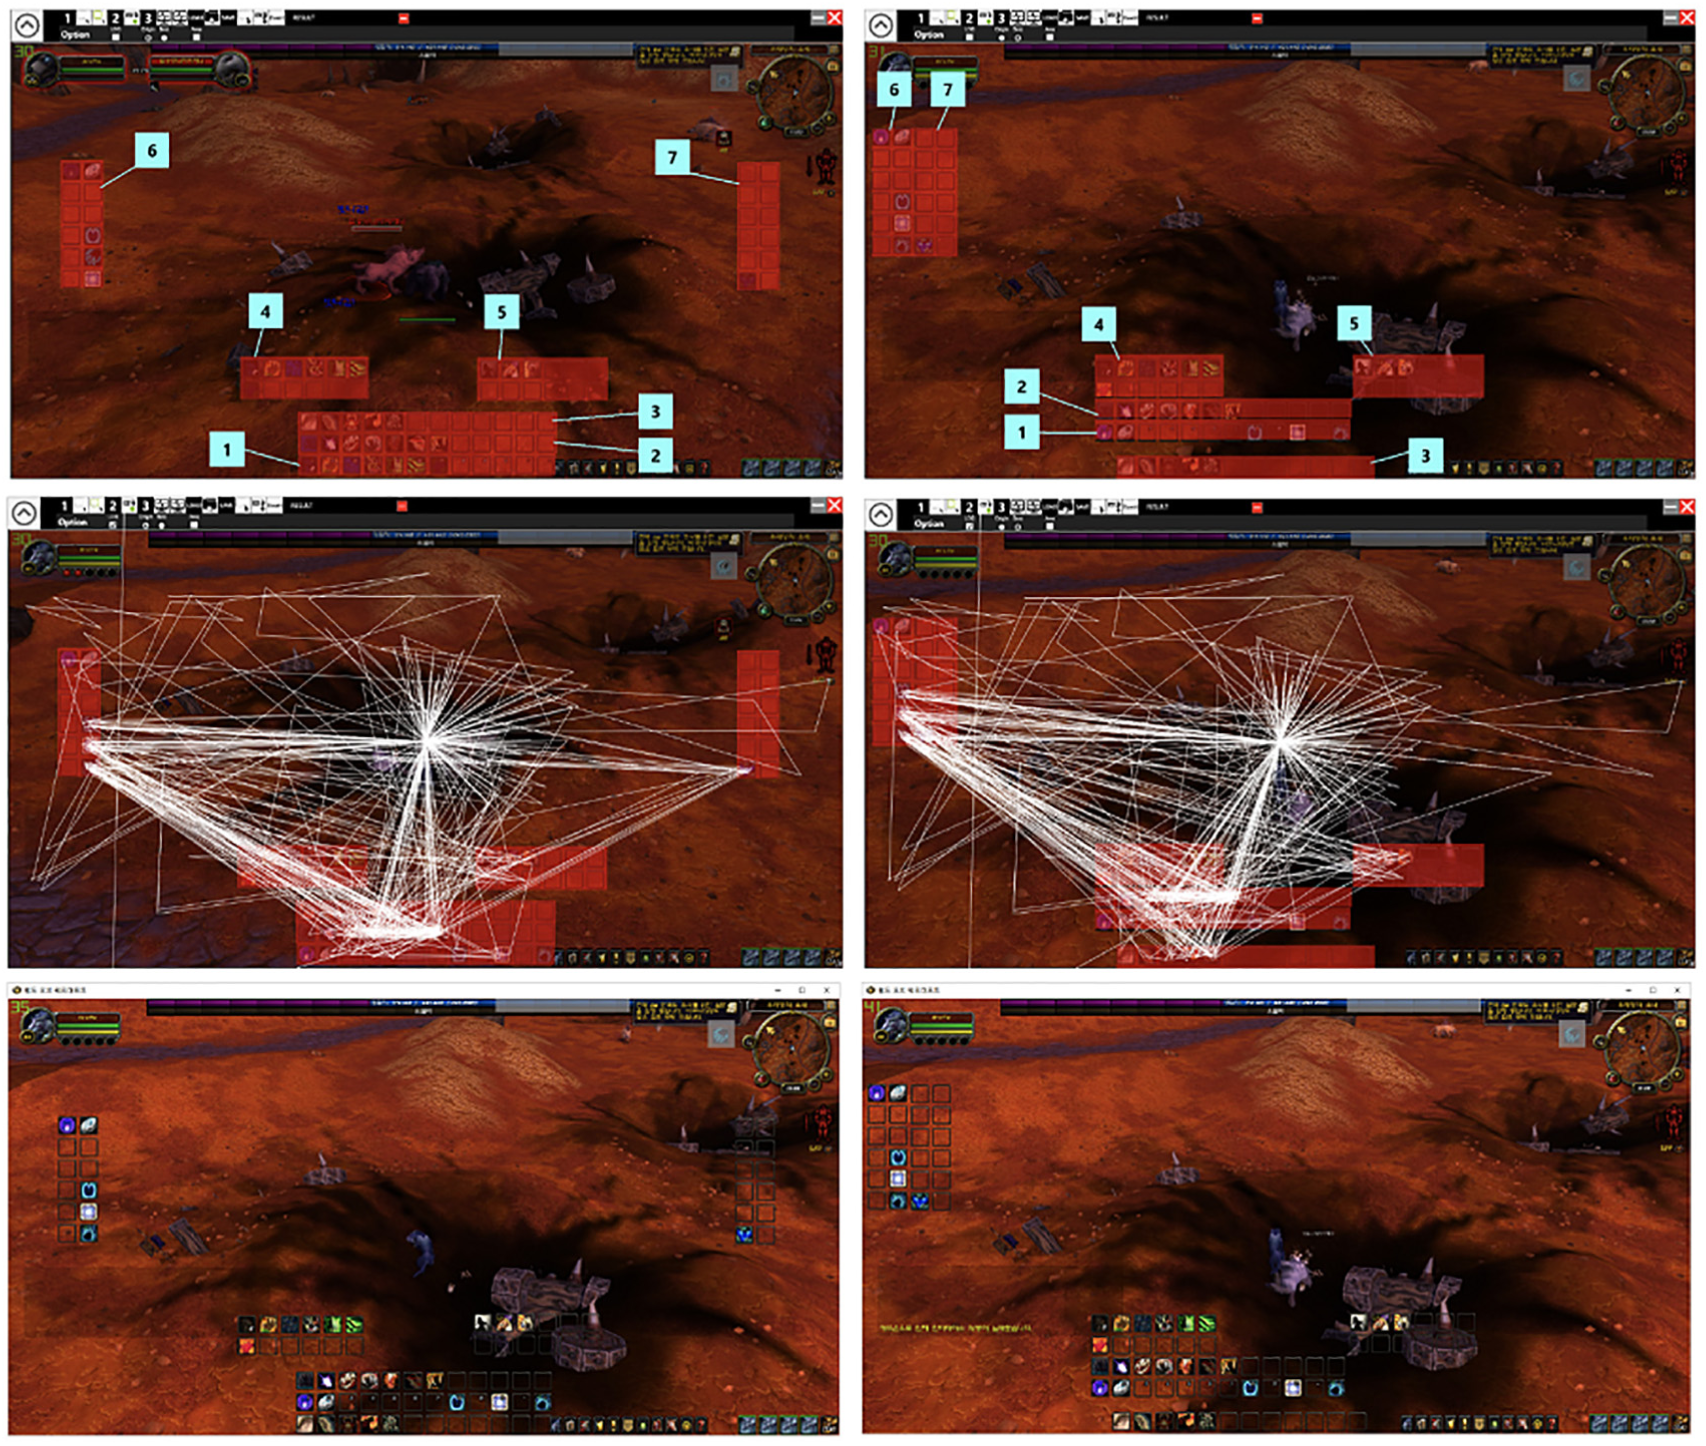
Initial WOW experiment results: original UI (left) and optimized UI (right).
In a second WOW experiment, we examined how the UI changed as the player adapted to the application over time. To investigate this, we recruited 10 WOW players and allowed them to play new classes they had not tried previously. We compared the system-suggested UI layout after 1 h and after 2 h of game play. Figure 8 shows an example of these changes. At the 1-h play stage, the player had not yet adapted to the chain combo skills of the new class, and the optimization efficiency was 6% when compared with the basic UI layout. We can also see that the UI layout proposed by the system was scattered and some UI components placed at the center were tending to obscure the characters. After 2 h, the player had become accustomed to the appropriate chain combo skills and the optimization efficiency increased to 9%. Note that the layout of UI components proposed by the system is aligned to the right and the centralized UI components no longer obscure the characters. This result shows that our system needs the adaptation of player to the application to achieve optimal results. It becomes more efficient as the player becomes accustomed to the application and its mouse-based interface.
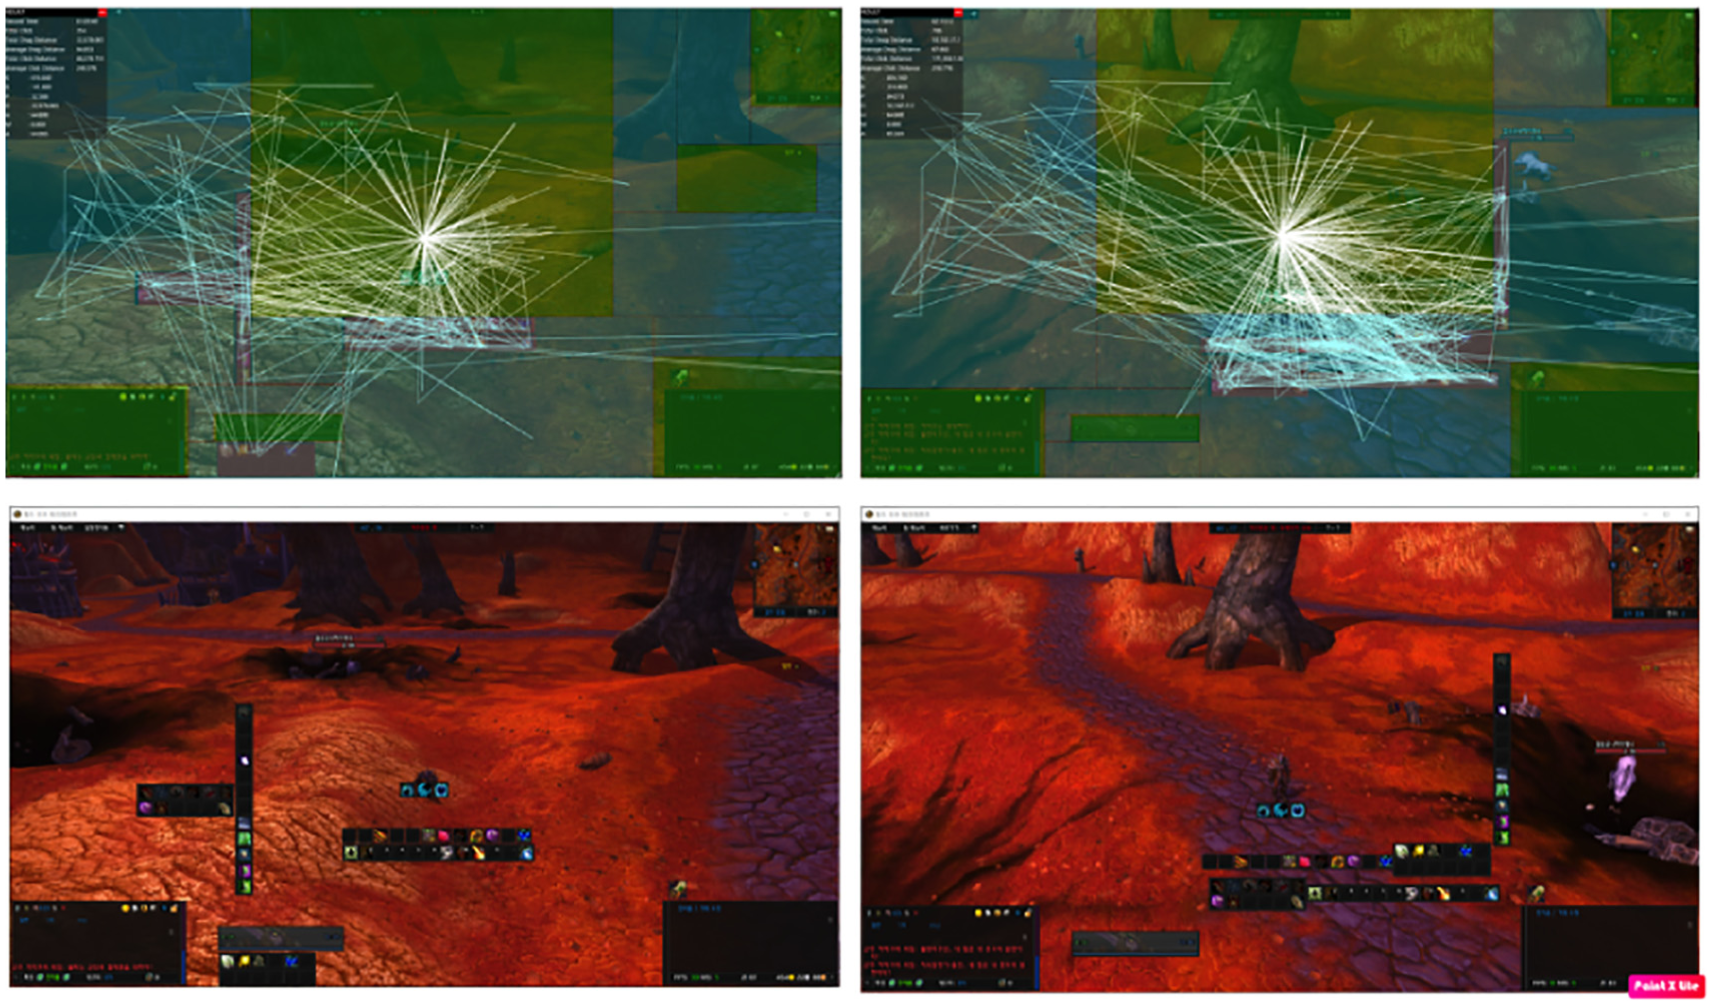
Changes in UI suggestions following player adaptation: UI for 1-h play (left) and UI for 2-h play (right).
Table 5 shows the average performance improvement achieved by the proposed system for the three experiments. For painting and modeling, the behaviors involved approximately 10,000–20,000 KLM operators and the MMORPG gaming behavior involved 30,000–45,000 KLM operators. The level of optimization varied from user to user. Overall, the number of KLM operations decreased on average by approximately 9%–14% for the Photoshop and 3DS MAX experiments and by 10%–18% for the WOW experiment. This is proportional to the average decrease in the mouse distance required for a mouse movement. The optimization rate found from the results of this study increased when the application required more sequential input and supported high-level freedom in UI component placement. Therefore, our research has shown significant effects for gaming interfaces that have flexible UI component placement options and require intensive repetitive inputs.
Optimization results.
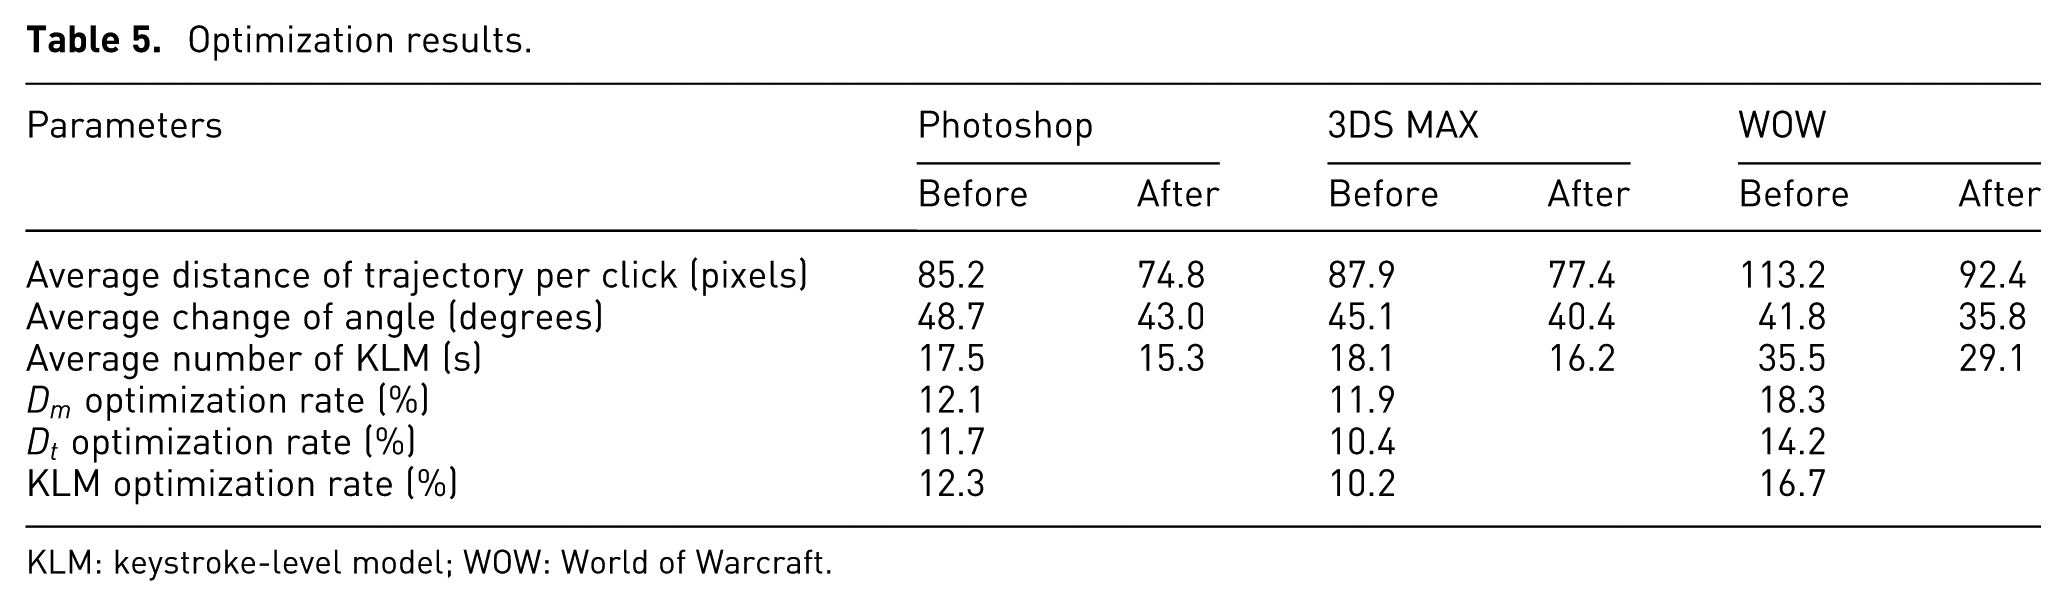
KLM: keystroke-level model; WOW: World of Warcraft.
Discussion
The proposed method needs improvement in some areas. First, our system depends on the positions and resolution of the UI components. If a user changes the component locations or resolution, the user must re-optimize the system. Because of this problem, the proposed method requires a screen setup process to be included. However, if the system were able to access internal UI components, this problem could be solved easily. Second, various factors can affect the proposed system. Among them, the UI area assignment is the most influential. If the area does not represent the features of the UI properties, the repetitive sequences cannot be identified. Third, our KLM model is calculated by approximating all P operations by a single average value based on Fitts’ law. For typical situations, this ranges from 0.8 to 1.5 s, with an average of 1.1 s. If great accuracy is not required, or if the movement distances or target sizes are not unusual, this average can be used instead of more precise times. There are many variables involved in calculating accurately the cost of P operations in real applications. For example, in Photoshop, it takes significant time to draw a picture, but it requires relatively little mouse movement. Our KLM model does not reflect these costs. For this reason, the Photoshop experiment in this article involved only simple pictures that could be drawn using a “bucket” style. However, to calculate accurately these behavioral values in the future, KLM’s P cost value could be further subdivided. Fourth, we assumed that users would gradually adapt to the application over time. Some users may use keyboard shortcuts during the adaptation period. In these cases, a P operation (average 1.1 s) plus a B operation (average 0.1 s) can be replaced by a single K operation (average 0.28 s.) In this study, the optimization was performed mainly with respect to mouse behavior and efficiency may be lowered if the user adapts to using the keyboard. For keyboard-centric optimization, we should adopt a methodology that optimizes the distance between keyboard buttons. We will investigate this topic in future work.
Conclusion
In this article, we have proposed a GA-based UI layout optimization technique based on KLM. The proposed method can detect frequently repeated sequences with the Apriori algorithm and optimizes UI component placement using the GA and MR algorithms. Its effectiveness was shown through experiments involving actual commercial applications. Our experiments demonstrated that the proposed system is suited to applications requiring highly sequential UI behaviors. Our system receives user events in real time through event hooking–based tools that are independent of the application execution. Using this approach, it is possible to suggest an optimized UI for each individual application. Our system can be utilized as a client-oriented tool for commercial application users or an in-house tool for evaluating UI efficiency, where the results suggest adjustments to the layout of buttons, layers, and icons. The approach of using the UI sequence data is essentially content independent. The proposed method therefore has potential for expansion to a variety of application domains.
Footnotes
Funding
The author(s) disclosed receipt of the following financial support for the research, authorship, and/or publication of this article: This research was supported by the Basic Science Research Program through the National Research Foundation of Korea (NRF) funded by the Ministry of Science, ICT & Future Planning (NRF-2017R1A2B2005380, 2017R1D1A1B03035576, NRF-2015R1A1A1A05001196).