
Abstract
Many impactful personal decisions are made by individuals with little or no prior experience in decision making who must nevertheless navigate choices that are high stakes and complex. Unlike contexts where decision makers are experienced professionals, these individuals face unfamiliar situations in which they must weigh numerous trade-offs and preferences without clear guidance or prior knowledge. To investigate how multi-criteria decision making (MCDM) visualizations can support such individuals, we conducted two exploratory design studies: one with students making their first borrowing decisions and another with job seekers who had limited experience navigating the job market. Across both studies, participants initially focused narrowly on immediate, easily quantifiable aspects such as monthly repayment ability or yes/no filters on job attributes, while overlooking long-term consequences and more nuanced qualitative trade-offs. Our studies revealed several unstructured aspects of decision making in practice, including unclear preference hierarchies, difficulties in incorporating categorical and temporal criteria, and reliance on improvised datasets. Visualization probes encouraged participants to compare alternatives more systematically, surfacing neglected criteria and prompting more reflective reasoning. Together, these findings illustrate that personal, high-stakes decisions made in real-world contexts by individuals with limited prior experience challenge the fixed-data assumptions of MCDM and highlight new directions for visualization research. Supplementary materials are available at https://osf.io/9eu7x/overview?view_only=cc4d629e8e184e19ba08e4709e265d56 .
Keywords
Introduction
Multi-criteria decision making (MCDM) has long motivated visualization research, 1 yielding tools and encodings that help people evaluate alternatives against multiple criteria (e.g. ValueCharts, 2 LineUp, 3 and related systems4–8). In these systems, datasets are typically fixed, criteria are formalized as numeric attributes, and preferences are assumed to be known or easily elicited (e.g. via weight sliders2,3,9 or sorting-inferred weights 8 ). This paradigm has proven effective in domains with clearly specified objectives and structured data, such as flood risk planning, 10 evacuation planning, 11 and epidemic response. 12
Beyond fixed pipelines, visualization research also acknowledges that expert knowledge must guide or complement decision tools. Several systems are explicitly designed for decision makers with strong domain expertise (e.g. fisheries management, 13 urban planning, 14 transportation 15 ) and often integrate expert workflows and constraints. These expert-oriented tools demonstrate how integrating knowledge, assumptions, and scenarios can improve decision quality in well-scoped settings.
Yet many real-world decisions “in the wild” are personal, complex, and high-stakes. Such problems are messy and unstructured, and preferences are uncertain or constructed on the fly.16–18 In these contexts, individuals typically cannot rely on strong prior experience or domain knowledge, nor do they benefit from recommendations tuned to expert workflows. While visualization research increasingly explores everyday data use, 19 recent surveys argue that decision-focused visualization remains limited in scope and often mismatched to non-expert needs, relying on fixed, predefined datasets that make it difficult to integrate users’ own knowledge and data.1,20
In this paper, we investigate the needs of non-expert individuals who face consequential personal decisions that cannot be fully formalized yet can be informed by data. We focus on two such cases, student loan borrowing and job seeking, as both are common situations where prior experience offers limited guidance. These contexts allow us to work with accessible participant groups and with decisions that have clearly defined stakes and complexity arising from the interplay of quantitative and qualitative factors, uncertainty, and long-term consequences.
Across the two studies, we use visualization probes—designed to prompt reflection and surface requirements rather than serve as deployable systems—to expose both matches and mismatches between current MCDM tools and the realities of personal decision making. Our contributions are:
Two empirical studies exploring decision making needs in student loan borrowing and job seeking, domains largely overlooked in visualization research.
Two visualization probes designed to reveal (i) how quantitative and qualitative criteria shape personal MCDM in the job-seeking context, and (ii) how uncertainty and long-term consequences shape personal MCDM in the student-loan context.
Cross-domain insights outlining opportunities and design considerations for supporting personal, in-the-wild decision tasks with visualization.
In both domains, decision makers appeared to start with fuzzy goals and refine them over time as they learned from public sources, peers, and acquaintances. The domain also seemed to influence how they proceeded. For example, student loan borrowers often ran simple what-if checks on variables they could control (e.g. monthly payment, repayment term) and compared alternatives side by side, whereas job seekers more often eliminated options step by step until they arrived at a choice.
Background and related work
Decision making is studied across several fields. Classical economic models characterize choices as consistent and utility maximizing, 21 whereas behavioral economics documents systematic departures from these assumptions, shaped by biases, framing, and limited cognitive resources, summarized by bounded rationality.22,23 In practice, preferences are often constructed under time and knowledge limits 16 : people satisfice, 24 eliminate by aspects, 25 adapt strategies to task demands, 16 and rely on fast-and-frugal rules. 26 By contrast, multi-criteria decision analysis (MCDA) provides a more formalized, model-based way to support decisions: it guides decision makers to specify criteria and importance weights, normalize measures, and combine them using transparent rules, commonly via additive value models, 21 pairwise comparison weighting (AHP), 27 ideal point proximity (TOPSIS), 28 and pruning through dominance (Pareto/skyline) to discard clearly inferior options. 29
The visualization field has also examined how design choices influence decision making under uncertainty,30–32 documented cognitive and perceptual biases, 33 and proposed ways to mitigate them through visual representations 34 and interaction strategies. 35 Beyond empirical studies, several visualization tools have been designed to support MCDM.2,3,5–10,13,15,36 These tools implement methods such as weighted sums,2,3 AHP, 36 and Pareto/skyline-based selection. 9 Weighted-sum scoring is especially prevalent in interactive tabular views where criteria are columns and alternatives are rows; stacked, colored bars encode criterion-specific contributions and bar lengths encode values. 3 Weights are obtained either directly from users or inferred from interactions such as sorting. 8 Some tools go beyond simple weighting and enable what-if analysis through explicit exploration of weight space.7,13
Despite these advances, recent reviews note that decision-focused visualization tools remain relatively few and narrow in scope, 1 and that existing systems often fail to meet decision makers’ needs, particularly the integration of users’ own knowledge and data, because many tools rely on fixed, predefined datasets. 20 Moreover, most such tools target domain experts (e.g. fisheries, 13 urban planning, 14 flood management, 10 traffic planning 15 ). Yet many real-world decisions faced by laypeople are personal and complex and often cannot follow formal MCDA prescriptions because problems are messy, 16 unstructured, and involve uncertain or constructed preferences.17,18 While visualization research has explored design alternatives for everyday data analysis, 19 everyday decision making remains comparatively underexplored.1,20
In this paper we investigate the needs of non-expert individuals who face consequential personal decisions that are not fully formalizable yet can be informed by data. We focus on two underexplored use cases—student-loan and job-seeking decisions—to surface requirements and gaps in current decision-support tools.
Student loans
Domain characterization: US students are expected to graduate with an average federal debt of $37,853 in 2025. 37 Comparable levels appear in other countries, with UK students owing around £50,000. 38 Even in countries such as the Netherlands, where tuition fees are lower, total student debt nearly doubled in a decade, from €12.7 billion in 2015 to €26.6 billion in 2022. 39 Loan debt strongly affects students’ lives, disproportionately impacting vulnerable populations40; even 20 years after entering higher education, about half of US borrowers still owe at least $20,000 each. 37 Beyond rising tuition fees and structural features of loan systems, research highlights a pattern of overborrowing as a further driver of debt accumulation.40,41
Student-loan decisions intertwine long-term financial commitments with evolving personal circumstances41,42 (e.g. study completion, employment prospects, and income volatility). Repayment options (fixed vs income-contingent), grace periods, interest accrual, and refinancing rules impose path-dependent outcomes that are difficult to compare without specialized knowledge. Beyond monetary trade-offs, borrowers must handle uncertainty about future earnings, geographic mobility, and emotional factors like debt aversion. 43 Non-visualization research reports limited financial literacy among first-time borrowers, 44 difficulties interpreting repayment schedules and interest accrual, 45 and the need to reason across multiple scenarios22,46 (e.g. graduation delays, part-time work, early repayments).
Existing tools: Students facing such critical early-career financial decisions typically lack access to professional advisors and instead rely on online calculators provided by governments47,48 or private companies.49–51 These platforms use basic charts to communicate limited aspects of their data, and there is no evidence of their effectiveness in supporting decision making. A small body of applied and educational work incorporates visual representations to explain loan structures, most commonly by making amortization schedules and repayment breakdowns more legible. For example, Vidermanova and Melusova 52 present a visualization of mortgage repayment schedules to support students’ understanding of how loans evolve over time. While such approaches clarify repayment mechanics, they are primarily designed as instructional aids centered on a single predefined loan scenario rather than supporting decision making among multiple borrower-generated alternatives under uncertainty (e.g. interest rate changes, policy rules, and long-term trade-offs).
In contrast, visualization research has introduced tools to support exploration of financial data, 53 with documented evidence of effectiveness.54–58 Most are designed for financial investments, targeting either expert analysts interested in market trends and factor analysis59–61 or non-experts managing personal portfolios.55,56 Among tools addressing personal investment management, several focus on retirement savings using simpler visualizations, evaluated through controlled experiments 57 or qualitative interviews documenting user experiences with pension systems. 62 Uncertainty and risk communication are central to financial decision making, 57 and research suggests simpler charts can be advantageous when communicating complex topics.63,64
However, insights from visual communication studies are not always transferable across tasks, users, or contexts. Improving judgment accuracy for specific factors, such as risk probabilities or interest rate evolution, may enhance comprehension but does not necessarily lead to better decisions.30,65,66 Although loan decision making shares characteristics with prior visualization work in personal19,67 and multi-criteria settings, 1 including the management of uncertainty 57 and financial data, 53 it also involves distinct features such as structured repayment schemes, long-term debt commitments, career expectations, emotional considerations, and the literacy required to interpret contractual conditions. Loan data visualization has been examined in enterprise risk management contexts, 68 but has not been extended to everyday borrowers managing personal debt. As a result, it remains unclear how students, and borrowers more broadly, make loan decisions, a necessary foundation for designing effective visualization support.
Job seeking
Domain characterization: The job-seeking process has evolved significantly with the rise of digital platforms. 69 Over 79% of job seekers now rely on online services such as LinkedIn and Glassdoor, including job boards, social media, and professional networking sites.70,71 Despite offering access to a vast number of opportunities, these platforms typically lack visualization support, even though they present complex information such as salary ranges, company sizes, number of openings, posting dates, response times, and geographic locations. Candidates often struggle to navigate this high volume of noisy and unstructured data, as reflected in job advertisements. 72
Existing tools: Mainstream job platforms (e.g. LinkedIn, Glassdoor) rarely provide visualization support and are largely limited to filters and lists. Consequently, research prototypes have explored visualization for job-related data, including job market analysis and job seeker–position matching. For example, Wang et al. present a skill-driven visual exploration approach for job advertisements (“JobViz”) to analyze skill requirements and patterns in job posts. 73 Si et al. propose an interpretable visualization method for multidimensional matching between job seekers and positions. 74 Zhu et al. 75 introduce a visual analytics system for recruitment data, supporting organizational-level inspection of candidate pools, job requirements, and matching structures. While these systems demonstrate that recruitment data and job–candidate relationships can be made interpretable, they largely frame job seeking as a problem of skill analysis and market structure. Accordingly, they emphasize structural relationships in recruitment data rather than supporting individuals’ broader decision making processes involving heterogeneous criteria, personal preferences, contextual constraints (e.g. personal circumstances, visa requirements), and evolving priorities.
Nevertheless, job seeking can be framed as a decision making task 30 that may benefit from multi-criteria decision making (MCDM) visualizations, which provide diverse approaches for exploring alternatives across multiple criteria of varying complexity (see 1 ). Such systems employ visual encodings including parallel coordinates 76 and hierarchical treemaps, 77 tailoring representations to domain-specific data. 12 General-purpose MCDM tools most commonly adopt a tabular layout combining per-criterion bars with aggregated score displays, often via stacked bar charts. This design, exemplified by ValueCharts 2 and LineUp, 3 has inspired numerous subsequent systems (e.g.,4–8,15). In these tools, decision makers express preferences by adjusting criterion weights, which determine aggregate scores. However, such approaches are primarily designed for structured quantitative data and assume experienced users. As a result, they offer limited support at early stages of forming decision strategies in complex, understudied domains such as job seeking or student loan borrowing.
Cross-domain takeaways
Across both domains, individuals making occasional rather than habitual decisions remain poorly supported. Existing popular tools—such as non-interactive job platforms (e.g. LinkedIn) and online loan calculators47–51—provide only partial assistance throughout the decision-making process. They offer limited interactivity, rely on fixed datasets, and fail to reflect users’ evolving preferences or contextual knowledge.78,79 At the same time, visualization research has advanced financial and MCDM tools, but mainly for experts and structured data contexts. This gap motivates our investigation into how visualization can better support personal, real-world decisions made by non-expert individuals, where data, preferences, and decision processes are fluid and not yet well understood.
Methodological approach
We investigate how visualization can support individuals with limited prior experience in consequential multi-criteria decision making (MCDM). We report a two-case exploratory design study on student loan planning and job seeking to examine how people articulate criteria, compare alternatives, and form preferences when supported by visualization.
The study follows principles of formative, problem-oriented visualization research.80,81 The two-case structure increases diversity of perspectives and enables triangulation across settings, aligning with the abundance and plausibility criteria proposed by Meyer and Dykes, 81 and reducing the risk of overfitting findings to a single domain. 82 The domains were selected for their personal relevance, allowing participants to reflect on real decisions rather than hypothetical tasks. They share core characteristics, including real-world stakes, multiple criteria, and infrequent but consequential personal choices, while differing in structure and context. Loan planning is largely quantitative and policy-constrained, involving computational and longitudinal parameters, whereas job seeking is more subjective and qualitative, relying on user-assembled information from external sources.
Each use case follows a two-phase structure. Phase 1 consists of semi-structured critical-incident 83 interviews to capture current practices, criteria, tools, and challenges. Phase 2 introduces visualization probes used as elicitation instruments rather than finalized systems, 84 enabling observation of visualization-relevant reasoning and preference formation through think-aloud reflection and task prompts. The probes employ a common tabular comparison format, widely used in decision making,20,85 supporting side-by-side comparison of alternatives and criteria with simple interactions for sorting, filtering, and scoring to externalize priorities and inspect trade-offs. Both phases were recorded, transcribed, and inductively coded.
Phase 2 differs across domains based on insights from Phase 1 and domain-specific requirements. In the student-loan study, the probe, together with its numeric inputs (e.g. income, expenses, amount, duration), included features for longitudinal trajectories and policy-change simulations (e.g. interest rates), as well as structured personalization through parameter forms. The analysis therefore focused on participants’ perception of trade-offs and their ability to justify plan logic, drawing on insight-based 86 and self-efficacy 87 measures. In the job-seeking study, Phase 1 revealed the need for participants to co-create datasets, 88 increase personalization, and handle categorical variables. We therefore extended the tabular probe with non-equidistant scoring89,90 and a more flexible personalization and goal-setting interface than in the loan study. The analysis focused on user experience in articulating preferences and handling mixed-type criteria.
We first report Phase 1 findings for student loans (Section Student loans: Interview study) and job seeking (Section Job seeking: Interview study). We then synthesize these findings, together with the domain constraints described under Domain characterization (Sections Student loans and Job seeking), into consolidated design requirements (Rs) and visualization goals (Gs) in Section Synthesizing design requirements and visualization goals and Table 1. Next, we introduce the two visualization probes (Section Visualization probes) and report the corresponding Phase 2 studies for student loans (Section Student loans: Visualization study) and job seeking (Section Job seeking: Visualization study), concluding with cross-domain implications.
Traceability from phase 1 insights to design requirements (Rs), grouped into three visualization goals, and mapped to probe components.
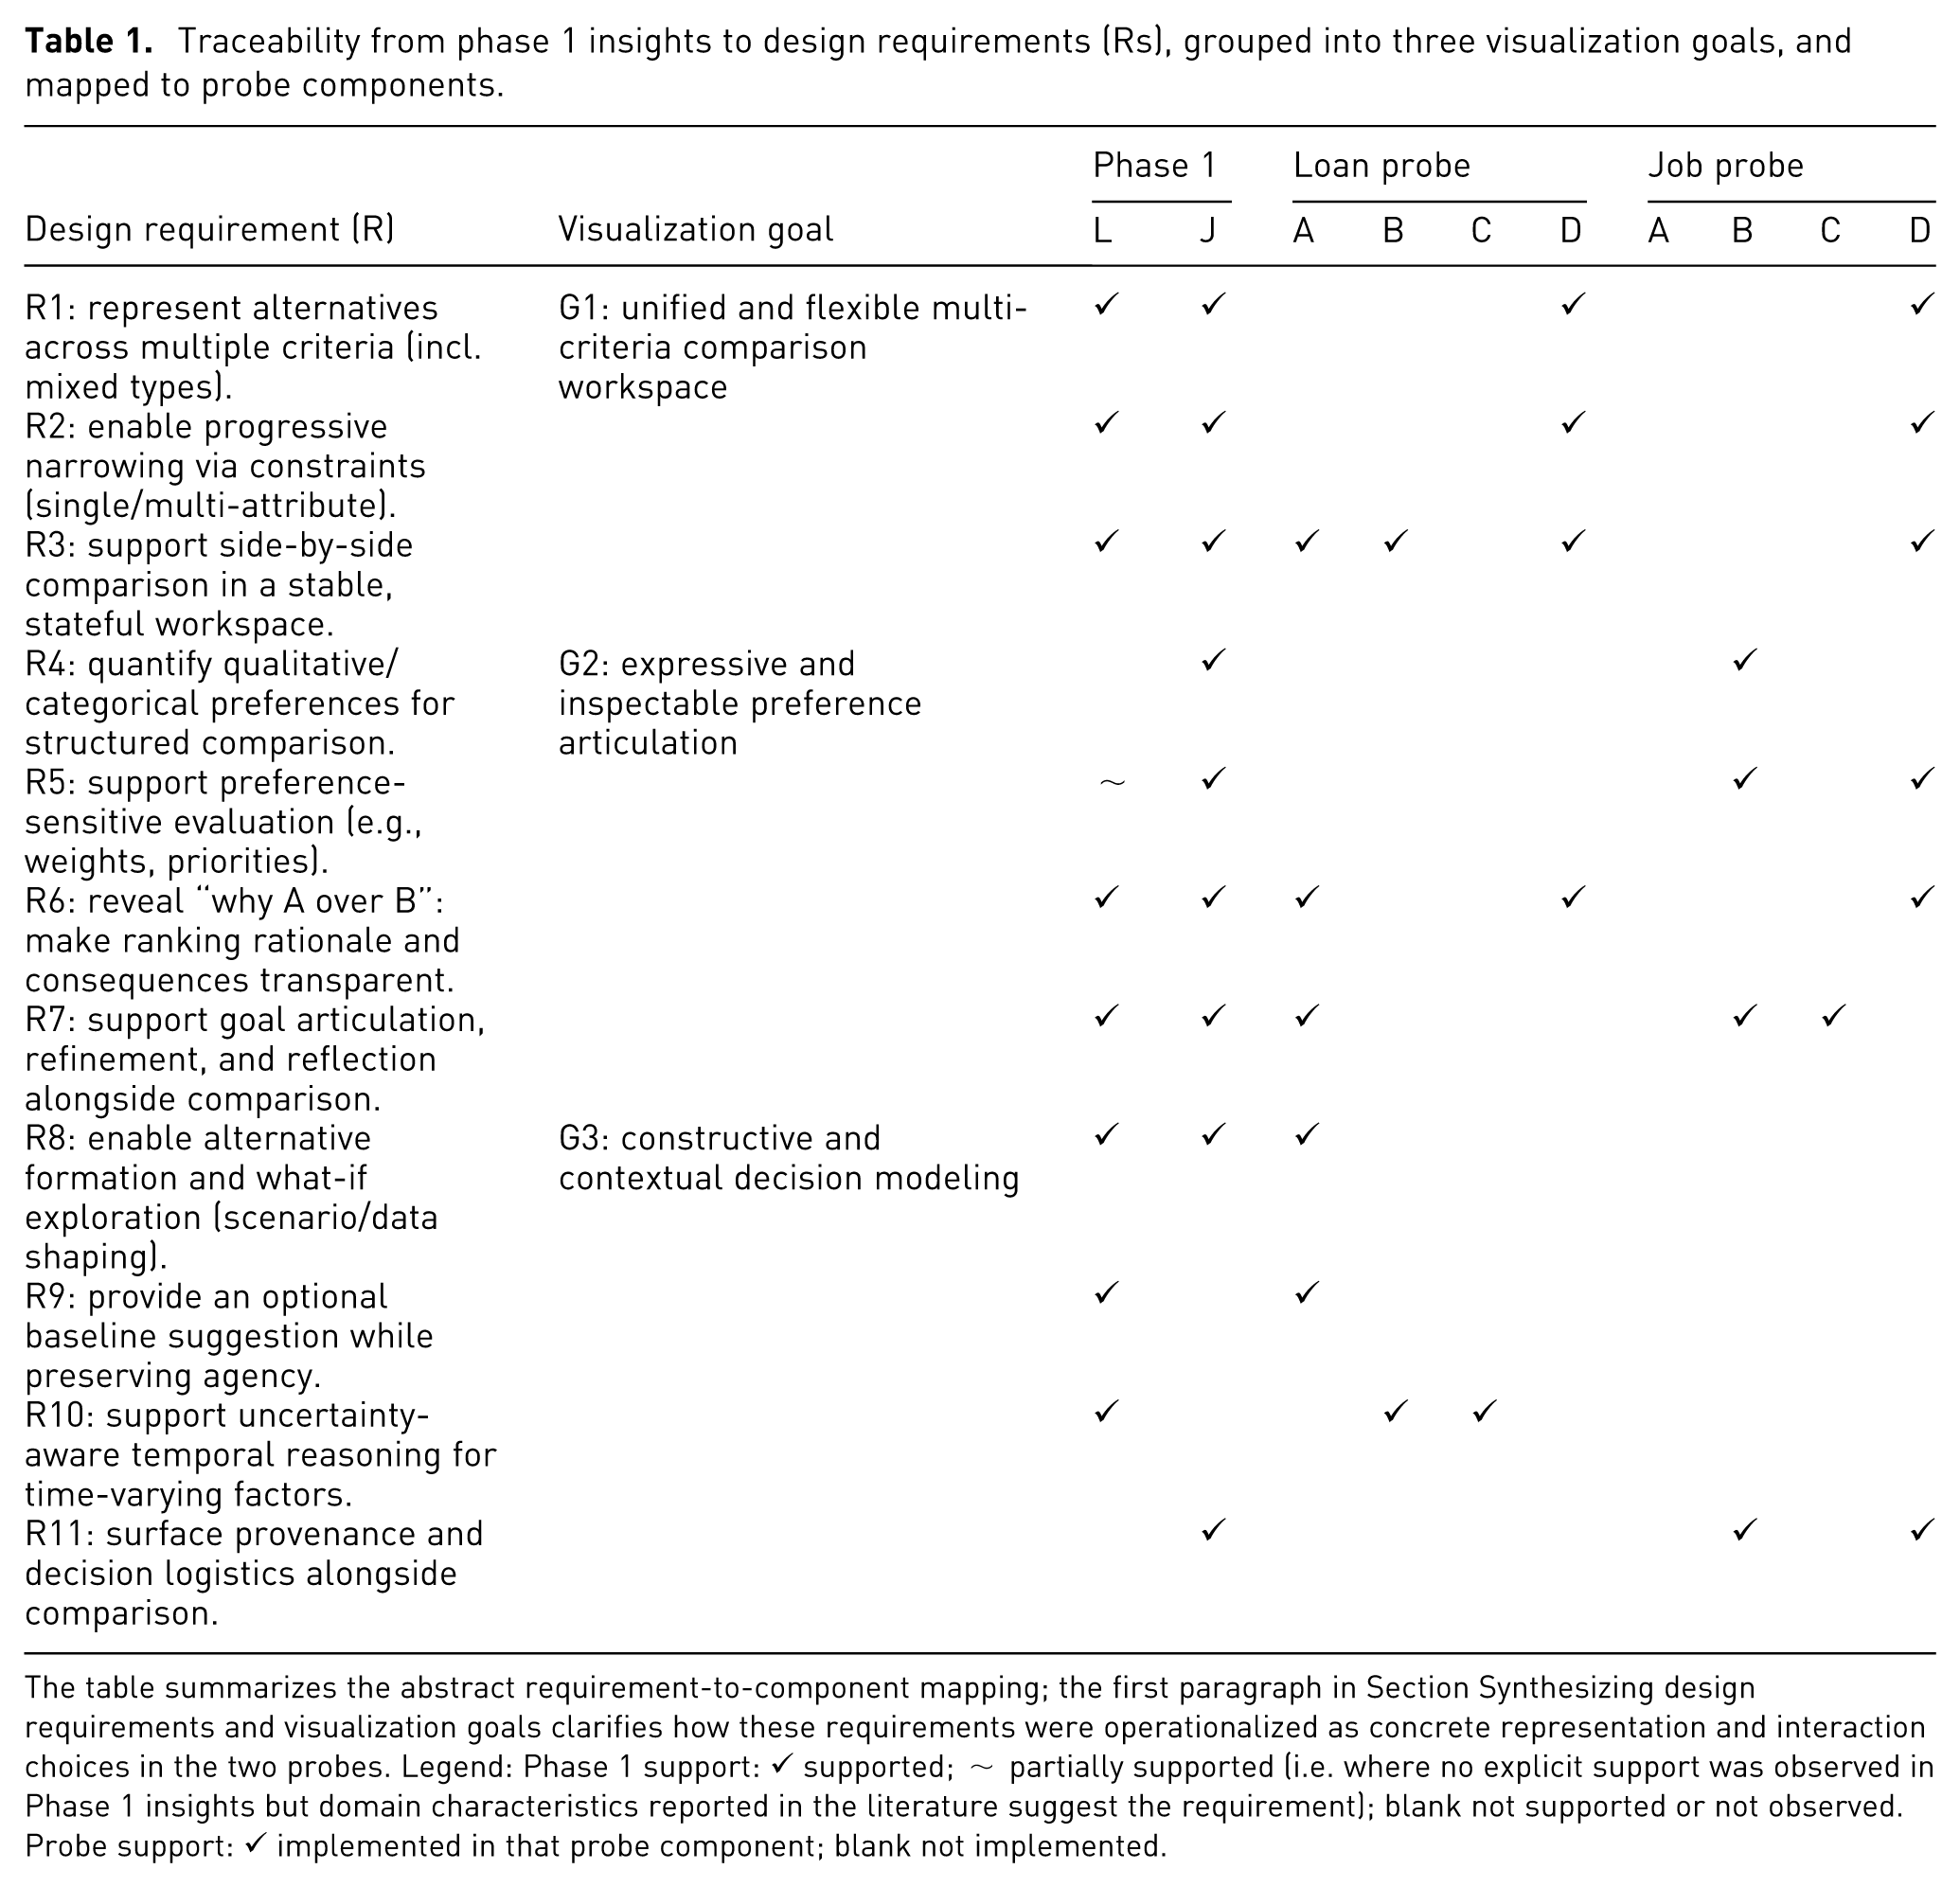
The table summarizes the abstract requirement-to-component mapping; the first paragraph in Section Synthesizing design requirements and visualization goals clarifies how these requirements were operationalized as concrete representation and interaction choices in the two probes. Legend: Phase 1 support: ✓ supported;
Phase 1: Current decision-making practices
Phase 1 established a baseline understanding of how participants currently approach early-career decisions before introducing visualization probes. In both domains, we focused on participants’ existing practices, the criteria they considered, the tools and resources they relied on, and the difficulties they encountered. The goal of this phase was to identify decision making challenges and visualization-relevant requirements grounded in current practice, as discussed in Section Methodological approach. We first report the student-loan interview study, followed by the job-seeking interview study, and then synthesize their findings into design requirements and visualization goals (see Section Synthesizing design requirements and visualization goals and Table 1).
Student loans: Interview study
Our first case examines decision making on student loans. We conducted an interview study with students who were considering or had recently made borrowing decisions. The goal was to understand how individuals at an early stage of forming decision making strategies approach this process, what criteria they take into account, what challenges they encounter, and what tools they currently use, in order to identify opportunities for visualization support that could better assist student loan decision making.
Participants: We recruited 12 young students or recent graduates (6 female, 6 male), aged 20–25, through convenience sampling supplemented by snowballing until thematic saturation was reached. 91 Nine participants were pursuing Master’s degrees and actively using student loans, while three had recently started working and were about to begin repayment, reflecting our aim to involve real decision makers and capture the realities of occasional rather than habitual financial decisions. According to the authors’ institutional ethics review procedure, all studies reported in this paper were classified as low-risk and did not require a full ethics or privacy assessment.
Interview method and procedure: We used the critical incident technique, 83 asking participants to recall the moment they determined the amount of their student loan. This was followed by semi-structured questions exploring their decision-making processes in greater detail. Participants were asked to describe the tools they used, their effectiveness, the key information they sought, the adequacy of its presentation, any frustrations they experienced, and their overall satisfaction with and desires for improvements in available loan support tools. Interviews were conducted in person after obtaining informed consent, each lasting approximately 15 min. The full interview protocol is available at the OSF link in the abstract.
Interview analysis and results: All interviews were audio recorded and transcribed. The transcripts were analyzed using inductive coding through qualitative content analysis. 92 One author identified themes relating to students’ loan decision making processes, existing tool usage, and expectations for visualization design, which were later reviewed and confirmed by another author. Key findings from this analysis are summarized below.
Component key
Loan probe: (A) Input Widget, (B) Repayment Chart, (C) Interest Explorer, (D) Loan Comparison Table. Job probe: (A) Profile Widget, (B) Attribute Scoring Widget, (C) Attribute Details View, (D) Job Comparison Table.
Participants also reported difficulty understanding dense textual financial information and expressed a strong preference for visuals. As P1 suggested, “Not too much text, any difficult finance concept need to be explained, perhaps some explanation pictures or video.” (R6). They requested dashboards that synthesize key aspects of their financial situation, that is, debt accumulation over time, interest rate effects, monthly repayment, and final debt obligations (R1).
Ten of 12 participants emphasized the need to compare the effects of changing interest rates (R3, R10). For instance, P4 commented, “Also something about how different interest rates impact your loan. Like, if the interest rate increases even further next year, how much will that cost me?” (R6). Several participants also suggested adding context about plausible interest rate ranges (R9). As P3 noted, “Maybe something about how probable certain interest rates are because if you don’t know the normal interest rates, you can’t really make a meaningful comparison between different interest rates.”
Overall, participants envisioned a tool that accepts monthly inputs/outputs (R8), supports comparison across multiple options (R1, R3), and visualizes the impact of interest-rate changes on long-term outcomes (R10).
Job seeking: Interview study
Our second case examines decision making on job seeking. We conducted an interview study with job seekers who were actively searching for jobs or had recently done so. The goal was to understand how individuals at an early stage of forming decision making strategies approach this process, what criteria they consider, what challenges they encounter, and what tools they currently use, in order to identify opportunities for visualization to better support job-seeking decisions.
Participants: We recruited six participants (four female, two male), aged 25–54, through convenience sampling until thematic saturation was reached 91 ; two held bachelor’s and four held master’s degrees. The sample included recent graduates entering the job market for the first time, unemployed individuals re-entering the workforce, and young employed participants, all actively seeking employment, reflecting our aim to involve real decision makers and capture the diverse realities of occasional rather than habitual job-seeking decisions.
Interview method and procedure: Similar to the student loan study, we used the critical incident technique, 83 asking participants to recall a time when they were actively searching for a new job, particularly a moment when they felt lost during the process. Additional semi-structured questions explored their decision making in greater depth, including the job-search context, the quantitative and qualitative factors considered, the tools or resources used, their effectiveness and satisfaction, and desired future support or functionality. Interviews lasted 45–60 min and were longer but fewer than in the loan study, likely reflecting the broader and more personal nature of job-seeking discussions. Participants often provided extensive context about aspirations and prior experiences, resulting in richer narratives that nonetheless appeared to reach saturation relatively quickly, as contextual variation did not substantially alter the main observations. We also acknowledge that, beyond domain-related factors, perceived richness and saturation may have been influenced by differences in interviewer style and interpretation, as the job-seeking interviews were conducted by a different author. This variation aligns with reflexive qualitative practice, 81 which recognizes researcher perspectives and contextual interactions as integral to interpretive validity rather than biases to be eliminated.
Interview analysis and findings: All interviews were audio recorded, transcribed, and analyzed using inductive qualitative content analysis, 92 following the same procedure described in the student loan study (Phase 1). Key findings are summarized below.
Synthesizing design requirements and visualization goals
To make the connection between Phase 1 findings and probe design explicit without committing to domain-specific implementations, we structure the synthesis as a progression from concrete observations to abstract requirements and goals, followed by re-concretization in domain-specific probes. We distinguish four levels: (i) descriptive, domain-specific Phase 1 insights (reported in Student loans: Interview study and Job seeking: Interview study); (ii) normative, domain-agnostic design requirements (R; see Table 1); (iii) technical, domain-agnostic visualization goals (G; see Table 1); and (iv) domain-specific probes described in Probe for student-loan decisions and Probe for job-seeking decisions, which instantiate the abstract goals through concrete interface components.
The design requirements are grounded in two complementary sources: empirical observations from the Phase 1 interviews (see the corresponding interview sections) and structural characteristics of the respective domains (see Domain characterization under Student loans and Job seeking). Some requirements stem directly from participants’ expressed needs (e.g. side-by-side comparison, priority adjustment, scenario exploration). Others arise from observed mismatches between current decision practices and structural demands of the domains (e.g. long-term, interest-sensitive consequences in student loans or evolving elimination strategies in job seeking). We therefore treat the requirements as analytic abstractions synthesizing lived practice and domain constraints rather than verbatim feature requests.
We group the design requirements into three higher-level visualization goals reflecting recurring dimensions of decision support across both domains: (G1) unified and flexible multi-criteria comparison workspace, (G2) expressive and inspectable preference articulation, and (G3) constructive and contextual decision modeling (see Table 1).
Visualization probes
The following visualization probes are instantiations of the design requirements (Rs) and visualization goals (Gs) synthesized from Phase 1 insights and domain characteristics (see Table 1). Requirements under G1 were operationalized as persistent comparison workspaces with alternatives as rows and criteria as sortable, filterable, and inspectable columns. Requirements under G2 were operationalized through mechanisms for explicit preference articulation and ranking rationale, including weighted aggregation, visible criterion-level contributions, and non-equidistant scoring for categorical attributes in the job-seeking probe. Requirements under G3 were operationalized through functionality for constructing, reshaping, or contextualizing the decision space, including loan-plan creation, repayment trajectories, historical interest-rate exploration, job-search goal statements, and criterion-specific notes. Next, we describe the probes, which serve as elicitation instruments in Phase 2 to examine how non-expert decision makers compare alternatives, articulate preferences, and reason about consequences using structured visualization support.
Probe for student-loan decisions
We introduced a visualization probe (Figure 1) to operationalize the requirements identified for the loan domain, particularly long-horizon reasoning, alternative construction, and transparent comparison of financial consequences. The probe supports iterative what-if exploration of repayment plans while making temporal trajectories, interest sensitivity, and trade-offs between monthly and total costs directly inspectable.
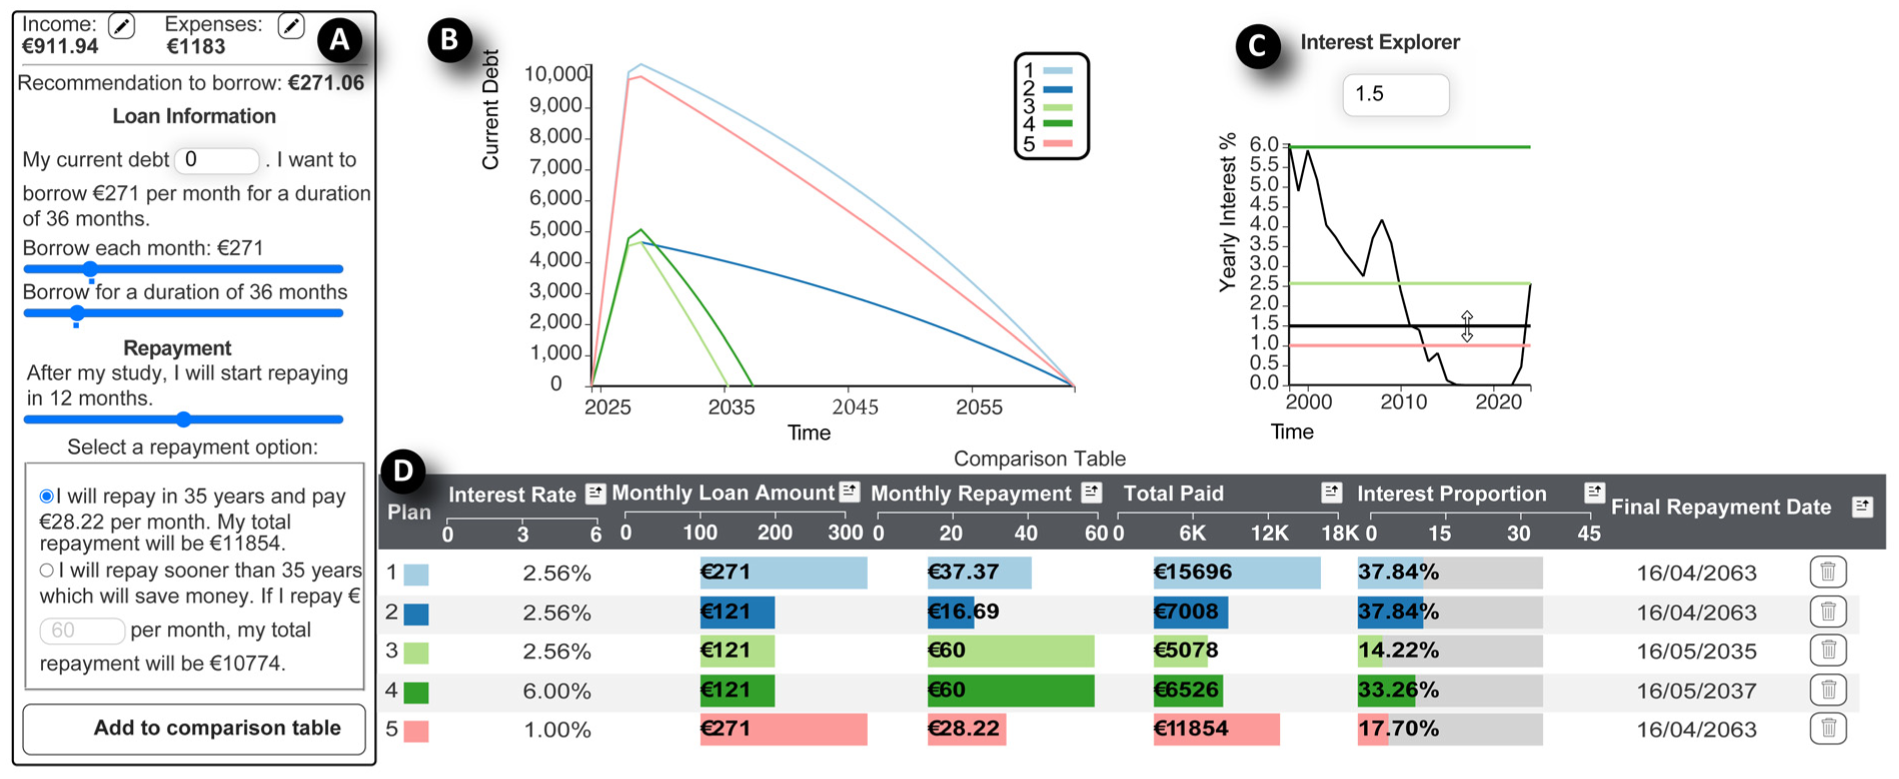
The visualization probe for the loan study consists of two coordinated components: an input widget on the left (a) and a visualization widget on the right. Before reaching this view, users complete short financial forms (not shown) specifying income and expense details, which are carried over into the interface. In the input widget, users can adjust parameters such as current debt, monthly borrowing amount, loan duration, repayment start date, and repayment rate. A short narrative summary explains how each change affects monthly obligations and total repayment. The system suggests a baseline monthly loan amount based on the entered data, while also allowing users to configure early repayment. Each configuration can be added as a new loan plan, represented by a distinct color consistent across all coordinated views. The visualization widget integrates three linked components, (b) the repayment chart, showing total outstanding debt over time for all active plans, (c) the interest explorer, displaying historical student-loan interest rates and allowing interactive adjustment via a draggable handle or numeric input, and (d) the loan comparison table, a bar-encoded tabular visualization listing all user-generated plans with attributes such as interest rate, monthly loan amount, monthly repayment, total paid, interest proportion, and final repayment date.
Specifically, the student loan visualization probe consists of:
Together, the components form a coordinated workspace for constructing (R8), comparing (R3) and evaluating alternative repayment scenarios (R2, R3, R10). A consistent, color-blind–safe palette preserves visual correspondence across views, enabling users to track each loan plan throughout the interface (R3). All components are dynamically linked, changing repayment settings, income and expenses automatically recompute the current plan and propagate updates to the repayment chart, comparison table, and interest explorer (R6, R7, R8, R10). This design supports iterative what-if exploration and transparent inspection of temporal consequences (R6, R10). Collectively, the probe operationalizes a persistent comparison workspace for alternative construction and trade-off analysis, while supporting uncertainty-aware reasoning through temporal projection.
Probe for job-seeking decisions
We introduced a visualization probe (Figures 2 and 3) to operationalize the requirements identified for the job-seeking domain, namely mixed-type comparison, qualitative preference articulation, and iterative narrowing of alternatives. The probe provides a persistent workspace for comparing self-assembled job alternatives while enabling the integration of categorical variables into structured aggregation.
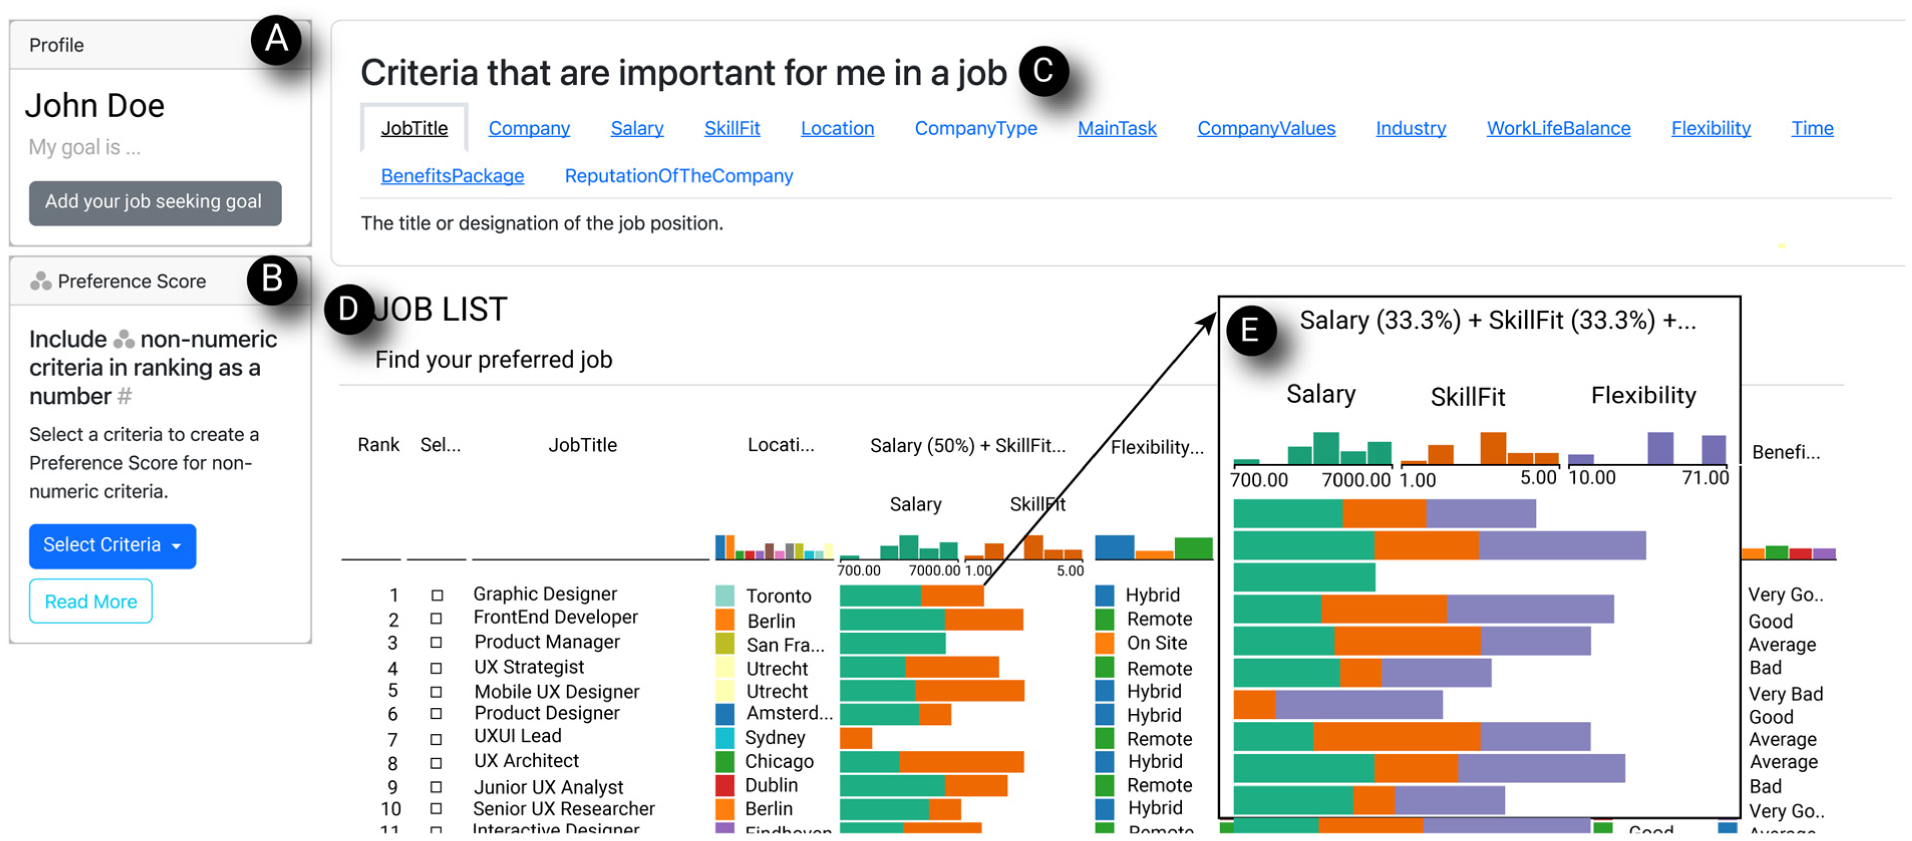
The visualization probe for job seeking shows four coordinated components: (a) The profile widget allows participants to define and iteratively refine their job-search goals by entering short free-text notes, (b) The attribute scoring widget enables interactive quantification of categorical variables using non-equidistant sliders (see Figure 3), (c) The attribute details view lists all available criteria and provides space for explanations or comments to support reflection on how each applies across alternatives, (d) The LineUp 3 comparison view ranks job alternatives across weighted attributes such as salary, location, and skill fit, supporting sorting, weighting, and aggregation, (e) shows an example of how a newly added categorical criterion (e.g., flexibility) is integrated into the aggregate ranking through non-equidistant attribute scoring (see Figure 3).
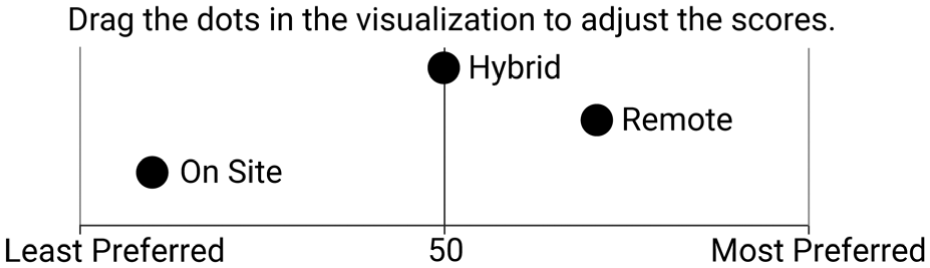
Sliders used by job seekers to quantify preferences for “flexibility” levels (“on-site,”“hybrid,”“remote”). 89
Together, the components establish a persistent comparison workspace (R1, R3) that supports iterative preference articulation (R5), structured aggregation (R6), and progressive narrowing of alternatives (R2). The LineUp-based comparison view provides the central workspace for inspecting (R3) and ranking job alternatives (R6), while the attribute scoring widget enables user-defined quantification of categorical preferences (R4, R5) that directly influence the aggregate ranking. The profile widget and attribute details view support the articulation of goals and reflective interpretation of criteria, helping users externalize and revise their priorities during decision making (R7). Real-time updates in the comparison table provide immediate feedback on how changes in weights (R5) or quantification of categorical attributes (R4) affect rankings and trade-offs (R6), while the adjacent rank-change view exposes changes in iterations (R11). Collectively, the probe operationalizes comparisons including mixed-type criteria and inspectable decision processes by integrating qualitative preference expression with quantitative aggregation in a unified workspace.
Phase 2: Probe-based studies
Phase 2 examined how visualization probes could make the decision processes identified in Phase 1 more explicit and inspectable. Rather than evaluating finalized decision-support systems, we used the probes as elicitation instruments to observe how participants compared alternatives, articulated preferences, explored trade-offs, and reflected on consequences, as also discussed in Section Methodological approach. The two probes shared a tabular comparison view but differed according to the domain-specific requirements synthesized from Phase 1 insights (see Section Phase 1: Current decision-making practices). While the student-loan probe emphasized loan plan construction, temporal consequences, and interest-rate sensitivity, the job-seeking probe emphasized mixed-type criteria, articulation of qualitative preferences, and progressive narrowing of alternatives. We first report the student-loan visualization study, followed by the job-seeking visualization study, and then synthesize their findings into cross-domain reflections in Section Cross-domain reflections.
Student loans: Visualization study
This study invited participants to explore the loan visualization probe described in the previous section (shown in Figure 1). The goal was to elicit insights into how visualization tools can support student loan decisions, an occasional rather than habitual decision type where prior experience offers limited guidance. All user study materials are available via the OSF link in the abstract.
Participants: We recruited 11 young students or recent graduates (8 female, 3 male), aged 22–30, following the same sampling procedure based on thematic saturation and participant profile as in Phase 1, including 7 active borrowers and 4 recent graduates about to begin repayment.
Pre-study: Participants provided informed consent and received a short walkthrough of the visualization probe by the interviewer. They then completed a short training session based on a printed scenario describing a hypothetical student’s income and expenses. Using these values, participants performed five analytical tasks, such as filling in data, calculating total repayment, adjusting interest rates, and sorting or filtering loan alternatives, to ensure full understanding of the probe’s functions without implying decision strategies. All participants completed the tasks successfully on their first or second attempt, after brief clarification when needed.
Study task: Participants used the loan visualization probe to construct and select a student-loan plan aligned with their goals. They entered their current financial situation or recalled data from when they were borrowing, interacted freely with the probe (adding and modifying plans, adjusting monthly loan amount, interest rate, duration, and repayment), and narrated their actions and reasoning using a think-aloud protocol.
Post-study: Participants took part in a short semi-structured interview designed to elicit reflections on their decision-making process and their experience with the visualization probe. They were asked to comment on how specific components (such as the comparison table, sorting and filtering features, and the interest explorer) influenced their reasoning, what elements supported or hindered understanding, and which parts of the tool they would keep or change. The session concluded with a five-item financial self-efficacy questionnaire 87 to assess how the tool affected participants’ confidence in managing and planning financial decisions. We used a seven-point Likert scale (item three reverse-scored, and the score computed as the item average).
Analysis: All study data were audio-recorded and subsequently transcribed. The decision task was analyzed using an insight-based evaluation, 86 acknowledging that personal financial goals, risk tolerance, and long-term impacts make a single “correct” decision difficult to define. 94 This approach allowed us to assess whether participants’ intermediate reasoning and justifications were coherent with their interactions and the visual evidence, rather than evaluating the objective correctness of their final loan choice. Insights were identified from the transcripts and categorized as singular (about one plan or attribute) or comparative (relationships across plans). Singular insights relate to specific attributes of a single loan plan, for example, “This loan plan has a monthly repayment amount of X,” whereas comparative insights discuss relationships between different loan plans, for example, “How an increase in interest rate affects the monthly repayment compared to a previous loan plan.” For each insight, we annotated the evaluation attribute (e.g. total paid, interest proportion, monthly repayment, final repayment date); for comparative insights, we also marked the alteration attribute (the parameter modified by the user, such as monthly repayment, loan amount, interest rate, or duration) and the evaluation attribute (attributes used to make decisions about loans). Insights describing basic tool functionality (e.g. “This slider changes the interest rate”) were excluded since comprehension was verified in the pre-study. Interaction logs (number of plans added, number of unique interest rates and monthly amounts explored) were derived from screen recordings. Responses to open-ended questions about participants’ experience with the probe were analyzed using inductive coding and qualitative content analysis, 92 consistent with the interviews in Phase 1.
Findings
We next discuss the factors underlying this enhanced understanding within visualization-aided decision making:
Job seeking: Visualization study
This study invited participants to explore the job-seeking visualization probe described in the previous section (Figures 2 and 3). The goal was to elicit insights into how visualization tools can support job-seeking decisions, an occasional rather than habitual decision type where prior experience offers limited guidance. All user study materials are available via the OSF link in the abstract.
Methodologically, Phase 2 of the job-seeking study was shaped by insights from its preceding interviews, which showed that job seekers relied on qualitative, self-defined criteria (e.g. team culture, flexibility, career growth), created their own datasets rather than working with fixed variables, and preferred to retain control over their decisions instead of relying on automated recommendations. These findings motivated a different evaluative focus from the loan study. In the loan study, whose Phase 1 interviews revealed that participants relied on narrow, short-term calculations and overlooked long-term trade-offs, Phase 2 evaluated how visual comparison could foster more systematic reasoning through an insight-based analysis and self-efficacy measures. In contrast, the job-seeking study approximated an authentic decision experience in the employment context, involving participants in constructing the dataset used in the study and focusing on how they engaged with the newly introduced attribute-scoring mechanism. Translating inherently qualitative criteria into numeric values within a structured visualization can be counterintuitive, since such judgments are often made implicitly, in relative rather than absolute terms, and may lose nuance when expressed through numerical scales. This uncertainty made it important to center the evaluation on how participants perceived, rationalized, and enacted this quantification step, whether it supported or conflicted with their natural decision-making process, and how it shaped the way they articulated and justified their choices through the probe.
Participants: We recruited seven participants (five female, two male), aged 25–35, following the same sampling procedure and profile as in Phase 1, including two university students and five young professionals actively seeking employment, with two bachelor’s, four master’s, and one doctorate degree.
Pre-study: Each session began with informed consent and a short introduction to the study. Participants were asked to provide links to five job advertisements they had recently considered. During an initial interview, they collaboratively constructed a personal dataset by defining the criteria they used in their job search (e.g. salary, skill fit, flexibility, company values). These criteria were documented by the researcher and translated into a structured dataset of 20 positions, comprising the 5 listings supplied by the participant and 15 additional listings sourced from LinkedIn that matched their interests. For missing categorical values, placeholder entries were added based on the participant’s defined preferences. This dataset was then imported into the visualization tool used in the main study. Before beginning the main tasks, participants received brief training with the LineUp interface using an unrelated dataset (Forbes Top 2000) to familiarize them with sorting, filtering, grouping, and weighting operations.
Study task: Participants engaged in a two-stage think-aloud session designed to examine job-seeking decision making with visualization and the influence of quantifying qualitative criteria. In the first stage, participants defined their job-search goals within the probe and explored their personalized dataset to make an initial job selection, iterating freely with the LineUp table to compare and prioritize alternatives. In the second stage, they were introduced to the attribute-scoring mechanism, which enabled them to assign numerical values to qualitative factors. They then revisited the same dataset and reconsidered their earlier choices, now integrating both qualitative and quantitative information within a shared scoring scale. This structure allowed us to examine how quantification within the visualization shaped participants’ decision-making processes and their strategies for evaluating and refining job choices.
Post-study: After completing the tasks, participants took part in a short semi-structured interview focusing on their experience with the tool. Questions addressed the tool’s intuitiveness and clarity (e.g. “Which parts felt intuitive or unclear?”), perception of the scoring mechanism (“How did you feel about converting qualitative factors into numerical scores?”), and its perceived impact on their decision making (“Did the tool influence how you viewed or prioritized jobs before and after scoring?”). Sessions lasted approximately 30–45 min in total.
Analysis: Audio recordings from both the usability and post-study interviews were transcribed and analyzed using open coding. One co-author conducted the initial coding, which was reviewed by another. Codes captured participant reactions, feedback on the tool’s usability, and reflections on their decision-making process. Through iterative refinement, codes were grouped into broader themes, including intuitiveness and clarity of use, perception of the qualitative–quantitative scoring, patterns of decision making, and emotional or reflective responses. Unlike the loan study’s structured insight-based analysis, this phase adopted an inductive, interpretive approach to capture how participants evaluated the attribute-scoring mechanism and how it shaped their decision strategies.
Findings
In terms of interaction design, the probe also revealed limited flexibility 98 in the aspects discussed in the themes below:
Cross-domain reflections
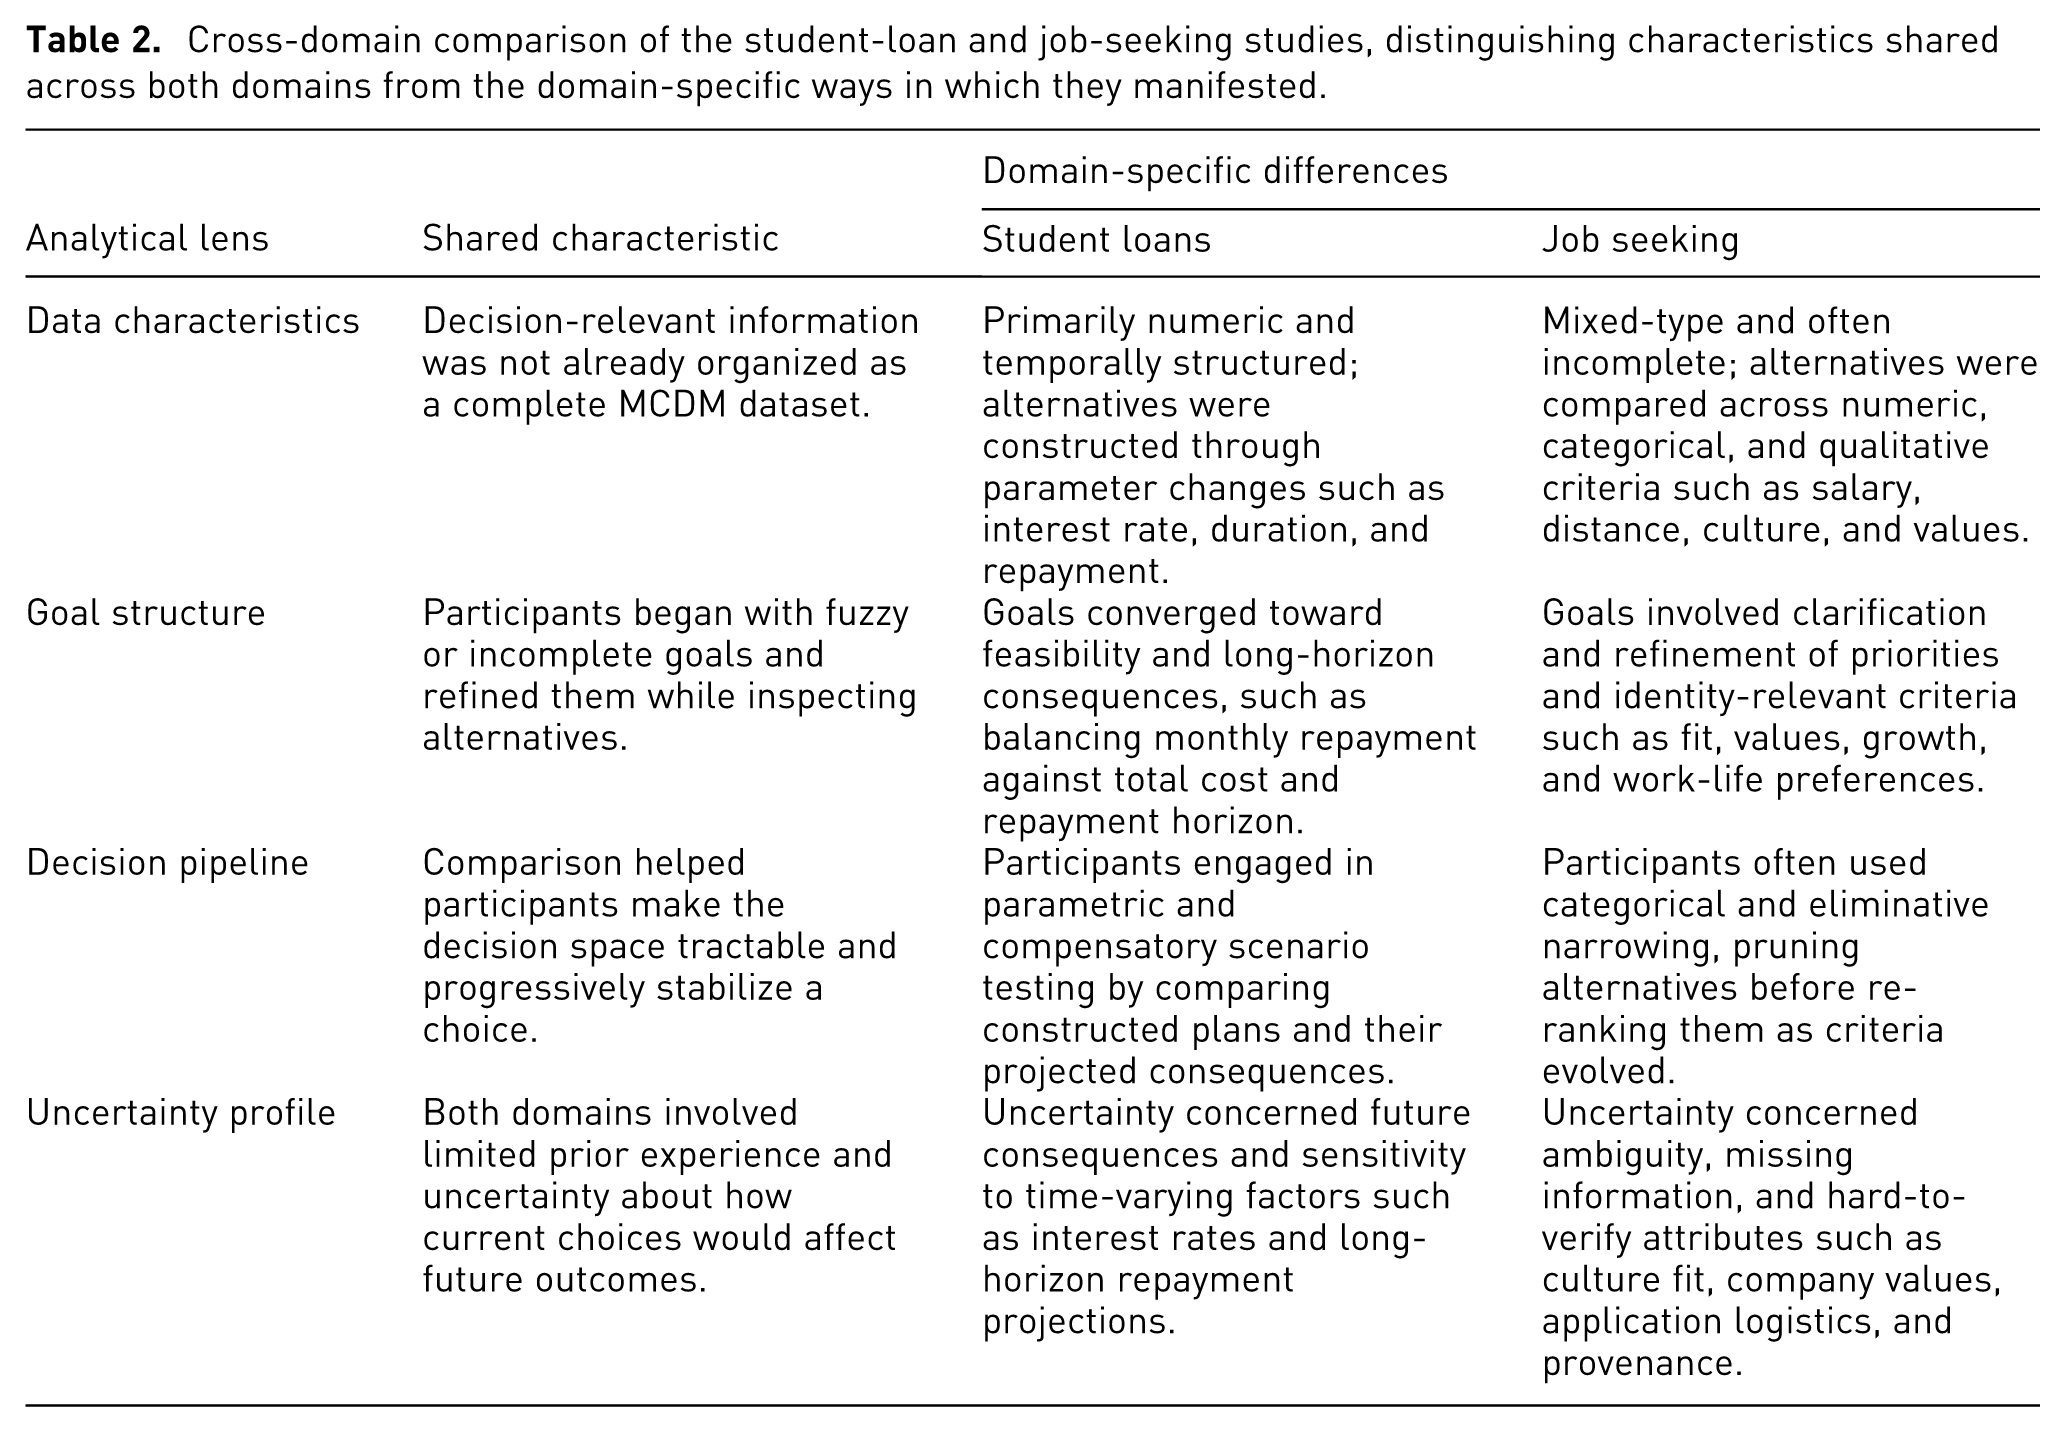
The student loan and job seeking studies were examined together to explore how visualization can support non-expert individuals in making data-informed decisions. To structure this cross-case reflection, we analyze the domains through four analytical lenses: data characteristics, goal structure, decision pipeline, and uncertainty profile, following established approaches to cross-case synthesis in visualization and HCI research.101,102 To make similarities and differences easier to inspect, Table 2 separates shared characteristics from the domain-specific ways they manifested in the student-loan and job-seeking studies.
Cross-domain comparison of the student-loan and job-seeking studies, distinguishing characteristics shared across both domains from the domain-specific ways in which they manifested.
The role of comparison in decision support
Comparison is a foundational operation in visualization, typically understood as examining relationships among visualized items through design strategies such as juxtaposition, superposition, or explicit encoding.103,104 While these frameworks emphasize perceptual accuracy and layout optimization, our findings suggest that comparison plays a more formative role when people make real-world decisions, especially when they lack prior expertise or stable reference points. In both domains, comparison was not only a means to select, but a means to construct meaning: participants used contrasts to learn what mattered, to test consequences, and to stabilize a working understanding sufficient for action.
The form of comparison differed systematically across domains (Table 2). In the loan study, comparison was primarily parametric and compensatory: participants constructed multiple scenarios by adjusting numeric parameters such as interest rate, duration, or monthly repayment to inspect trade-offs and long-term implications. In the job-seeking study, comparison was more categorical and often eliminative: participants first narrowed options based on qualitative aspects such as location, domain, or company values, and then engaged in finer-grained trade-offs.
Across both contexts, comparison served not only to choose but to understand, helping participants articulate evolving goals, calibrate preferences, and externalize uncertainty through visible contrasts. These behaviors challenge how visualization research typically frames comparison. In existing literature, items and attributes are fixed, and the task is to minimize perceptual or cognitive load. In our studies, users dynamically generated, modified, and removed both items and attributes as part of the decision process. Their interactions intentionally increased contrast rather than reduced it—testing extremes, reordering priorities, and iteratively constructing the space of alternatives they compared. Comparison thus became an epistemic act, a way to discover structure in ill-defined problems rather than to verify differences within predefined data. These insights suggest that comparison should be explicitly studied in the context of decision making, not only as a perceptual challenge but as a reasoning process intertwined with data creation, preference construction, and evolving understanding.
The role of agency in decision support
Across both Phase 1 interviews, decision makers emphasized the importance of maintaining agency and control over their choices. However, when later exposed to the visualization probes, many expressed a desire for greater guidance or AI features. This apparent contradiction may reflect that participants’ initial concerns were shaped by their exposure to automated systems such as online recommenders or advisory calculators, as our review confirmed that neither job-seeking nor loan-related decisions are currently supported by visualization-based tools.
At the same time, the domains impose different cognitive burdens (Table 2): loan decisions involve reasoning about long-term consequences under uncertain projections, whereas job-seeking decisions are characterized by ambiguity, incomplete information, and evolving criteria. These distinct uncertainty profiles were associated with different desired forms of assistance, such as support for exploring projected consequences in loans and for structuring complexity in job seeking.
However, existing visualization-based MCDM systems tend to operate in a fully manual mode, offering little algorithmic support, 1 a gap that may help explain their limited adoption in real-world decision contexts. 20 Our studies suggest that, particularly for inexperienced decision makers, subtle and transparent forms of computational assistance could reduce cognitive overload and decision fatigue without diminishing user control. Automation in decision-support visualization should therefore not be treated as an all-or-nothing property but as a design space: moving beyond recommenders and identifying specific subtasks, such as goal and preference articulation or scenario exploration, where adaptive support can enhance rather than replace human judgment.
The role of self-presence in decision support
Across both domains, participants’ preferences were not static but evolved through reflection, feedback, and interaction. Visualization supported this process by making choices and consequences visible, helping users reconsider priorities as understanding deepened. In the loan context, participants refined repayment goals and time horizons as they visualized cumulative outcomes and trade-offs between monthly and total costs, illustrating how preferences can develop through temporal reasoning. In the job-seeking context, priorities shifted from general criteria toward self-relevant dimensions such as team culture, growth, and values. These findings indicate that effective decision support requires more than personalization: it must enable self-presence, allowing users to see their own situation, goals, and evolving judgments inscribed within the visualization itself. Through editable parameters, goal statements, and reflections that become part of the representation, users can externalize what matters to them. This is particularly important when qualitative judgments and contextual knowledge must coexist with quantitative structure. In both domains, visualization became meaningful not merely as a display of data, but as a medium through which users could situate and refine their reasoning in relation to their decisions.
Technical considerations for decision support
The two domains differ in their data characteristics, goal structures, decision pipelines, and uncertainty profiles (Table 2), and accordingly raised different technical considerations. In the loan study, where outcomes accumulate over time and depend on projected scenarios, temporal information needed to connect immediate parameter changes with cumulative consequences. In the job-seeking study, where alternatives combined numeric, categorical, and qualitative criteria, representations had to accommodate mixed attribute types without reducing them to rigid scoring schemes. In both domains, however, alternatives and criteria were not fixed: participants refined, annotated, and extended them during reasoning. Technically, this points to representations that support schema flexibility, reversible operations, and persistent comparison workspaces, rather than assuming a stable set of predefined alternatives and attributes. Similar technical considerations may arise in other decision contexts that involve long-term projected consequences, such as retirement contribution planning or long-term treatment adherence decisions, and in contexts that combine heterogeneous and evolving criteria, such as graduate program selection or relocation choices, although the precise design solutions may differ.
Methodological reflections for decision support
Examining two design studies together offered methodological value beyond identifying shared themes. The structured comparison across data characteristics, goal structures, decision pipelines, and uncertainty profiles (Table 2) helped clarify which findings appeared domain-specific and which reflected more general reasoning mechanisms.80,81 Even where direct parallels were limited, such as the prominence of temporal reasoning in loans versus categorical narrowing in job seeking, these contrasts sharpened rather than weakened interpretability by making structural differences explicit.
Working with real decision makers in domains that rarely feature visualization research proved particularly valuable. Participants’ personal investment fostered authentic engagement that is difficult to reproduce in artificial setups. At the same time, realism introduced complexity: true stakes are hard to simulate, framing tasks convincingly is demanding, and ethical or logistical constraints restrict iteration. Our protocol was adaptive rather than fully parallel across domains, leaving room for future work to establish a more systematically controlled comparative structure.
Treating the probes as elicitation instruments rather than complete systems supported reflective iteration and analytical distance, though it also meant they did not aim to demonstrate the full expressive potential of visualization. Their minimal yet functional design makes them suitable for reuse in future comparative studies, serving as reference implementations provided in the Supplemental material. More broadly, decision contexts appear particularly well suited to dual-case design studies, since their abstract task structure allows meaningful comparison across substantively different domains.
Limitations & future work
The visualization probes were designed as formative instruments to surface decision making needs, reasoning strategies, and preference articulation processes in underexplored personal domains. They were not intended as comparative evaluations of alternative encodings or interaction paradigms. Although the comparison table format was well received, assessing whether alternative approaches (e.g. graphical dashboards, narrative explanations, recommender systems, or adaptive guidance mechanisms) lead to different outcomes would require controlled experimental designs with stronger baselines and quantitative performance measures. Future work could systematically compare encoding strategies to examine their effectiveness for non-expert decision makers.
Scalability presents an additional consideration in the job-seeking domain. Real-world job markets can involve hundreds of listings and attributes with high categorical cardinality. While the tabular model supports ranking, sorting, and filtering at larger scales, perceptual and interaction trade-offs emerge as complexity increases. For example, the Attribute Scoring Widget becomes cognitively demanding when categorical variables contain many distinct levels, particularly when users attempt fine-grained, non-equidistant preference mappings. Likewise, categorical color encoding is perceptually constrained beyond approximately 10–12 distinguishable hues, and expanding numbers of criteria reduce horizontal space in tabular layouts, affecting readability and comparison.
These observations point to broader trade-offs between expressive preference modeling and perceptual scalability in mixed-type multi-criteria interfaces. Supporting large-scale, dynamic datasets may require complementary strategies such as hierarchical aggregation, clustering, staged filtering pipelines, or adaptive attribute grouping. The probes were developed to investigate early-stage preference construction and reasoning among non-expert decision makers, grounded in domain structure and Phase 1 findings rather than optimized for production-scale deployment. Within this scope, the study contributes a structured abstraction of domain-informed design requirements and demonstrates how these can be operationalized in exploratory decision-support prototypes.
Conclusion
This work examined how visualization can support non-expert individuals in making consequential personal decisions. Through a two-case design study on student-loan planning and job seeking, we investigated how people structure their decisions, the criteria and challenges that shape them, and the tools they rely on. Participants reported lacking dedicated decision-support tools and instead depended on scattered online information, ad-hoc calculations, and self-constructed data structures to manage complexity. Based on key pain points identified, we developed visualization probes to explore how visualizations could better support decision making in each domain. The studies showed that visualization helped participants bring structure and clarity to their reasoning: loan participants compared self-constructed repayment plans to understand how parameters shaped debt trajectories, while job seekers quantified qualitative aspects such as cultural fit and personal values to iterate across alternatives. Participants reasoned through comparison and cause–and–effect exploration, integrated self-reflection and qualitative elements into the data space, and expressed a need for targeted computational guidance that preserves their sense of agency.
In this view, visualization for personal decision support can move beyond presenting fixed options to support the co-development of data and understanding. When users enrich context, reshape views, and trace how their reasoning evolves, visualization becomes part of the decision process itself. Future design frameworks may benefit from treating data mutability, qualitative reasoning, and user self-presence as first-class objects, bridging analytic visualization with the lived realities of everyday decision making.
Footnotes
Funding
The authors received no financial support for the research, authorship, and/or publication of this article.
Declaration of conflicting interests
The authors declared no potential conflicts of interest with respect to the research, authorship, and/or publication of this article.