
Abstract
Analyzing unannotated large complex image collections in domains like forensics, accident investigation, or social media analysis involves interpreting complex, overlapping relationships among images: images may belong to multiple content- or context-based groupings simultaneously. Domain experts, like forensic investigators, accident investigators, investigative journalists, and social media analysts require a way to make well informed, high-impact decisions, while not necessarily being specialists in analyzing such collections. Traditional clustering assigns images to a single cluster, not representing overlapping relationships, while supervised classification and multi-label classification require annotations and often rely on generic pre-trained models that do not capture domain specific semantics of complex real-world image collections. Hypergraphs effectively capture overlapping relationships, but construction from raw, unannotated image data and translating their complexity into information and insights for domain experts, remain challenging. We propose an interactive visual analytics approach specifically designed for constructing, exploring, and analyzing hypergraphs. Core contributions include: (1) a framework for constructing and evaluating hypergraphs from raw image data, (2) CoverEdge Similarity (CES), a scalable measure for comparing constructed hypergraphs with ground truth, (3) scalable visual analytics integrating coordinated spatial, grid, and matrix visualization, and (4) practical domain insights from evaluation with real-life image collections. To determine which construction algorithm can create meaningful hypergraphs, we designed and validated a similarity measure to evaluate constructed hypergraphs against ground truth. Across annotated benchmark collections, our TEMI-adaptation as construction method performed best overall, compared to others like fuzzy c-means, and produced overlaps that were qualitatively useful for analysis. A qualitative think-aloud study with eight domain experts on real-life accident investigation image collections containing several thousand to tens of thousands of images suggests that the system supports iterative exploration and search, with participants completing most tasks within minutes. A video demo is available in the supplemental materials.
Introduction
Domain experts, such as forensic investigators, accident investigators, investigative journalists, and social media analysts, may be required to analyze image collections containing thousands or tens of thousands of images, and in some cases even more, in order to make well informed, high impact decisions, while not necessarily being specialists in the computer vision techniques needed to analyze the content of the images.
An image collection is a set of images considered jointly for analysis, typically because they share a source, domain, event, task, or investigative context. In this paper, we focus on a specific type of image collection, which we refer to as a complex image collection (CIC). Such a collection typically depicts multiple objects, captured at specific times and locations, and has various types of relations among them. In many real-life situations, these images come without any prior annotations, which significantly contributes to the complexity of the image collection. Throughout this paper, CIC specifically refers to unannotated image collections.
Two characteristics make CICs particularly challenging to analyze. First, the relations among the images are overlapping and non-exclusive: a single image may contain multiple objects, and images can be grouped based on similarities in their content, as well as their spatial, temporal, or environmental context. Annotating such an image collection would necessarily require a multi-label approach. Second, their unique and specialized content creates a semantic gap, causing standard pre-trained models to perform poorly. Bridging this gap with common techniques like fine-tuning is often impossible, as it requires annotated data. In contrast, a visual analytics approach supports expert-driven exploration and interpretation of CICs without requiring large-scale annotation. A flexible representational framework is needed that can accommodate both the domain-specific content and the complex overlapping relationships among images, which could serve either as a standalone decision-support tool for experts or for annotating the collection to enable subsequent fine-tuning.
Existing visual analytics approaches for image collections, discussed in more detail in the Related Work section, commonly support embedding-, graph-, or clustering-based exploration of individual images,1–3 concept-, metadata-, caption-, or time/space-driven browsing and aggregation,4–7 and visually enabled active-learning workflows, such as VisActive 8 and the methods reviewed by Yang et al. 9
The problem we face is that unannotated complex image collections possess an inherently multi-label structure: a single image may belong to many content- or context-based groupings simultaneously. Complex, overlapping and non-exclusive relationships are a challenge that is also present in social network analysis, where individuals frequently belong to multiple groups or communities. Hypergraphs, which allow elements to participate in multiple groups or communities, have proven particularly effective in modeling these relationships. 10 For CICs, hypergraphs 11 provide the necessary flexibility to enable a visual analytics solution for a more accurate representation of the underlying relationships within the data.
In real investigative settings, the grouping structure is unknown, so any representation of the collection must be constructed in an unsupervised manner. To determine whether such unsupervised construction methods are effective, they must be benchmarked on datasets where the multi-label ground truth is available and compared to it in an overlap-aware manner. This requires a representational model that can express overlapping membership without duplicating images. Hypergraphs provide this capability: each hyperedge encodes a grouping of images defined by shared content or context, and images may participate in multiple hyperedges at once. This overlap-aware representation aligns with the characteristics of real-world CICs and provides the necessary foundation both for modeling multi-label structure and for evaluating automatically constructed groupings against multi-label ground truth. However, the availability of a suitable representational model does not resolve the practical challenges of using hypergraphs for CICs. First, constructing a hypergraph directly from raw, unannotated image data remains largely unaddressed in the literature; existing work on hypergraph construction typically assumes predefined groupings or metadata. Second, even when a ground-truth hypergraph is available for benchmarking, comparing it to a constructed hypergraph is itself difficult. Existing hypergraph similarity measures 12 scale only to very small hypergraphs and are infeasible for the CICs. As a result, both the construction and the evaluation of hypergraphs for CICs remain open methodological problems.
Even if an automatically constructed hypergraph captures the underlying structure perfectly, analysts would still need to interpret and make sense of that structure in order to draw well-informed, high-impact conclusions. In practice, constructed hypergraphs are unlikely to be perfect, further increasing the need for interactive exploration, refinement, and interpretation during investigative analysis. This motivates the need for a visual analytics system aligned with expert workflows. Thus, to develop our visual analytics solution, we need to understand how domain experts analyze large CICs. Typically, experts start with unstructured collections and gradually organize them into meaningful structures through iterative exploration and targeted searches for relevant items, enabling essential insights.13,14 In this process, exploration is undertaken when the expert is faced with an unfamiliar collection and seeks to uncover the underlying structure through iterative dynamic analysis. In contrast, search is used when the expert has a clear target in mind and requires fast, precise retrieval of relevant items. Many multimedia analytics tasks, especially when analyzing CICs, require both approaches: initial exploration to understand the full scope of the data, followed by targeted searches for specific insights. Consequently, analyzing image collections involves an iterative alternation between exploration and search, and requires dynamic data exploration, filtering, querying, annotation, and hypothesis testing.
Supporting the above expert-driven workflow with a hypergraph-based model presents several practical and technical challenges. The system must construct a meaningful hypergraph from raw data and also visualize it at scale. Existing hypergraph visualizations, such as node-link diagrams, are ill-suited for this task; they struggle to represent hyperedges clearly when scaling beyond a thousand images and typically treat nodes as abstract points rather than rich visual content. 15 Consequently, a static view is insufficient. To derive insights, the visualization must allow analysts to fluidly transition between high-level structural patterns and low-level image inspection without losing context. Furthermore, it must be performant on the typical hardware available to experts, as many organizations lack access to large computer clusters or cloud resources due to cost or data confidentiality.
To address these challenges, we propose a visual analytics approach for constructing and exploring hypergraphs derived from raw image data. In addition, we introduce an offline evaluation approach for benchmarking hypergraph construction methods on annotated datasets.
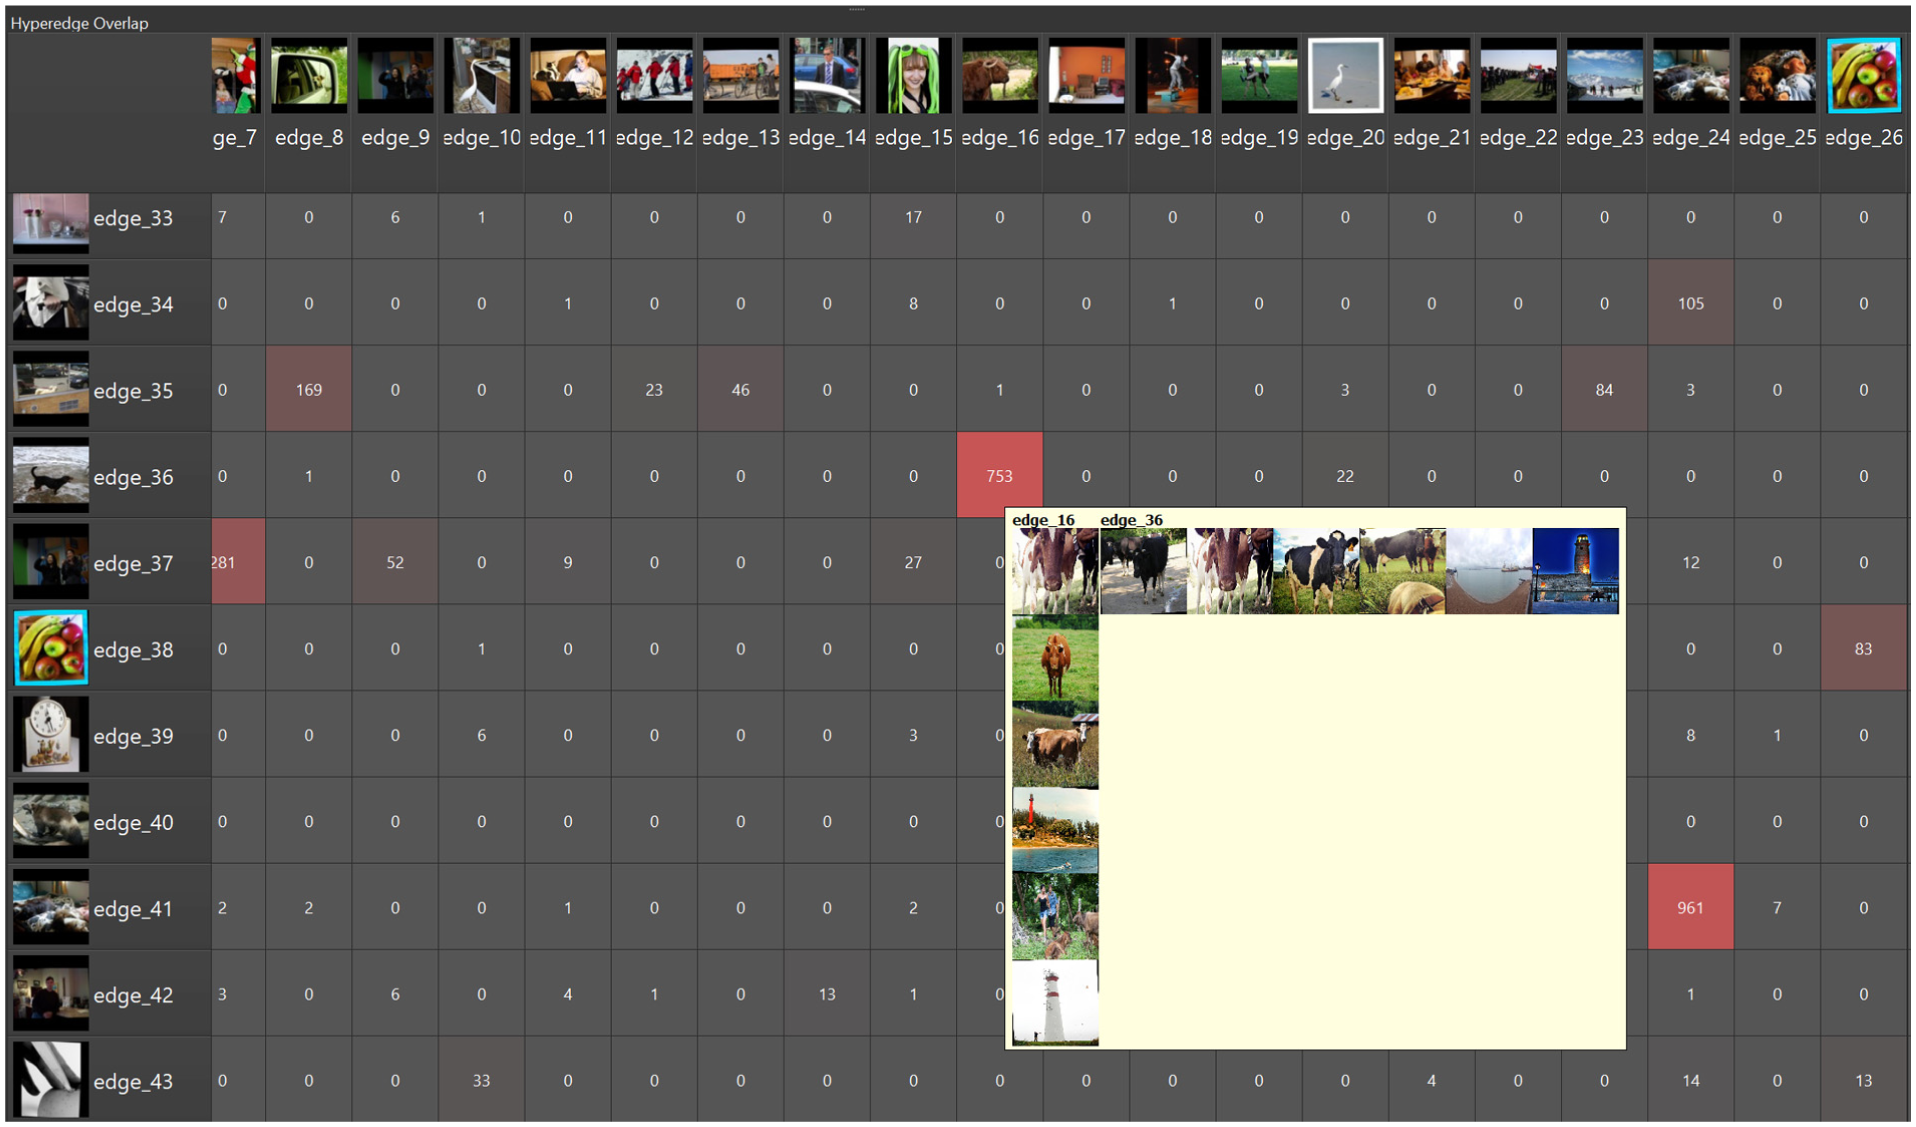
Figure 1 provides an overview of the overall methodology. It distinguishes between the expert visual analytics workflow, in which a hypergraph is constructed and interactively analyzed, and the separate offline evaluation approach used to assess construction methods against ground truth. Together, this leads to the following contributions:
A hypergraph construction and evaluation framework: We propose a pipeline for deriving hypergraphs directly from raw image data;
A novel hypergraph similarity measure: We introduce the CoverEdge Similarity (CES) measure to validate construction quality, ensuring that the algorithms integrated into our system generate meaningful and reliable hypergraphs for the domain expert;
Scalable visual analytics design: We introduce a hypergraph visualization designed to scale to tens of thousands of images. By integrating interactivity and layered information, our approach enables users to gradually explore large hypergraphs without becoming overwhelmed, facilitating efficient and meaningful insight discovery;
Practical domain insights: We provide an analysis of how domain experts effectively use the visual analytics system, based on a structured evaluation with real-world investigative image collections.
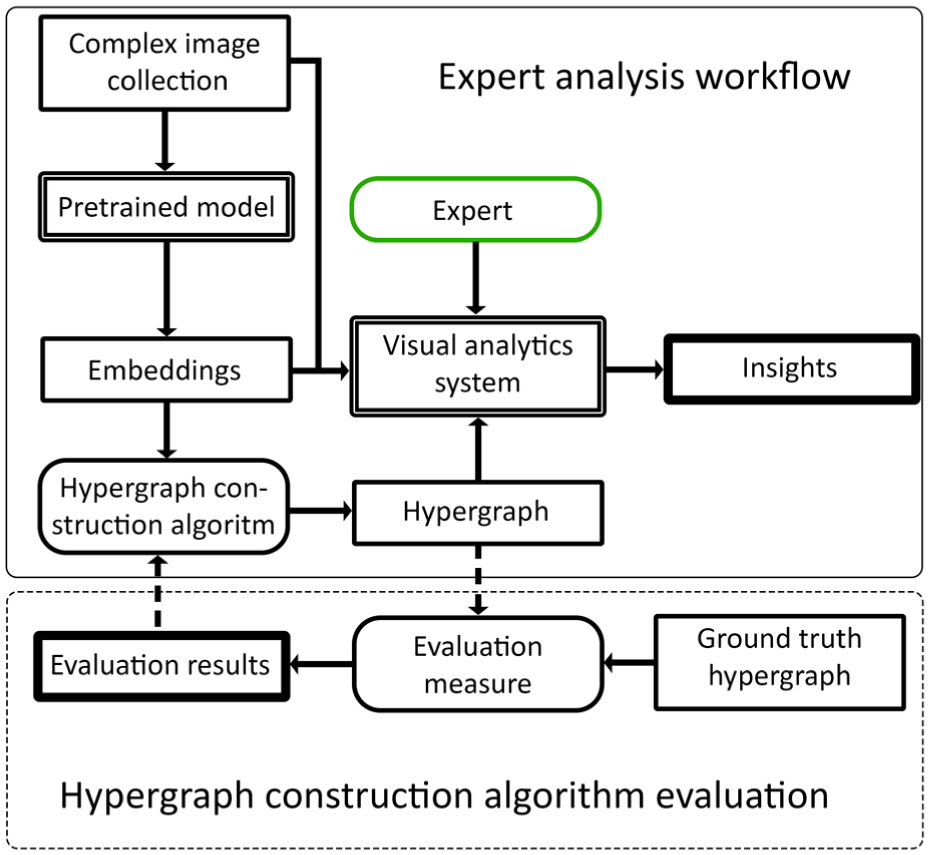
Overview of the proposed approach. In the expert analysis workflow (top), embeddings are extracted from complex image collections and used to construct hypergraphs, which are interactively explored through a visual analytics system to support insight generation. In a separate, offline, evaluation setting (bottom), hypergraph construction algorithms are benchmarked against image collections for which the ground truth is available, using an overlap-aware evaluation measure to assess their suitability for real-world use.
Related work
The analysis, representation, and visualization of complex large-scale datasets pose significant difficulties, particularly for Complex Image Collections (CICs) due to their unstructured nature and overlapping relationships. This section reviews existing approaches to addressing these challenges. We begin by discussing methods for representing image collections and constructing hypergraphs from raw data, followed by measures for hypergraph similarity and evaluation. Finally, we review current techniques for hypergraph visualization.
Representing image collections with hypergraphs
Complex multi-label datasets can be effectively represented using hypergraphs, as they naturally capture group relationships beyond pairs and allow elements to participate in multiple groups simultaneously. Hypergraphs, widely used in fields such as image segmentation and social network analysis, 10 allow individual items to belong simultaneously to multiple groups or categories. Representing data using hypergraphs first requires a method to systematically construct the hypergraph structure from the dataset.
Most hypergraph construction research focuses on attribute-based hypergraph generation16,17 or network-based hypergraph generation,18–20 where there is already a (latent) network available to generate a hypergraph. 21
A more implicit way to construct a hypergraph would be through Multi-Label Classification (MLC).22–24 This approach has achieved significant success in tasks such as document categorization25,26 and image classification.27–29 However, applying these methods to CICs is problematic. Standard pre-trained models are typically trained on generic datasets like ImageNet or MS COCO, which fail to capture the unique semantics of specialized image collections. This creates a semantic gap, leading to poor performance. While techniques like domain-specific fine-tuning or retrieval-augmented generation30,31 can bridge this gap, they are fundamentally dependent on labeled data. Since CICs are unannotated by definition, supervised approaches like MLC are unsuitable for our use case.
While hypergraphs are suited for representing multi-label relationships, existing approaches typically assume predefined attributes, networks, or labeled data. In contrast, our work focuses on constructing hypergraphs directly from raw, unannotated image collections.
Constructing hypergraphs from raw data
To effectively create hypergraphs, methods that do not rely strictly on predefined categories or extensive labeled training sets become essential. Clustering provides an unsupervised alternative that can automatically uncover latent structures and capture overlapping relationships without the need for extensive labeling or retraining. However, traditional clustering methods, such as k-means, typically assign each image to a single exclusive cluster. This is overly restrictive for complex image collections that contain many overlapping relationships. While these methods work well for single-label datasets, they struggle to capture the overlapping relationships inherent in CICs. To address this limitation, multi-label clustering methods have been introduced, such as fuzzy c-means 32 and possibilistic c-means 33 which may be a way to construct hypergraphs.
Few papers have directly addressed the construction of hypergraphs from raw data. Exceptions are HYGENE, a diffusion-based hypergraph generator, 34 and HGRec++. 35 Unfortunately, HYGENE is not suitable for our use case, as it requires a training set of hypergraphs with structural properties (such as number of nodes and hyperedges, the distributions of node degrees and hyperedge sizes, and spectral features of the hypergraph’s Laplacian), which we, by definition of our problem, do not have. HGRec++ is based on item-user pairs for recommendation systems, making it difficult to adopt for our CICs as well. Gao et al. proposed using k-means with different granularities to generate a hypergraph for 3-D object recognition and retrieval. 36 Each cluster generated through these different granularities then serves as a hyperedge. Although this hypergraph is only an initial step in their framework, it may also work for our task.
Overall, existing methods either rely on labeled data, predefined structures, or are not designed for image collections. This highlights the need for practical, unsupervised approaches that can construct hypergraphs directly from raw visual data, which we address in this work.
Measures for hypergraph similarity
The development of any hypergraph construction method, particularly from unstructured data, cannot be meaningfully pursued without a way to evaluate its output. Robust similarity measures are essential for assessing the quality of a generated hypergraph or comparing different construction techniques. However, this remains a significant challenge: scalable and universally accepted evaluation metrics are lacking. Ground truth comparisons are especially valuable in this context, but few measures are designed specifically to compare a generated hypergraph to a ground truth counterpart.
Traditional graph similarity measures, such as Graph Edit Distance and Maximum Common Edge Subgraph, are NP-hard problems, making them computationally expensive, particularly for large graphs. To address this, deep learning approaches have been developed to approximate these methods and reduce computational costs. 37 Hypergraphs, however, generalize relationships by allowing edges (hyperedges) to connect multiple nodes, often in overlapping ways, and such higher-order structures are not easily captured by the traditional graph metrics.
In clustering evaluation, measures such as Normalized Mutual Information (NMI) and Adjusted Rand Index (ARI) 38 are used to assess similarity between clusters. These measures are effective for datasets where each element belongs to a single, exclusive cluster. However, hypergraphs represent overlapping clusters and have multi-node hyperedges, which these traditional measures cannot fully capture. One notable example is the Hypergraph Similarity Measure, 12 which uses tensor-based representations and algebraic methods to quantify structural similarity between hypergraphs. Their proposed methods suffer from a limitation though: they only work when the two hypergraphs have the same maximum hyperedge size. Furthermore, their direct measures suffer from scalability issues, becoming computationally infeasible beyond approximately 100 nodes due to memory constraints. This restricts its use for large image collections, highlighting the need for more scalable and efficient measures suitable for large-scale datasets.
These limitations indicate the lack of a scalable similarity measure that can evaluate large hypergraphs with overlapping structure. To address this, we introduce a new measure designed for scalability and sensitivity to both local and global structure.
Visual analytics for image collections
Existing visual analytics systems for large image collections rely either on spatial projection and clustering, where each image is represented as a point in an embedding space,1–3 or on tabular and aggregate visualizations driven by concept scores, metadata, or captions.4–7 Other systems integrate interactive labeling and active learning to iteratively collect multiple labels per image and guide model training.8,9
Even when multiple labels per image are supported or collected through interactive labeling and active learning, existing systems remain fundamentally instance-centric: the initial representation shown to the analyst presents images as isolated items in a projection, grid, or table, and does not expose any multi-label relational structure between groupings of items. Multi-label semantics arise only through user-driven annotation rather than being part of the system’s inherent model of the collection.8,9 Furthermore, these systems do not evaluate their initial data model construction method against multi-label ground truth, because the underlying representation does not encode overlapping groups that could be compared to it. Consequently, the degree to which the initial representation aligns with a multi-label ground truth is unknown; prior systems do not quantify how well their initial model captures the underlying structure of the collection or how much additional effort the analyst must expend to impose such structure manually.
Existing visual analytics systems for image collections are largely instance-centric, representing images as isolated items rather than as members of overlapping groups. This limits their ability to explicitly model the multi-label relational structure of CICs and motivates our use of hypergraphs as the underlying representation.
These limitations motivate the need for a representation that natively captures overlapping group structure and allows evaluation against multi-label ground truth. In our work, we address this by adopting a hypergraph-based model and integrating it into a visual analytics framework.
Visualization of hypergraphs
Traditional approaches, such as Venn or Euler diagrams, rely heavily on color and geometric shapes to differentiate hyperedges. While these methods can be effective for small hypergraphs, they quickly become illegible when the number of nodes and hyperedges increases. One strategy is to extend node-link diagrams (as used in standard graphs) with additional visual cues to represent hyperedges. An example is Bubble Sets, 39 which draws ’bubbles’ around related nodes to indicate set membership. Subsequent techniques refined the idea of region hulls for better clarity.40,41 Oliver et al. 42 introduced a polygon-based visualization method using iterative simplification to reduce overlaps and enhance readability for large-scale hypergraphs. While significantly improving scalability and visual clarity over traditional layouts, their method has limitations: oversimplification can obscure key structures, and some visual clutter persists. To address these, they propose a structure-aware simplification technique that prunes and adjusts congested areas, preserving critical relationships like prominent hyperedge cycles or community connections. Their method significantly improves scalability and visual clarity for abstract hypergraphs. But in hypergraphs of image collections, where many hyperedges can overlap the same set of images, their simplification process merges away important distinctions. Even though the process can be reversed (e.g. when zooming in), the resulting visualization would still suffer from severe overlaps that make it unreadable.
MetroSets 43 uses a metro map metaphor, drawing hyperedges as colored lines that run through the member nodes laid out along a schematic map. This approach is visually appealing for datasets whose sets can be meaningfully arranged as multiple paths, such as temporal progressions or other inherently ordered groupings; but it struggles with arbitrary hypergraph structures or too many overlapping hyperedges. Others have introduced timeline- and matrix-based visualizations, which offer greater scalability. For instance, PAOHvis44,45 uses a timeline layout to represent dynamic hypergraphs, allowing users to compare hyperedges over time. While effective for datasets with fewer than 100 hyperedges, its scalability remains limited. Matrix-based techniques, such as Hyper-Matrix, 15 provide a more structured representation by organizing hyperedges and nodes into a grid and use semantic zooming to visualize the matrix at different scales. Set Streams 46 and HyperStorylines 47 take a similar approach to visualizing hypergraphs, and, like Hyper-Matrix, are specifically aimed at visualizing temporal hypergraphs. These methods support extensive interactivity, such as filtering and hierarchical grouping, and demonstrate scaling to medium-sized datasets with several hundred elements.
In Ref. 48 it is highlighted that, despite the increasing use of hypergraphs in various domains, visualization techniques remain underdeveloped and several challenges remain. The most critical limitation is scalability: no existing technique effectively handles hypergraphs with thousands of nodes or hyperedges. This limitation stems from the visual clutter created by dense, overlapping relationships, which can quickly become overwhelming and disorienting for a user. The challenge is particularly acute for the image collections in our scope; unlike abstract nodes, each image is a visually rich item that requires significant screen space, making clutter a barrier to effective analysis and limiting the applicability of current methods.
Overall, existing techniques struggle to scale to large, image centric hypergraphs with dense overlap. This motivates the need for new visualization approaches that can support scalable, interpretable analysis of such data, which we address in this work.
Proposed method
We start by considering the design criteria for our visual analytics solution. These criteria were derived from the requirements identified in the introduction and informed by three sources: prior literature on multimedia and hypergraph visualization, earlier work on real-life image collections, practical experience of the first author with the analysis of complex investigative image collections, and iterative discussion with co-investigators and multimedia scientists. Then we go into the representation of CICs by hypergraphs, and how to construct such a representation. Next, we introduce our interactive visualization method. Finally, we detail how constructed hypergraphs can be evaluated against a ground truth.
Design criteria
To effectively support the exploration and analysis of CICs, we derive a set of design criteria from the problem formulation and prior literature. While loosely inspired by the comparison framework proposed by Fischer et al., 48 our criteria are not limited to visualization alone, but also address model construction, domain constraints, and the need to support analysis at both the image and hypergraph levels. We organize the criteria into three groups:
C1: Overlap-capable data model. The underlying representation must allow images to belong to one or more groupings, so that multi-label and overlapping relationships can be expressed when they occur.
C1.1 Complex Image Collection Model: The approach should be capable of representing complex, overlapping, and non-exclusive relationships among images, often present in real-world image collections;
C2: Unsupervised construction. The system must support constructing representations directly from raw, unannotated image data.
C2.1 Model Construction: The approach should include the construction of the CIC model directly from raw image data;
C2.2 Robust to Unseen Categories: The approach should operate effectively on specialized image collections that deviate from generic datasets. It must capture not only objects but also higher-level aspects such as locations, themes, and settings, without relying on labeled training data or predefined categories.
C3: Expert-workflow-aligned analysis. The system must support scalable, interpretable analysis aligned with the expert workflow. This involves enabling iterative exploration and search, preserving context during navigation, and maintaining responsiveness on available hardware.
C3.1 Scalability: The approach should be capable of handling image collections ranging from 1000 to tens of thousands images, and hundreds of hyperedges. In particular, the hypergraph visualization must scale without inducing visual clutter.
C3.2 Multi-Level Exploration: The approach should support analysis at both the individual image level and the structural hypergraph level, allowing users to move fluidly between content and structure during exploration.
C3.3 Dynamic Exploration and Search: The approach should support an iterative analysis process by allowing users to transition between exploratory analysis and targeted search. To this end, it must provide interactive functionalities such as dynamic filtering, panning, zooming, querying, and annotation, enabling users to inspect details at varying scales. Additionally, the system must maintain real-time or near-real-time responsiveness to support iterative hypothesis testing and analysis.
C3.4 Orientation and Context Preservation: To avoid cognitive overload, the approach should maintain orientation by helping users keep track of their position within large-scale hypergraphs and understand how local views relate to the overall collection, while preserving context when moving between levels of detail.
C3.5 Usability, Interpretability, and Performance: The interface should be designed to minimize the learning curve for domain experts by being intuitive and user-friendly, the visualization should be easy to interpret, and should work on consumer grade hardware. Together, this should result in an effective user experience.
The hypergraph model and its construction
Here, we first define the hypergraph model and outline how hypergraphs are constructed from image data. We then explain how these construction methods can be evaluated, discuss existing similarity measures and their limitations, and finally introduce our own CoverEdge Similarity (CES) measure.
To support the visual exploration and search of CICs, we require a data model that captures overlapping relationships and can be derived directly from raw visual data. We adopt a hypergraph-based representation to fulfill this role. A hypergraph is defined as an ordered pair
Constructing the hypergraph itself involves clustering raw image data in a way that allows for overlapping relationships. In this paper, we explore several approaches to hypergraph construction, acknowledging that the optimal method may vary depending on the specific characteristics of the image collection. Our goal is not to exhaustively determine the best method, but rather to evaluate a viable strategy that can effectively model complex image relationships.
Pre-classification embeddings from pre-trained classification models provide an effective basis for clustering image data. Vision Transformer (ViT) models currently achieve state-of-the-art performance in image classification. Although ViTs are not specifically trained on concepts from our CICs, their extensive pre-training allows them to capture diverse visual features. In the embedding space, visually or semantically similar images naturally cluster closely, facilitating meaningful grouping. Therefore, we use pre-trained transformer embeddings for all hypergraph construction methods explored in this study.
Most pre-trained ViTs are particularly strong at recognizing objects, but they tend to be less effective at capturing thematic content, scenes, or location-related cues. This is not an inherent limitation of the ViT architecture itself, but rather a reflection of their pre-training objectives and data. To complement this limitation, we also explore several alternative models that may be better suited to these other types of features.
To our knowledge, there are no dedicated hypergraph construction algorithms from raw data, where there are no predefined relations. We found that clustering algorithms able to assign items to multiple clusters come closest. Examples are fuzzy c-means (FCM) and possibilistic c-means (PCM). The extensive review of FCM by Askari 32 shows that despite all efforts, adjustments made to FCM perform equally or worse than the baseline FCM on almost all datasets. We therefore first experiment with FCM and PCM to build our hypergraphs. We will also adopt the hypergraph construction method that is part of Gao et al.’s retrieval and recognition process. 36
Evaluation of hypergraph construction algorithm
Since complex image collections are inherently unannotated, validating the generated hypergraph structure during an actual investigation is impossible without infeasible manual effort. To ensure our system creates reliable hypergraphs, we must therefore benchmark our unsupervised construction algorithms offline, using datasets where ground truth is available. By comparing the generated hypergraph against this ground truth, we can identify and select the best algorithm. Once validated, this method can be applied to new, unlabeled collections.
To evaluate the quality of a constructed hypergraph, we need a measure that is able to compare (large) constructed hypergraphs with the corresponding ground truth hypergraph. In our setting, this measure is not used as part of the visualization interaction, but solely to evaluate and select the suitable construction method. For good interpretation of a visualized hypergraph, the most important qualities are a low number of images with dissimilar labels within one hyperedge (high internal precision at a local level) and no over-segmentation of the hypergraph (global level). A measure of hypergraph quality should therefore capture local and global sensitivity. A hypergraph containing many hyperedges that have low internal precision is difficult for an analyst to assess, and requires many more actions to clean up. A hyperedge with too much oversegmentation may contain high precision hyperedges, but the analyst will have a much more difficult time to assess the overall content of a hypergraph, there will be increased clutter in visualization, and the analyst has to perform many additional actions to merge hyperedges to clean up the hypergraph. Computational efficiency is desirable but secondary, as the measure is only applied during method selection on annotated datasets.
As noted in the Related Work section, the measure in Ref. 12 comes closest but is not directly applicable for our use case. In their paper, they also noted that to their knowledge, no other hypergraph evaluation measure existed, which was our finding at first as well. However, we came across an adaptation of NMI to evaluate overlapping community finding algorithms. 49 These overlapping communities are nearly identical to hypergraphs, and we found that we could adopt their method for hypergraphs without making any changes. We will refer to this measure as hypergraph NMI (hNMI) in the remainder of this paper. hNMI provides a macro-level assessment by focusing on the overall similarity of the hypergraph. There is a known issue, where NMI tends to prefer solutions with more clusters because the entropy-based normalization does not properly penalize over-segmentation, 50 but the authors of Ref. 49 note that they implemented a solution for this.
The main limitation of hNMI is that it only provides a macro-level assessment of hypergraph similarity, implicitly assuming that the importance of a hyperedge scales with its size. However, in real-life image collections, smaller hyperedges can be just as significant as larger ones. Additionally, it remains unclear whether hNMI adequately resolves the known tendency of NMI to prefer over-segmented solutions. To address these concerns, we developed a new hypergraph evaluation measure that emphasizes a micro-level perspective, treating each hyperedge equally regardless of size, and explicitly penalizing over-segmentation.
Our quality measure
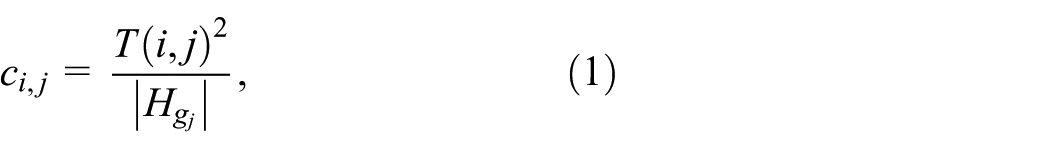
where
To score a ground-truth hyperedge
Let
Dividing by
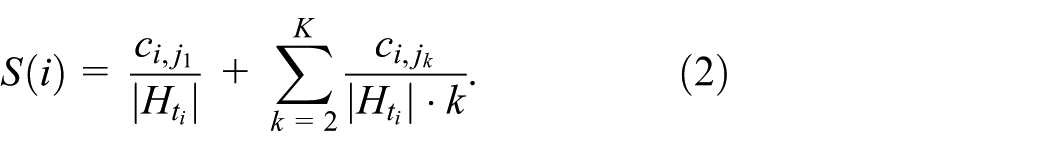
The quality measure is obtained by averaging all per-hyperedge scores:
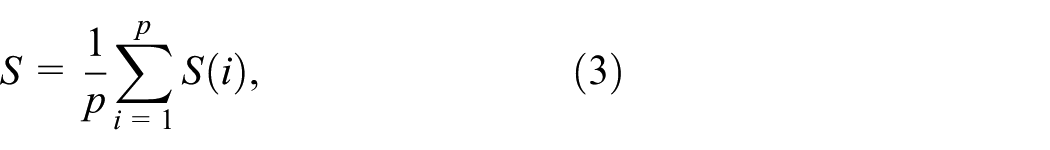
where
By multiplying

Visualization and interaction
hNMI and CES allow us to select a hypergraph constructor that can be used in our visual analytics system. Once the hypergraph has been constructed, effective exploration and interpretation depend on how it is visualized and how users can interact with it. Because exploration and search require both moving between image content and structural relationships and sometimes viewing them simultaneously, no single visualization suffices. To meet this need, our approach provides multiple coordinated views and interactive capabilities tailored to large CICs. The user can interact with the hypergraph in several ways: by visualizing it in different forms, by giving names to hyperedges (i.e. classify), and by modifying the hypergraph through merging, splitting, removing, or creating hyperedges, and removing or adding images to hyperedges.
To visualize and modify the hypergraph, the user is presented with four coordinated views of the image collection’s hypergraph.
Each view is designed to support a distinct but complementary mode of analysis. The Hyperedge List (A) provides a structured, metadata-rich perspective on the hypergraph, supporting filtering, comparison, and modification tasks. The Hyperedge Grid (B) and dynamic list with intersecting hyperedges (C) focus on detailed inspection of image content within hyperedges, while the Spatial Hypergraph Visualization (D) emphasizes spatial context and neighborhood-based exploration. Finally, the Hypergraph Matrix Visualization (E) offers a quantitative overview of hyperedge overlaps (Figure 2).
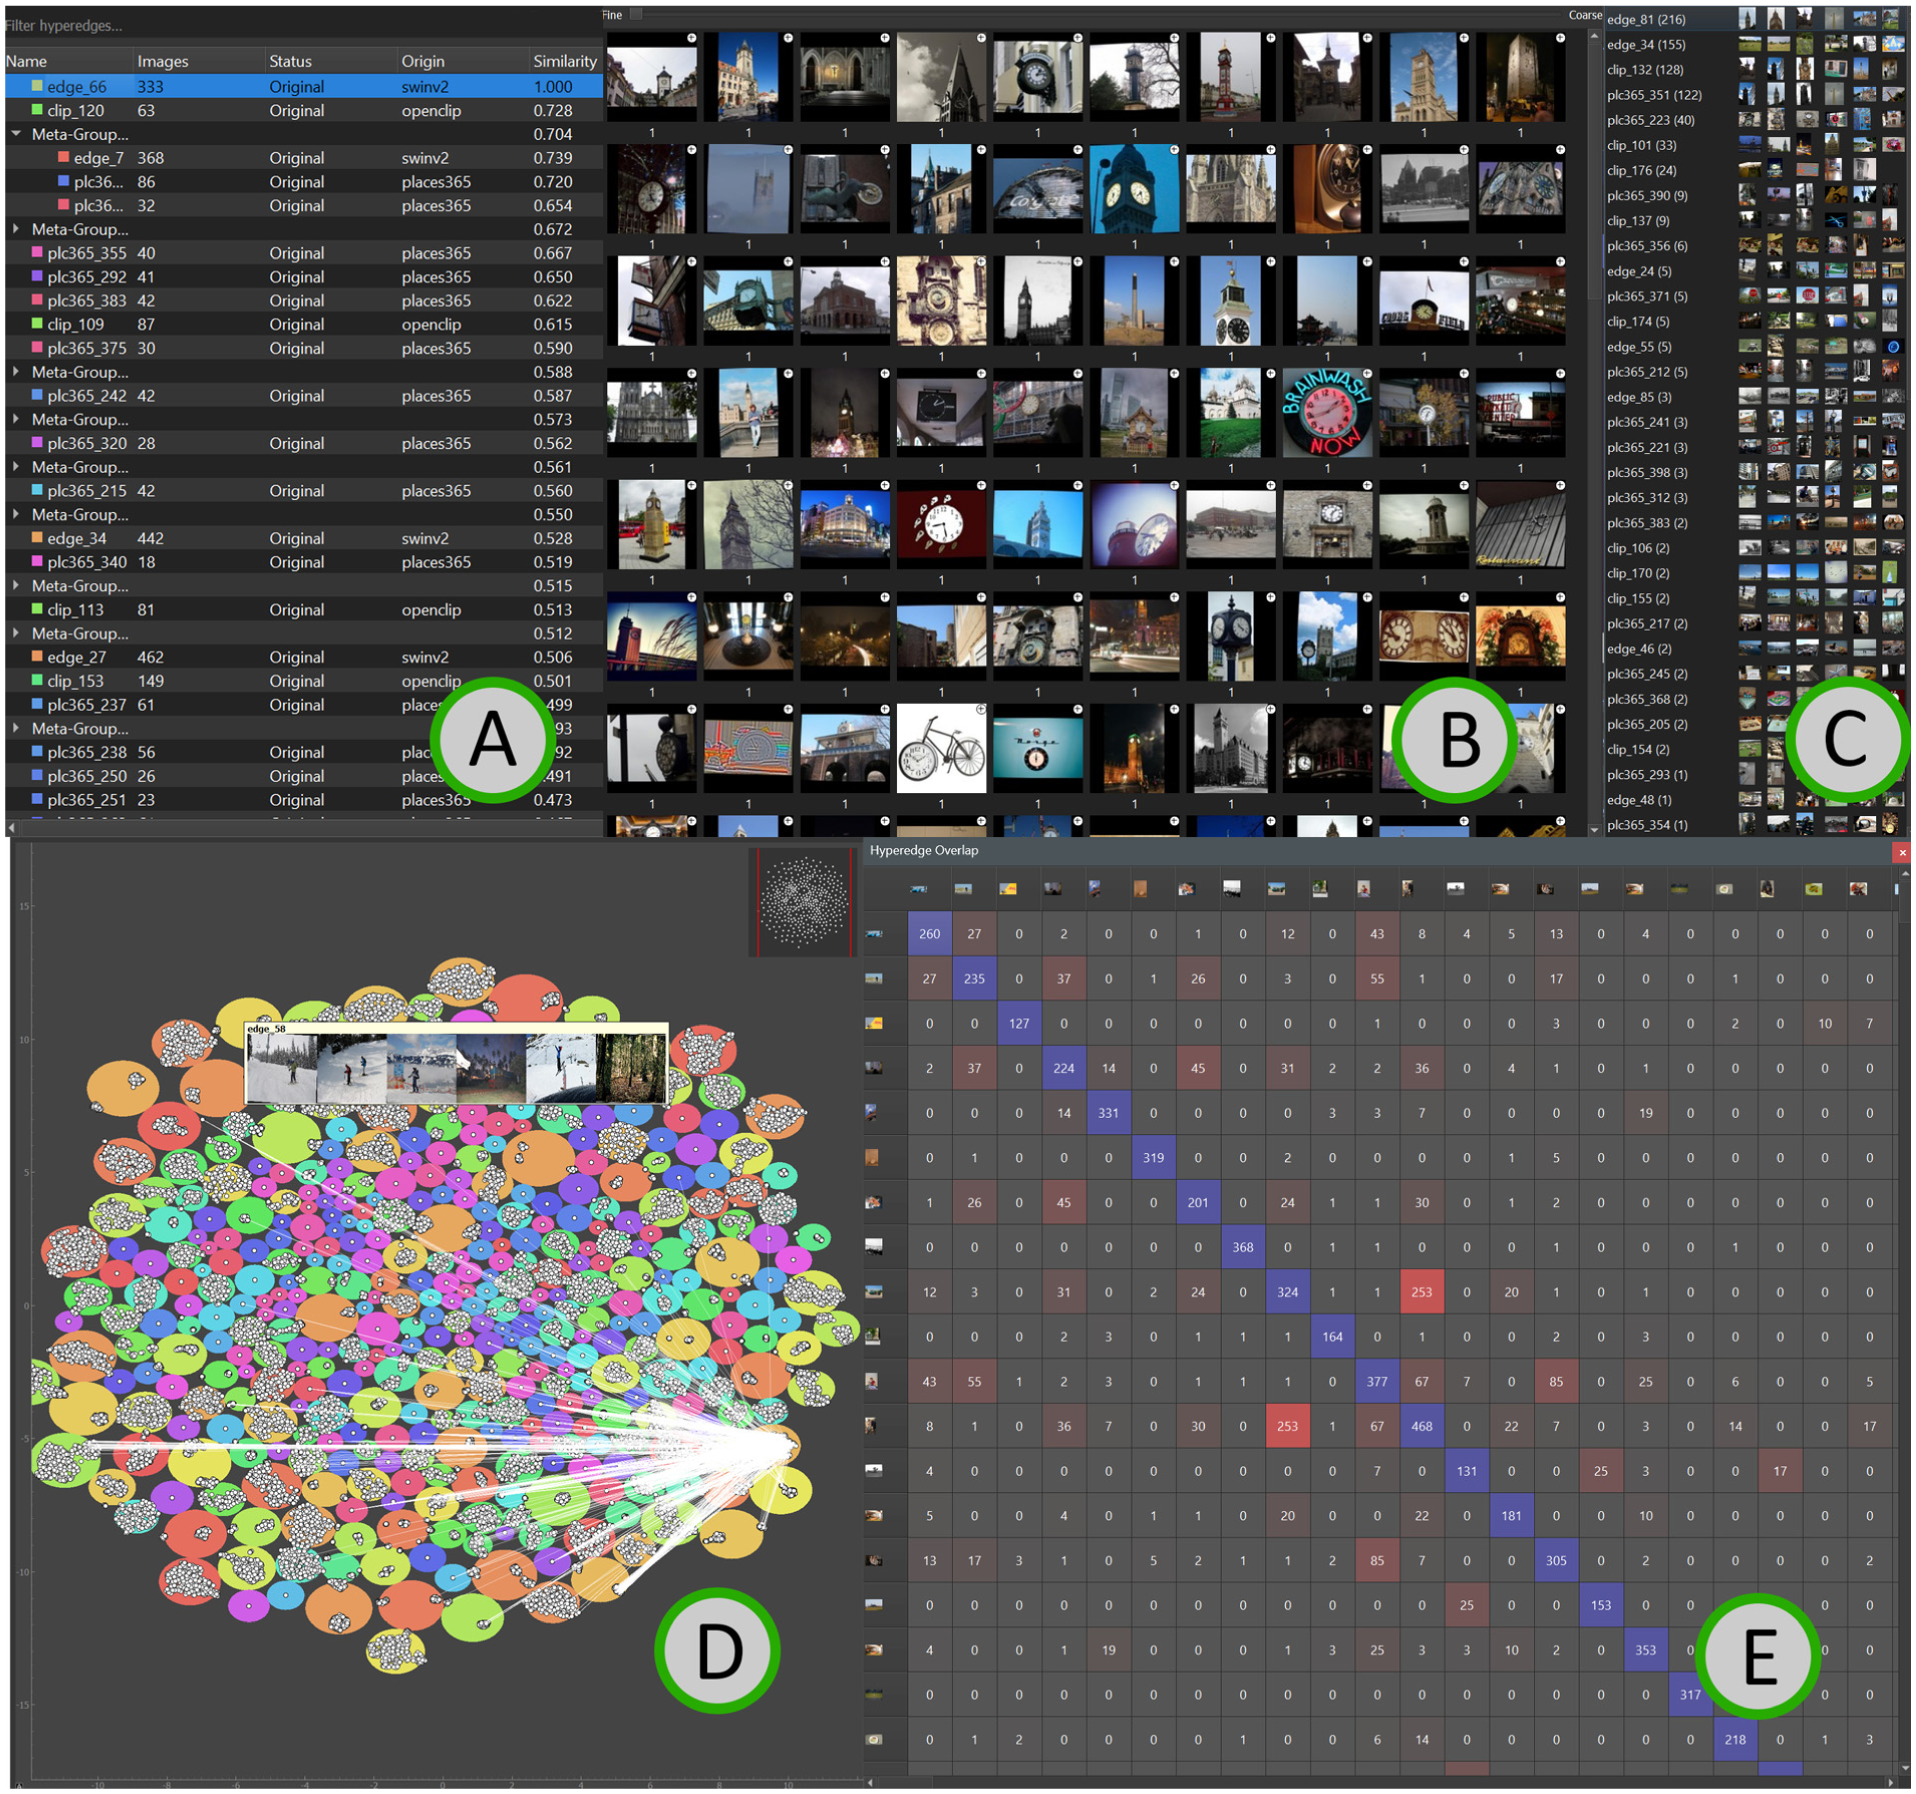
The system, with the Hyperedge list (A, top left), Grid visualization (B, top middle) with intersecting hyperedges of the selected hyperedge (C, top right), Spatial Hypergraph visualization (D, bottom left) and the Hypergraph matrix visualization (E, bottom right). The visualized hypergraphis based on the DSEG660 image collection, constructed with TEMI.
User interactions in one view can instantly inform and update the others, ensuring a cohesive, synchronized exploration experience that helps (Criterion 3.4) orientation and navigation as the user navigates through large-scale image collections.
Hyperedge list (A) Because hypergraphs may contain hundreds or thousands of hyperedges, users need a scalable, sortable, and queryable overview that exposes structural properties. The Hyperedge List contributes directly to scalability (Criterion 3.1) by enabling rapid filtering, comparison, and modification of hyperedges (Criterion 3.3). The indicators of origin, status, and similarity further support orientation and context preservation during extended analysis (Criterion 3.4).
The Hyperedge list provides a comprehensive overview of all hyperedges in the current collection. Users can filter hyperedges by name and are presented with several informative columns: the number of images in each hyperedge, its status (indicating whether it has been modified by the user), its origin (e.g. embedding model, metadata, or user-generated), and the standard deviation of cosine similarity among the images within the hyperedge, relative to the hyperedge’s average embedding, which is a rough indicator of internal coherence. To aid comparative analysis, users can select a hyperedge and sort all others based on cosine similarity, with the resulting scores displayed in a dedicated column. The interface also shows the intersection size between the selected hyperedge and others, helping to identify overlap. To organize a possibly long list of hyperedges, the user can group similar hyperedges into meta-edges based on
Automatically constructed hyperedges are initially unlabeled or given provisional identifiers in the Hyperedge list; meaningful names such as “Cockpit” or “Impact damage” are assigned by the analyst during their workflow. Users can also add a new hyperedge or select a hyperedge to display its content, add or remove images, remove the hyperedge, or query the image collection based on the hyperedge.
Hyperedge Grid Visualization (B) and dynamic list with intersecting hyperedges (C) The Hyperedge Grid Visualization allows both quick assessment and detailed understanding of a user-selected hyperedge, the results of a query, or a selection of images from one of the other views. Because hyperedges can range from only a few images to many thousands, this view must support both detailed inspection and scalable summarization. The Hyperedge Grid provides a direct and interpretable layout of images together with hierarchical clustering to achieve scalable summarization (Criterion 3.1) and enable multi-level exploration at both the hyperedge and individual image levels (Criterion 3.2). Its interactive capabilities, including adjustable clustering, region-of-interest selection, and integration with hyperedge and image queries, facilitate exploratory analysis and support the interpretation of targeted searches (Criterion 3.3). A consistent layout and visual status markers further help maintain orientation and context during extended analysis (Criterion 3.4).
The Hyperedge Grid Visualization presents a scrollable main grid of images, each displayed at 128 × 128 pixels (user adjustable). Users can select images from the grid to add them to a hyperedge or to use them as input for a query. Double-clicking an image opens a full-sized version, displays its metadata, and allows the user to select a region of interest for further querying. Since some hyperedges may contain hundreds or even thousands of images, this view can quickly become overwhelming. To address this, we implement with Ward agglomerative clustering (using cosine similarity over image embeddings) within each hyperedge. A slider allows the user to consolidate the displayed images into subclusters based on this hierarchy. In consolidated mode, each cluster is represented by the image whose embedding is closest to the cluster centroid under cosine similarity, and clusters are shown in descending order of size. Each subcluster can be individually expanded or collapsed, enabling a hyperedge with a thousand images to be reduced to a compact summary, such as two representative subclusters. This interaction is purely presentational and does not modify the hypergraph itself. The Hyperedge Grid Visualization is shown in Figure 3.
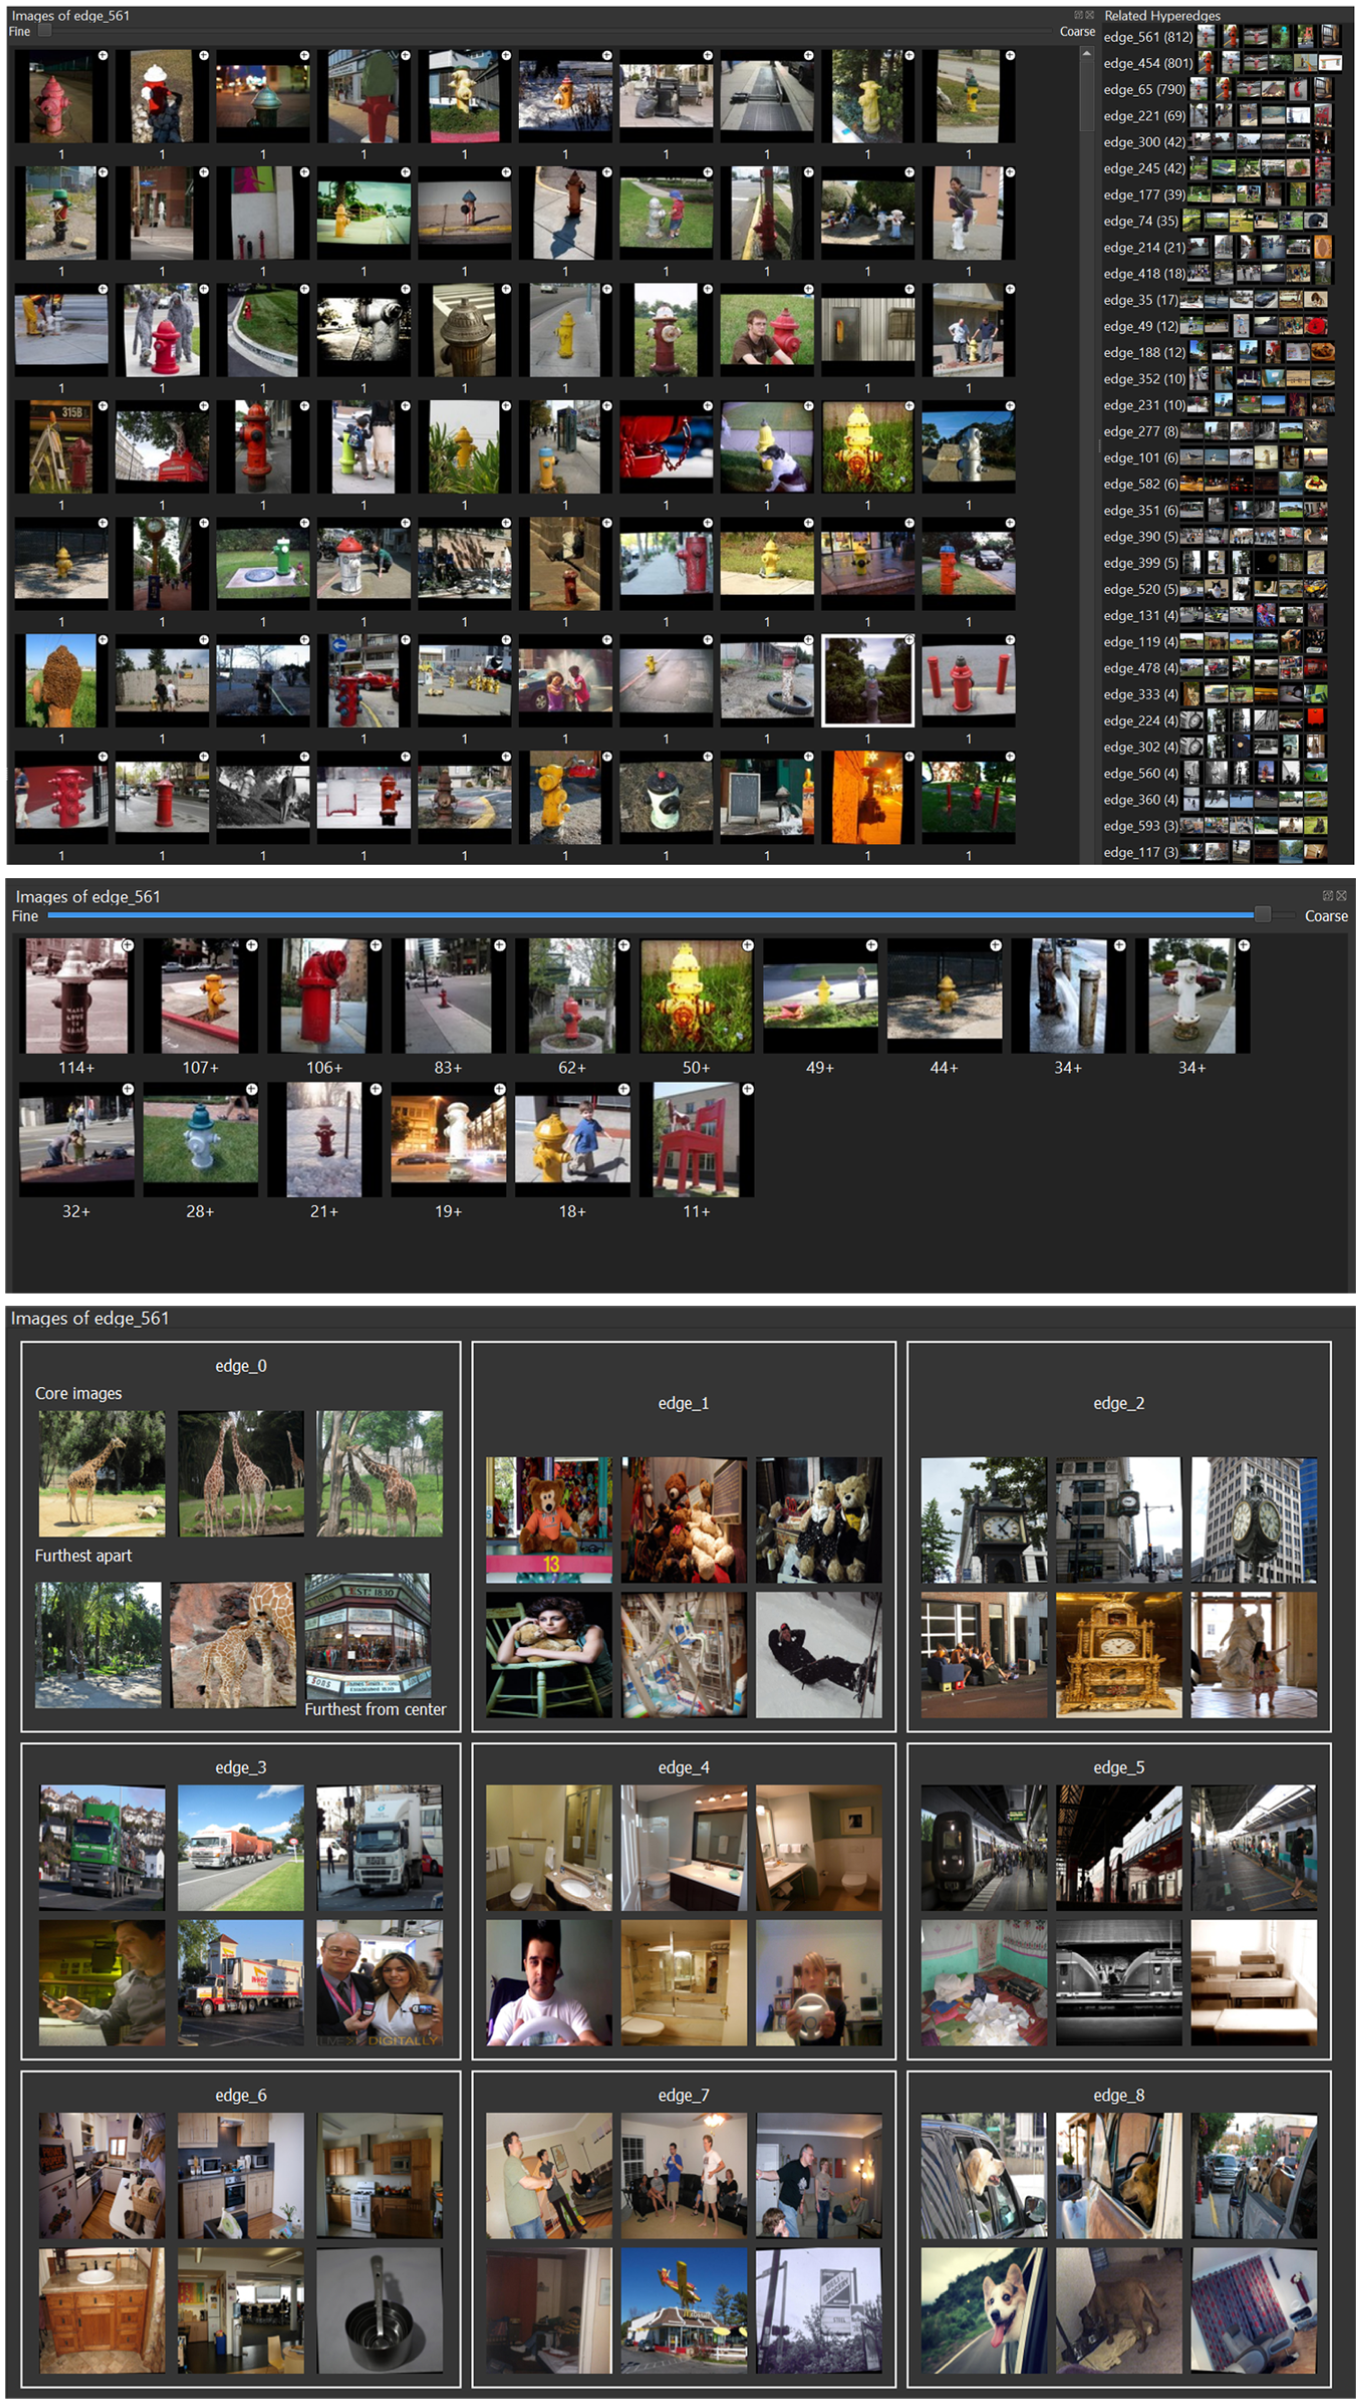
Detailed view of the Hyperedge Grid Visualization and dynamic intersecting hyperedge list, corresponding to panels B and C in Figure 2. Top: the Hyperedge Grid Visualization (B) displays the currently selected image set, while the adjacent dynamic list (C) shows hyperedges that intersect with the displayed images. Middle: consolidated grid view using agglomerative clustering; the dynamic list is omitted for compactness. Bottom: overview mode in which each hyperedge is represented by its six-image representative set; the dynamic list is omitted for compactness.
The Hyperedge Grid can also display an overview of all hyperedges in the hypergraph. Each hyperedge is summarized by a six-image representative set in a 2 × 3 layout. The top row contains the three images most similar to the hyperedge centroid, providing a compact view of its core content. The bottom row contains the pair of images with the lowest mutual similarity, exposing internal variation within the hyperedge, together with one additional image that is farthest from the centroid among those not already selected. This summary is precomputed per hyperedge and updated when the hyperedge membership changes.
Adjacent to the grid is a dynamic list showing all hyperedges that contain any of the currently displayed images. Each hyperedge in this list is represented using the same six-image summary and is annotated with the number of intersecting images it shares with the current grid selection (top right in Figure 2). Hyperedges are sorted by decreasing overlap.
To help users prioritize and keep track of their interactions, images displayed on the Hyperedge Grid as part of a query result are visually marked based on their status. Images belonging to hyperedges that have been modified by the user are outlined with a colored border, while those that are part of the most recently selected hyperedge are marked with a different color. Images that have not been interacted with remain unmarked. Users can choose to hide all bordered images, allowing them to focus on previously unexamined images. This aids efficient navigation and prioritization during analysis. To maintain responsiveness, thumbnails are loaded lazily and prefetched around the visible viewport.
Spatial Hypergraph Visualization (D) When a single hyperedge is selected, the view adds a local relational layout. Image nodes are shown for the selected hyperedge and for hyperedges that intersect it. Within each hyperedge, image nodes are positioned using normalized 2D image embeddings scaled to the hyperedge radius. Cross-hyperedge links are rendered only between image nodes that correspond to the same underlying image in the selected hyperedge and an intersecting hyperedge. To control clutter, the system can restrict the visualization to the top-
To preserve context during navigation, the detailed image layer is shown only below a zoom threshold, while a minimap and lasso-based selection support orientation and region-based exploration.
The Spatial Hypergraph Visualization is designed to achieve two primary goals. First, it supports analysis and exploration at the structural hypergraph level by providing users with an intuitive 2D spatial overview, where closeness between hyperedges represents similarity. Second, it supports analysis and exploration at the image relational level. Traditional node-link diagrams can express shared memberships but do not scale to the number of potential cross-hyperedge relations and offer no spatial encoding of hyperedge similarity. Matrix- or set-based representations capture overlaps but do not support neighborhood-based exploration, multi-level inspection, or spatial context. To meet these requirements, we adopt a design that combines two separate UMAP embeddings with selective, on-demand rendering of cross-hyperedge links. This approach provides scalable spatial proximity cues (Criteria 3.1 and 3.4), supports multi-level exploration between hypergraph structure and image content (Criterion 3.3), and avoids the global edge clutter inherent to node-link alternatives.
Following Fischer et al., 48 scalability concerns in node-link hypergraph visualizations arise primarily from vertex-edge density, where nodes represent vertices and edges represent hyperedge memberships. Our Spatial Hypergraph Visualization inverts this representation: we display hyperedges as nodes, do not draw global edges, and reveal vertex-level detail only on demand. This design avoids the density-driven scalability limitations described by Fischer et al.
According to the scalability levels defined by Fischer et al. approaches that support more than 1000 nodes (images in our case) are classified as “Very High” scalability. Our system handles image collections of more than 10,000 images and around 200–400 hyperedges, which is an order of magnitude above the threshold for their highest scaling category. Moreover, because the Spatial Hypergraph Visualization displays only hyperedges at the global level and reveals vertex-level detail only on demand, it avoids the global edge clutter that Fischer et al. identify as the primary limitation of node-link approaches. In this sense, our method not only meets but exceeds the scalability criteria outlined in the survey.
At the hypergraph level, each hyperedge
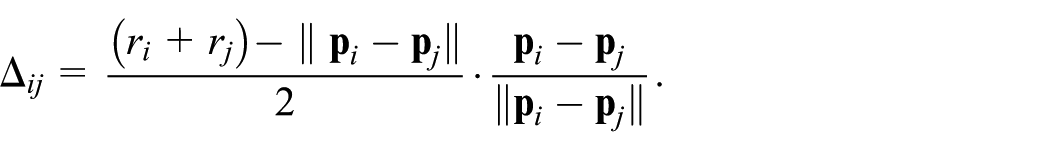
We then update
This preserves the neighborhood structure from the projection as much as possible while making sure that all hyperedges remain visually separable.
When zooming in on a specific hyperedge node, inside the hyperedge node the image nodes will be shown. The image node locations within the hyperedge node are also determined by a per hyperedge generated 2D UMAP projection (Figure 4). For the global hyperedge layout, as well as for the image node locations, we use the default values for the UMAP projection with
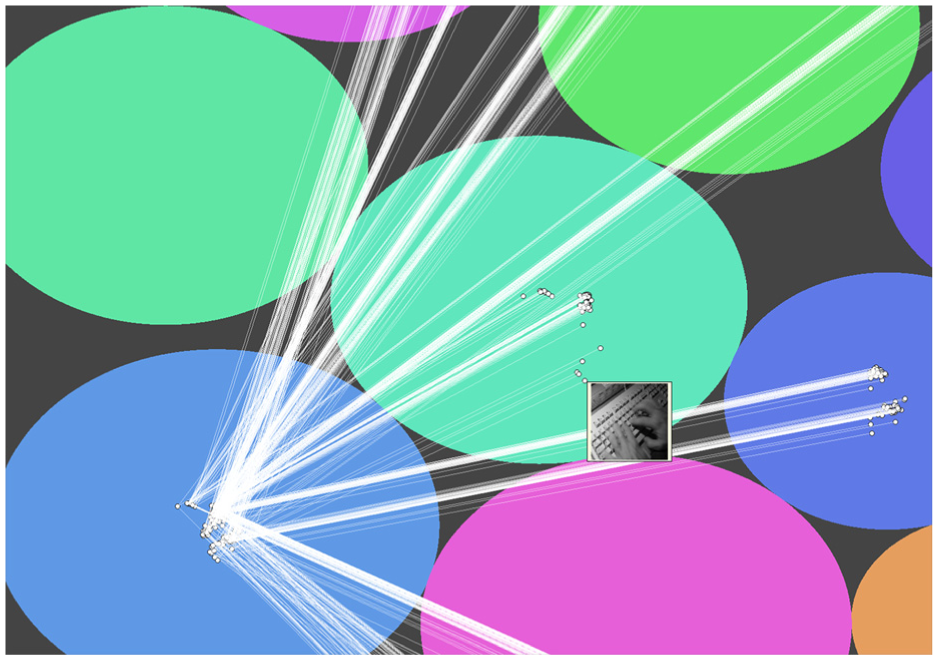
Detailed zoom into the Spatial Hypergraph Visualization, corresponding to panel D in Figure 2. At the global level, hyperedges are shown as spatially arranged circular nodes; when zooming into a selected hyperedge, individual image nodes become visible and are positioned using the internal hyperedge UMAP projection. Images closer together are likely to be more similar.
This selective display ensures that the visualization does not suffer from the scalability limitations of conventional node-link diagrams, which typically display all edges simultaneously (Criterion 3.1). Instead, the use of two independent UMAP embeddings (one for the hypergraph level and one per hyperedge) combined with a hierarchical, zoom-based exploration approach keeps the interface interpretable even for large datasets, without overwhelming users with exponentially growing edge structures.
Users can interactively zoom and pan the view. Hovering over a hyperedge node displays a tooltip with the six-image summary, and hovering over an individual image node gives a tooltip with a thumbnail preview of the image. Users can use a lasso tool to select multiple image or hyperedge nodes, for which the links are then highlighted in a different color, and the images are displayed on the Hyperedge Grid.
To help users locate specific hyperedges from the Hyperedge List within the Spatial Hypergraph View, we implemented dynamic highlighting. When a user selects a hyperedge in the Hyperedge List, its corresponding node(s) in the Spatial Hypergraph View are emphasized with a short pulsing animation and a distinct highlight color. Similarly, when one or more images are selected in the Hyperedge Grid, all hyperedges containing those images are highlighted in the same manner, and their connecting links are rendered in a distinct color to further aid identification.
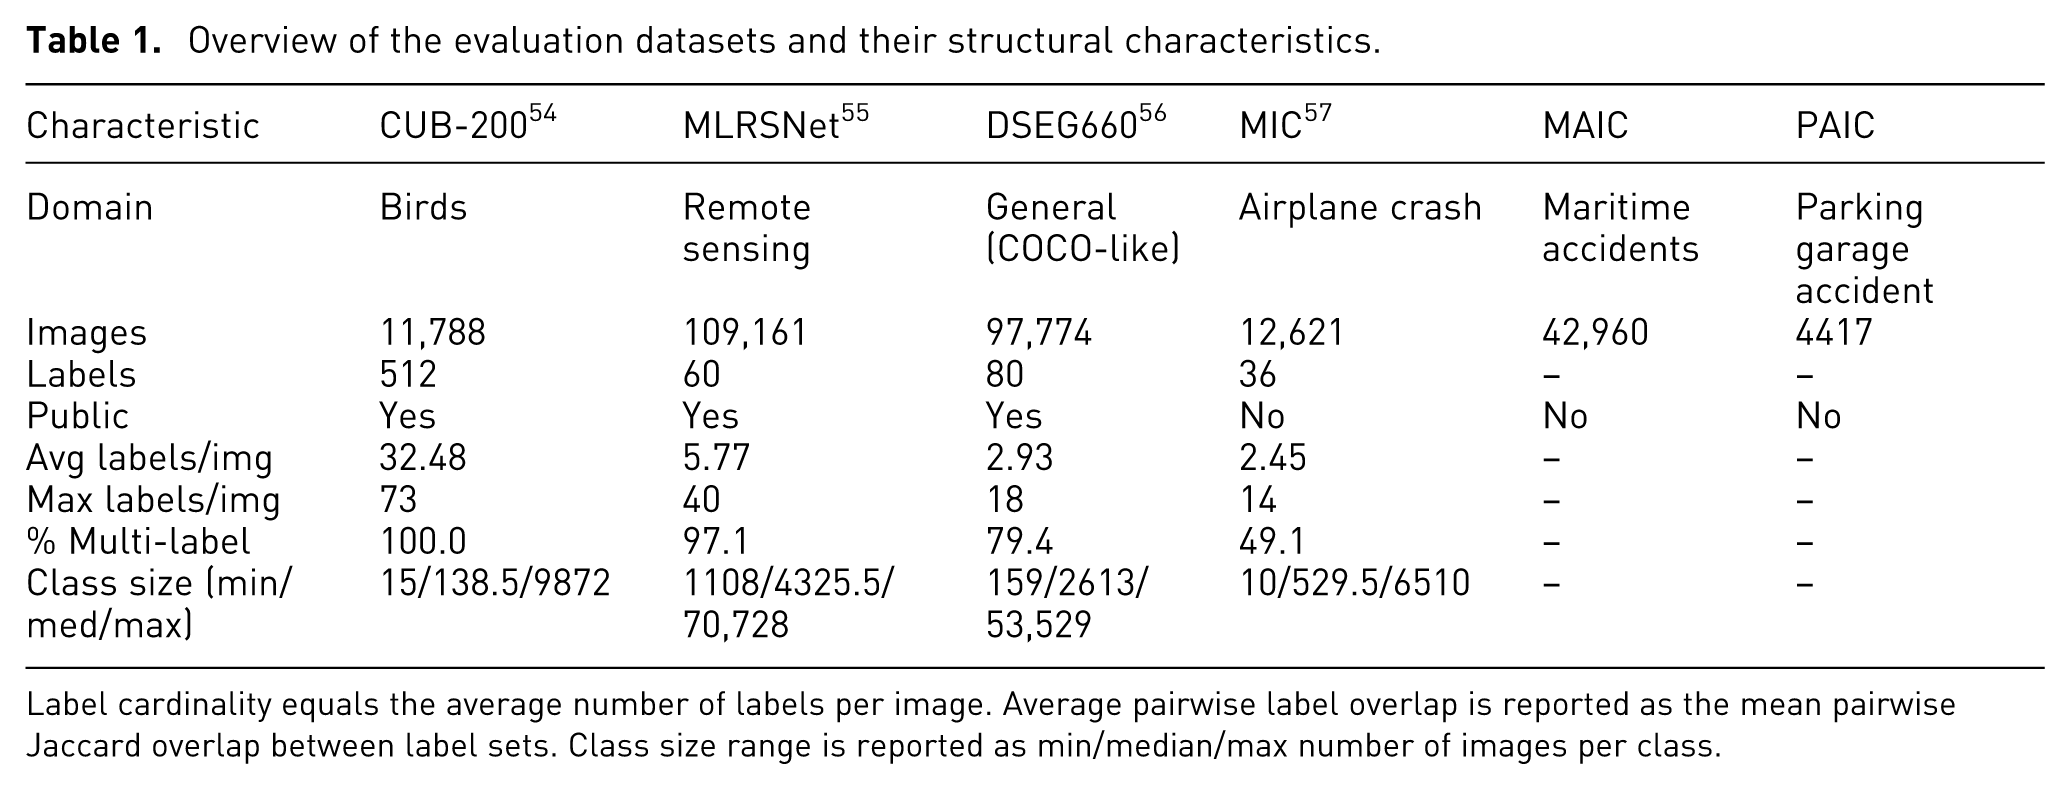
Hypergraph Matrix Visualization (E) The Hypergraph Matrix Visualization addresses the need for a scalable, quantitative overview of relationships between hyperedges, supporting multi-level exploration at the structural hypergraph level. The matrix contributes directly to scalability (Criterion 3.1) by summarizing all pairwise relations in a dense yet interpretable format, and to multi-level exploration (Criterion 3.4) by enabling users to shift smoothly from structural analysis to image-level inspection via coordinated interactions with the Hyperedge Grid Visualization. The Hypergraph Matrix is computed only over the actual hyperedges in the current hypergraph. For hyperedges
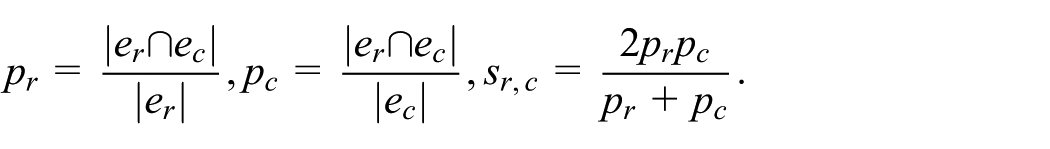
This score highlights pairs that overlap strongly relative to the sizes of both hyperedges, rather than favoring large hyperedges with high absolute intersection counts. Cell colors encode the harmonic mean of overlap, ranging from dark gray (minimal) to red (maximal). Each hyperedge row and column is accompanied by a representative image, allowing quick visual assessment of its contents. Hovering over a cell shows a tooltip with the six-image summary for each of the respective hyperedges (Figure 5).
Detailed view of the Hypergraph Matrix Visualization, corresponding to panel E in Figure 2. Rows and columns represent hyperedges, with representative images and names shown along the margins. Each cell shows the overlap between two hyperedges, and hovering over a cell displays the six-image summaries of the corresponding hyperedges.
Selecting a cell displays the set intersection
Cross-view interactions and the visual analytics loop To facilitate the visual analytics process of integrating automated analysis with visual inspection and analytical reasoning, 52 the system couples machine-generated hypergraph construction, similarity-based comparison, and query mechanisms with coordinated views and direct hypergraph refinement. Analysts can inspect the constructed structure, formulate and verify hypotheses across views, and iteratively refine the hypergraph by naming, merging, splitting, creating, or extending hyperedges. To support this iteration loop without causing cognitive overload, the system must keep the user’s mental model synchronized with the data.
To help users maintain an overview of progress and status, hyperedge node colors can be switched to reflect state (e.g. modified, new, original) or origin (e.g. user-created, model-based), and in all cases the node colors are kept synchronized with the corresponding entries in the Hyperedge list.
Selecting images or hyperedges in one view, highlights these in the other views, and users can double click an image to view the full size original, and metadata (if available). Zooming, querying, and selection do not alter the global hypergraph layout itself; instead, they reveal or highlight additional detail within a stable overall context that is preserved across the coordinated views. Any modification to the hypergraph, such as merging, splitting, renaming, or reassigning images to hyperedges, instantly updates across all views. For new or adjusted hyperedges, the six-image representative set is recalculated. These updates ensure that the user always works with a consistent view of the data. Each visualization can be resized and detached from the application window, for example for display on a second monitor.
To compare hyperedges
Items (images) within a hyperedge can be ordered and compared using cosine similarity of their embedding vectors,
We implemented several methods for querying the image collection:
Image query: Uses the average feature vector of one or more selected images.
Hyperedge query: Uses the average feature vector of a selected hyperedge.
ROI query: Uses the feature vector of a user-selected region within an image.
Clipboard query: Uses the feature vector of an image from the operating system clipboard.
Text query: Uses an OpenCLIP embedding of a textual description.
The queries can be used to find additional images to add to a specific hyperedge, or to create entirely new hyperedges. The text query specifically is not just useful for finding specific objects, but also works well for more abstract, thematic queries.
While the constructed hypergraph is based on visual similarity, metadata can offer an alternative perspective on the image collection. To support this, users are provided with tools to generate hyperedges based on metadata. A dedicated interface displays all available EXIF metadata fields present in the collection, along with an overview showing the number of images that contain a valid (non-empty) value for each field and the number of unique values it contains. With a single action, the user can add a metadata field to the hypergraph. This results in the creation of a general hyperedge containing all images with a valid value for that field, as well as separate hyperedges for each unique value (in the case of categorical data), or a binned range (in the case of continuous values), each containing the corresponding subset of images. These hyperedges are automatically named based on the metadata field and value, and are labeled as originating from “metadata” in the Hyperedge List for easy identification. In the Spatial Hypergraph View, metadata-based hyperedges are positioned along the right edge to distinguish them from visually derived hyperedges.
To make our UI as accessible as possible, both for new and for infrequent users, we use text buttons with a clear description of their function as opposed to icons. 53
While the system does not enforce a fixed analysis workflow, each visualization provides distinct analytic cues that support different exploration strategies. The Hyperedge List supports prioritization by allowing users to quickly identify hyperedges with many members or many intersections, which often indicate broad or ambiguous concepts worth closer inspection. The Spatial Hypergraph View emphasizes relational structure: proximity and overlap between hyperedges highlight potential semantic associations and candidate intersections. The Hypergraph Matrix View provides a dense, overview-oriented representation in which blocks of high overlap draw attention to systematic relationships between concepts that may otherwise remain unnoticed. Finally, the Hyperedge Grid View supports fine-grained inspection and refinement, enabling analysts to validate, relabel, split, or extend hyperedges based on the actual image content. Analysts may enter this process from any view and transition between views as emerging patterns suggest new hypotheses. Figure 6 shows how an expert could use our approach to analyze a complex image collection. When the constructed hypergraph has no meaningful intersections or near-complete overlap of each hyperedge, this condition is immediately apparent in the overlap matrix and serves as a diagnostic cue: analysts can infer that the construction threshold may be overly strict or overly permissive, respectively, or determine that the dataset itself contains few (or only) overlapping images, and decide whether a new hypergraph should be constructed with adjusted parameters.
Typical sensemaking workflow with our method for a CIC (in this case, the MH17 image collection). The visualizations and in which order they are used is entirely up to the expert. But an example workflow could be as follows. The expert would first construct the hypergraph (1), then select (2) and visualize a hyperedge from the Hyperedge list using the Hyperedge Grid (3) and give it a label based on its content (4). Once the expert has given some structure by labeling, the Hypergraph matrix can be used to see if there are any interesting overlaps (5) between the cockpit and the fuselage hyperedge. The intersecting images can then be displayed (6) and the expert may see there are indeed images that depict the fuselage of the cockpit specifically. The expert can then decide to make a new hyperedge for this (7) and visualize the new hyperedge on the Spatial Hypergraph (8) to find additional candidates for this hyperedge. Using the lasso tool (9) these can be displayed on the grid and any relevant images can be added to the hyperedge (10).
Evaluation of hypergraph construction
In this section, we first describe the complex image collections used as evaluation benchmarks. We then validate the hypergraph similarity measures, CES and hNMI, which we need to evaluate which construction methods yield useful hypergraphs. Next, we present the results of the hypergraph construction algorithm evaluation.
Image collections
To evaluate our method, we seek multi-label image collections that vary in visual similarity and category diversity while also resembling the type of image collection encountered in real-life investigations. Fully annotated multi-label datasets are relatively scarce, and most public benchmarks consist of images that share labels but are otherwise unrelated. In contrast, real-world investigative collections often contain richer relationships, such as images depicting the same object, location, or event across time.
We therefore select a combination of public and confidential datasets that together capture a range of relevant characteristics. MLRS represents an interesting modality (remote sensing) frequently encountered in investigative contexts, while CUB-200 provides a challenging setting with high visual similarity between classes. DSEG660 serves as a representative of conventional benchmark datasets with less inherent complexity. Finally, confidential investigative collections are included to reflect realistic scenarios with complex, overlapping relationships between images.
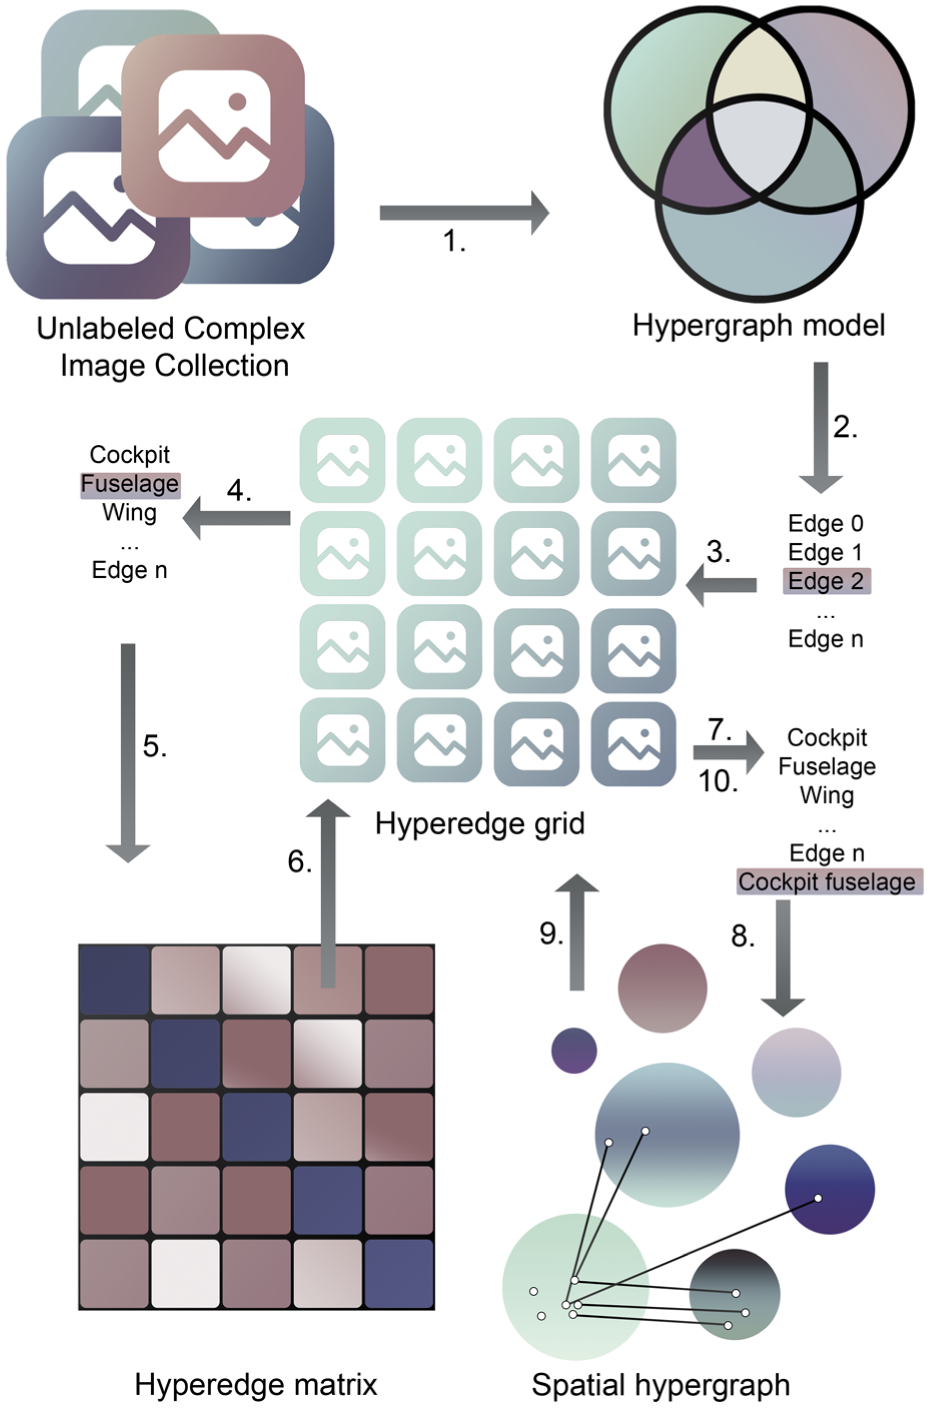
Table 1 provides an overview of the datasets used in our evaluation. CUB200, MLRS, DSEG660 and MIC are used to evaluate hypergraph construction methods. Example images shown are from publicly released images. The MH17 image collection (MIC), Marine accident image collection (MAIC) and Parking garage accident image collection (PAIC) are used for the domain expert user evaluation sessions and are image collections used during actual accident investigations. Figure 7 shows samples of these collections. For the other collections we refer to their respective references.
Overview of the evaluation datasets and their structural characteristics.
Label cardinality equals the average number of labels per image. Average pairwise label overlap is reported as the mean pairwise Jaccard overlap between label sets. Class size range is reported as min/median/max number of images per class.
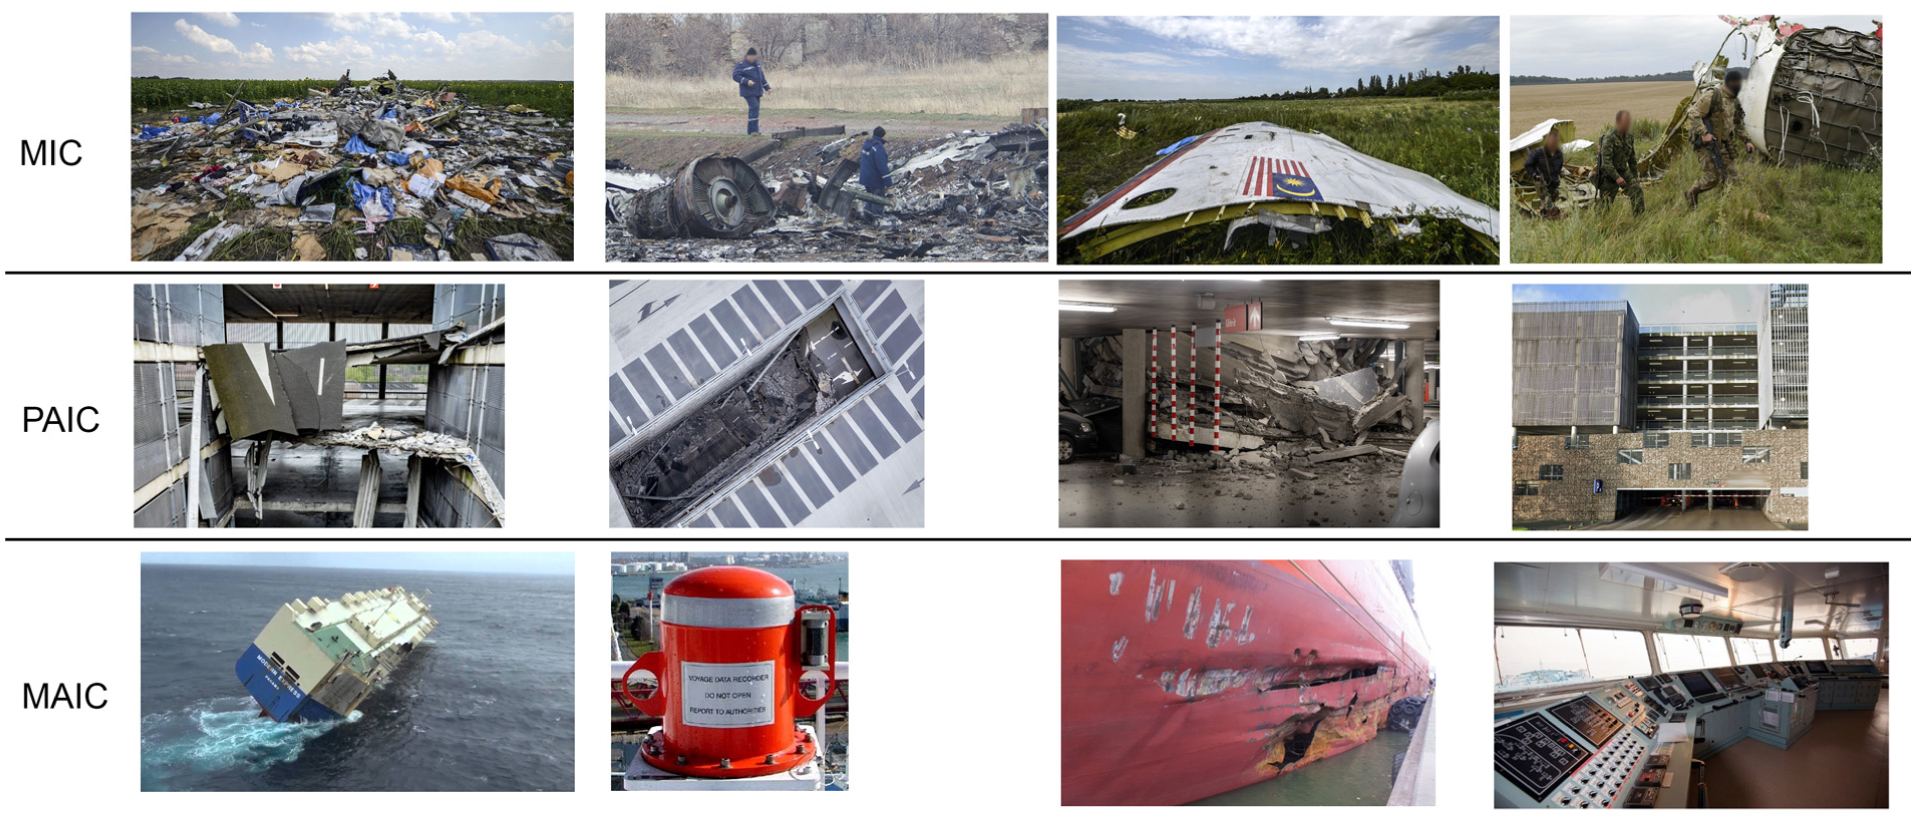
Some examples of the images in the accident investigation image collections.
Hypergraph similarity measure validation
As noted in the Design criteria section a high quality hypergraph that is optimal for visualization contains hyperedges with high internal precision and no over-segmentation. To assess whether CES and hNMI are able to distinguish low quality hypergraphs from high quality hypergraphs, we performed several experiments with synthetic hypergraphs. For comparison, we also implemented the Tensor-Hamming and Tensor-Centrality measures from Ref. 12 Although Tensor-Spectral (Tensor-H) is their best performing measure, due to proprietary code we were not able to implement it, and due to limitations of these measures, not all experiments could be performed with the tensor measures. Since the validation of the hypergraph similarity measure is not the main focus of the paper, results for the tensor methods, as well as more detailed results can be found in the Supplemental Materials.
We first test the robustness of the similarity measures by increasingly perturbing the hyperedges of a ground truth hypergraph and then comparing it to the initial ground truth hypergraph. A good similarity measure should show a monotonically decreasing similarity score with increasing perturbation. This shows us whether a measure is able to distinguish low precision hyperedges from high precision hyperedges.
The initial ground truth hypergraph is created using the Erdős–Rényi (ER) hypergraph constructor. 58 We perturb this ground truth hypergraph in two ways. First, we replace a percentage of hyperedges with hyperedges with the same number, but randomly chosen vertices. Second, for a percentage of hyperedges, we replace a vertex with a random other vertex not already in the hyperedge. Both experiments give us similar results, with hNMI following the perturbation percentage almost perfectly and CES deviating only a little.
As noted in the Hypergraph Model subsection, hNMI and CES in theory differ in macro versus micro level. To see if this is the case in practice, we measure the effect of perturbing small versus large hyperedges. We generated synthetic ground truth hypergraphs that consist of half large (100 vertices) and half small (10 vertices) hyperedges. We then perform two experiments. One where we perturb only the small hyperedges, and one where we perturb only the large hyperedges. This indeed informs us that hNMI is not affected as much when only smaller hyperedges are perturbed, whereas CES is, and vice versa. Neither is wrong and is based on preference and goal of the measurement. CES can be adjusted to behave like hNMI by using a weighted averaging per hyperedge, based on the number of vertices.
Finally, we set up an experiment to see in what way CES and hNMI react to over-segmentation. We increasingly subdivide the hyperedges of a synthetic hypergraph, while keeping the parent edges as well. We compare the perturbed hypergraph to the ground truth hypergraph. hNMI does not show problems with oversegmentation, nor does CES. As intended, CES punishes additional redundant hyperedges more. As this is one of the main differences between hNMI and CES, we include the results of this synthetic over-segmentation experiment here as well, in Figure 8.
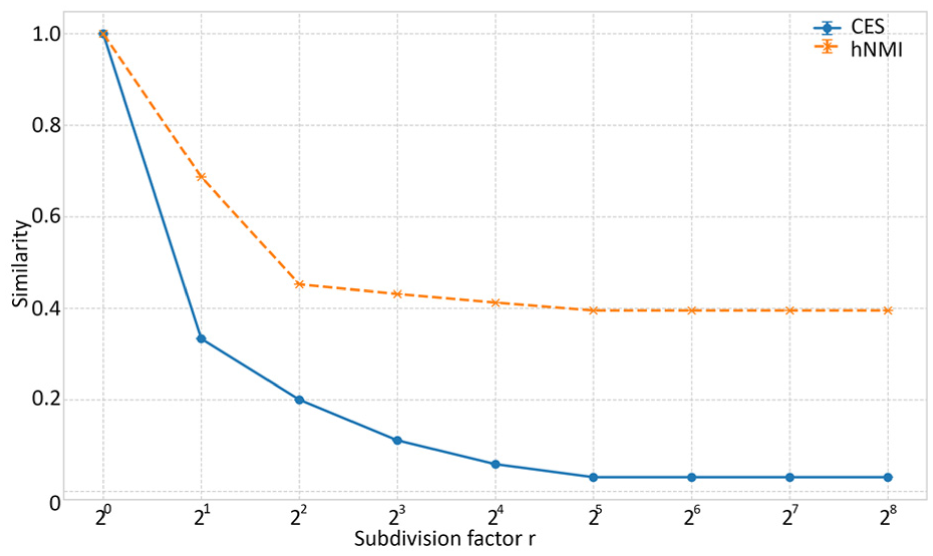
The effects of oversegmentation on CES and hNMI of a ground truth hyperedge with 4096 nodes and 256 hyperedges.
Both hNMI and CES are capable of distinguishing lower from higher quality hypergraphs. hNMI tends to follow perturbation levels more consistently, while CES deviates slightly. Unlike hNMI, CES can be tuned to emphasize either small or large hyperedges depending on the evaluation goal. As they capture different aspects of hypergraph quality at low computational cost, using both can be informative, though either measure alone already provides reliable results. This allows us to properly evaluate hypergraph constructors and identify those suitable for visual analytics. The tensor-based measures, by contrast, either fail to capture degradation consistently or (as expected) do not scale to larger hypergraphs, making them less practical for our purposes.
For completeness, we also compared hNMI and CES against the tensor-based methods on synthetic hypergraphs generated by the Erdős-Rényi, Barabási-Albert, and Watts-Strogatz models, following the evaluation protocol of Ref. 12 Detailed results, including ROC and UMAP visualizations and comparisons with Tensor-Hamming and Tensor-Centrality, are provided in the Supplemental Materials. Both hNMI and CES performed well at distinguishing between these generative models, with CES showing the strongest separation and hNMI close behind. In their study, the Tensor-Spectral (Tensor-H) method was reported as their strongest performer, achieving results comparable to what we observe for CES, but we were unable to evaluate it directly due to unavailable code.
Hypergraph construction evaluation
To evaluate the hypergraph construction algorithms, we first extract feature vectors from the images. Our primary feature extractor is a Swin v2 model pre-trained on ImageNet1k, 59 a state-of-the-art architecture for image classification. Because Swin v2 is primarily trained for object recognition, we also explore incorporating features from two additional pre-trained models: Places365 and OpenCLIP. Places365 is trained specifically for scene and location recognition, which could provide embeddings that emphasize environmental context. OpenCLIP, a contrastive vision-language model trained on detailed image-caption pairs rather than single-label annotations, may capture multi-label semantics and broader scene-level information. Both models are also integrated into the hypergraph visualization system, with OpenCLIP additionally enabling text-to-image retrieval. Unless stated otherwise, all reported experiments use only Swin v2 embeddings.
We use the extracted embeddings as input to the hypergraph construction algorithms. FCM produces a membership degree for each image to every hyperedge (cluster), which we convert into binary assignments using a threshold
We observed that values of
We tried PCM with several combinations of parameters, which are similar to FCM. However, PCM did not result in hypergraphs that performed much better than chance. Similarly, we tried the method by Gao et al.
36
with different variations of sets of
Given the disappointing results from existing methods, we turn to state-of-the-art clustering algorithms designed for single-label data. To select a useful candidate for constructing a hypergraph in our context, it needs to be easy to adapt to multi-label clustering and computation time should not be excessive.
We found Teacher Ensemble-weighted pointwise Mutual Information (TEMI), currently among the top performing clustering algorithms for single-label datasets. For a full formal definition, see Ref., 60 here we summarize the architecture and training objective to provide enough context for understanding our integration of TEMI into the hypergraph construction pipeline. TEMI is a multi-stage, self-distillation framework for unsupervised image clustering that builds on a pre-trained image classification model. In the first stage, feature vectors are extracted from images with the pre-trained model. Clustering is then approached by assuming that an image and its nearest neighbors in this feature space are likely to share a semantic label. To address the inherent noise in this assumption, since some neighbors may be semantically unrelated, TEMI trains a student clustering head to predict a user-specified number of cluster assignments, guided by a teacher head updated as an exponential moving average of the student. The framework uses a loss based on pointwise mutual information, with instance-level weighting derived from teacher predictions. This weighting mechanism reduces the influence of inconsistent or ambiguous image pairs. Rather than relying solely on individual pairs, the method learns cluster structure from broader neighborhood consensus: consistent patterns across many nearby samples. This is further reinforced by averaging predictions over an ensemble of clustering heads. The method achieves strong performance on standard benchmarks without fine-tuning the pre-trained model.
Although TEMI includes a training phase for self-distillation of clustering heads, its computational cost remains relatively low compared to FCM. This makes it practical for real-world applications. Furthermore, TEMI originally assigns images to the cluster with the highest membership probability. This makes it easy to modify by applying a threshold instead of assigning it to the single highest probability cluster. This allows images to belong to multiple clusters (hyperedges). This means TEMI requires two user-defined parameters: a threshold and the number of clusters.
In Figure 9 we show the results for the constructed hypergraphs by FCM and TEMI for two of the image collections, compared to their ground truth. The results for the other image collections show similar results and can be found in the Supplemental Materials. The adapted TEMI clustering method produced better results and outperformed FCM for all of the tested image collections, except on MIC where FCM performs slightly better according to hNMI. We found for CUB200 that hNMI shows some signs that it may not always be robust against over-segmentation. Despite increasing
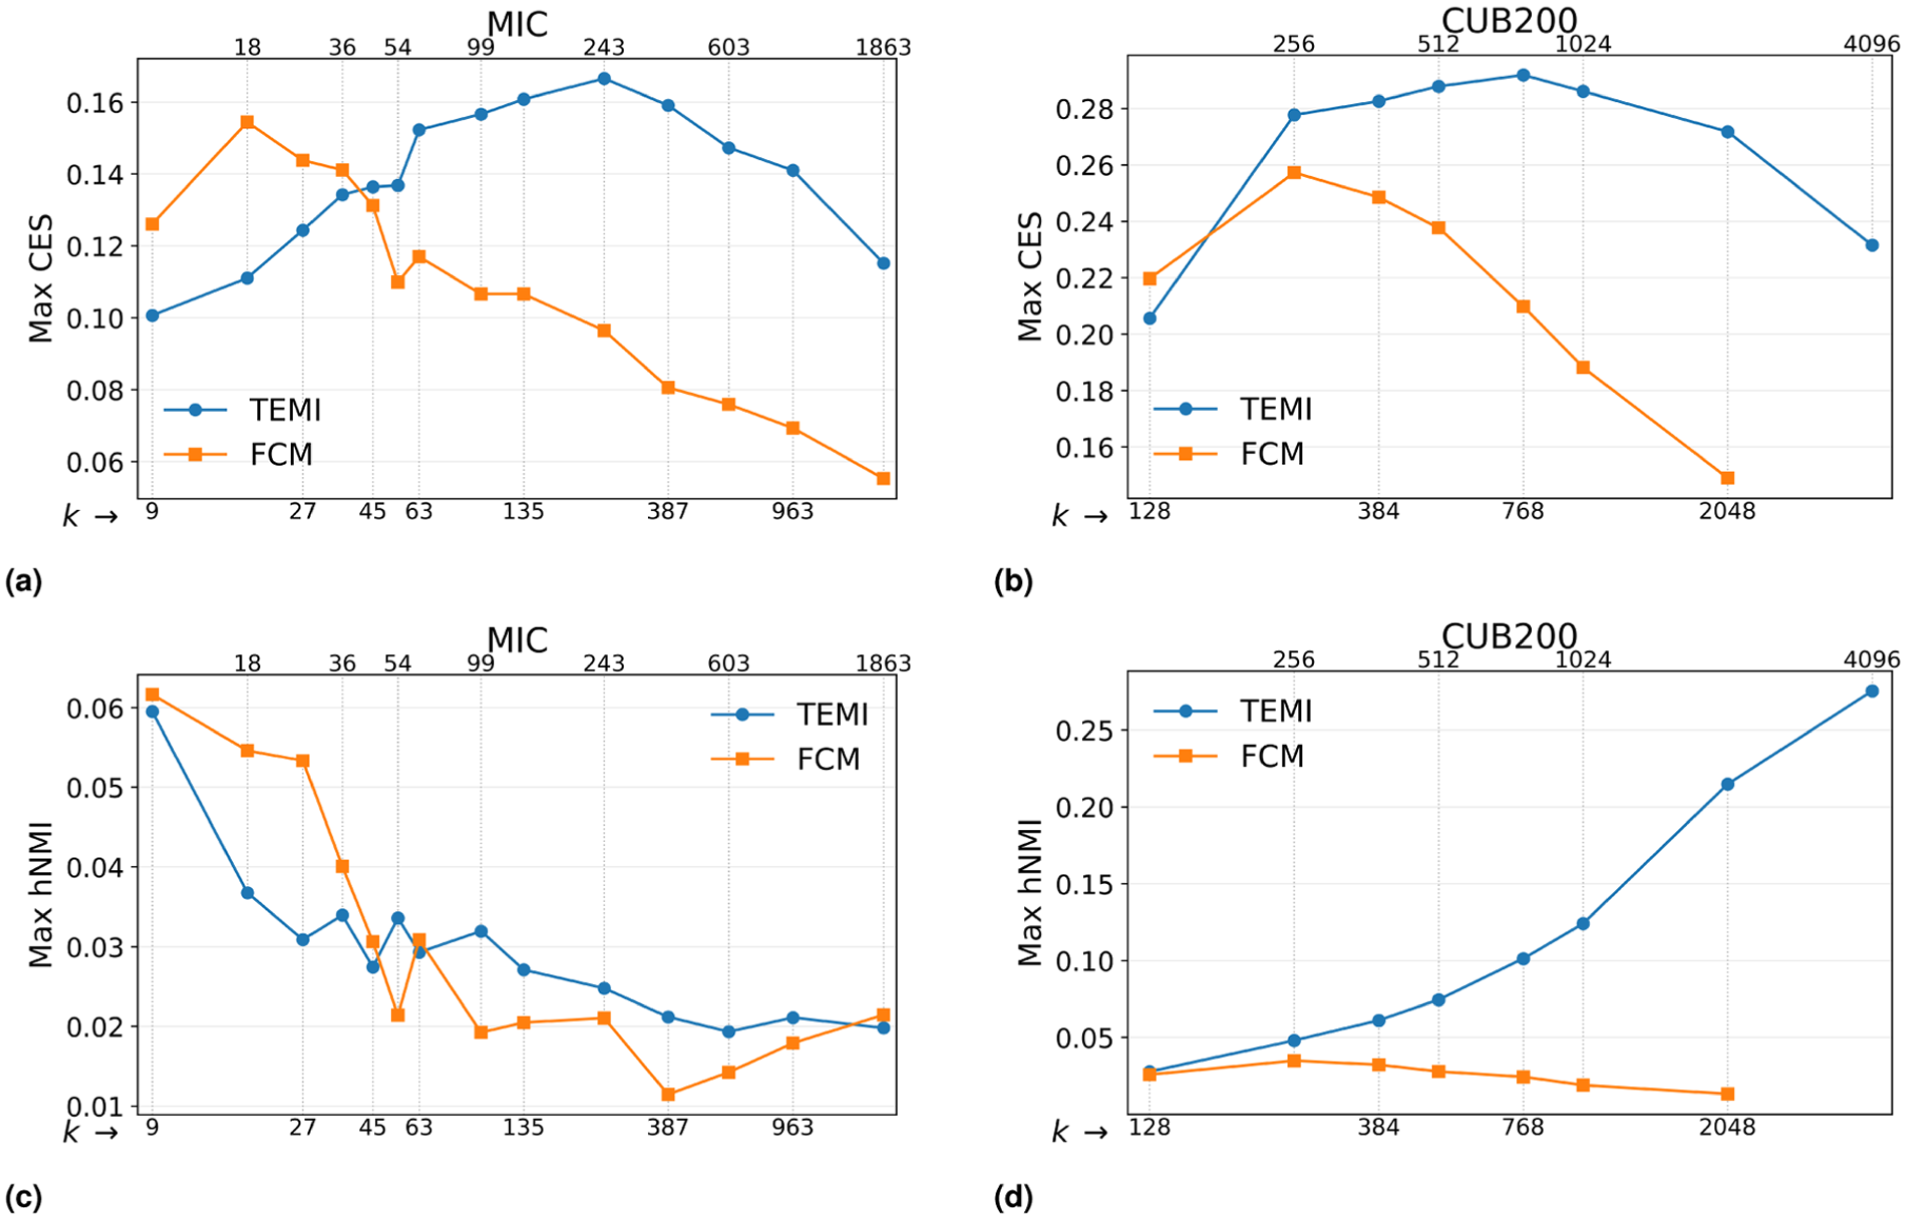
Maximum CES and hNMI as a function of
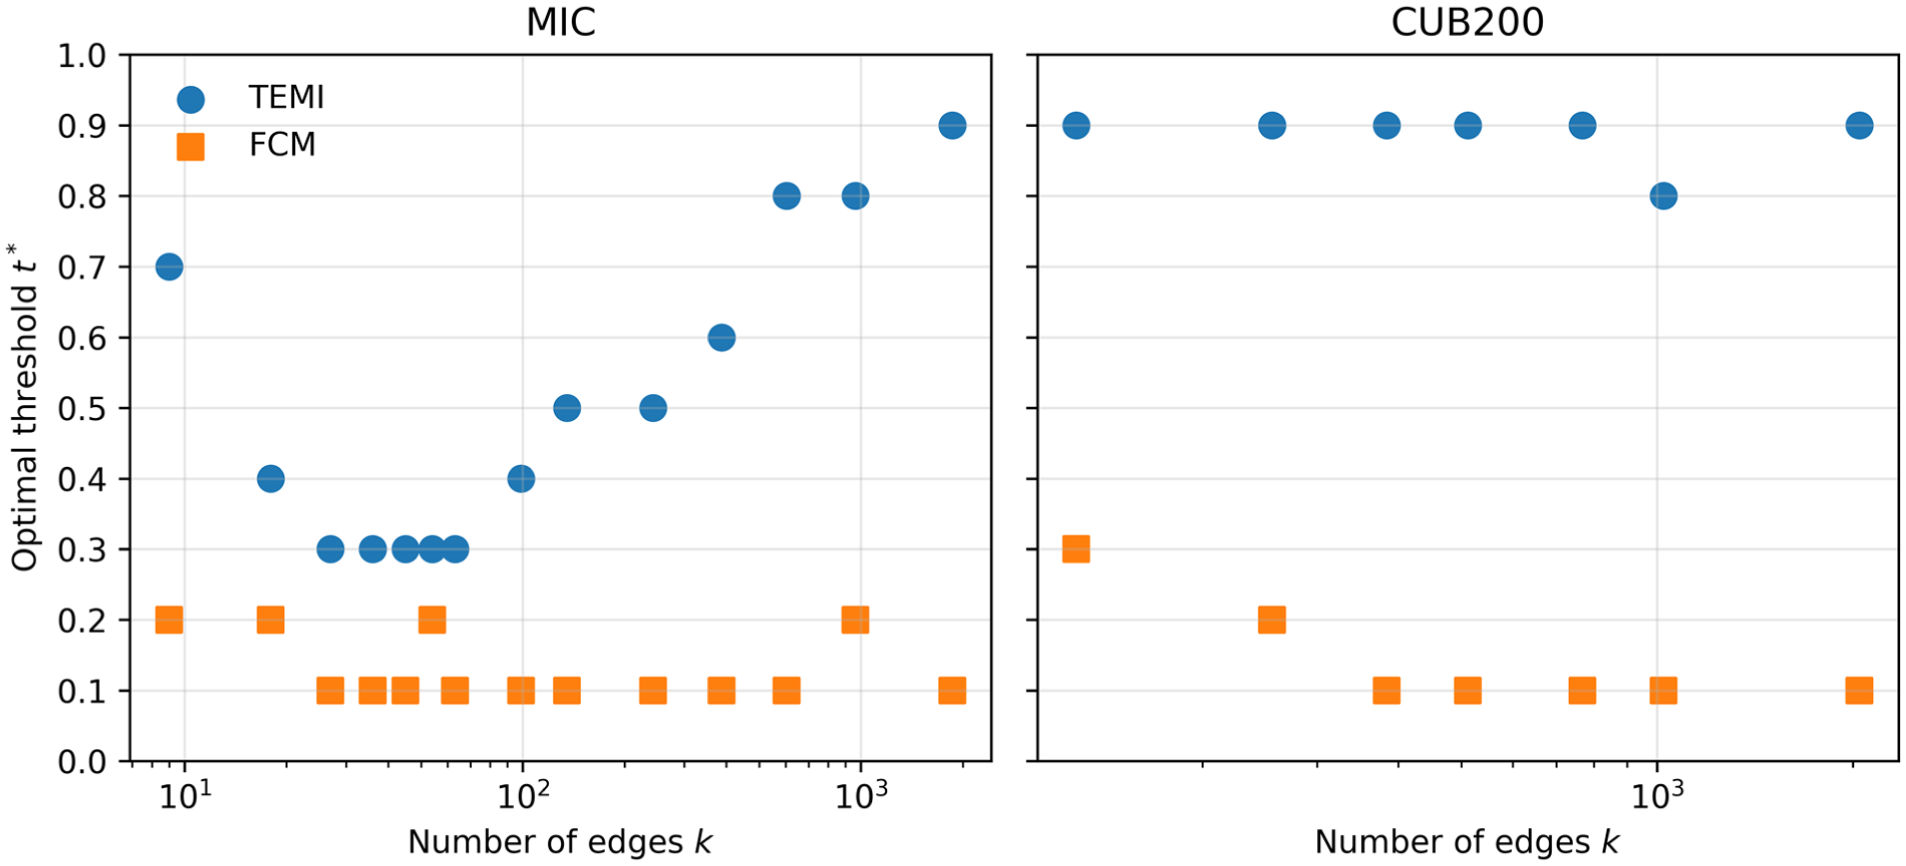
Optimal thresholds
Since hNMI and CES identify in some cases different parameter settings as optimal, we also conducted a qualitative assessment of those resulting hypergraphs. Our evaluation focused on whether the images within each hyperedge form coherent groups, and whether intersections between hyperedges provide meaningful connections.
For the MIC, using FCM with 18 hyperedges and a threshold of
Increasing the number of FCM hyperedges to 253 (
In contrast, TEMI with 253 hyperedges and a threshold of
For the CUB200 dataset, hNMI consistently rated FCM results much lower than TEMI results. Using FCM with 243 hyperedges and a threshold of
We evaluated OpenCLIP and Places365 embeddings by generating hypergraphs using the best parameter combinations for each image collection, as determined by CES. Because CES also provides scores for individual ground truth hyperedges, we compared these results against those obtained with Swin v2 embeddings to assess whether the alternative models could offer an advantage. OpenCLIP outperformed Swin v2 on roughly 10% of hyperedges, and only by a small margin, while Swin v2 occasionally achieved substantially higher scores. Places365 did not outperform Swin v2 on any hyperedge in any dataset. Although Places365 is an older model, we had anticipated that its specific fine-tuning for location recognition might provide benefits in certain cases, but this was not observed. No consistent pattern emerged in the cases where OpenCLIP surpassed Swin v2. Despite the limited quantitative gains, we still include OpenCLIP in our system because it supports text-based querying.
Taking all these results together, we draw four conclusions. First, CES and hNMI can both distinguish higher quality constructed hypergraphs from lower quality constructed hypergraphs. CES is generally more suitable for complex image collections because it is more sensitive to over-segmentation and treats smaller hyperedges as important, whereas hNMI behaves more like a macro-level measure. Second, among the tested construction methods, PCM and the Gao et al. variant did not produce useful hypergraphs, and FCM was computationally heavy and often produced either overly large hyperedges, containing too many different image categories, or almost disjoint, k-means-like clusters with little overlap. Third, the adapted TEMI method was the strongest overall constructor: it outperformed FCM on all tested collections except MIC under hNMI, and, more importantly, it produced overlaps that were qualitatively useful for analysis. Fourth, for the embeddings, Swin v2 remained the strongest overall choice; OpenCLIP only improved a small subset of hyperedges, and Places365 did not outperform Swin v2. With these results we support C1 (overlap-capable data model) and C2 (unsupervised construction). C3 is addressed in the following user evaluation.
User evaluation
To evaluate whether the system supports expert workflow analysis in realistic investigative settings, we conducted a qualitative think-aloud study with eight domain experts from the Dutch Safety Board. The participants comprised three maritime investigators for MAIC (42,960 images), three aviation investigators for MIC (12,621 images), and two experts from the construction and fire domains for PAIC (4417 images). Although these participants regularly work with image material as part of accident investigations, this considers generally image collections of less than 100 images. They were domain experts rather than specialists in visual analytics or image-collection analysis tools. Each participant worked with the full image collection from their own domain, starting from the automatically generated hypergraph produced with TEMI (
Across the three collections (MAIC, PAIC, MIC), participants converged on two effective entry points: the Overview for quick sensemaking and bootstrapping, and text search for fast retrieval. Most tasks were solvable with standard retrieval alone; domain knowledge amplified text queries (e.g. ship types, recognizing the interior of a cockpit), while ROI/Image queries consistently improved precision for fine-grained cues (e.g. isolating hull gashes or beam joints). Hyperedge-centric workflows, starting with collecting a seed set, then querying that hyperedge, scaled quickly (P1 surfaced 89 hull-damage images in 5 min), and noise detection (finding irrelevant items) benefited from targeted keywords (P5 surfaced 654 non-MH17 images in 10 min), but also from querying unique looking irrelevant items (P8 found 1955 images). The Spatial Hypergraph View was most valuable for discovering adjacent or overlapping clusters and for “where next?” navigation, rather than as a universal first step.
Where tasks required subtle disambiguation or multi-label constraints (bridge of a fishing vessel; floor-specific garage views), performance hinged on query formulation and verification strategies: times ranged from only a few seconds to 18 min after multiple text-query iterations, with one case solved in under 10 s by pasting the full task prompt as a text query. Through spatial exploration the same task was solved in 3 min.
One participant used the Intersection list to successfully find additional images. The Hypergraph matrix was rarely used spontaneously; it was primarily employed in one task designed to require overlap analysis, where it proved effective for identifying targeted intersections.
The participants had some quality-of-life suggestions, such as a good way to go back to a previous view of the data, when diving into query results repeatedly. An especially useful suggestion was to use the colorization of the hyperedge nodes in the Spatial Hypergraph view to indicate which hyperedges the user has seen and how long ago this was (darker color based on time since last visit). Both these suggestions were implemented after P1-P3 completed their tasks, before the next participants. Especially the navigation back and forth was frequently used by subsequent participants.
In general, the participants were positive about the experience and about the capabilities of the system. They noted that if they encountered a large image collection, they would certainly want to try the system. Some said they were currently working on cases where the system would be relevant, so we are planning to set up the system for their data shortly after the user evaluations.
Across all studies, we observed consistent cross-view analysis patterns that illustrate how the different visualizations collaboratively support exploratory reasoning. Participants relied on distinct visual cues to transition between views rather than following a fixed workflow. The Overview was commonly used for initial sensemaking and for identifying broad semantic groupings, after which users switched to the Hyperedge Grid to verify image content and refine labels. The Spatial Hypergraph View was most often entered when users sought to expand an existing concept or identify “where next” candidates, guided by visible overlaps and proximity between hyperedges. Conversely, dense or sparse patterns in the Hypergraph Matrix prompted users to either investigate specific intersections via the Grid or conclude that a given configuration offered limited analytical value.
Discussion
In this work, we aimed to address challenges associated with applying hypergraphs to complex, real-world image collections: constructing hypergraphs from raw, unlabeled data, evaluating their quality against meaningful ground truths, and developing a scalable, interpretable visualization. Here, we discuss how our methods addressed these specific challenges, as well as the limitations and considerations identified through our evaluations.
Hypergraph construction and evaluation
We found a lack of research on the construction of hypergraphs from raw data. We tested several approaches to constructing hypergraphs and found that adapting TEMI allowed us to generate hypergraphs without relying on extensive labeled data or predefined categories. While this method was generally effective at uncovering latent image relationships, during the setup of the user evaluation datasets we observed that it sometimes produced hypergraphs with limited overlap between hyperedges. While we could solve this by adjusting parameters such as the number of hyperedges or threshold
In general, the quality of a constructed hypergraph depends not only on the algorithm, but also on the image collection itself. Collections with little natural overlap may yield mostly disjoint hyperedges, while collections with strong visual commonality may produce overly broad or redundant ones. In addition, when expert-relevant concepts are weakly represented in the visual embedding space, meaningful categories may be fragmented across several hyperedges or mixed with unrelated content. This suggests that poor hypergraph structure can arise both from limitations of the construction method and from intrinsic properties of the collection. In practice, distinguishing between these causes requires analyst assessment, for example by iteratively adjusting TEMI threshold settings and inspecting the resulting hypergraph for meaningful overlap, coherence, and redundancy (or lack thereof).
To analyze the hypergraph construction method, we developed a new measure that allows us to compare complex hypergraphs to ground truth hypergraphs. Based on experiments with synthetic hypergraphs, we found that CES is both sensitive to perturbations and robust against over-segmentation. hNMI showed greater stability in some perturbation tests, but our measure provided finer-grained insight into how well individual hyperedges were captured. Together, these results indicate that CES and hNMI can capture very similar aspects of hypergraph quality, but also more complementary aspects. Due to the low computational cost, they can be used in conjunction for a more nuanced evaluation of construction methods.
Visualization design and scalability
The challenge of scalable visualization, which has been widely acknowledged as problematic for large hypergraphs, 48 also significantly shaped our research. Our evaluation highlights that the system is both technically scalable and usable on consumer hardware. However, scalability in visualization is not solely a matter of rendering performance. Cognitive scalability is a different challenge: large overlapping hypergraphs can easily exceed what users can process and interpret in a single view. Our approach mitigates this through multiple coordinated views and progressive detail-on-demand. Our evaluation was conducted with domain experts who were not specialists in image analysis, but the participants were able to perform the tasks to a large extent and did not get lost in the large amount of data they needed to sift through in a short time. This highlights the accessibility of our system. It would be interesting for future work to understand how users manage complexity over extended sessions lasting several weeks or months in real cases, how the hypergraph model is being shaped through their progressive analyses, and add support for collaborative analysis workflows, in which multiple analysts contribute to and build on a shared hypergraph.
While the users often used standard image retrieval approaches to find relevant results, the Spatial view was also used a lot, and was found to be easy to use and navigate. The Hypergraph Matrix was not used often during user evaluations. In our own experience of using the application for actual case work, we found the Hypergraph matrix to be more useful in later stages of an investigation, when a significant number of hyperedges have already been created and/or properly labeled, something that is more difficult to reach in a shorter user evaluation.
Interpretability of constructed hypergraphs and workflow fit
Another question pertains to the interpretability of the automatically constructed hypergraphs. This concerns both the coherence of the individual hyperedges, but also the ability to reveal meaningful connections between hyperedges. Participants found that some hyperedges had a clear theme, while others were more opaque, limiting their analytic value. However, they also noted this was not really an issue, as long as there was a good way to find a seed image. The successful usage of the Spatial view and the Intersection list by several participants shows that there were useful relations between the hyperedges.
Overall, the user evaluations revealed that participants employed diverse strategies to approach the tasks, yet the system was flexible enough to support each of them in successfully completing their analyses. While there remains considerable room for refinement, particularly in terms of quality-of-life features, all participants emphasized that the system was intuitive to use and aligned well with their workflows.
Conclusion
This study introduced an end-to-end approach for representing and analyzing complex image collections using hypergraphs. We addressed three central challenges: (1) constructing hypergraphs directly from raw, unlabeled data, (2) evaluating the quality of these hypergraphs against ground truth, and (3) enabling scalable and interpretable visualization for domain experts.
For hypergraph construction, we adapted the TEMI clustering algorithm to support multi-cluster assignments, producing overlapping hyperedges that better reflect the inherent structure of complex image collections. While effective across multiple datasets, results showed that optimal parameter settings remain collection-dependent, highlighting the need for future methods that more directly accommodate varying degrees of overlap.
To evaluate construction methods, we introduced the CoverEdge Similarity (CES) measure. Experiments with synthetic and real-world data demonstrated that CES is sensitive to perturbations and robust against over-segmentation, providing complementary insights to hNMI, which showed greater stability in some perturbation tests, but only provides a macro-level quality measurement. Together, the two measures enable a more nuanced evaluation of hypergraph quality at low computational cost.
For visualization, we developed a system that combines multiple coordinated views to support both exploration and search. Our evaluation with domain experts demonstrated that the system is technically scalable and usable on consumer-grade hardware, and that participants were able to complete challenging analytic tasks despite the scale and complexity of the data. Users used various strategies, and, although some views were more frequently adopted than others, the system proved to be flexible enough to support different workflows.
Overall, our findings show that hypergraph-based visual analytics can make large and complex image collections interpretable and actionable for domain experts. Future work should focus on more adaptive hypergraph construction methods, deeper evaluation of long-term analyses of complex image collections, and design refinements that further improve usability in real investigative settings.
Supplemental Material
sj-pdf-1-ivi-10.1177_14738716261459480 – Supplemental material for Interactive hypergraph visual analytics for exploring large and complex image collections
Supplemental material, sj-pdf-1-ivi-10.1177_14738716261459480 for Interactive hypergraph visual analytics for exploring large and complex image collections by Floris Gisolf, Zeno J. M. H. Geradts and Marcel Worring in Information Visualization
Footnotes
Acknowledgements
The authors would like to thank the Dutch Safety Board for providing access to data and for the support of investigators involved in this research.
Consent to participate
All participants provided verbal informed consent to participate in the study.
Consent for publication
All participants provided verbal informed consent to allow publication of the study results.
Funding
The authors received no financial support for the research, authorship, and/or publication of this article.
Declaration of conflicting interests
The authors declared no potential conflicts of interest with respect to the research, authorship, and/or publication of this article.
Data availability statement
The study used a combination of publicly available datasets, which are cited in the manuscript, and confidential datasets that cannot be shared due to data protection and confidentiality constraints. The code used in this study is publicly available via GitHub.
Supplemental material
Supplemental material for this article is available online.
References
Supplementary Material
Please find the following supplemental material available below.
For Open Access articles published under a Creative Commons License, all supplemental material carries the same license as the article it is associated with.
For non-Open Access articles published, all supplemental material carries a non-exclusive license, and permission requests for re-use of supplemental material or any part of supplemental material shall be sent directly to the copyright owner as specified in the copyright notice associated with the article.