
Abstract
Of the utmost importance is the need to better understand the high temperature, high velocity flow fields generated by military tactical aircraft during “run up” and take-off that gives rise to extremely hazardous conditions for personnel and equipment within the vicinity of the aircraft. The present study aims to fill the need for high frequency, two velocity component measurements throughout the flow fields produced by university-scale supersonic jets exhausting from nozzles in configurations relevant to practical, full-scale application. Specifically, this work focuses on studying the supersonic jets operating in two basic configurations: horizontal, free jets and jets impinging normal to a ground plane reminiscent of current short-takeoff and vertical landing aircraft. Experiments are conducted at nozzle operating conditions similar to those of full-scale aircraft. Both mean velocities and turbulence components are measured in both flow fields using a laser Doppler velocimeter. Axial components of the mean flow and turbulence are measured in the free jet. In the single impinging jet flow field two-component mean velocity and turbulence components are measured in the jet plume, impingement region, and outwash flow. Free jet velocity measurements show good consistency with 50% increase in jet Reynolds number. Turbulence intensities up to 15% of the mean jet exit velocity are observed at the nozzle exit plane. Laser Doppler measurements in the outwash of an impinging jet show turbulent fluctuations produce unsteady velocities well above the mean value. Two-component impinging jet unsteady velocity spectra show a distinct peak at the same frequency as the impingement tone observed in prior impinging jet acoustic field measurements.
Introduction
Experiments led by Dr. Dennis K. McLaughlin have been underway at Penn State University for a number of years on the aerodynamics and aeroacoustics of supersonic jets. In general, the research at Penn State is of a fundamental nature but addresses issues related to the flow fields of Navy aircraft currently in service. Tactical aircraft that operate from aircraft carriers produce noise levels on take-off that endanger the hearing health of Naval personnel who work on the flight line. The introduction of F-35B, STOVL aircraft during shipboard operations has required better understanding of the high speed, high temperature impinging jet flow field. Although the noise produced by such aircraft is an annoyance, the downwash of the powered lift system is of great concern to the Navy. This paper describes experiments using small scale, geometric replicas of aircraft engine exhaust nozzles, with similar operating conditions, in both free and impinging jet configurations, that were conducted in the Penn State aeroacoustics facility.
Navy shipboard personnel may be exposed to the aerodynamic and acoustic environment surrounding both the more conventional catapult-assisted take-off and arrested recovery aircraft as well as STOVL aircraft. Efforts at Penn State are being made to better characterize the flow field dynamics and acoustics of both supersonic free and impinging jets. Experiments in the Penn State facility have provided data to guide and evaluate numerical simulations of supersonic free jets with noise reduction technologies.1,2 More recently, the capability of the Penn State aeroacoustics facility has broadened to include experiments to characterize aerodynamic hazards in the shipboard operation of a new generation of STOVL aircraft. 3 Penn State has designed and fabricated a generic scale model of the tandem main vertical jets. Experimental data collected will guide and eventually validate the CFD flow field simulations being developed to assist the shipboard operation engineering. 3 The focus of the present measurements includes supersonic, free jet flows and flows of a single, cold, over-expanded supersonic impinging jet in the wall impingement region and in the radially flowing wall jet.
Alvi and Iyer 4 describe the three major regions of the impinging jet flow field: (i) the primary jet plume that retains the characteristics of a free jet, (ii) the impingement zone, characterized by strong velocity gradients and a turning of the flow parallel to the ground plane, and (iii) the wall jet or outwash flow parallel to the plate. Donaldson and Snedeker 5 proposed that the mean properties of the jet plume remain unchanged upstream of any strong local interaction effects that are a result of impingement. It can be expected that the noise generated by high subsonic and supersonic impinging jets has characteristics of their free-jet counterparts (i.e. turbulent mixing noise, broadband shock-associated noise, BBSAN, and jet screech) in addition to aeroacoustic phenomena unique to jet–surface interactions including impingement tones, ground plate scrubbing noise, and positive/negative reinforcement of noise sources.
Unique to impinging jet flows is the closed-loop resonant phenomenon generally referred to as impingement tones. Instabilities traveling in the shear layer of the jet plume may impact the ground plane and generate strong acoustic waves that propagate upstream back to the nozzle exit or lift plate further exciting instabilities of the same frequency. Particle image velocimetry (PIV) images obtained by Krothapalli et al. 6 showed large scale turbulent structures in the jet plume impinging on the ground plane. These large scale structures retained coherence upon traversing laterally into the outwash region. High speed shadowgraph visualization provided evidence that upstream-propagating acoustic waves originated in the stagnation region of the impinging jet. The findings of Krothapalli et al. 6 are in agreement with the earlier model of impinging jet tone production proposed by Tam and Ahuja. 7 The authors developed a theoretical model to attempt to predict whether the loop is closed by feedback waves traveling up the jet column or acoustic fluctuations propagating through the quiescent medium.
Henderson et al. 8 studied supersonic impinging jets using time-resolved particle image velocimetry (TRPIV) and shadowgraphy. The authors reported results supporting. 6 Large scale instabilities were observed to result due to wall jet oscillations. Phase-locked shadowgraph images showed sound waves originating from the boundary between the oscillating wall jet and ambient air that propagate back to the nozzle lip. More recently, large-eddy simulations (LES) by Gojon et al. 9 captured impingement tone frequencies and mode jumps observed in earlier experiments. The presence of these impingement tones can increase overall sound pressure levels by several decibels and be a source of unsteady loading on the aircraft. It is worth noting that pressure and total temperature measurements in free jets by Glass 10 provided evidence that strong acoustic tones can increase supersonic jet spread rates by as much as 50%.
Predictions of supersonic jet noise, using either models such as acoustic analogies or computational fluid dynamics (CFD), depend on accurate experimental databases. Specifically, advanced statistics such as the spectral characteristics acquired from space–time correlations for the broad range of jet conditions required for current prediction methods are largely unavailable. 11 Furthermore, the complex flow fields encountered in the present impinging jet scale model experiments have turbulence components for which no accurate turbulence models have been developed.
Numerous unsteady velocity measurements have been conducted with various instruments in subsonic cold jets. Harper-Bourne 12 described hot-wire measurements in a low speed unheated jet. Turbulence measurements along with detailed statistics were given and used to model the source term in Lighthill’s acoustic analogy. Morris and Zaman 13 also performed hot-wire measurements at several locations within the jet along both the lip and centerline. Their study compared the relationship between second and fourth order correlations and deduced the corresponding length scales. While both studies were very extensive, hot-wire measurements in supersonic heated jets are impractical due to the fragility of the sensors. Molecular Rayleigh scattering has also been used to investigate the turbulence characteristics of jet exhausts, specifically in Panda and Seasholtz 14 and Panda et al. 15 However, this technique has proved to be very difficult and time consuming for many researchers and has additional limitations when applied to high speed jet flows.
Turbulence measurements were performed using the optical deflectometer as described originally in Doty and McLaughlin 16 and later in Veltin et al. 17 The optical deflectometer relies on the Schlieren principle; photo detector signals within the image plane are related to density fluctuations within the jet. Two point space–time correlations were performed and the convection velocity calculated for a large range in frequency. This technique was applied to cold supersonic jets. The optical technique is physically measuring the integrated refractive index of the air throughout the entire beam path. This works very well with pure air jets, however with helium-air mixture jets, success was limited. This is believed to be due to the fact that the refractive index is more heavily dependent on the helium concentration at the measurement location rather than the density fluctuations. Thus, reliable and accurate convection velocity measurements for heat-simulated jets within the jet shear annulus could not be obtained.
Two instruments that measure the velocity of small particles seeded into air (and water) streams are the laser Doppler velocimeter (LDV) and the particle image velocimeter (PIV). The LDV is occasionally referred to as a laser Doppler anemometer (LDA). For the past decade, PIV has been used extensively by many research groups to characterize the mean velocities and turbulence levels of jet exhausts. A major advantage of this technique is that it provides unsteady velocity information for extensive regions of flow fields so that spatial correlations can be obtained quite accurately. This technique has now been further developed into TRPIV, which uses a more extensive electro-optical setup and only focuses on part of the flow field. As described and documented in detail by Bridges and Wernet,18,19 TRPIV allows for the time resolved spectral characterization of the flow field. However, due to the massive amount of data throughput required for these systems, current state of the art systems only sample the velocity field up to 10–20 kHz. 20 For a moderate scale jet, this allows the spectral velocity field to be resolved to a Strouhal number just less than 1. Brock et al. 21 had limited success with multiple time synchronous simultaneous PIV systems that achieved sampling rates approaching 1 MHz. To obtain velocity measurements at higher frequencies, TRPIV is not as versatile as a classical LDV system. This is especially important when accounting for the small jet diameter and higher characteristic frequency used in typical university research facilities.
Laser Doppler systems have been used in the past to study the flow field of supersonic exhaust jets. Excellent data have been previously acquired by Lau et al. 22 and Lau, 23 but turbulent spectra and convection velocity as a function of frequency were not presented. Kerhervé et al. 24 performed two-point space–time correlations within a supersonic Mach 1.2 cold jet. Thus, while this study was very thorough, the pursuit of spatio-temporal characteristics for a heated supersonic exhaust jet still continues. Recently, LDV has been used by Brooks et al. 25 and Brooks and Lowe 26 to measure turbulent statistics in a new facility with cold and electrically heated over-expanded supersonic jets. Doppler Global Velocimetry, a derivative technique of LDV, has been used by the same researchers in Ecker et al.27,28 to obtain fourth-order statistics and velocity spectra with a frequency resolution that exceeds 100 kHz. 29
In order to obtain measurements at high sampling rates in the small scale High Speed Jet Aeroacoustics Facility, a laser Doppler system was built and developed for supersonic flow. The development and testing of the LDV system with convergent subsonic jets was performed by Karns. 30 Further development and measurements with supersonic jets was performed by Karns et al. 31 These measurements were compared and validated against steady RANS simulations documented in Miller and Veltin. 32
A LDV system has been developed for these experiments predominantly because of the high speed/frequency requirement as well as the need to make near wall measurements where reflections can often prove difficult for PIV systems. To this point, all measurements have been performed with cold supersonic jets only. However, the goal during development of the system was to eventually test in heat-simulated helium-air mixture supersonic jets.
The goals of the experiments presented here are to make unsteady velocity measurements in the high shear regions of cold supersonic jets, operating in two basic configurations. First is a horizontal free jet operating with a geometry and operating conditions similar to those used in take-off by tactical aircraft on board an aircraft carrier. The second is a supersonic jet impinging normal to a ground plane as part of the dual impinging jet model flow field. Mean velocities and components of the turbulence are measured in both of these flow fields. The unsteady axial velocity component together with the axial component of the turbulence intensity is measured in the free jet, whereas two unsteady velocity (and turbulence) components are measured in the impingement region and the wall jet of the single impinging jet experiment. The following sections describe the two model configurations of the facility and the experimental approach for both series of experiments. The results of the experiments are then presented along with the discussion followed by conclusions of the study.
Technical approach
Facility description and acoustic measurements
Experimental results presented in this work were conducted in the Pennsylvania State University High Speed Jet Aeroacoustics Laboratory. This anechoic chamber facility is a Top-down view schematic of the Pennsylvania State University High Speed Jet Aeroacoustics Facility.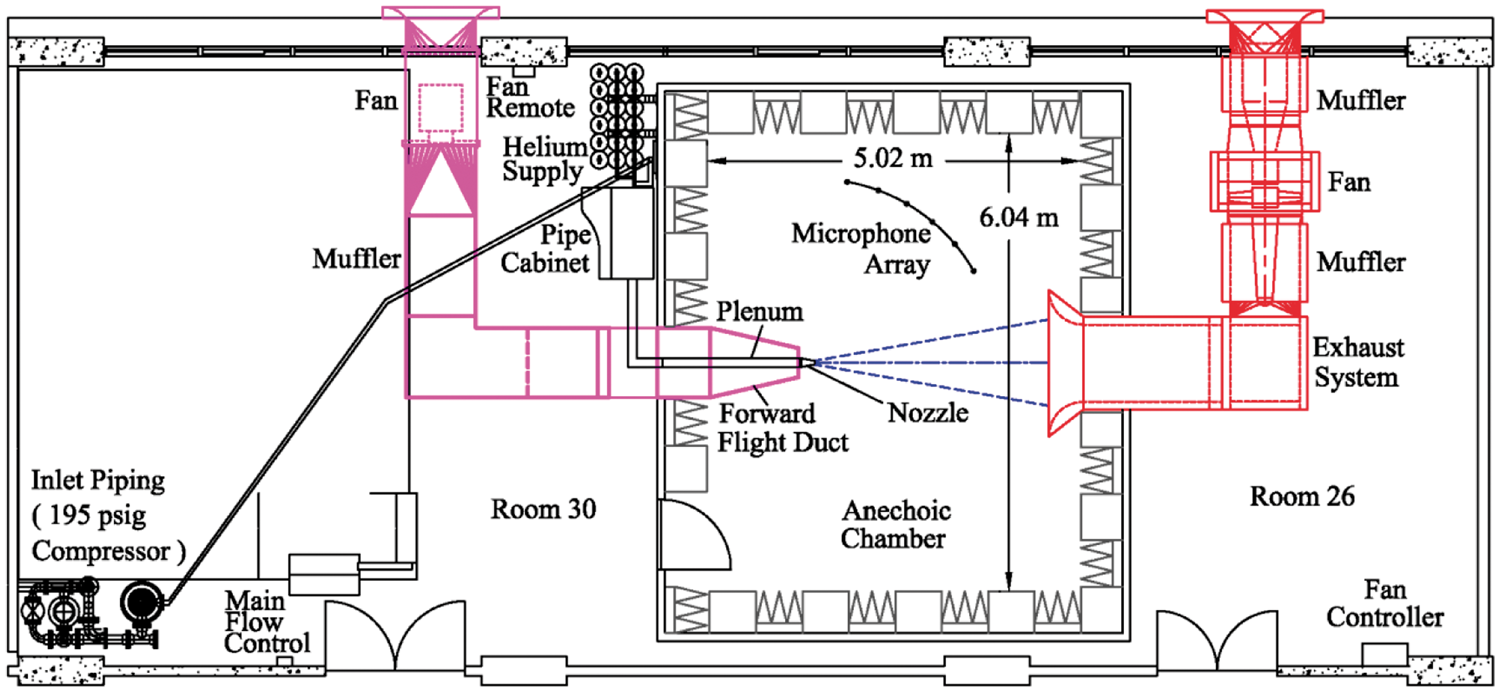
Free jet experimental setup
The supply air is fed into a horizontal plenum mounted within the wall of the anechoic chamber as seen in Figure 1. The end of the plenum was designed in such a way that different geometry jet nozzles can be easily attached and operated.
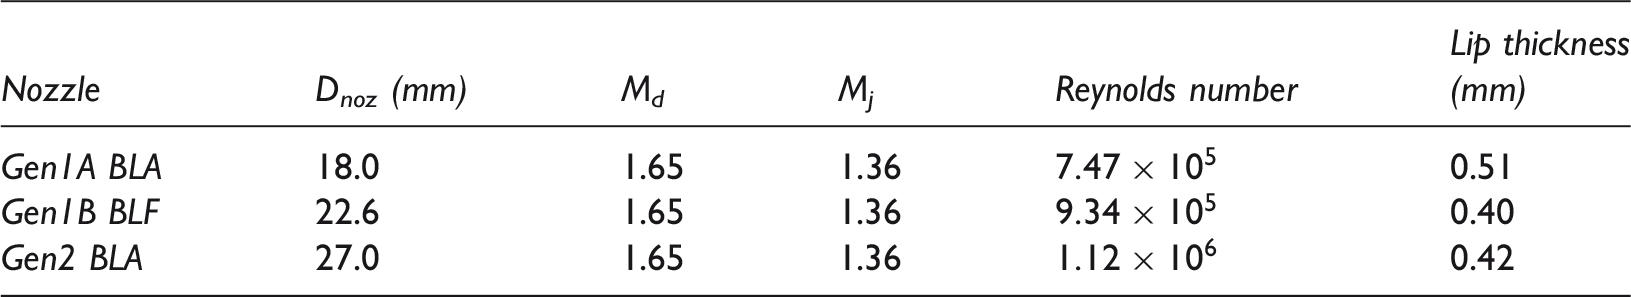
LDV measurements were acquired in free jets issuing from nozzles representative of those found on the F404 family of low bypass ratio turbofan aircraft engines (used on the F-18 aircraft). Inner contours of the military-style nozzles were provided by General Electric Aviation under a previous contract. The divergent section of these nozzles contains a flap and seal configuration that consists of 12 straight, flat segments that are interleaved to facilitate area adjustment of the full-scale operational nozzles. The model-scale nozzle area ratio was selected to be 1.295. This is a typical configuration for a takeoff scenario of one of these aircraft. This results in a design Mach number, Md, of 1.65. In this study, three different sized nozzles were used with exit hydraulic diameters, Dnoz, of 18.0 mm (Gen1A-scale), 22.6 mm (Gen1B-scale), and 27.0 mm (Gen2-scale). A photograph of the LDV system configured for free jet measurements with Gen1B-scale model nozzle installed is shown in Figure 2. Nozzle geometries and operating conditions are tabulated in Table 1. Jet Reynolds numbers (Re) are based on jet conditions at the nozzle exit plane. Results presented for the Gen2-scale nozzle represent a 50% increase in scale and Reynolds number from the Gen1A-scale nozzle also used in this study.
Photograph of the transmitting and receiving optics for the LDV system installed in the high speed jet aeroacoustics facility at Penn State. Baseline nozzle descriptions.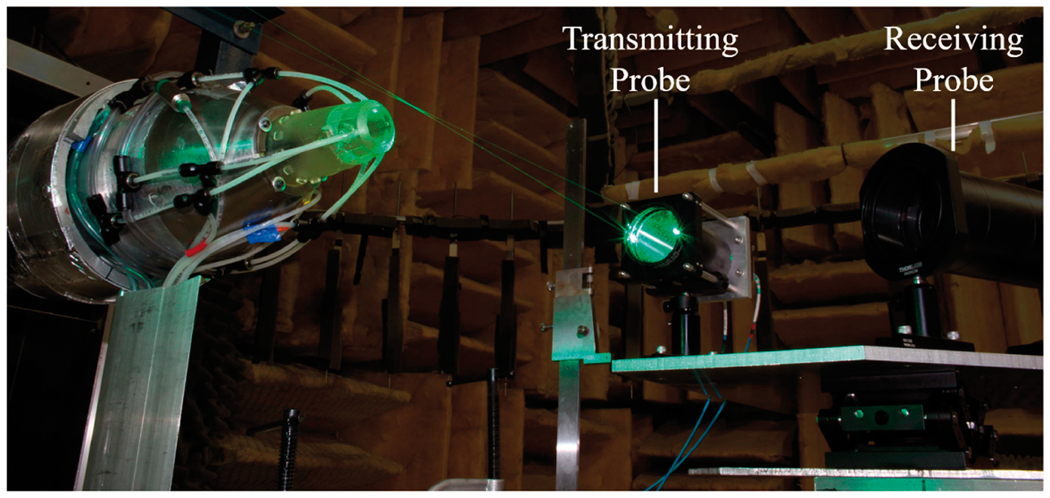
Impinging jet experimental setup
The dual impinging jet experimental model was designed to be representative of a generic military-style STOVL tactical aircraft, such as the F-35B, in hover. The experimental model consists of two vertically-oriented, stainless steel nozzles embedded in a rectangular lift plate of dimensions
The nozzle is an axisymmetric, contoured, convergent-divergent nozzle with an exit diameter, Dr, of 11.9 mm (0.47 in) and design Mach number, Md, of 1.34. This nozzle was operated at its design Mach number for this study. The nozzle protrudes 1 Dr below the surface of the lift plate. This is designed to approximately mimic the F-35B hover geometry in which the nozzle swivels downward when the aircraft performs a vertical landing. The subscript r is retained to denote the rear nozzle as opposed to the forward lift fan on the F-35B and as well differentiate the nozzle diameter from that used in free jet measurements.
Operating conditions for the jet are measured with a total pressure probe installed in each plenum pipe. The total pressure probe is installed approximately 28 cm (11 in or 22 Dr) upstream of the nozzle exit and is connected to a Setra Model 205-2 100 lbf/in2 gauge pressure transducer. The entire model is rigidly attached to two angle iron supports at the top of the anechoic chamber.
An aluminum plate, with a smooth machined surface of dimensions
A diagram of the coordinate system for impinging jet LDV measurements is presented in Figure 3(a). Non-dimensional nozzle separation or jet stand-off distance is Coordinate system and photograph of the LDV setup inside the anechoic chamber for impinging jet flow field measurements. (a) Coordinate system used for impinging jet LDV measurements. (b) Photograph of the LDV setup for impinging jet measurements.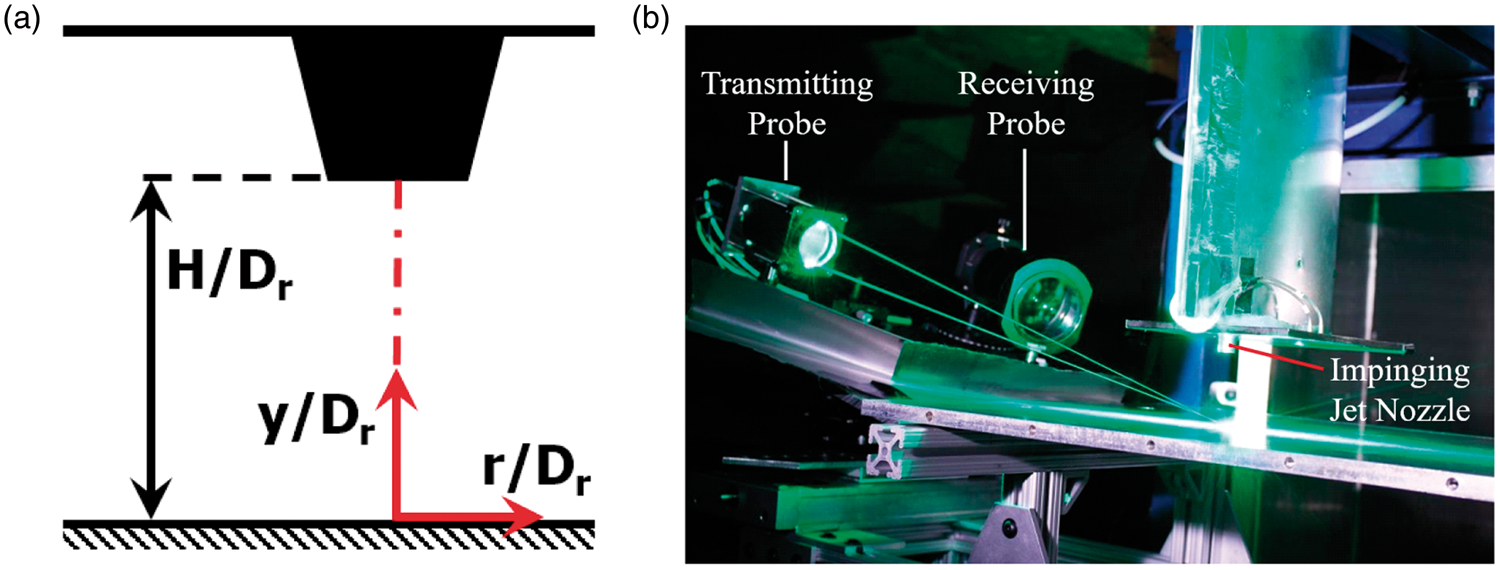
To achieve velocity measurements within 1 Dr above the ground plane or less the aluminum plate holding the transmitting and receiving optics is attached to the scissor jack by way of two
Laser Doppler velocimeter measurements
The LDV system used in this study was developed in-house and was designed with the capability to non-intrusively measure flow velocities ranging from low-speed to supersonic at high data rates in order to resolve both mean and time-varying velocity components. The development of the LDV used in the present study, including initial measurements as well as a more detailed description of the system are described in Karns 30 and Hromisin. 36 A more concise description of the system and the methodology for acquiring velocity measurements is provided below.
Description of laser Doppler system. The LDV system is powered by a 5 W rated Coherent Innova 90C-5 Laser System. A Bragg cell is incorporated in the setup just after the laser exit to split the beam and impart a shift frequency of 40 MHz into one of the beams to allow for negative velocities to be resolved. The frequency shifted beams are then passed through a double prism to split the light into separate pairs of blue and green wavelength (λ) light (488 and 514.5 nm wavelengths, respectively). The collimated green laser light beams are each focused into transmitting fiber optic cables and sent to the transmitting probe within the anechoic chamber through a small hole in the wall of the facility. All optical equipment is positioned on a heavy, vibration-resistant optics bench just outside the anechoic chamber.
Flow seeding is provided with a LaVision Aerosol Generator using di-ethyl-hexyl-sebacat (DEHS) particles. Nominal particle sizes range from 0.3 µm to 0.5 µm. In free jet experiments, seeding particles are introduced to the flow approximately 36 Dnoz (84 cm) upstream of the nozzle exit. The feed line for the seeding particles is split to route particles to a second line attached to the outside of the nozzle. In the impinging jet configuration seeding particles for the core flow to the nozzle are introduced to 56 Dr upstream of the nozzle exit. The feed line for the nozzle is split to feed seeding particles to three holes in the lift plate surrounding the nozzle.
Entrainment flow seeding is provided so as to prevent bias towards higher velocity regions of the flow. For all measurements, a valve is attached to the entrainment flow seeding line to control the seeding of the entrainment flow independently of the core flow seeding. Thurow et al. 37 discuss the importance of uniform flow seeding for particle-based flow measurements in order to accurately determine convection velocities of large-scale turbulence structures. Seeding rates are optimized to achieve peak data rates before each series of tests.
The transmitting probe for the laser light within the anechoic chamber is 13.34 cm (5.25 in) in length overall with an interchangeable 7 cm (2.75 in) diameter achromatic doublet lens with a focal length of 30 cm (11.81 in). The back end of the transmitting probe is designed to accept up to two pairs of beam-carrying fiber optic cables. The transmitting probe focuses the coherent laser beam pairs exiting the fiber optic cables into an ellipsoid optical probe volume within the jet flow.
Laser Doppler velocimeter characteristics (green laser,
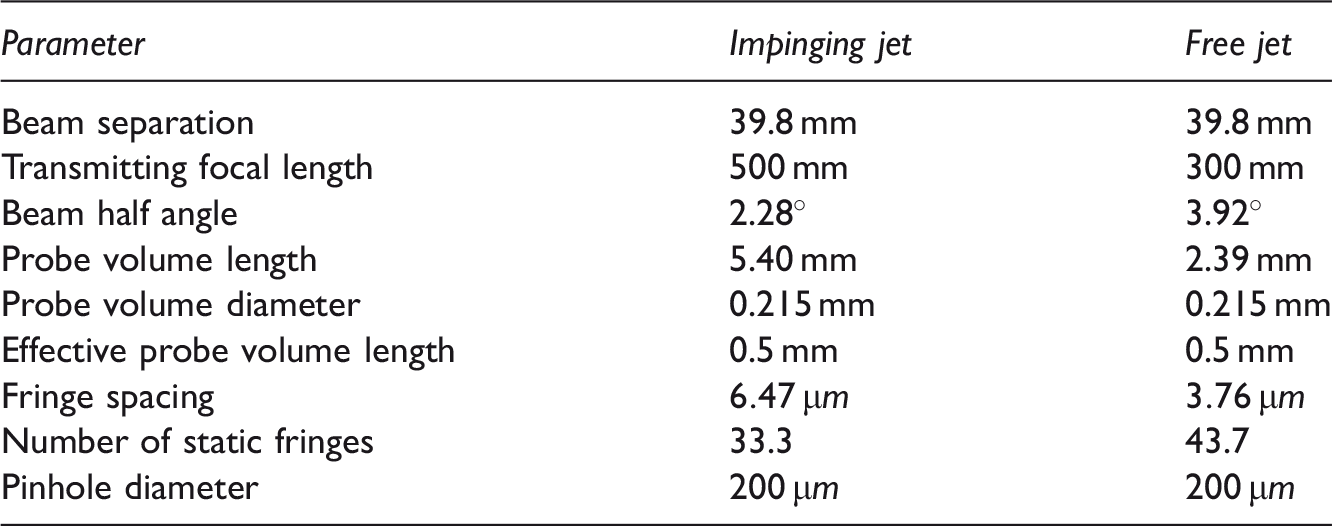
The data acquisition, A/D conversion, burst detection and processing are performed using the Studio Software Suite developed by AUR Inc. Scattered light is sent through the receiving probe and is measured directly by the PMT. The optimal PMT excitation voltage (i.e. sensitivity) is determined prior to each set of measurements to achieve the highest possible data rate and signal to noise ratio. The PMT signal is amplified using a Sonoma 310 high frequency amplifier. The analog signal is then read into a data processing computer purchased from AUR Inc. The data-acquisition computer digitizes the raw PMT data at a sampling-rate of 2 GHz. Proprietary burst detection algorithms are used to identify and record particle bursts and their properties. Output data from each run include the burst time, burst velocity, Doppler frequency, burst length, (SNR), and burst peak to peak ratio (P2P). The data acquisition and processing methodology directly calculates each particle’s Doppler frequency. The Doppler frequency is related to the particle velocity via the probe volume’s fringe spacing and beam half angle. The entire dataset output by the AUR software was then post-processed using MATLAB® to determine valid bursts based on SNR, P2P, as well as a notch filter to exclude any nonphysical measurements which seldom appear in the data.
Laser Doppler system calibration. The calibration process outlined here is derived from that described by Park et al. 38 The LDV system is calibrated against a known linear velocity. In this case, the reference velocity is provided by a Thorlabs model MC2000 optical chopper wheel. Using the theoretical and measured linear velocity of the blades at a known radial position and operational frequency, the actual spacing of fringes within the LDV probe volume may be determined. Using this fringe spacing, the half angle of the crossing laser beams may be calculated.
Data acquisition and processing. Acquired LDV velocity measurements are unevenly sampled in time as measurements are only acquired when a particle is present within the probe volume and produces a validated light burst. Measurements are subject to a bias error caused by the unequal particle arrival times, as originally identified by McLaughlin and Tiederman.
39
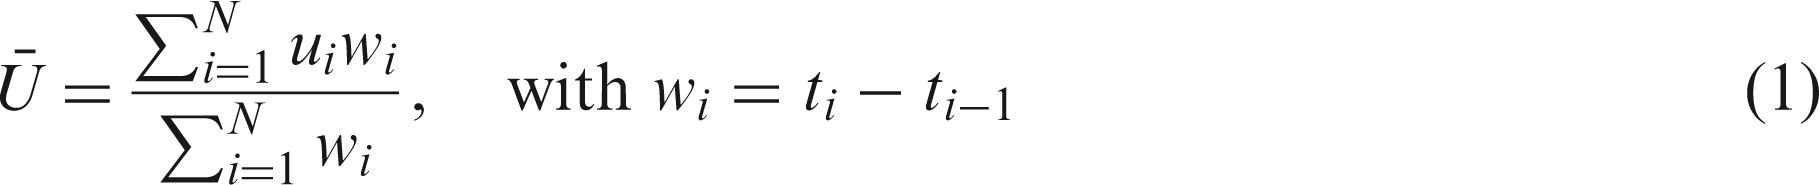
During this study, mean data rates of 40 kHz were observed but individual particle interarrival times were as short as 5 μs. To account for this, Kerhervé et al.
24
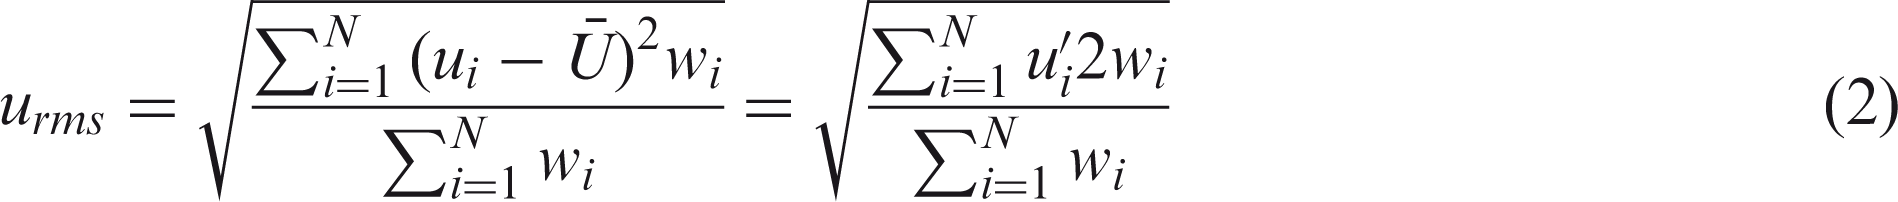
suggested a particle interarrival time weighting to calculate the mean and root mean square (rms) velocities as:

After processing the data, the velocity probability density functions, PDF’s, are inspected to ensure no anomalies appear in the data (e.g. unphysical velocity peaks). Any unphysical velocities are manually excluded from post-processing. These unphysical velocities seldom appear in the data but may be present in regions of strong particle accelerations (e.g. near shock waves).
Estimation of velocity spectra. In order to perform meaningful spectral analysis on the unsteady velocity measurements, the data sets must effectively be converted into an equally-spaced (in time) data set. Sample-and-hold reconstruction of the signal is attractive in its simplicity, however, it involves signal contamination due to the addition of imprecise information. An alternative approach, used in this work, is a technique known as “fuzzy slotting” first introduced by Nobach et al. 40 Excellent overviews of the fuzzy slotting technique for LDV spectral estimation, its history, and implementation can be found in Benedict et al. 41 and Nobach. 42
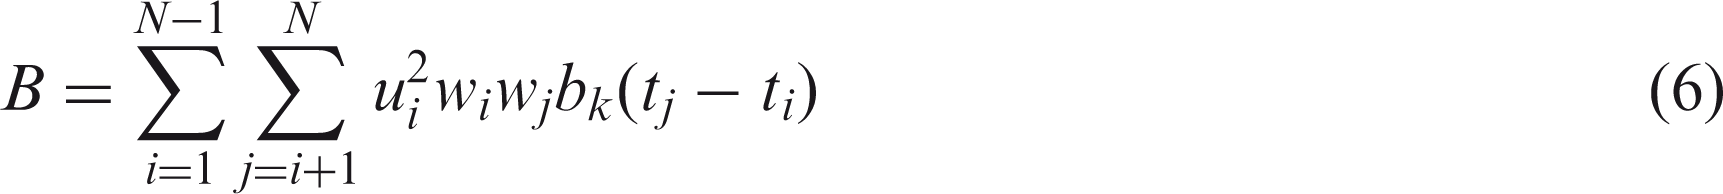
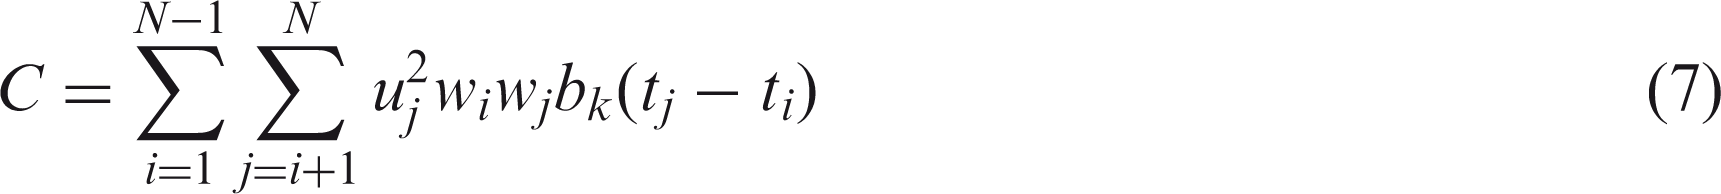
The fuzzy slotting autocorrelation estimation technique involves calculating all possible velocity cross-products. For each cross-product, the associated time lag is determined as well. The velocity cross-products are then organized into k number of bins (slots) equally spaced in time by 
For this study,
Within each bin, the cross-products are averaged resulting in equally spaced correlation coefficients in the correlation domain. The term “fuzzy slotting” is derived from the fact that the bins are triangular shaped in the correlation domain with the central peak (correlation value = 1) at the associated time lag (
To calculate the velocity PSD, the data set are split into blocks. Calculating the PSD for each block and averaging them together reduces the variance of the PSD for the entire data set. For this study, data sets are split in to 10 to 20 blocks, depending on the total length of the data set, with each block containing on the order of 5000 valid velocity measurements. The mean velocity and rms velocity for each block is calculated using equations (1) and (2), respectively. The autocorrelation for each block is then calculated as:

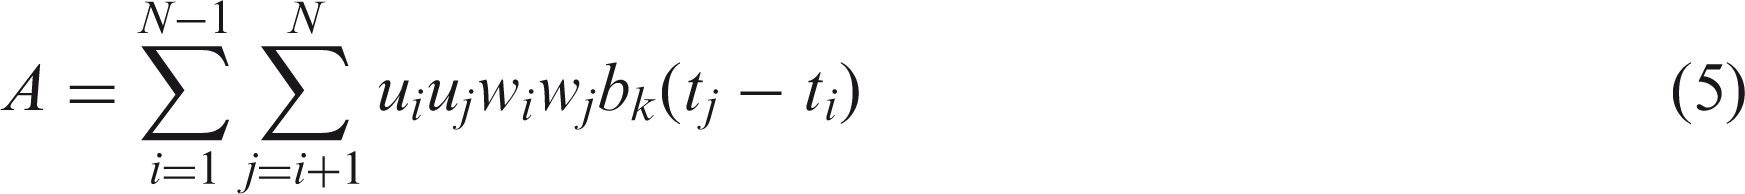

The triangular fuzzy masking function, 
Once the autocorrelation is calculated (equation (4)), the scaled, single-sided PSD is determined using a discrete cosine transform. The unscaled PSD is calculated as follows:
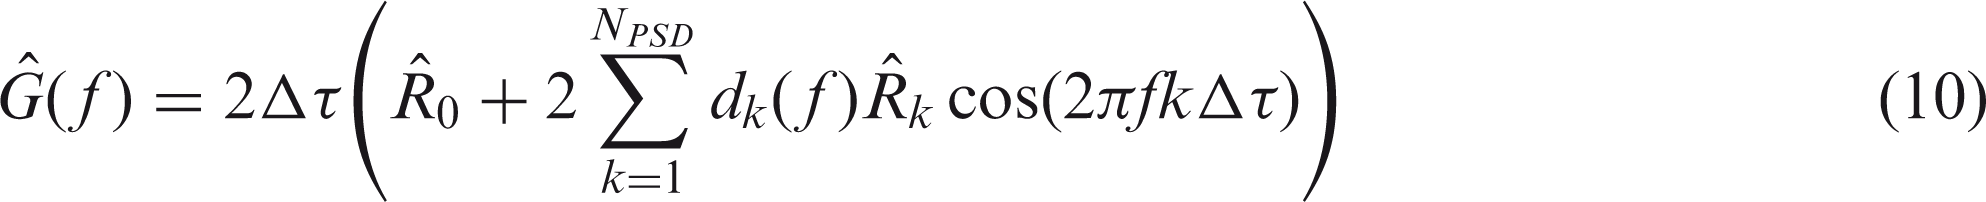
The term 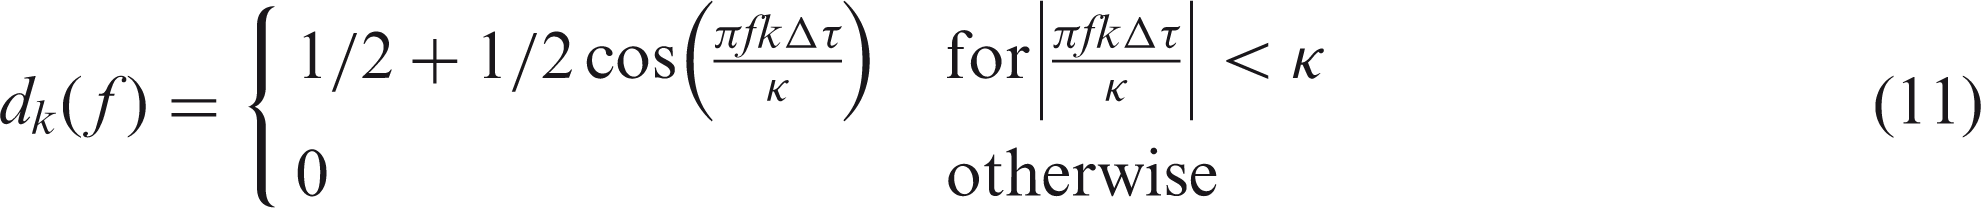
The parameter κ in equation (11) is a “smoothing parameter” whose value can be chosen arbitrarily. A larger κ reduces the amount of “smoothing” the window applies to the PSD. The fuzzy slotting literature suggests κ = 6. However, for the data collected in this study, κ = 6 was found to provide far too much smoothing. As such, a value of κ = 50 is used for all spectra presented in this paper.
After calculating the velocity PSD, the PSD is rescaled such that its integral returns the mean square velocity,
Estimation of measurement uncertainty
Meaningful analysis and interpretation of experimental results can only be accomplished once there is a thorough understanding of the underlying uncertainties, σ, associated with the measurements. Reliability and repeatability of results is strongly dependent on the accuracy experiments. It is critical to understand expected outcomes and their associated uncertainties, especially when attempting to develop and validate an LDV system for supersonic exhaust jet measurements. General facility uncertainties for instruments crucial to flow metering and the LDV system are discussed in the following sections. A detailed analysis on the uncertainties associated with individual and mean velocities, and turbulence intensities measured using the LDV system is provided. The analysis is restricted to only the primary velocity component in each measured flow field. A more detailed derivation of the uncertainty equations may be found in Hromisin. 36
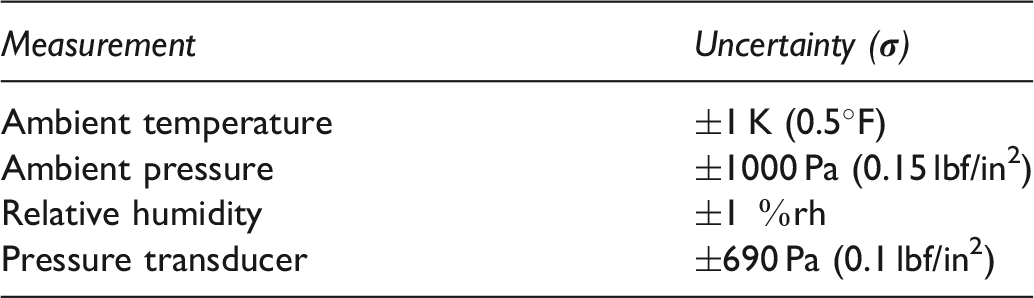
Uncertainties of laboratory gauges and transducers.
Velocity uncertainty. Measurement uncertainty of mean jet velocity, 
The uncertainty in a single realization of jet velocity, σu includes all uncertainty terms in equation (12) except for the statistical error of the mean term, σmean.
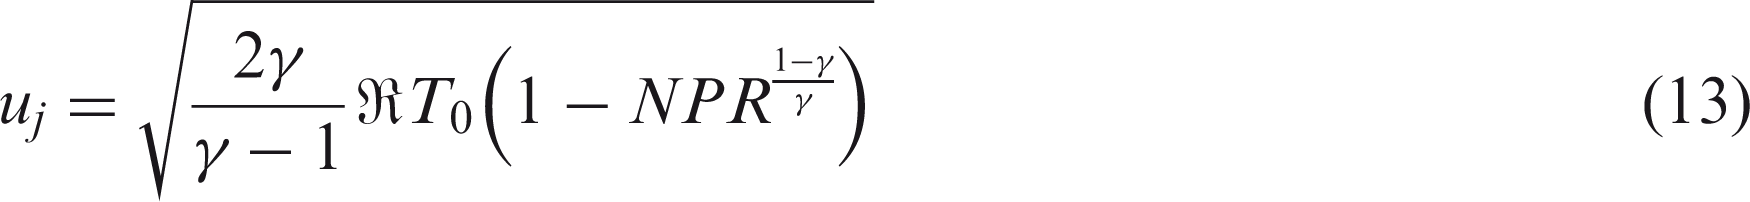
The fully-expanded jet velocity at any operating condition, T0 and NPR, is shown in equation (13).
The uncertainty in this term is representative of uncertainties in all measured axial velocities due to operating facility control hardware. The uncertainty is calculated using the data reduction equation described in Coleman and Steele.
44
In this way, the uncertainty of the jet velocity is dependent upon the uncertainty of each term within equation (13). The uncertainty in the fully-expanded jet velocity is:

Because the supply air tanks and connecting lines are unheated and exposed to ambient conditions, then to a good approximation the total temperature of the jet can be assumed to be equal to ambient temperature. Therefore, the total temperature uncertainty, 
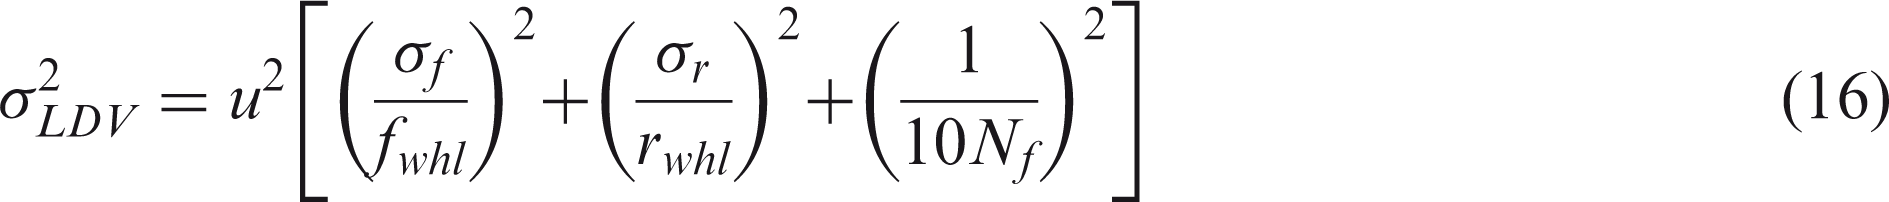
Beyond control of the jet, there is velocity uncertainty associated with the LDV probe itself, σLDV. This uncertainty stems from calibration of the LDV probe volume. During the calibration process, the linear velocity of the optical wheel is dependent on the distance of the LDV probe volume from the center of rotation. Given the finite diameter of the probe volume, the linear velocity of the wheel measured at the “bottom” of this volume is less than the linear velocity of the wheel measured at the “top” of the probe volume. Therefore uncertainty in wheel velocity is dependent on the uncertainty of the disk rotation frequency (fwhl) and the radial distance from the probe volume to the center of the wheel (rwhl). Uncertainties in linear wheel velocity will propagate into value of the corrected beam half angle. Lowe
45
describes the method used by the AUR Inc. system and shows that σLDV is proportional to the time duration of the particle burst, which can then be determined to be proportional to the minimum number of fringes encountered by the particle, Nf. The expression for σLDV is,
Intentional misalignment of the LDV probe with respect to the velocity component being measured introduces alignment error,
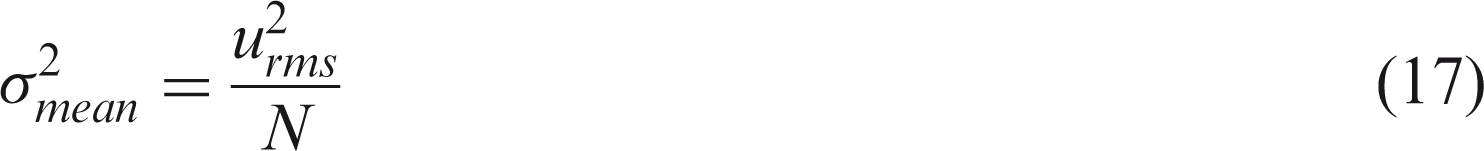
The mean of a finite, discretely sampled variable will in general have a different value than the true mean of the continuous quantity being measured. The difference between the true mean and the sample mean leads to the standard error of the mean, σmean.
45
The expression for standard error is equation (17).
Tabulated axial and radial velocity uncertainties.
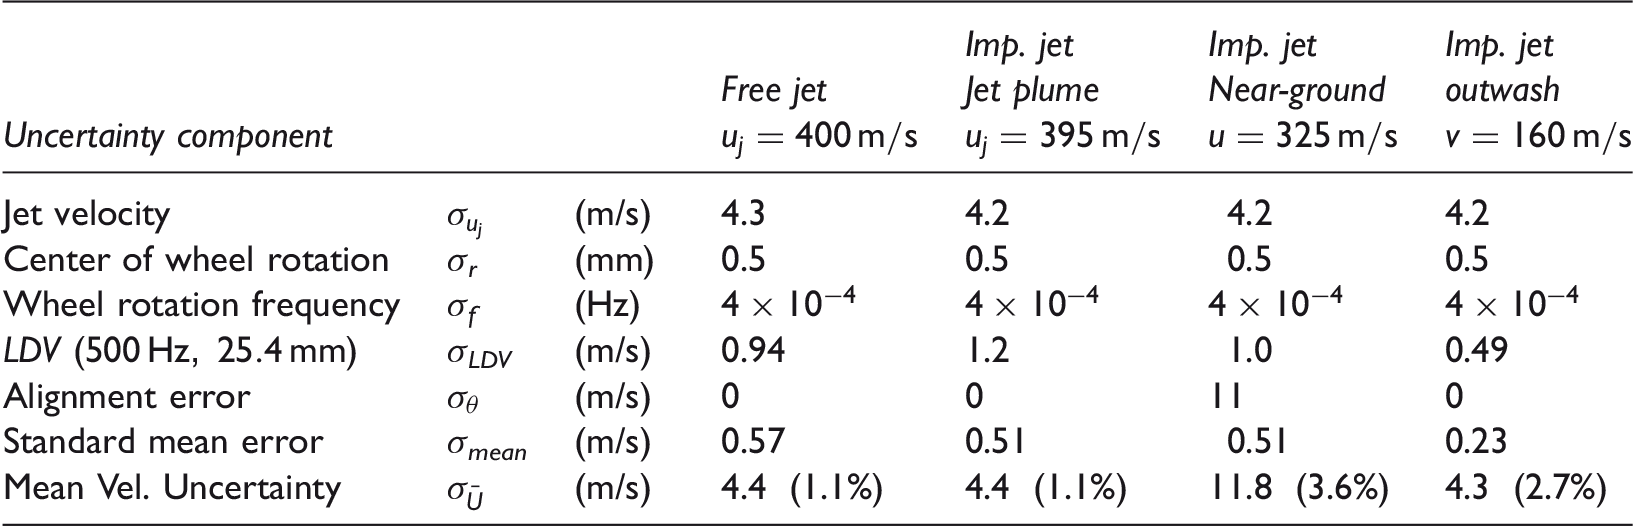
In the absence of
Velocity measurements in the vicinity of shock waves are susceptible to additional uncertainties due to particle lag effects and LDV probe volume sizing. Such sources of uncertainty are difficult to quantify prior to in-test measurements. Free jet LDV measurements in the vicinity of oblique shocks by Powers et al. 1 demonstrated two disparate velocity regions within the probe volume: one on either side of the shock wave. The effective uncertainty was taken to be the velocity difference between the two peaks in the probability density function and was up to 10% of the jet velocity.
Turbulence intensity uncertainty. Estimation of turbulence intensity uncertainty is limited to the axial component, Ku. Uncertainty in axial turbulence intensity will be shown to be a consequence of the uncertainty in the jet operating velocity, 
The partial derivatives in equation (18) can be evaluated analytically. Then, the only remaining unknown is the uncertainty associated with the rms velocity, 
For an axial turbulence intensity of 16% and jet velocity uj = 395 m/s, the uncertainty in turbulence intensity is 0.2%.
Experimental results from free jet measurements
This section presents the results of LDV measurements performed in jets issuing from military-style nozzles in a free jet configuration. Each nozzle was operated overexpanded at a nozzle pressure ratio (NPR
Free jet measurements at the nozzle exit plane
Unsteady LDV measurements were acquired at the nozzle exit plane to examine the initial shear layer properties of jets exhausting from the military-style nozzles. Very little analysis has been performed in the past to attempt to understand this region of the flow for these small scale nozzles. It is hoped that interrogating the flow on the nozzle lip line near the nozzle exit will provide insight to the interior nozzle boundary layer thickness. Computational aeroacoustic simulations rely on accurate simulations (or approximations) of the upstream turbulent boundary layer within the nozzle.
Figure 4 presents mean axial velocity and turbulence intensity measurements radially through the nozzle lip line at an axial location (downstream of the nozzle exit) of Nozzle exit jet shear layer velocity and turbulence for different baseline nozzles. Shown are mean axial velocities and axial turbulence intensities calculated from LDV point measurements at 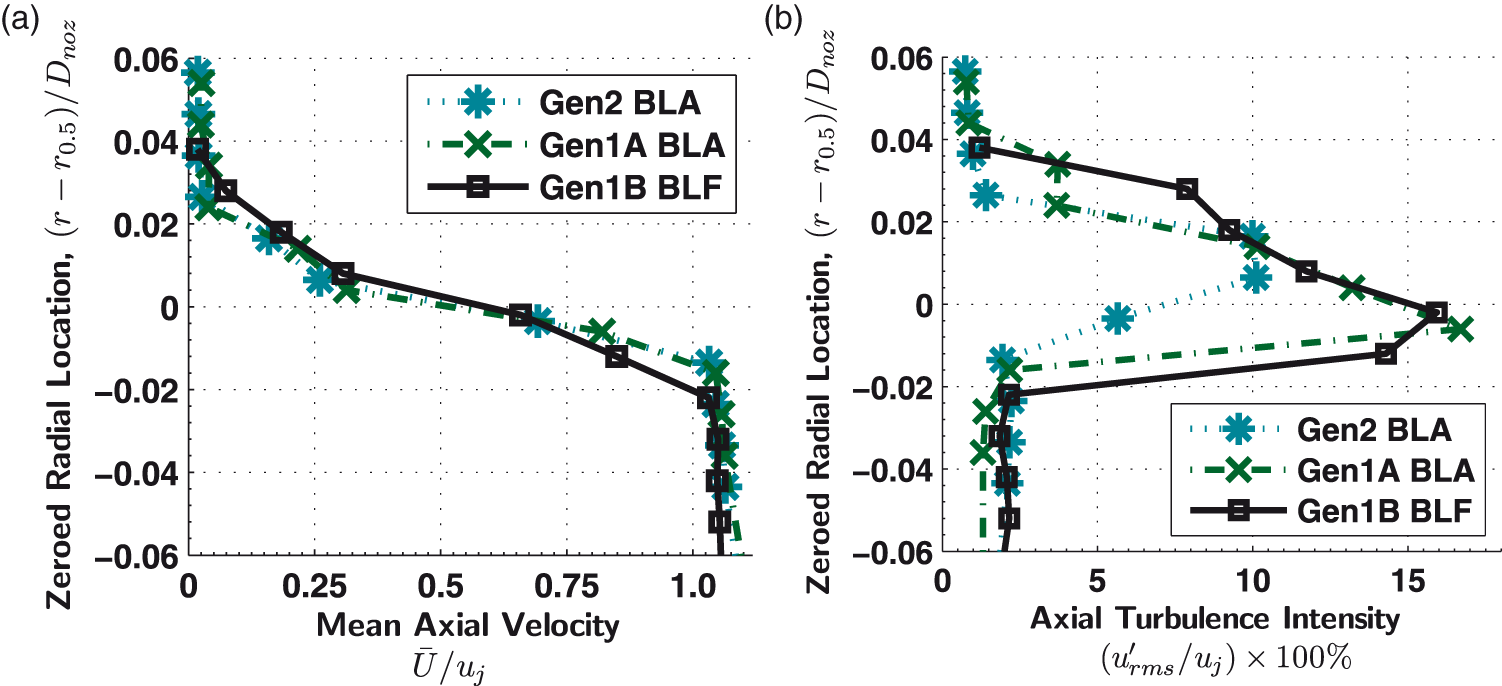
For further interrogation, the axial turbulence intensity for the initial shear layer for the different baseline nozzles is examined. Figure 4(b) shows the shear layer thickness normalized by the nozzle exit diameter and zeroed by the half velocity point. The Gen2 baseline appears to have the thinnest non-dimensional initial shear layer thickness. This agrees with the fact that the boundary layer would be thinner relative to the nozzle diameter with increasing Reynolds number. When examining the dimensional shear layer thickness for each nozzle, it was observed that all are very similar except the Gen1A BLA and Gen2 BLA nozzles are slightly thinner. This can be observed in Figure 4(a) as both of these nozzles' velocity profiles overlap almost exactly, and is attributed to thinner lip thicknesses in these nozzles as documented in Table 1.
Mean velocity and turbulence measurements along jet centerline
A strong shock cell structure is present in the jet plume when the nozzle is operating overexpanded at Free jet centerline velocity and turbulence intensity measurements for jet operating conditions: NPR = 3.0, 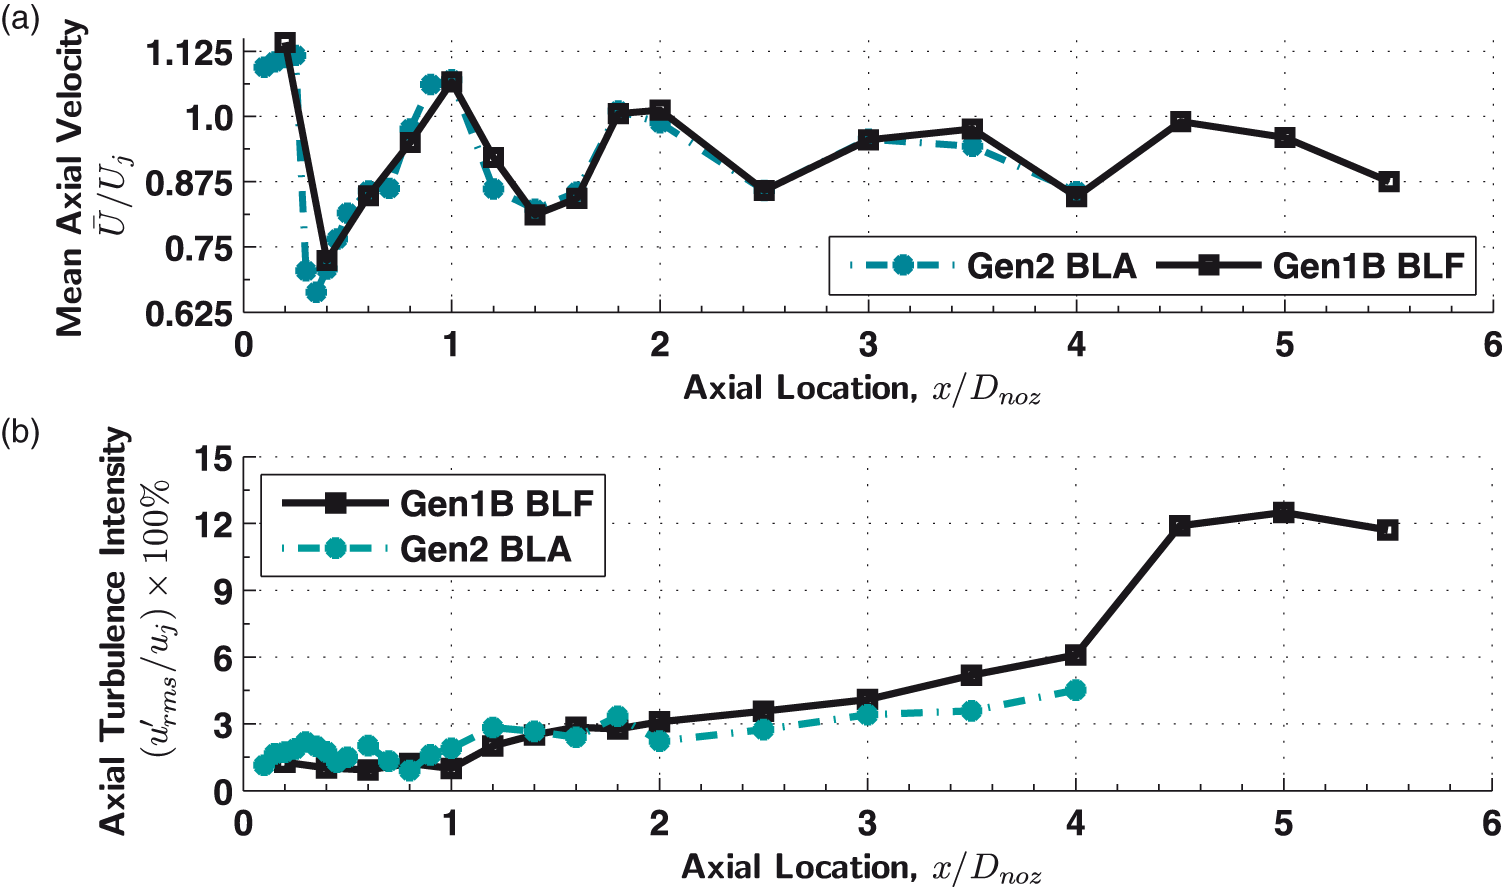
From Figure 5(a), it can be readily observed that the mean velocity between the two different nozzle scales is remarkably consistent and highlights the reliability of the LDV system, measurement procedures, and processing methodology. The velocity just downstream of the nozzle exit reaches the nozzle design Mach number of 1.65 (A corresponding fully-expanded velocity of 459 m/s). The Mach disk present in the jet flow then decreases the centerline velocity to below 300 m/s. The shock cell amplitudes and lengths agree between all measured nozzles with the five shock cells persisting through the measurement range past 5 nozzle diameters.
Figure 5(b) presents the axial turbulence intensity along the jet centerline for the two different scale nozzles. Again, consistency between the measurements of different scale nozzles is observed. The increase of turbulence intensity reaches a maximum around 5
Experimental results from impinging jet measurements
This section reports on mean velocity and turbulence measurements made throughout the supersonic jet plume, impingement region, and wall jet for a single jet exhausting from an axisymmetric, 11.9 mm converging-diverging nozzle, impacting normally on a simulated ground plane, or impingement plate. Rear jet operating conditions for the LDV measurements were
Mean velocity and turbulence measurements in impinging jet plume and impingement zone
The two-velocity component mean flow characteristics of the impinging jet plume and impingement region for jet stand-off distances of Velocity magnitude contours for 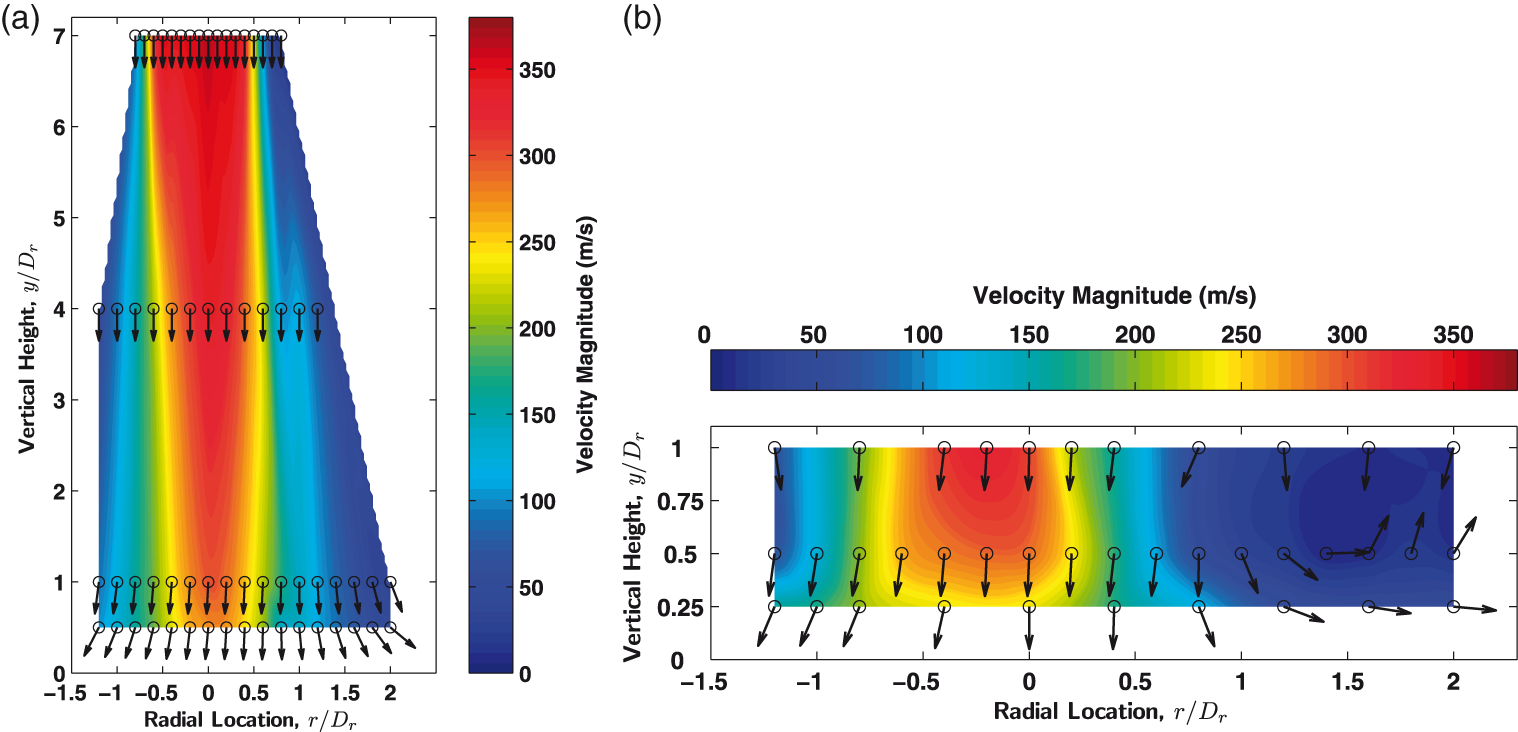
Axial turbulence intensity contours for jet stand-off distances of 11 and 5 jet diameters are shown in Figure 7(a) and (b), respectively. In both cases, measurements begin 4 Dr downstream of the nozzle exit plane. Turbulence intensity contours are generated using the same points as those shown in Figure 6. For a plate stand-off distance of 11 Dr the strongest mixing in the jet shear layer exists greater than 5 Dr above the surface of the ground plane. However, for plate stand-off distances of both 11 and 5 diameters, turbulence intensities greater than 14% exist throughout the jet down to 0.5 Dr above the impingement plate. This is especially pronounced at stand-off distance of Axial turbulence intensity contours for 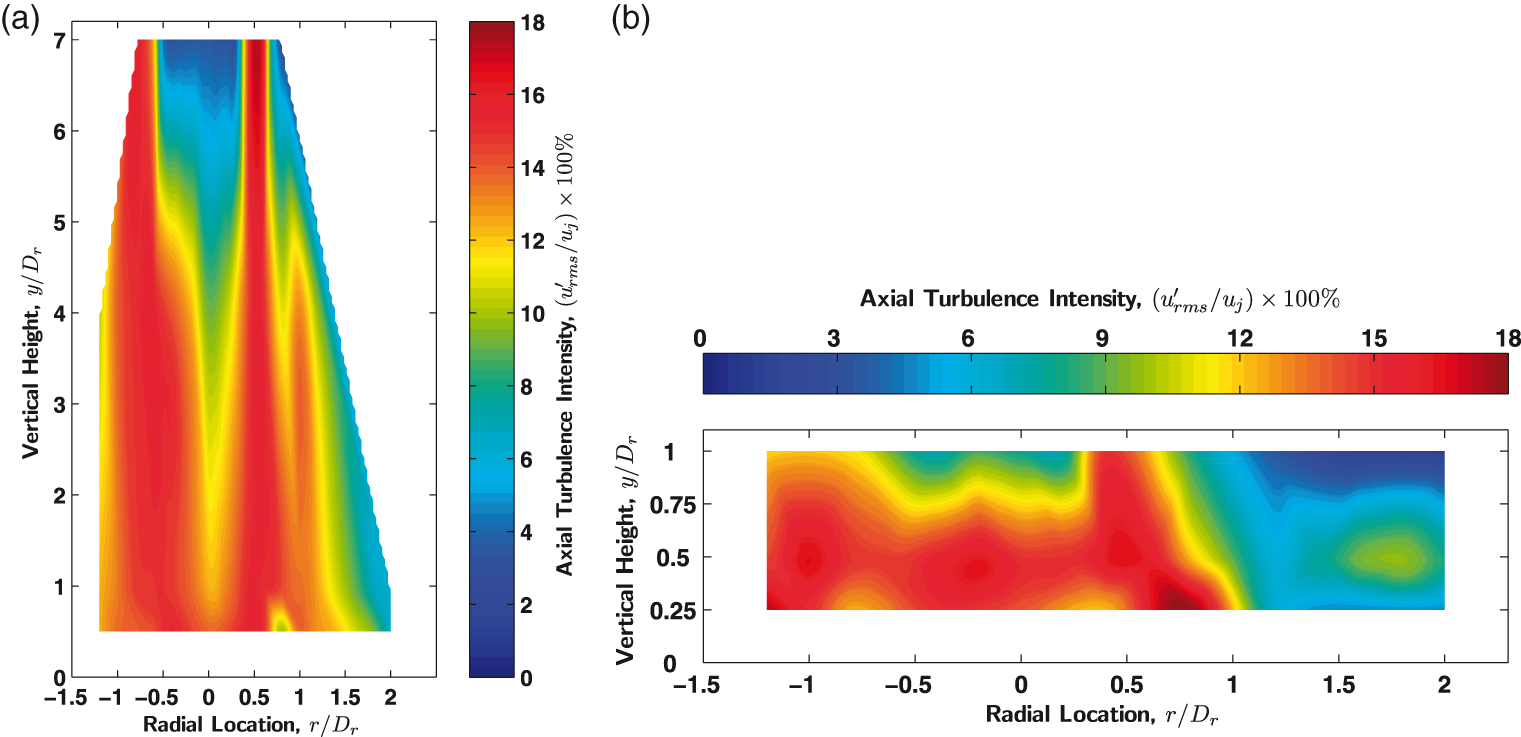
The impinging jet shadowgraph images presented in Hromisin 36 are focused on the jet impinging on the ground plane for plate stand-off distances of 11 and 5 diameters. For a 5 Dr plate separation, a stand-off shock was observed in the jet plume above the surface of the ground plane. Closer inspection of this shadowgraph places the stand-off shock at approximately 0.5 Dr above the ground plane surface. Oscillations in the stand-off shock position around the position of the probe volume would produce strong fluctuations in the local velocity which could explain the higher turbulence intensities observed just off the surface of the ground plane. Although not observed directly in this work, Henderson and Powell 46 and Henderson et al.47,8 have shown jet instabilities originating upstream can cause significant stand-off shock oscillations and thus strong oscillations in the surrounding flow.
Mean velocity and turbulence measurements in impinging jet outwash flow
It is important to quantify the mean velocity in the outwash flow of the impinging jet flow field; however, obtaining the gusts associated with turbulent fluctuations gives a more complete picture of what is happening. Of practical concern to the U.S. Navy in operating STOVL aircraft in confined spaces, such as the flight deck of ships, is the effect of the outwash on the surrounding environment. In full-scale environments, it is the outwash produced by the exhaust of the STOVL aircraft that convects the high speed, high temperature flow towards personnel and equipment in the vicinity of the aircraft. As well, Worden et al. 48 note that other researchers have observed the outwash flow being an additional source of high amplitude Mach wave radiation noise if the turbulence convection velocities are supersonic. The U.S. Navy has spent considerable effort in defining the areas around a hovering aircraft where it is potentially dangerous for ground crew or equipment to be located. 49 These personnel and equipment hazard zones are typically defined by a pressure or wind speed that limits the position of a person or object within a certain distance from the operating aircraft. Preston et al. 49 discuss the importance of using unsteady velocity data to “provide more meaningful and realistic statistical metrics for outwash force,” than what can be obtained using averaged outwash velocity profiles. The basis for this work was to determine the aerodynamic drag force that personnel may be exposed to if they were immersed in a given outwash flow field.
To this end, unsteady radial-component velocity measurements were performed in the wall jet, or outwash flow region, of the flow field for a lift plate height of 11 jet diameters. Rear jet operating conditions were
Outwash flow measurements between Mean outwash flow LDV measurements compared to Pitot rake data at similar locations for 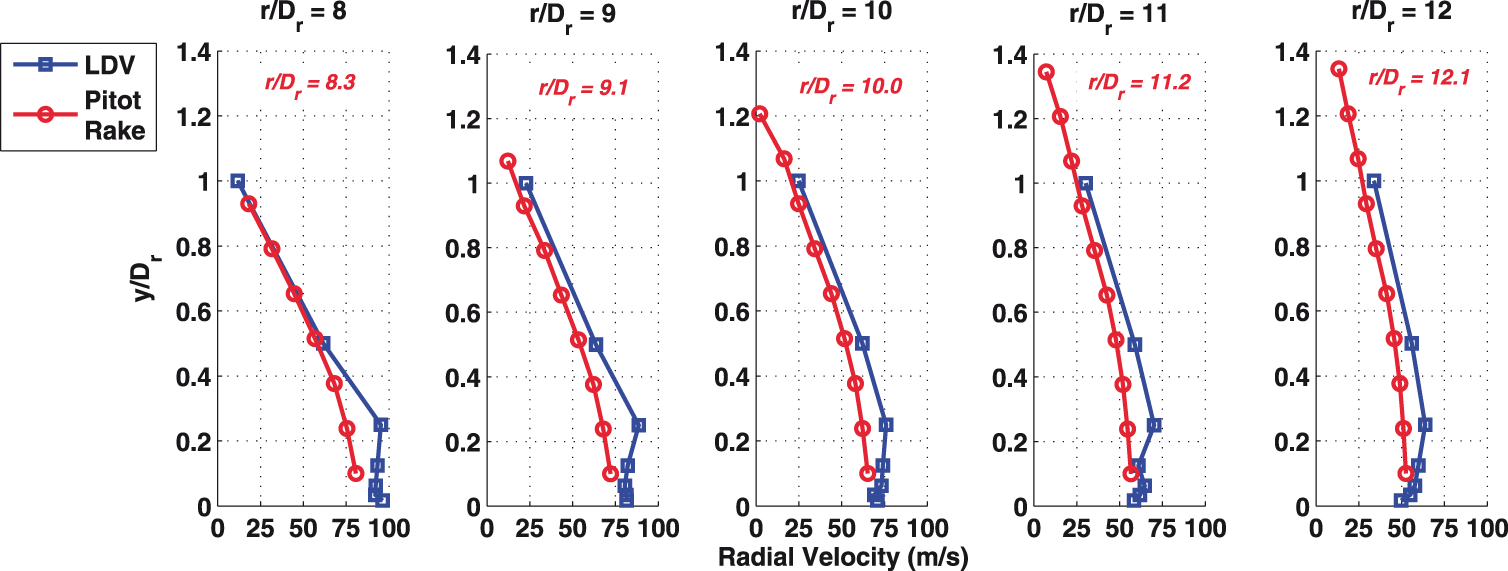
However, at nearly all positions, peak velocities measured using LDV are higher than those observed in the Pitot rake measurements. This is likely due to spatial averaging in the Pitot probes near the point of maximum velocity. Because the Pitot-probe tip is larger than the size of the LDV probe volume, Pitot probe measurements are averaging over a larger vertical section of the wall jet. As such, the Pitot probes may not be able to accurately resolve the peak velocity in a wall jet of this scale. It is important to note that the authors of Myers and McLaughlin 50 believe the impinging jet apparatus may not have been oriented perfectly vertical at the time Pitot rake measurements were taken. This would introduce angularity in the resulting outwash flow such that there would be a non-negligible velocity component tangential to the Pitot rake that could not be measured.
Figure 9(a) presents a contour plot of the mean radial velocity in the wall jet. Velocities as high as 125 m/s are observed out as far as 6.5 Dr from the jet centerline. Furthermore, velocities as high as 25% of the nozzle exit velocity persist out to 9 diameters. The wall jet is largely confined close to the ground plane, Mean radial velocity contour and scaled radial velocity profiles in outwash flow region for 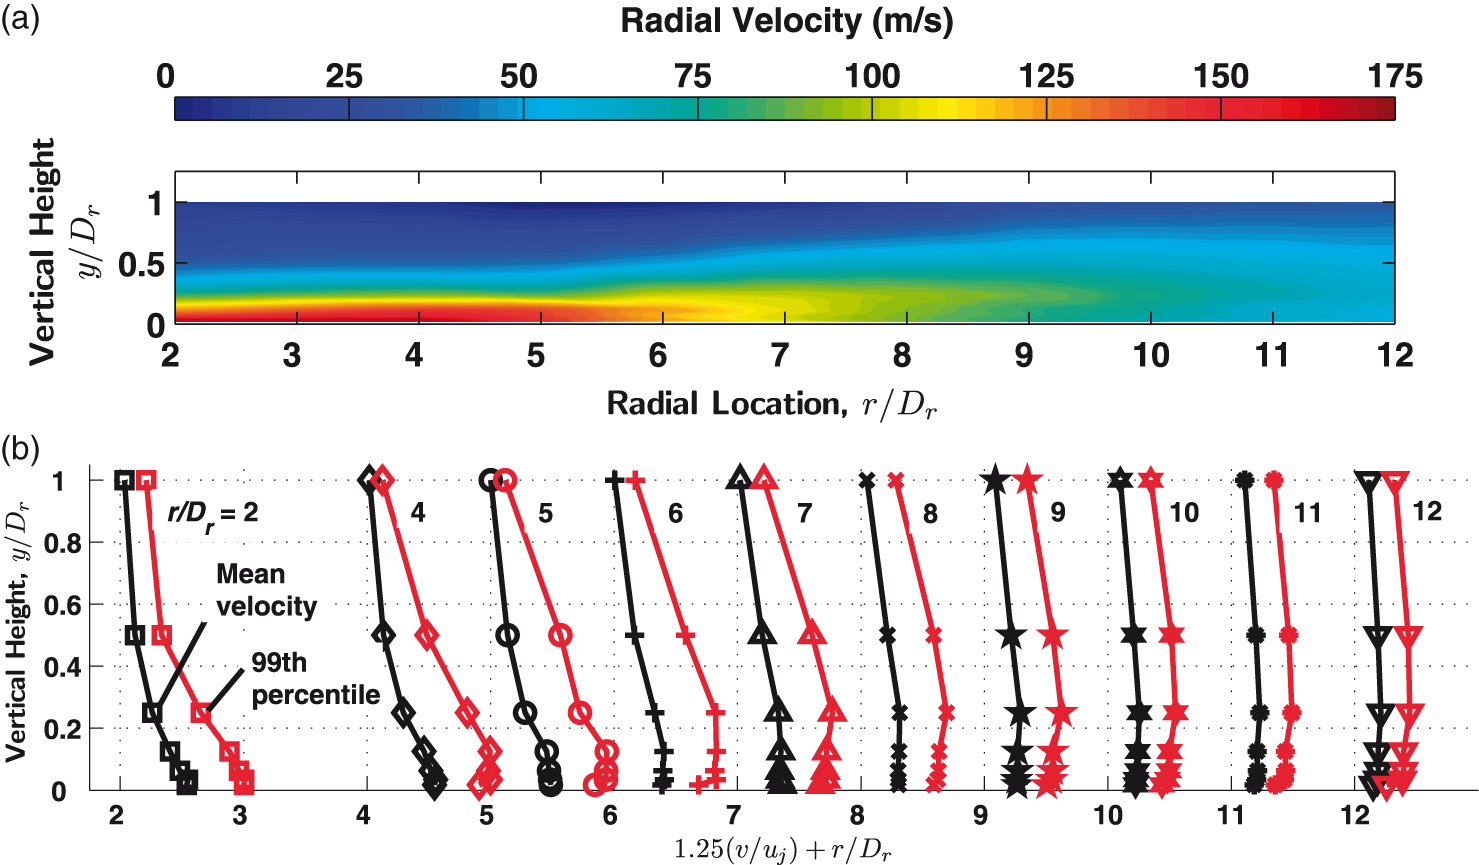
Scaled outwash flow velocity profiles are shown in Figure 9(b) in black. Each profile is zeroed to its corresponding
Scaled radial outwash turbulence intensity profiles are shown in Figure 10. Each profile is zeroed to its corresponding Scaled outwash flow radial turbulence intensity profiles for 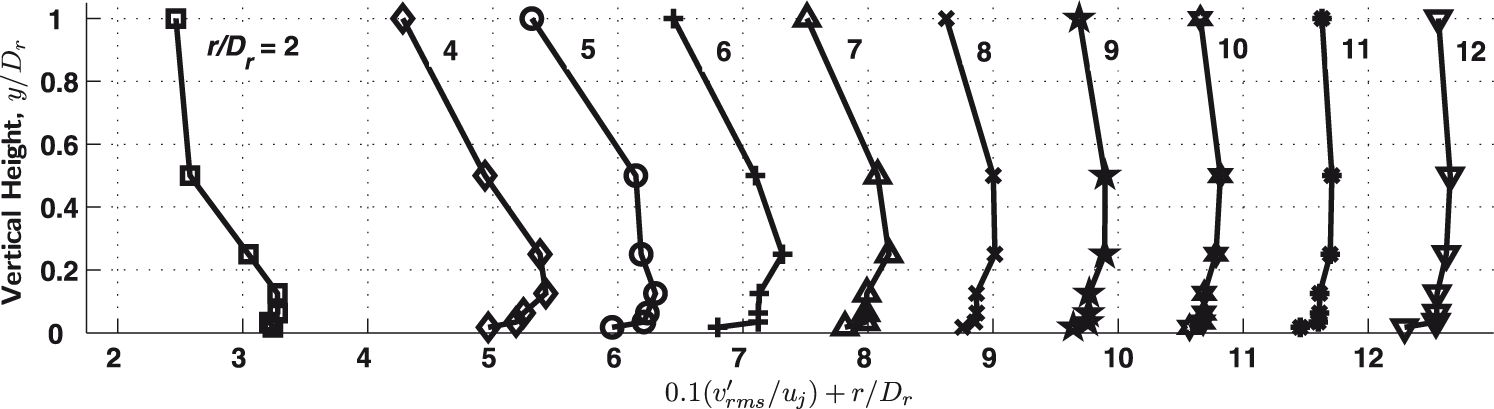
To further inspect the development of the outwash flow, normalized mean radial outwash velocities and radial turbulence intensities are presented in Figures 11 and 12, respectively. Mean radial outwash velocities are normalized by the maximum velocity observed at the corresponding radial station, Normalized radial velocity profiles of the outwash flow for Normalized turbulence intensity profiles of the outwash flow for 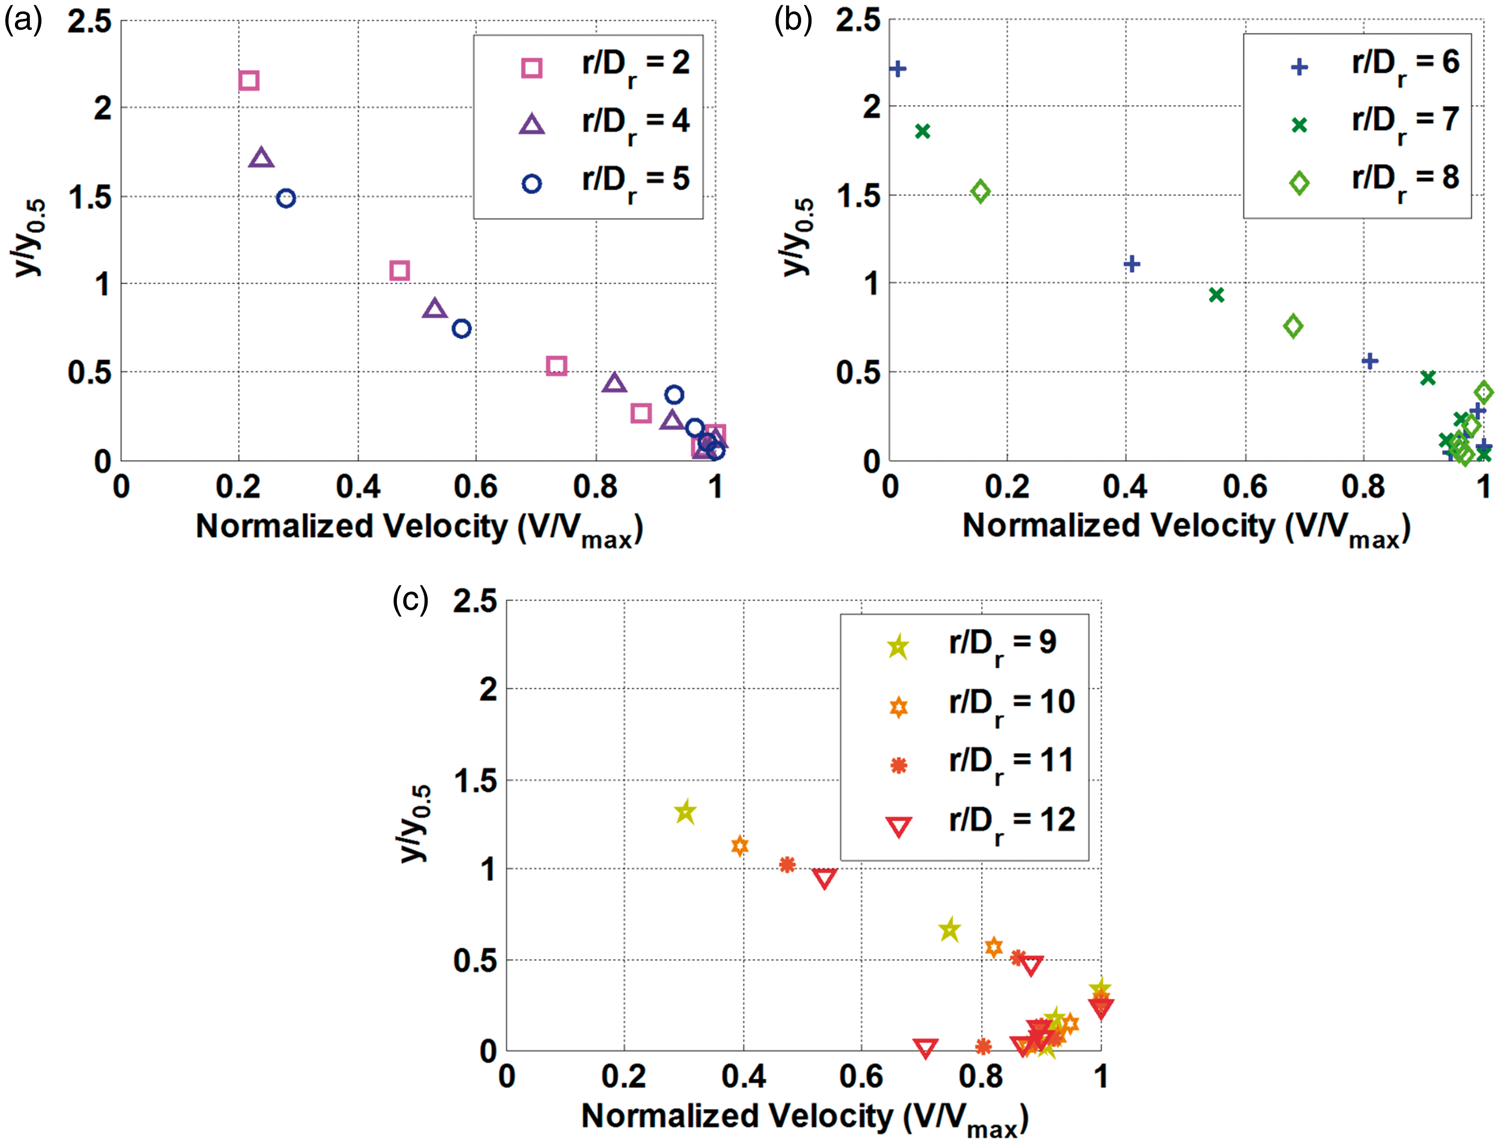
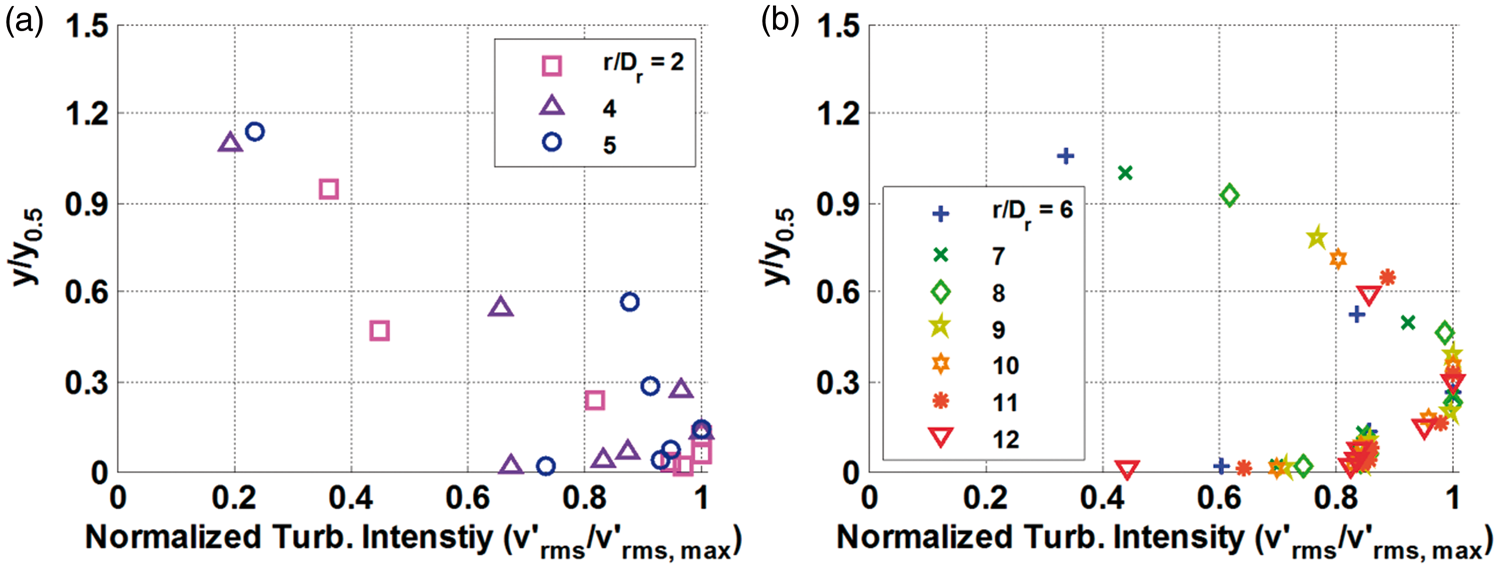
Figure 11 presents the normalized mean radial outwash velocities. It is clear that the outwash flow velocities between
At radial distances greater than 9 Dr, the outwash flow is fully-developed. This is in agreement with Myers and McLaughlin
50
who observed fully-developed flow from
Figure 12 presents the normalized radial turbulence intensities. In the early wall jet, Figure 12(a), there is a very rough collapse of the data. Although, this is an aerodynamically complex region of the flow with significant turning and strong velocity gradients so a collapse of turbulence intensities is not necessarily expected. Figure 12(b) shows the normalized radial intensities for
Impinging jet velocity spectra
Velocity spectra have been calculated from unsteady measurements taken in the impinging jet plume, impingement region, and wall jet for stand-off distances of
Because the LDV system was built in-house it is imperative to qualify unsteady velocity measurements and the fuzzy slotting spectra-estimating method. To this end, velocity spectra taken in the impinging jet plume for a lift plate stand-off of 11 Dr are compared with available velocity spectra data obtained by other researchers in supersonic round jet flows. Velocity spectra comparisons are summarized in Figure 13 – adapted from Papamoschou et al.
52
with permission. Spectra were normalized by their mean square values. The two impinging jet plume velocity spectra shown were obtained on the centerline and lip line 4 Dr downstream of the nozzle exit. The impinging jet flow closely resembles a free jet flow at this location. Impinging jet LDV spectra are compared with free jet spectra measured on the lip line at LDV impinging jet plume velocity spectra compared with free jet velocity spectra using other measurement techniques. Figure adapted from Papamoschou et al.,
52
with permission. (a) u = 258 m/s, 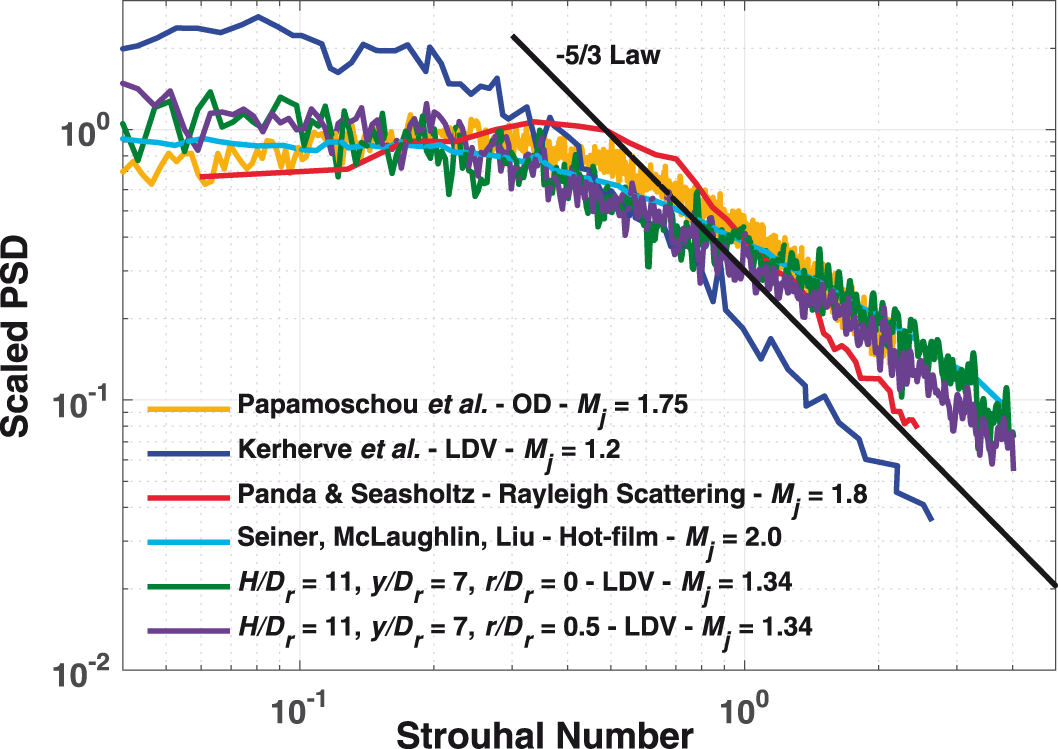
The shapes and normalized magnitudes of the impinging jet velocity spectra agree remarkably with free jet velocity spectra measured above Mj = 1.75. As well, all spectra exhibit a
For a lift plate stand-off of 5 Dr, spectra have been calculated from axial measurements in the impingement region and radial measurements in the wall jet shear layer. Experimental parameters correspond to those used by Myers et al.
54
for impinging jet acoustic measurements. A Blue spectra: Velocity spectra obtained from LDV measurements for 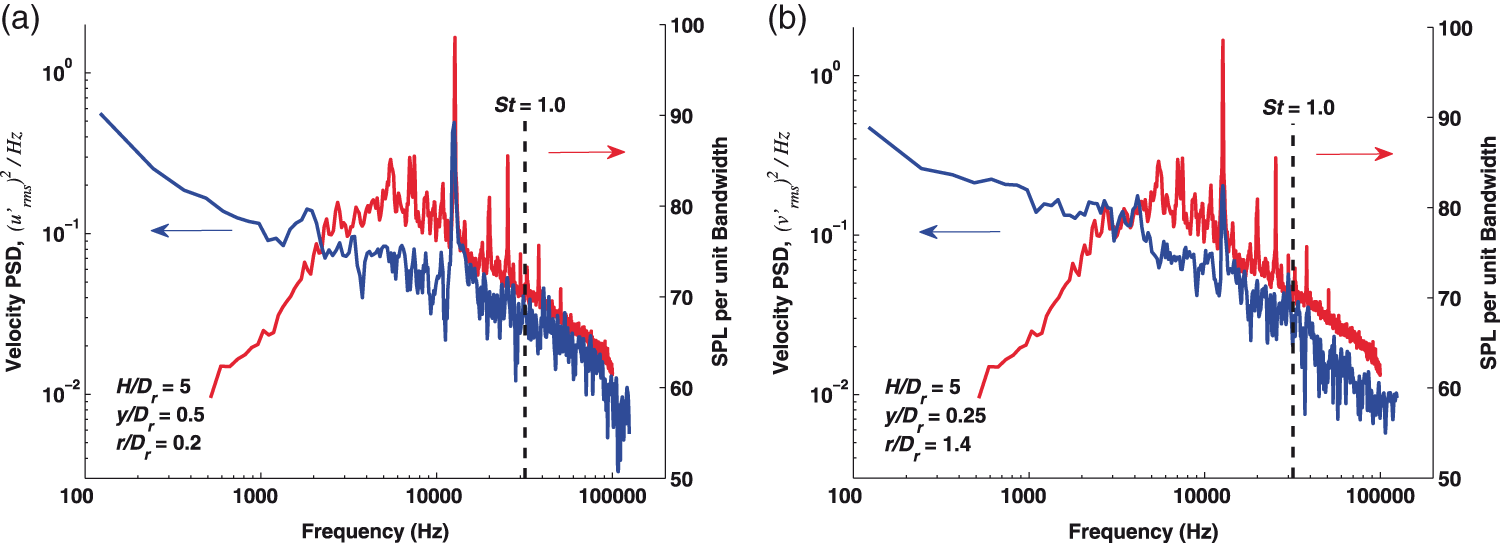
Both graphs show a distinct tone present in the velocity spectra. This tone shows excellent agreement with the acoustic measurements of Myers et al.
54
Both measurements indicate a tone frequency of 12.7 kHz. The amplitude of this tone appears greatest close to the jet centerline near the approximate location of the stand-off shock (
Summary and conclusions
Mean velocity and turbulence measurements were performed using a laser Doppler velocimetry instrument throughout the flow fields produced by university-scale supersonic jets exhausting from nozzles in configurations relevant to practical, full-scale application.
Axial-component mean and unsteady laser Doppler velocimetry measurements were performed in the supersonic core and shear layer of overexpanded jets exhausting freely from military-style nozzles. Mean velocities and turbulence intensities measured near the lip line at the nozzle exit plane showed good consistency when jet Reynolds number was increased by 50%. Mean axial velocities along the jet centerline, including modulations in mean flow velocity due to the quasi-periodic shock cell structure, compared well for a 20% increase in jet Reynolds number.
Two-components of mean velocity and turbulence were measured in the jet plume, impingement zone, and wall jet region of a single, on-design supersonic jet impinging normally on flat plate. Up to moderate jet stand-off heights, the impingement region was found to remain within 0.5 Dr above the ground plane. Axial turbulence measurements showed elevated flow fluctuations in the approximate vicinity of a stand-off shock above the plate. In the outwash flow, turbulent fluctuations were found to elevate unsteady velocities well above the local mean velocity. Velocity spectra were obtained from unsteady axial and radial velocity measurements throughout the flow. Both fluctuation components showed a distinct peak at the same frequency as the jet impingement tone measured in prior acoustic field measurements. This peak was found to be most distinct near the impingement zone and decayed further out in the wall jet.
Continuing unsteady LDV measurements would benefit from companion hot-wire measurements as a comparison point to better understand the accuracy of rms and PSD data. Further simultaneous multi-velocity component or multi-point measurements are warranted. Multi-component measurements would allow for determining off-axis components of the Reynolds stresses. Multi-point measurements would yield convection velocities and correlation length scales of the large scale structures within the flow fields. These properties are relevant to the development of accurate turbulence models and aeroacoustic prediction codes.
Footnotes
Acknowledgements
The authors would first and foremost like to acknowledge the help and tutelage of Professor McLaughlin for this research. This paper heavily drew from a prior conference paper, two PhD Dissertations, and one Master’s Thesis from the authors that he advised. Due to the nature of this special issue in his honor we decided not to have him as a co-author, even though he was obviously an integral part of this research and helped edit much of the original text. This current paper focuses on the culmination of experimental facility development and buildup over several years at Penn State University. We enjoyed developing and utilizing multiple facility configurations and measurement techniques. This work resulted in many planning sessions with Dr. McLaughlin that included numerous Gantt charts as well as discussions while walking the University golf course.
As two recent graduates of his, and one current student, we are truly honored to be able to contribute an article to this special edition in his honor. We are sure we won’t fully understand all of the benefits and lessons we have learned from him for many years to come.
The authors would also like to thank Professor Philip J. Morris of the Aerospace Department for guidance and advice for all of the experiments presented within this study. The authors thank colleagues in the Aerospace Department J.D. Miller and Nicholas Rudenko for their assistance with the laboratory experiments presented within this paper. We would also like to acknowledge and thank all of Prof McLaughlin’s recent and prior students that spent tireless hours on the accumulated facility development that was only touched on briefly in the introduction.
The authors received the DoD SMART Scholarships during the time this research was conducted and gratefully thank the program for the sponsorship. The authors SMH, RWP, and LMM wish to thank Mr. Terence Ghee, Mr. Allan Aubert, and Dr. David Findlay, respectively, for serving as SMART program mentors. Lastly, the authors wish to thank collaborators at Virginia Tech, specifically Dr. K. Todd Lowe, and the recently graduated Dr. Tobias Ecker and Donnie Brooks who assisted in the development of the laser Doppler system with the advice and expertise to help get the system off the ground.
The views and conclusions contained herein are those of the authors and should not be interpreted as necessarily representing the official policies or endorsements, either expressed or implied, of the Office of Naval Research, or the U.S. government.
Declaration of conflicting interests
The author(s) declared no potential conflicts of interest with respect to the research, authorship, and/or publication of this article.
Funding
The author(s) disclosed receipt of the following financial support for the research, authorship, and/or publication of this article: This work was sponsored by the Office of Naval Research, ONR, under Grant #N000141410830, with contracting officer Dr. Judah Milgram.