
Abstract
The current trends for next generation turbofan engines are towards shorter nacelles and increased distances between the fan and the outlet guide vanes. This leads to an overall reduction in lined surface areas as well as an increase in the relative importance of the interstage liner, which is the liner placed between the rotor blades and the stator vanes. So far most of the efforts have been on liners for intakes and bypass ducts. The interstage is different in that the liner is subject to a mean flow with a strong swirl component and shear. The focus of this paper is on the effect of swirling flow on optimal liner attenuation in the interstage region. A broadband source downstream at the Outlet Guide Vanes (OGV) consisting of all propagating modes with equal power in each mode is used. Optimum impedance plots are generated for approach and take-off mean flow conditions. The effect of swirl on liner optimum resistance and reactance and optimum insertion loss is observed for a frequency range characteristic of real turbofan engines.
Keywords
Introduction
A recent study on the far term noise reduction technology roadmap for a Large Twin-Aisle Tube-and-Wing subsonic transport 1 show that fan noise can be reduced at the source by changing the count, spacing, and geometry of rotor and stator blades, with additional benefits by adding active noise control or blowing techniques. This roadmap also emphasizes the importance at fan noise reduction is typically accomplished through application of acoustic liners.
An optimized approach is needed to take full advantage of interstage liners. The method to specify the acoustic impedance for the interstage liners often neglects the swirling component of the mean flow, which is of the order of 15 to 45 percent of the mean axial velocity in the interstage region. 2,3
The SwirlProp code was developed to contribute to understanding and predicting the effect of the swirl on liner attenuation. The methodology and validation of this tool is presented in a companion paper.4 The current paper applies SwirlProp to analyse the effect of swirl and liners on sound propagation in the insterstage region of turbofan engines. Geometric and mean flow parameters and frequency range were carefully chosen to correspond to realistic values.
First, the effect of swirling flow per se is evaluated. The effect of swirling flows on cut-on ratio of modes, axial wavenumbers and phase speeds is discussed in the absence of acoustic treatment.
This article focusses on the effect of swirling flow on optimal liner attenuation in the interstage region. A source consisting of all propagating modes with equal power in each mode is postulated. This is used to simulate a broadband source downstream at the OGV propagating upstream, against the flow. Optimum impedance plots are generated for approach and take-off mean flow conditions. The effect of swirl on liner optimum resistance and reactance and optimum insertion loss is observed for a frequency range characteristic of more realistic turbofan engines. For completeness, the variation of optimal impedance and insertion loss with the direction of propagation is also analysed.
Methodology
The effect of swirl on liner attenuation is predicted using the SwirlProp code, which is based on the Linearized Euler Equations together with the Ingard-Myers impedance boundary condition and is discretized using a fourth-order Finite Difference Method. 5
The formulation for acoustic power and insertion loss used in this study is presented in this section. A multi-modal source is defined by assuming that the broadband source modes are uncorrelated and carry equal power. This is subsequently used for the optimum impedance calculations. The modal content for both cases (with and without acoustic treatment), is based on uncorrelated cut-on acoustic modes for the hard walled case.
Acoustic power
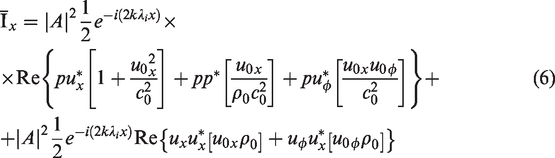
For isentropic irrotational flow the acoustic energy is conserved and an energy conservation equation can be derived from the Euler equations. However, the pressure of non-uniform mean flow modifies the expression for sound power. An acoustic intensity expression was derived by Myers,6,7 who showed that the time-averaged intensity flux in a non-uniform mean flow is not conserved. Since in this case modes are not orthogonal, 7 interference between radial modes should be accounted for. Atassi 8 derived an expression to calculate the sound power in an annular duct with swirling flow in the high frequency limit using normal mode solutions and showed that since the coupling between vorticity and acoustic waves is weak in the high frequency limit, the acoustic energy can be considered to be conserved as an approximation. Although this formulation has its limitations, 9 it was has been used by other authors for the sound propagation in swirling flows8,10 and in irrotational homentropic swirling flow. 11 Although approximate, it will be used also in the current study.
Acoustic intensity is defined as the flux of acoustic energy per unit area across a surface. For swirling flows, the acoustic intensity in the axial direction it is defined as
8
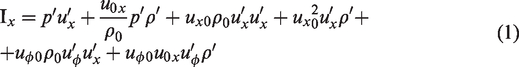
Consider a modal solution of the form
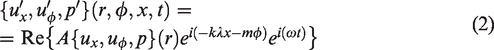
In this equation, A is the modal amplitude and
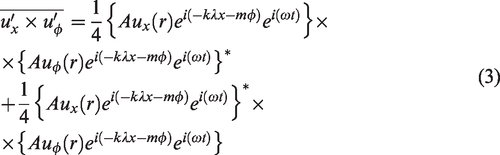

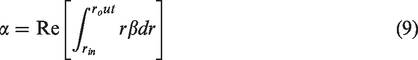
The acoustic power for a single mode is given by the integration of the above expression over the duct area
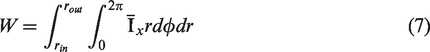
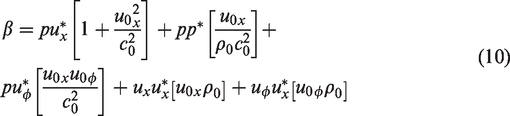
Substituting the acoustic intensity expression given by equation (6), the acoustic power is rewritten as

and
In this paper it is assumed that the broadband source modes are uncorrelated and carry equal power
12
so that equation (8) is rewritten as

The total sound power is calculated by summing up the power of all individual modes of azimuthal order m and radial order n

Insertion loss
The insertion loss is then calculated by the difference between power levels of sound propagation in hard-walled and lined ducts, for the same source level and over the same length of the duct, i.e.

In a lined duct of length L, the sound power at x = L is given by

Substituting equation (14) and equation (15) in equation (13), the expression to calculate the insertion loss in the duct exhaust is written as

For a given frequency and azimuthal mode order, the axial wavenumber correspondent to each radial mode n is calculated and stored in order of attenuation (from lower to higher). The transmission loss is then calculated using the first nHW radial modes.
The effect of swirl in the absence of acoustic treatment
The effect of swirling flows on sound propagation in an annular duct in the absence of acoustic treatment is analysed to create a baseline to compare with the case where both swirling flow and acoustic treatments are included. A suitable multi-modal source is also defined for the optimum impedance calculations in the following section. The modal content for this source for cases with and without acoustic treatment, is based on uncorrelated cut-on acoustic modes for the hard walled case, as outlined in the previous section.
Flow parameters and geometry
Results are presented for two types of mean swirling flows: rigid body (
Typical eigensolutions for the Hard-Walled case
The effect of swirl is greater for radial modes near cut-off and diminishes for higher radial mode orders. The concepts of cut-off line and cut-off ratio will be used to evaluate the impact of swirling flow in axial wavenumbers. If the cut-off ratio is higher than 1.0, the mode propagates. If it is lower than 1.0, it decays. The limiting case occurs when the cut-off ratio is equal to one. In this case, the expression for the axial wavenumber at the cut-off line is given by
5
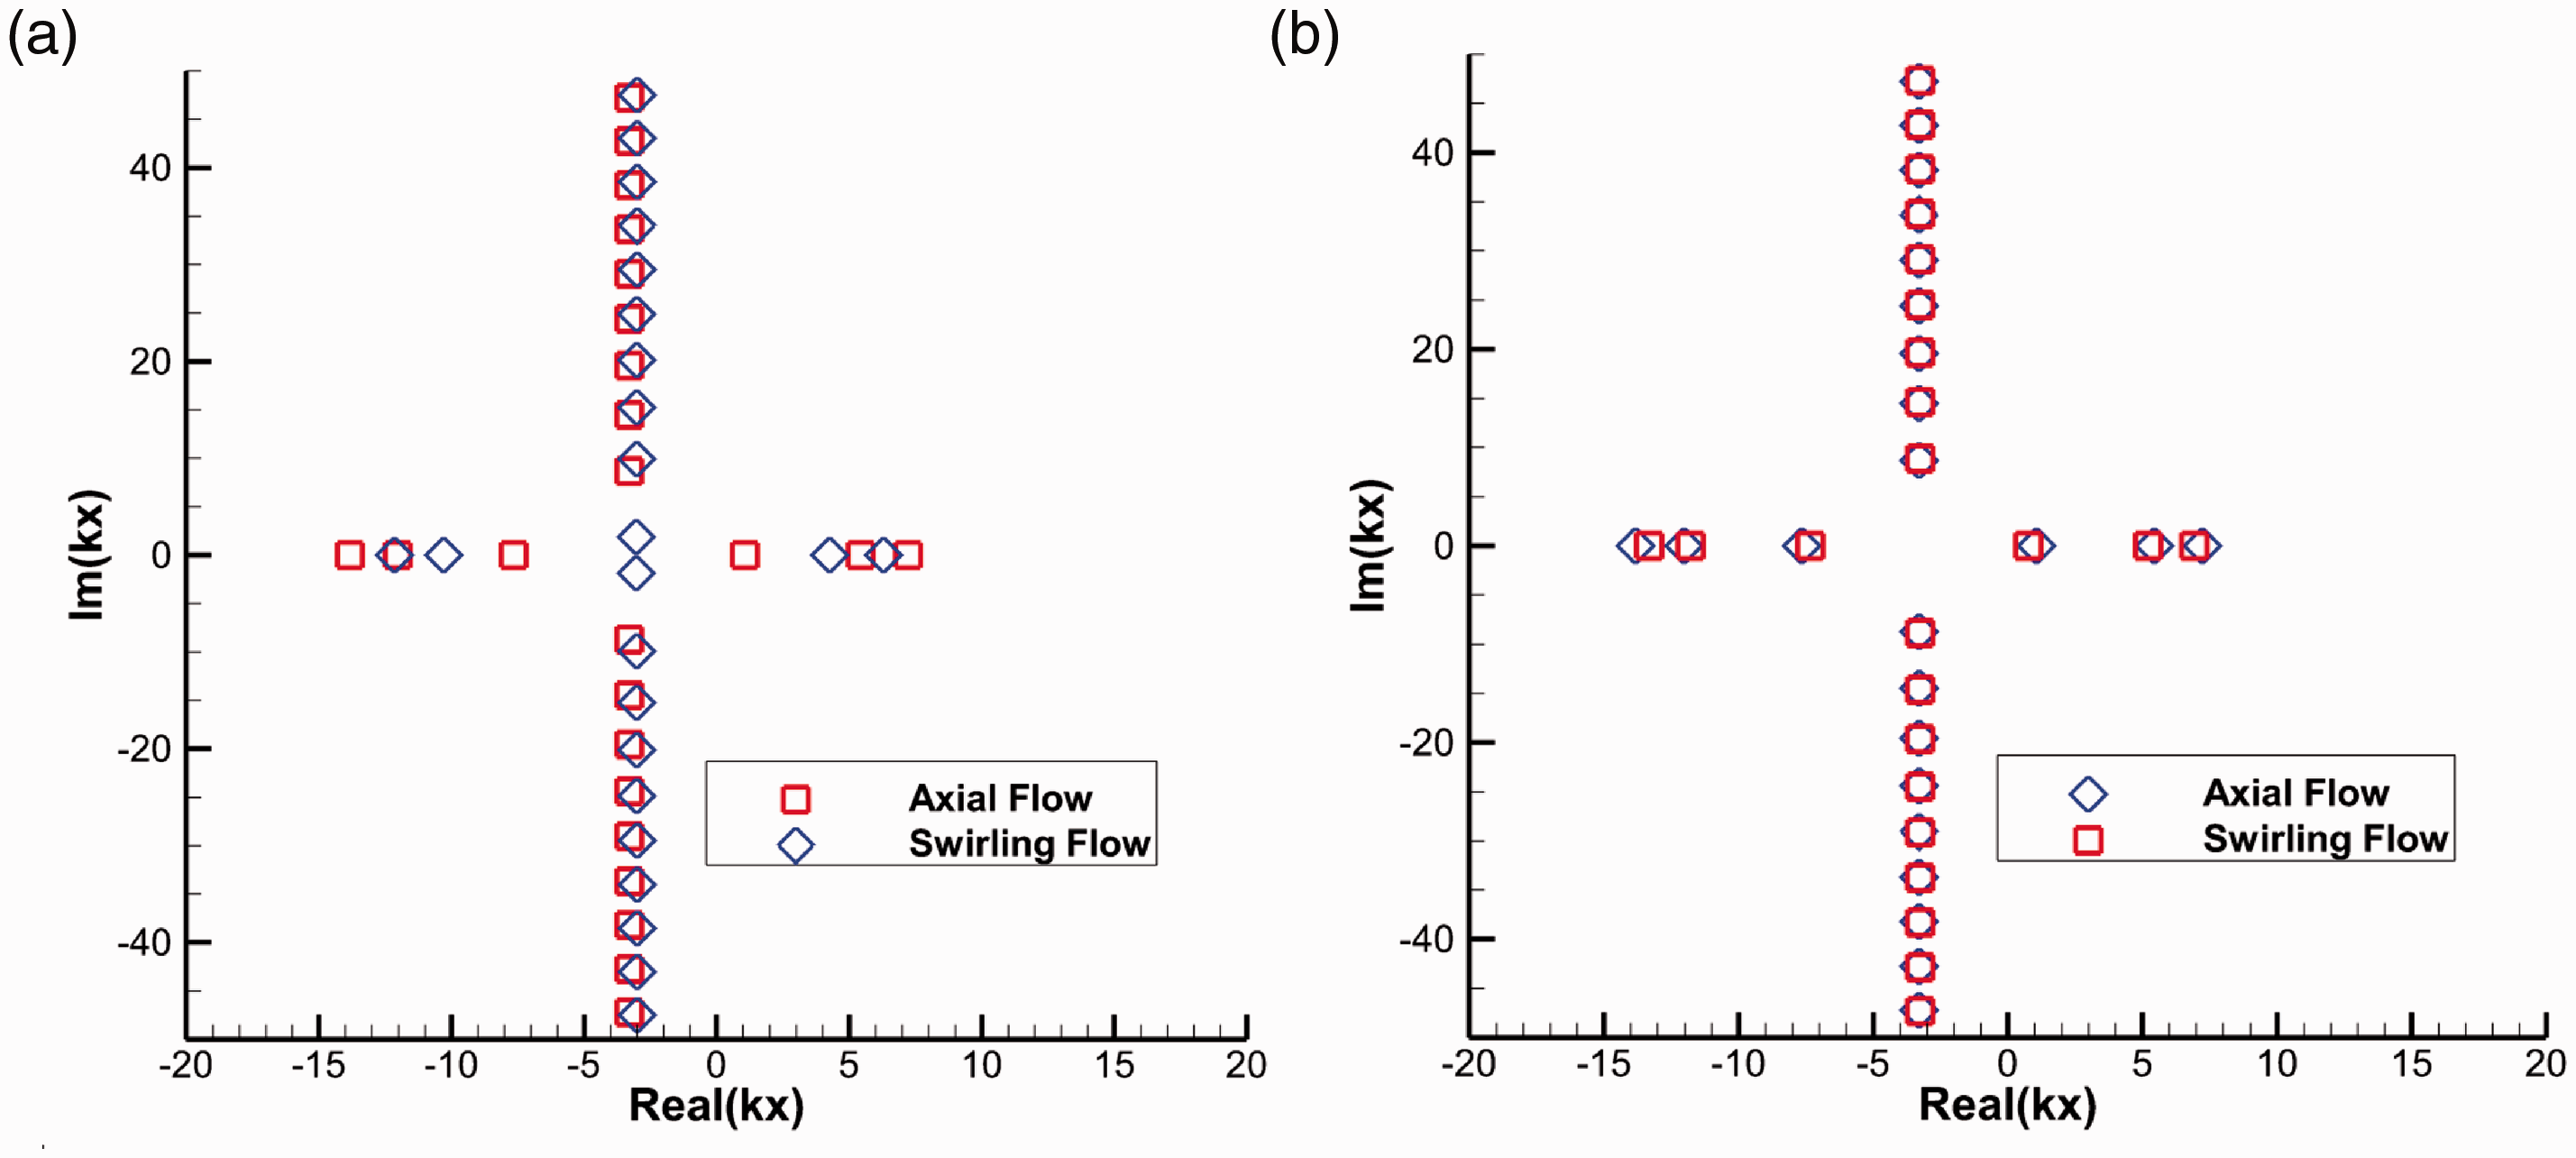
Relatively low order circumferential modes
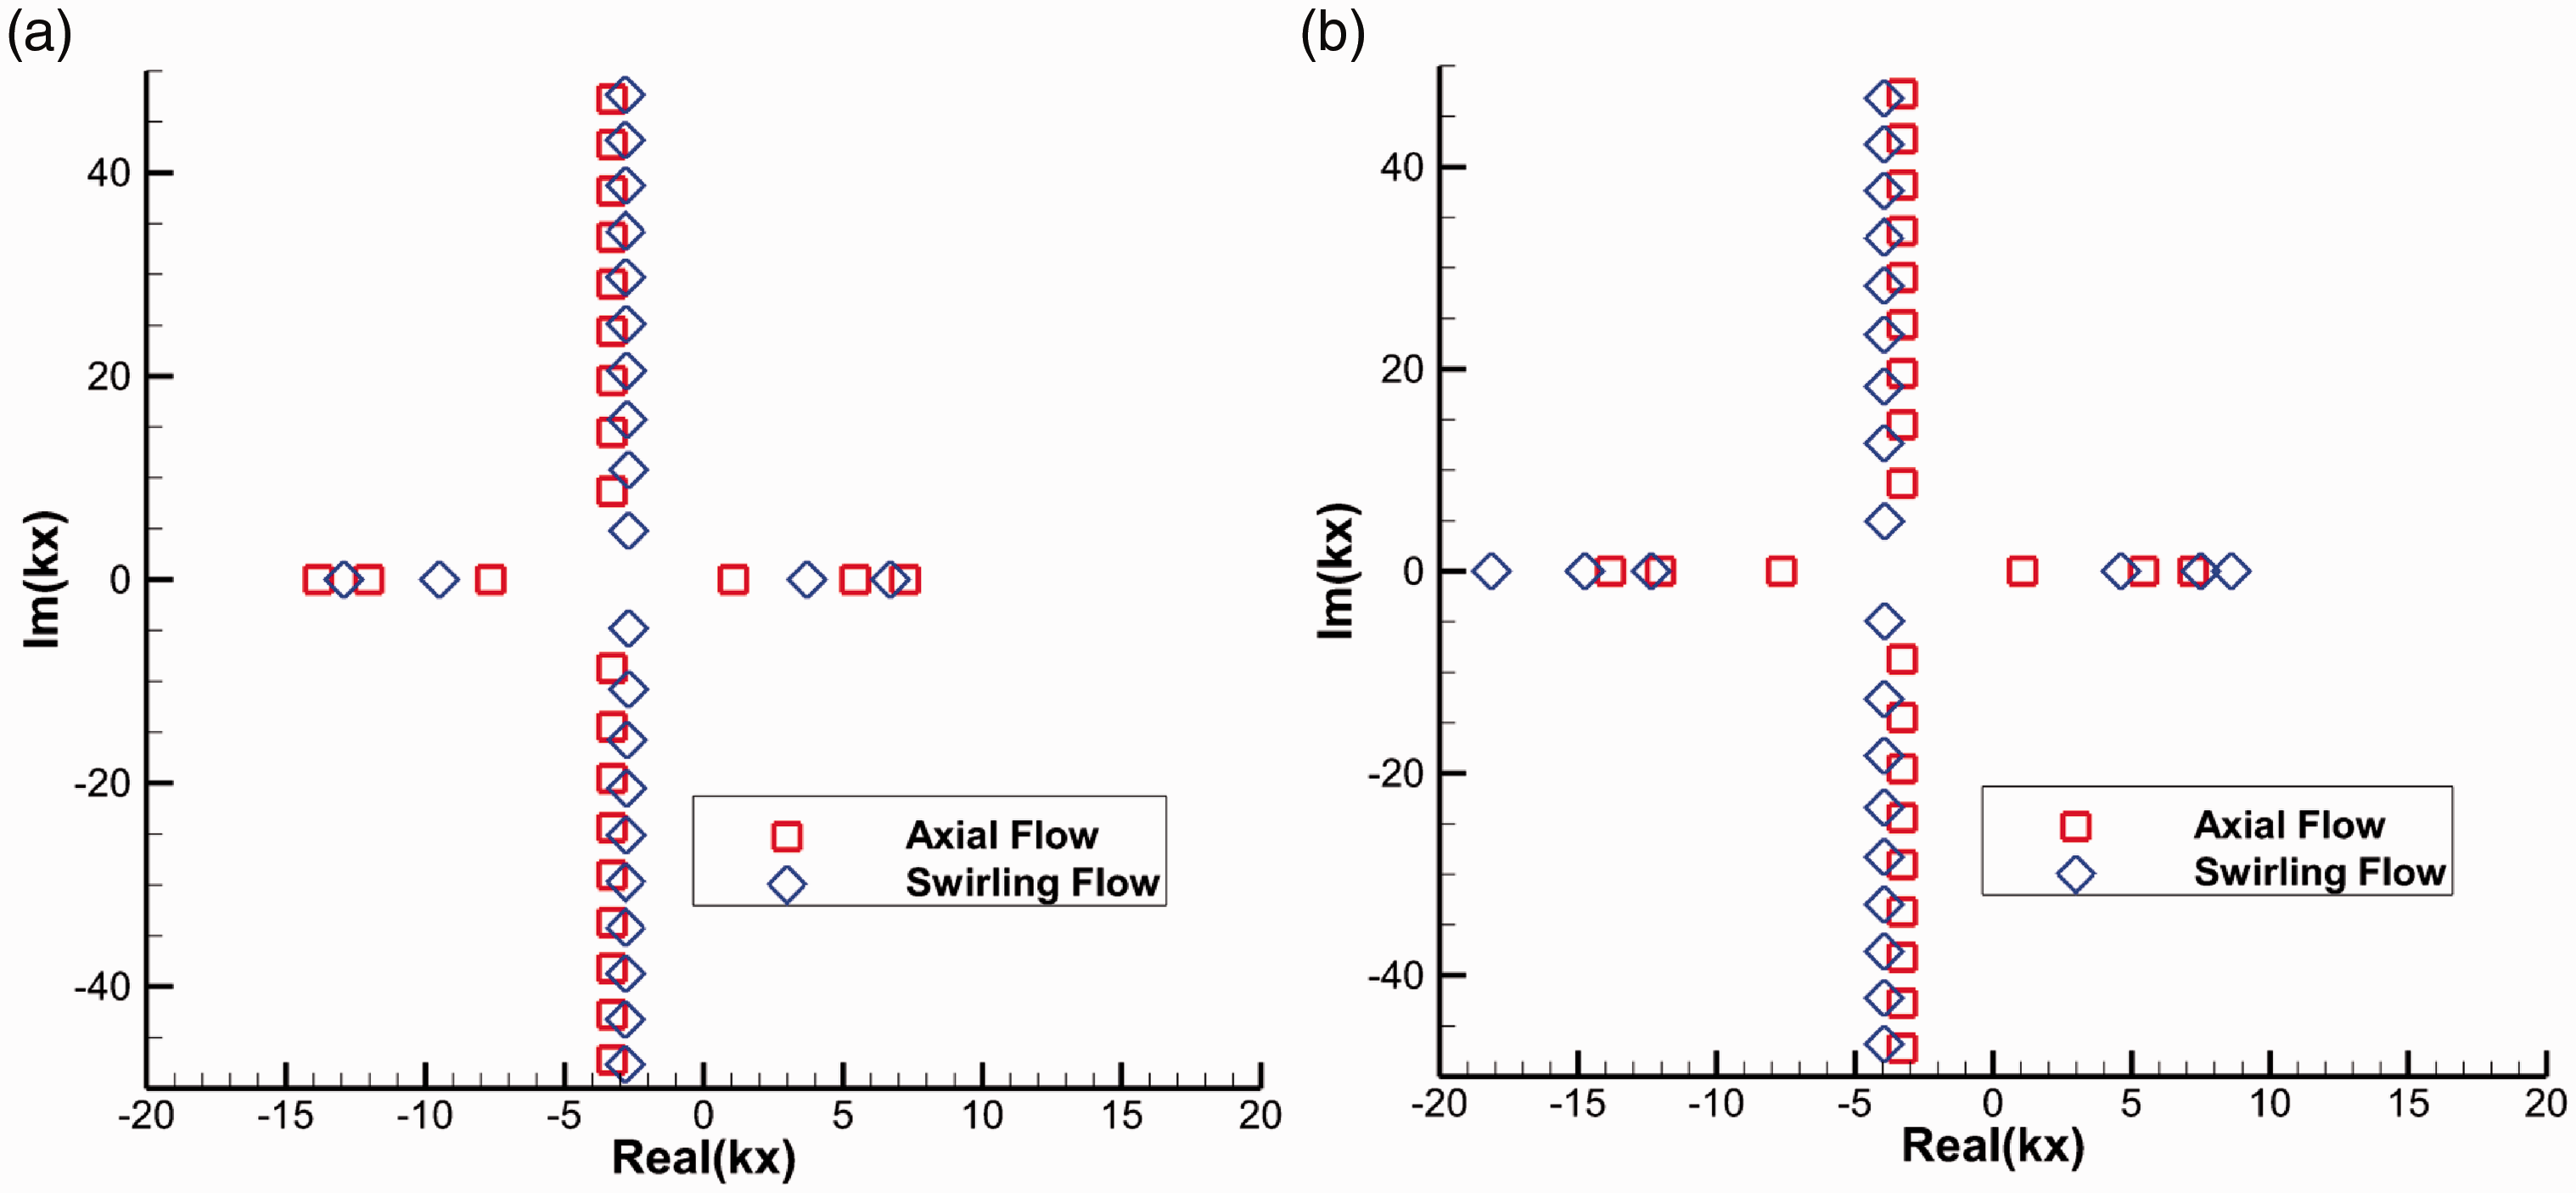
Comparison of axial wavenumbers with and without swirl for a (a) co-rotating mode m = 2 and (b) contra-rotating mode m = – 2. Results for a vortex swirl mean flow profile
Figure 1(a) shows that if the circumferential mode rotates with the flow, the radial modes become more cut-off when swirl is present. Notice that for the uniform axial flow case there are three cut-on modes in each direction, while for the swirling flow case there are two cut-on modes in each direction.
If the circumferential mode rotates against the flow, the radial modes become more cut-on as the swirl increases, as shown in Figure 1(b). Notice that for the swirling flow case the cut-on axial wavenumbers are farther from the cut-off line.
Figure 2 shows similar results for a rigid-body swirling flow profile with magnitude
Comparison of axial wavenumbers with and without swirl for a (a) co-rotating mode m = 2 and (b) contra-rotating mode m = – 2. Results for a rigid body swirl mean flow profile
Since the axial wavenumbers at the lower radial mode orders are more influenced by the mean swirling flow than higher order modes, the impact of swirl in the first radial mode upstream and downstream was evaluated. The frequency of excitation and the magnitude of the swirling flow were varied and the phase velocity corresponding to the first axial wavenumber upstream and downstream was calculated. Figure 3(a) shows the phase velocity corresponding to the first upstream radial mode and Figure 3(b) shows the phase velocity corresponding to the first downstream radial mode as a function of frequency and swirling flow magnitude for a free vortex swirl and circumferential mode m = – 2.
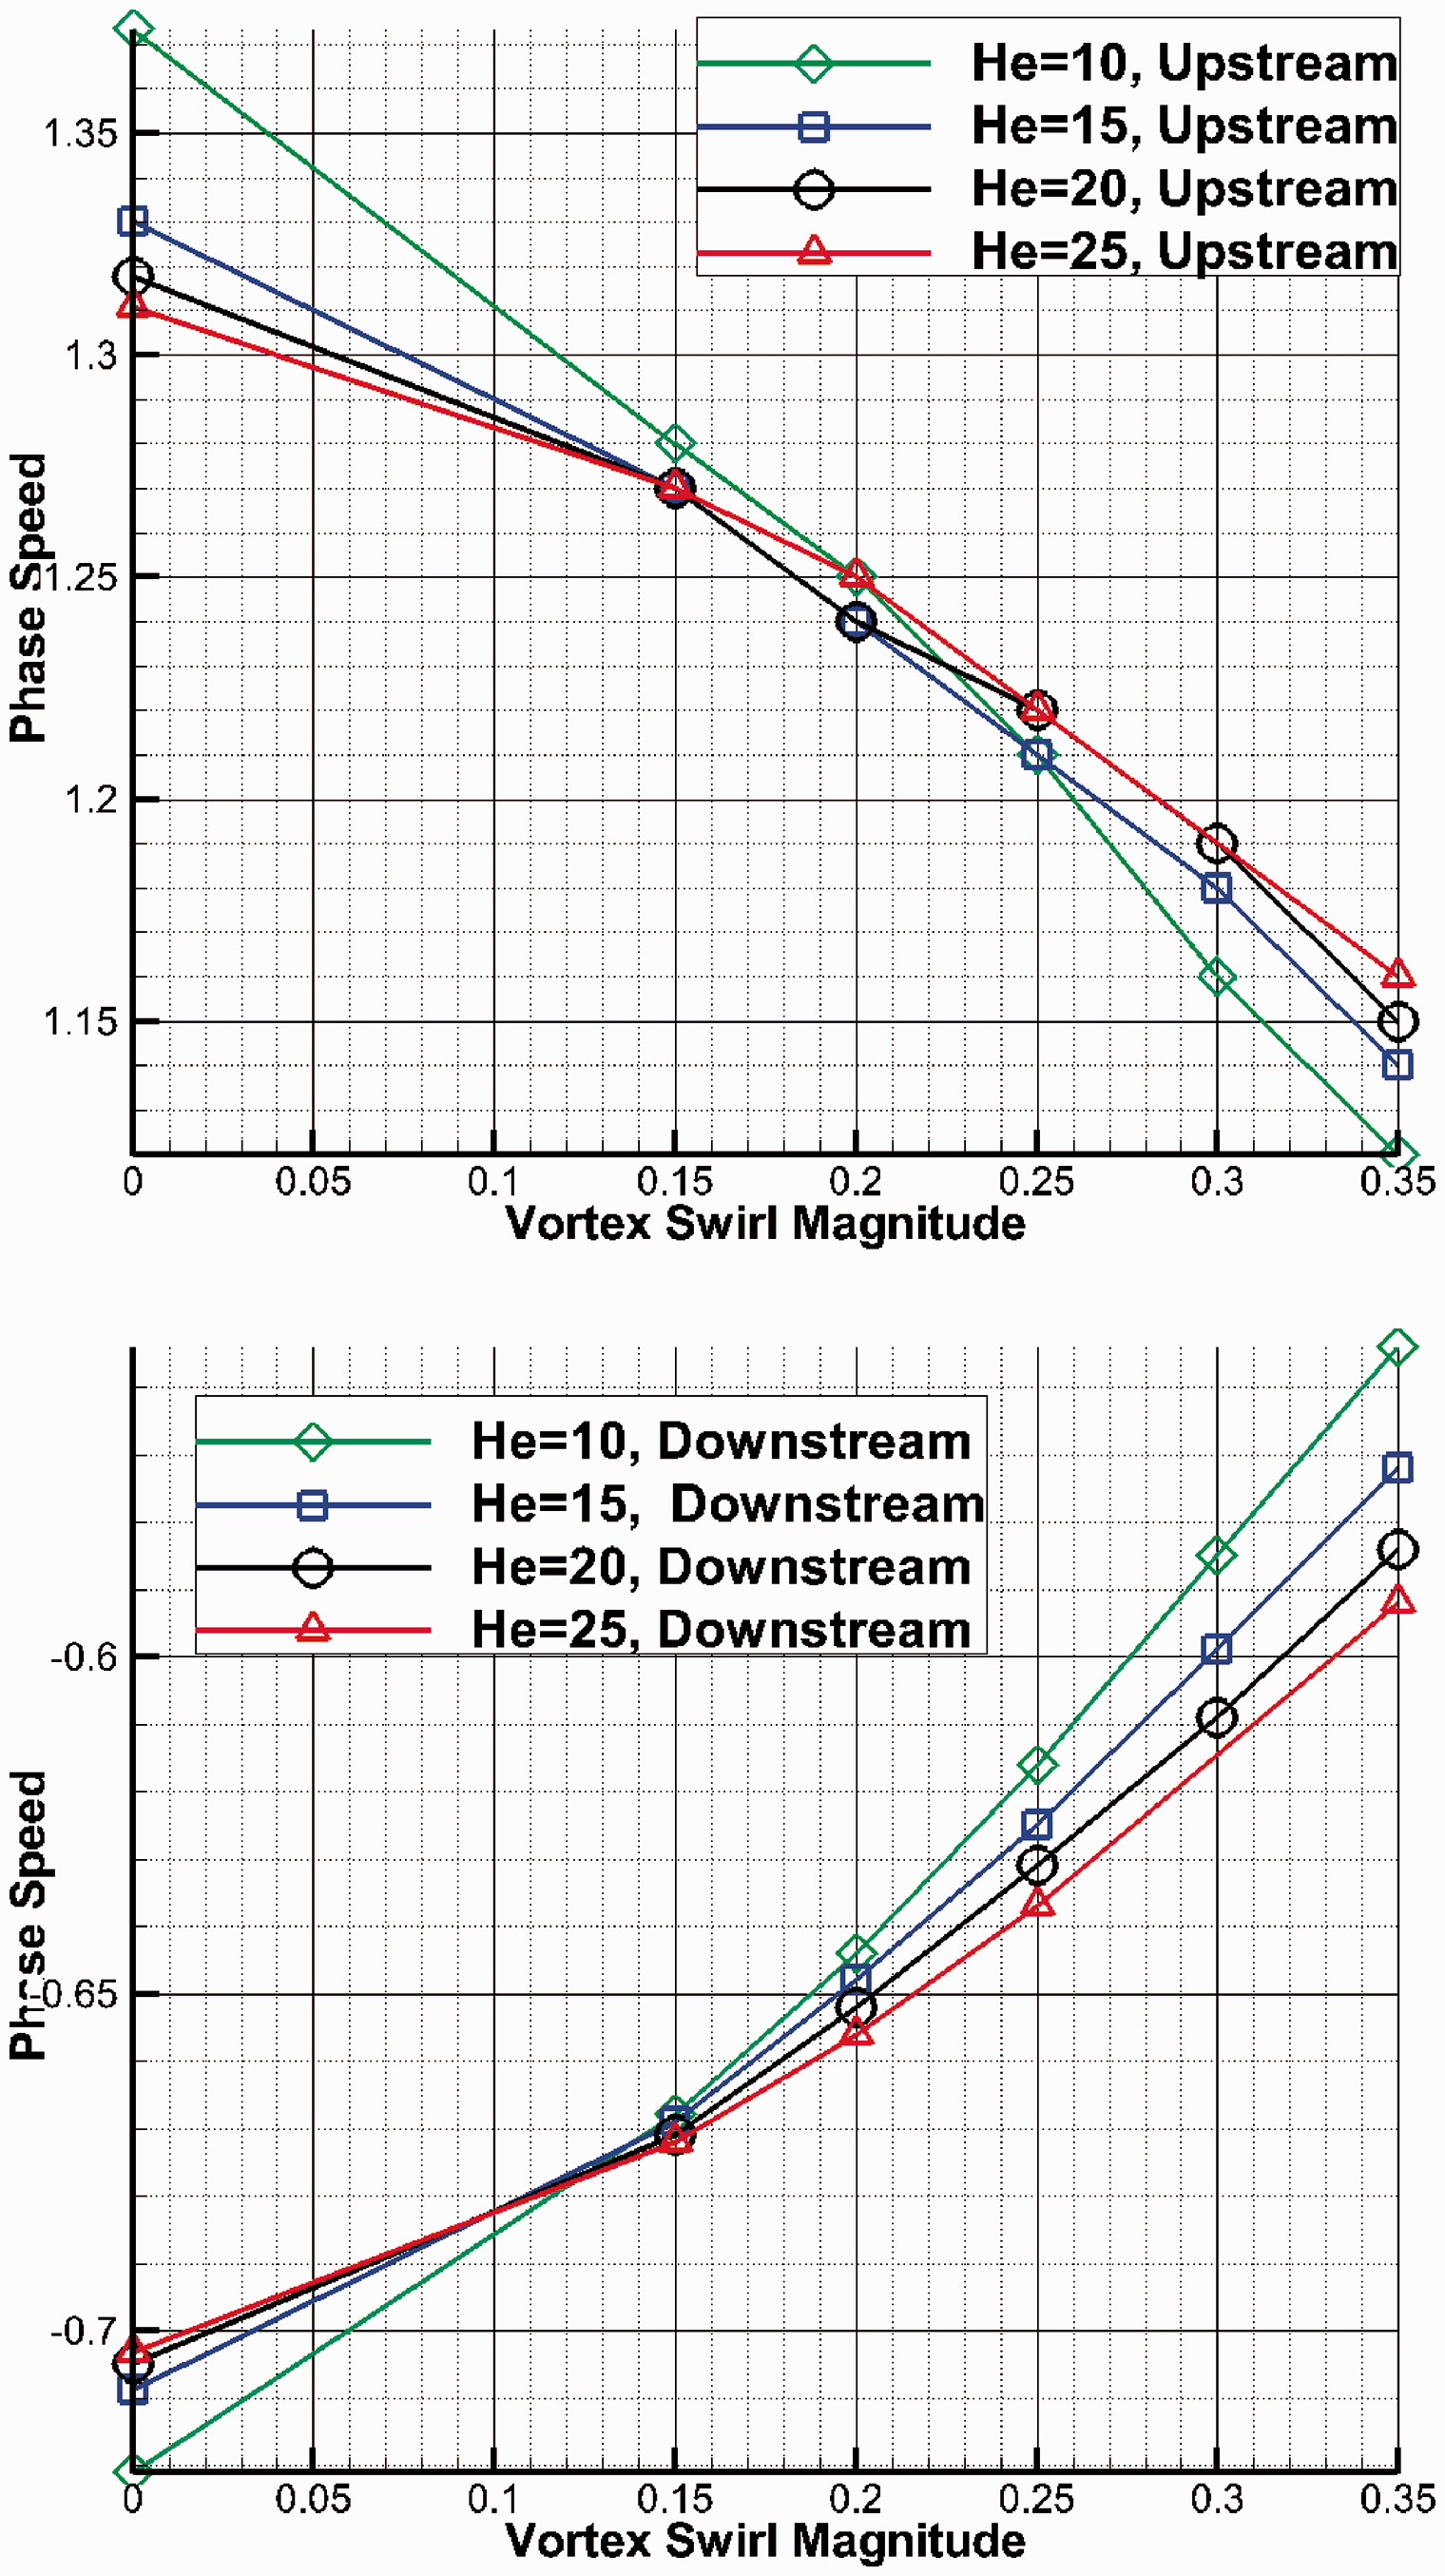
Phase speed as a function of Helmholtz number and swirling flow magnitude for the contra-rotating mode m = – 2 and free vortex swirl mean flow.
Figure 4 shows the relationship between the phase speed and the magnitude of the swirling flow for a co-rotating mode. It is observed that the phase speed decreases for an upstream propagating radial mode and increases for a downstream propagating radial mode as the swirling flow magnitude increases. It shows that the modes represented by those axial wavenumbers become more cut-on with the increase of the swirling flow magnitude. Notice that mode m = – 2 spins in the opposite direction of the flow and the conclusion would be the opposite for a mode spinning with the flow. The variation of the vortex swirl magnitude is the same in both plots. However, the variation of phase speed for downstream propagating modes (Figure 4(a)) is higher than for upstream propagating modes (Figure 4(b)). This shows that modes propagating downstream are more influenced by the swirling flow than modes propagating upstream.
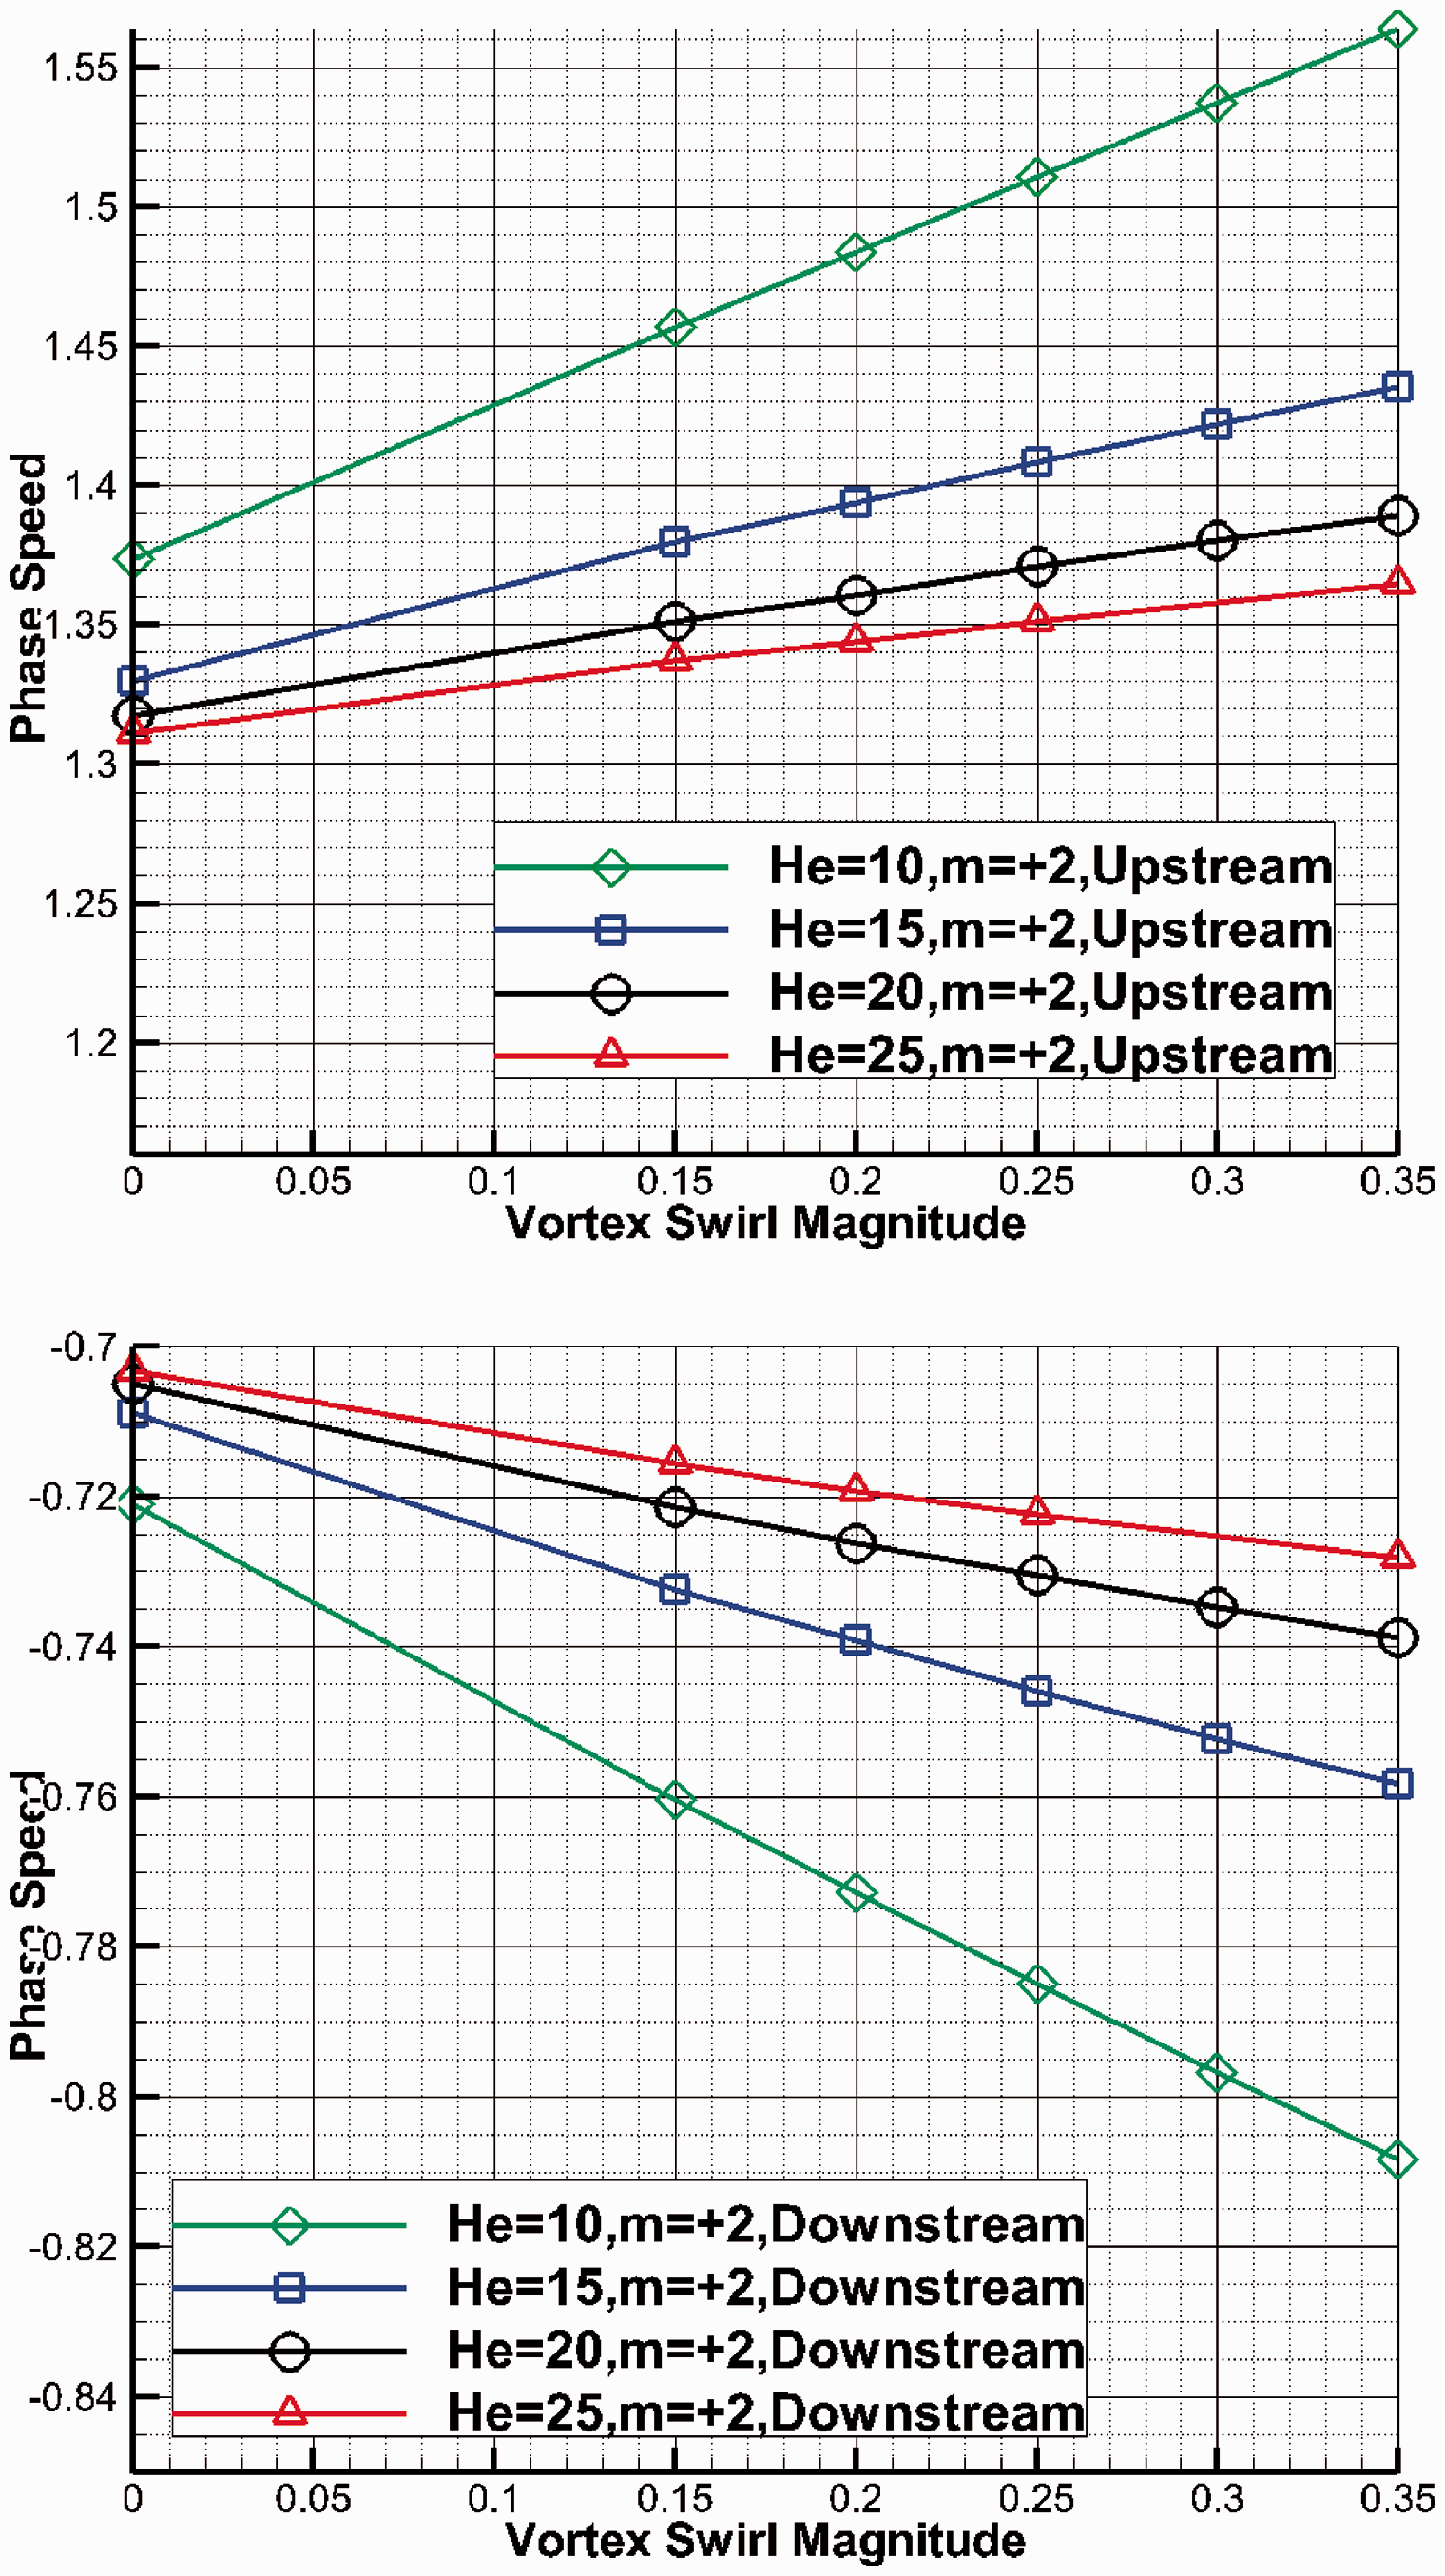
Phase speed as a function of Helmholtz number and swirling flow magnitude for the co-rotating mode
The effect of swirl on mode cut-on ratio
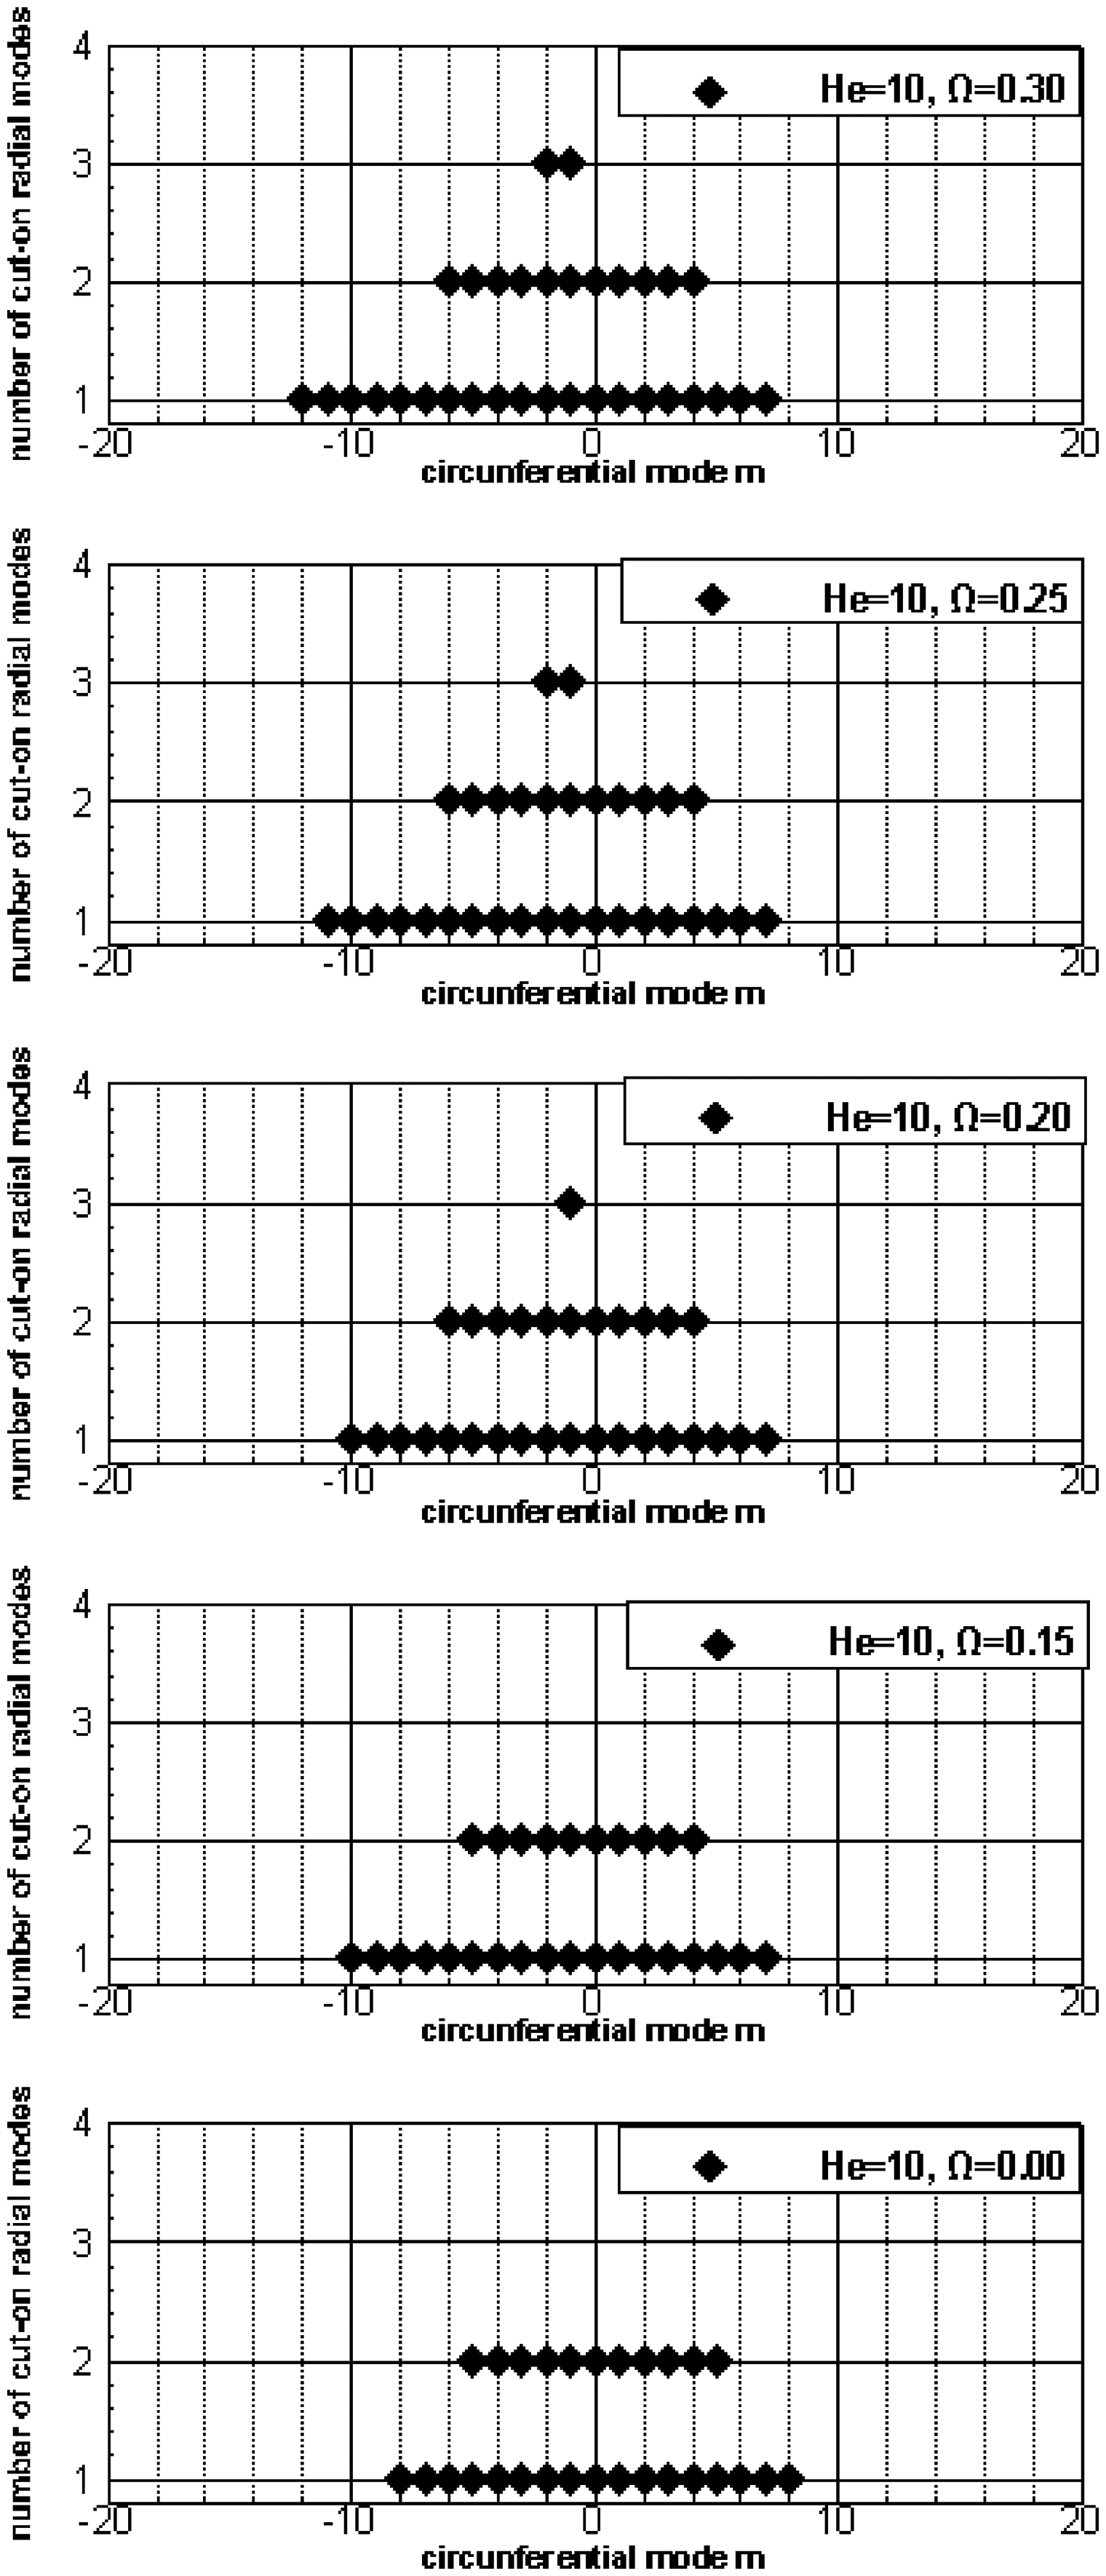
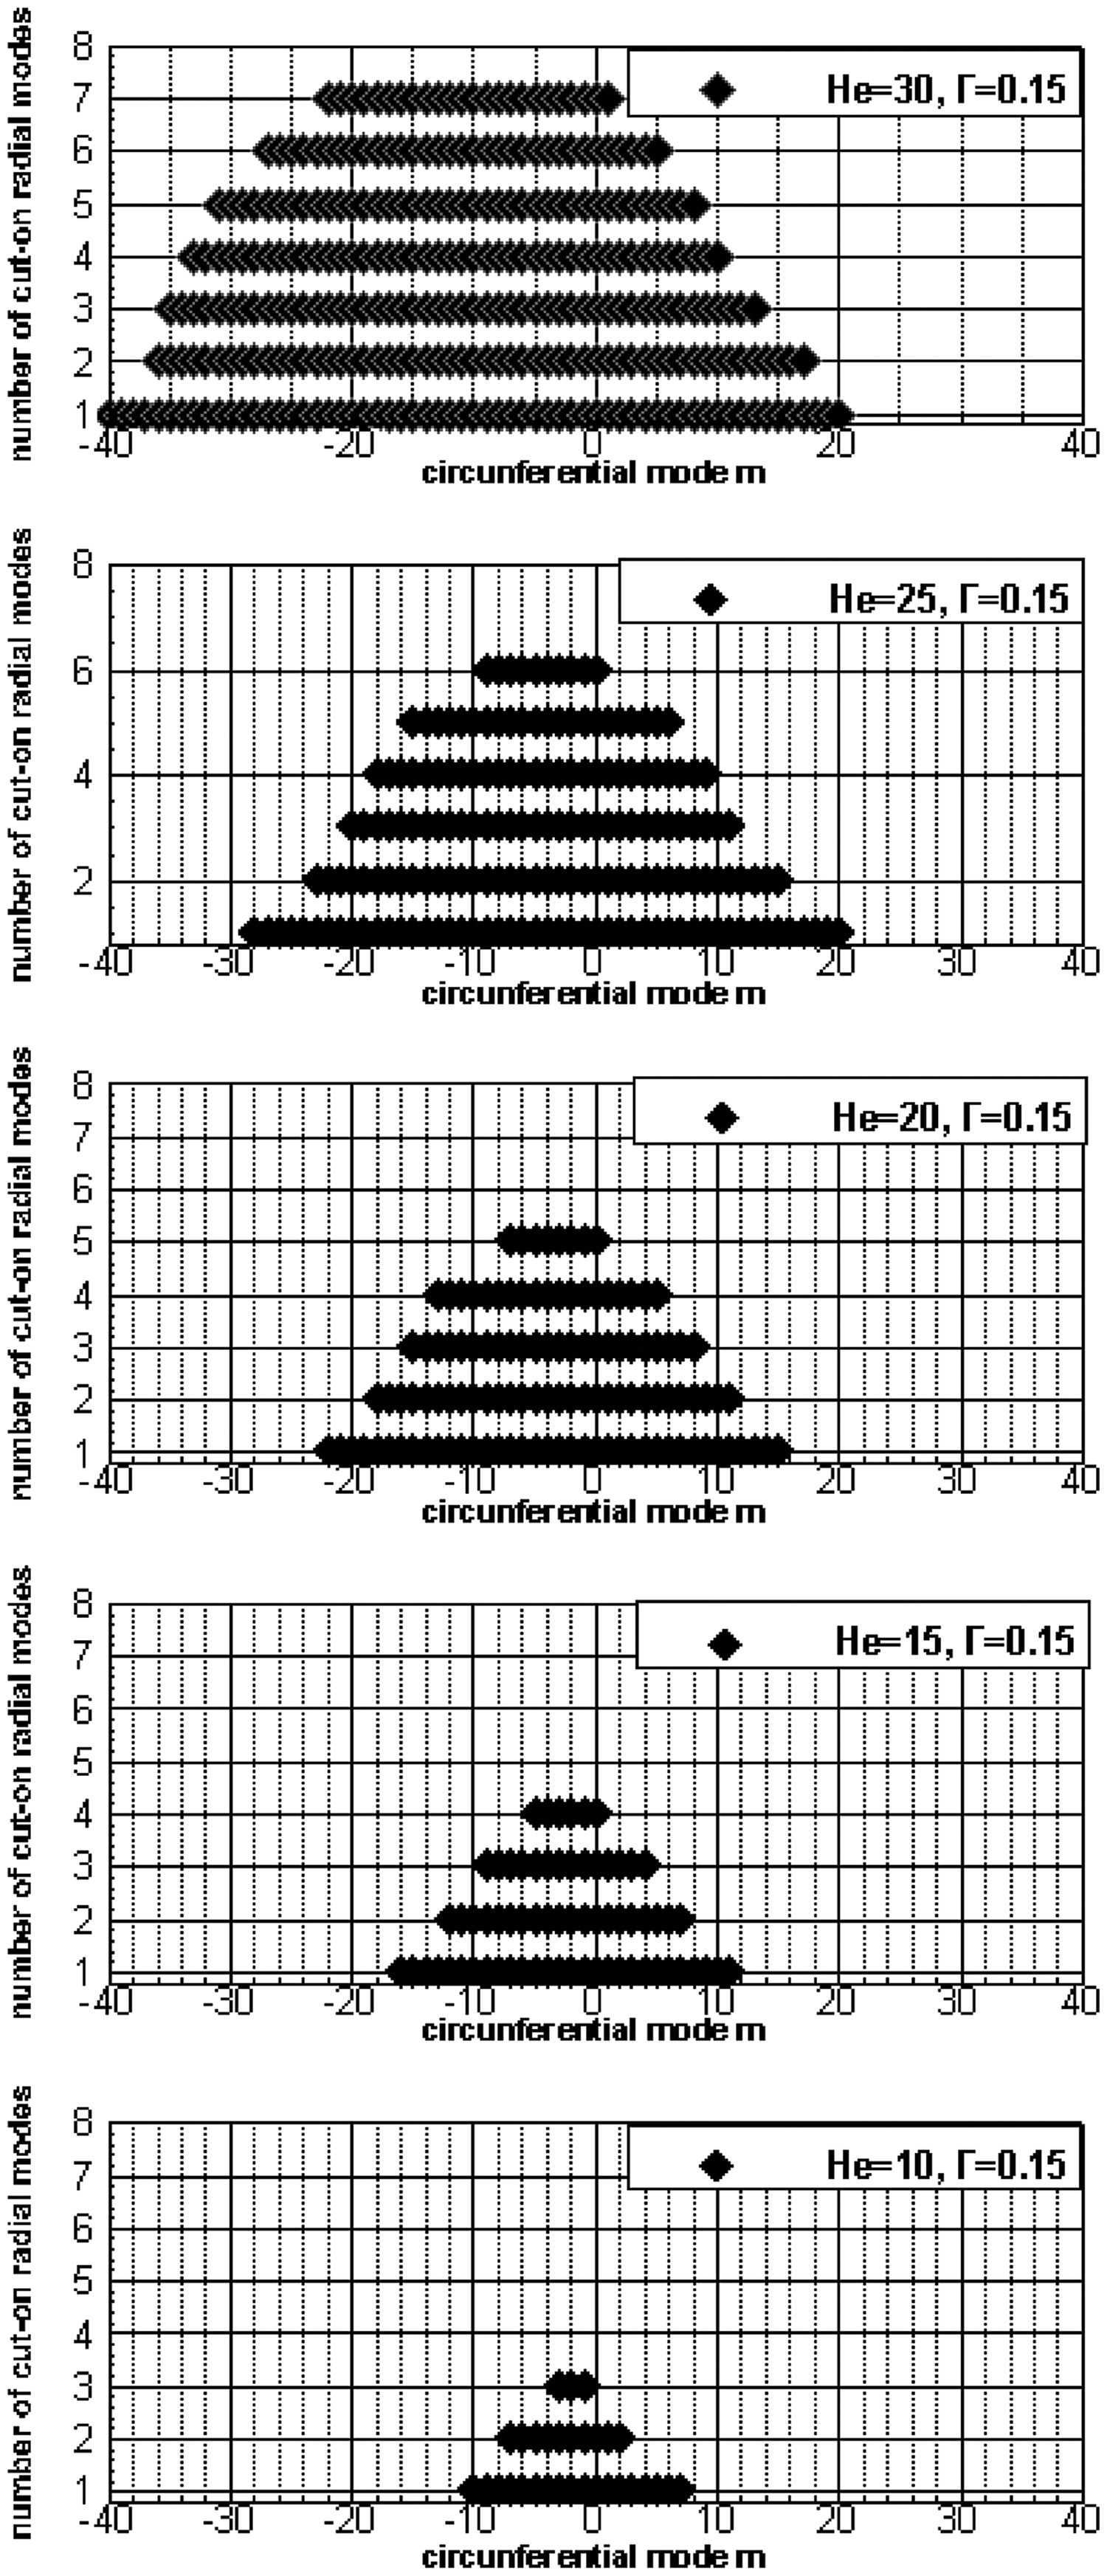
The purpose of this section is to indicate how the swirling flow modifies the cut-on modal content for various levels of swirl and for a range of frequencies. This is particularly important because to define a suitable multi-modal source for the optimum impedance calculations in the following section one has to decide how many circumferential and radial modes to consider. In this work the modal content for the broadband source is defined by the cut-on acoustic modes for the hard-walled duct case. Axial wavenumbers are calculated for a specific frequency and mean flow for a range of circumferential mode numbers m. For each circumferential mode number, the number of cut-on radial modes n propagating upstream is calculated. The existance of a cut-on (m,n) mode is indicated on a two dimensional grid at m versus n to form a modal triangle. Examples of modal triangles are presented in Figures 5 to 8 for a varying set of flow parameters and frequencies.
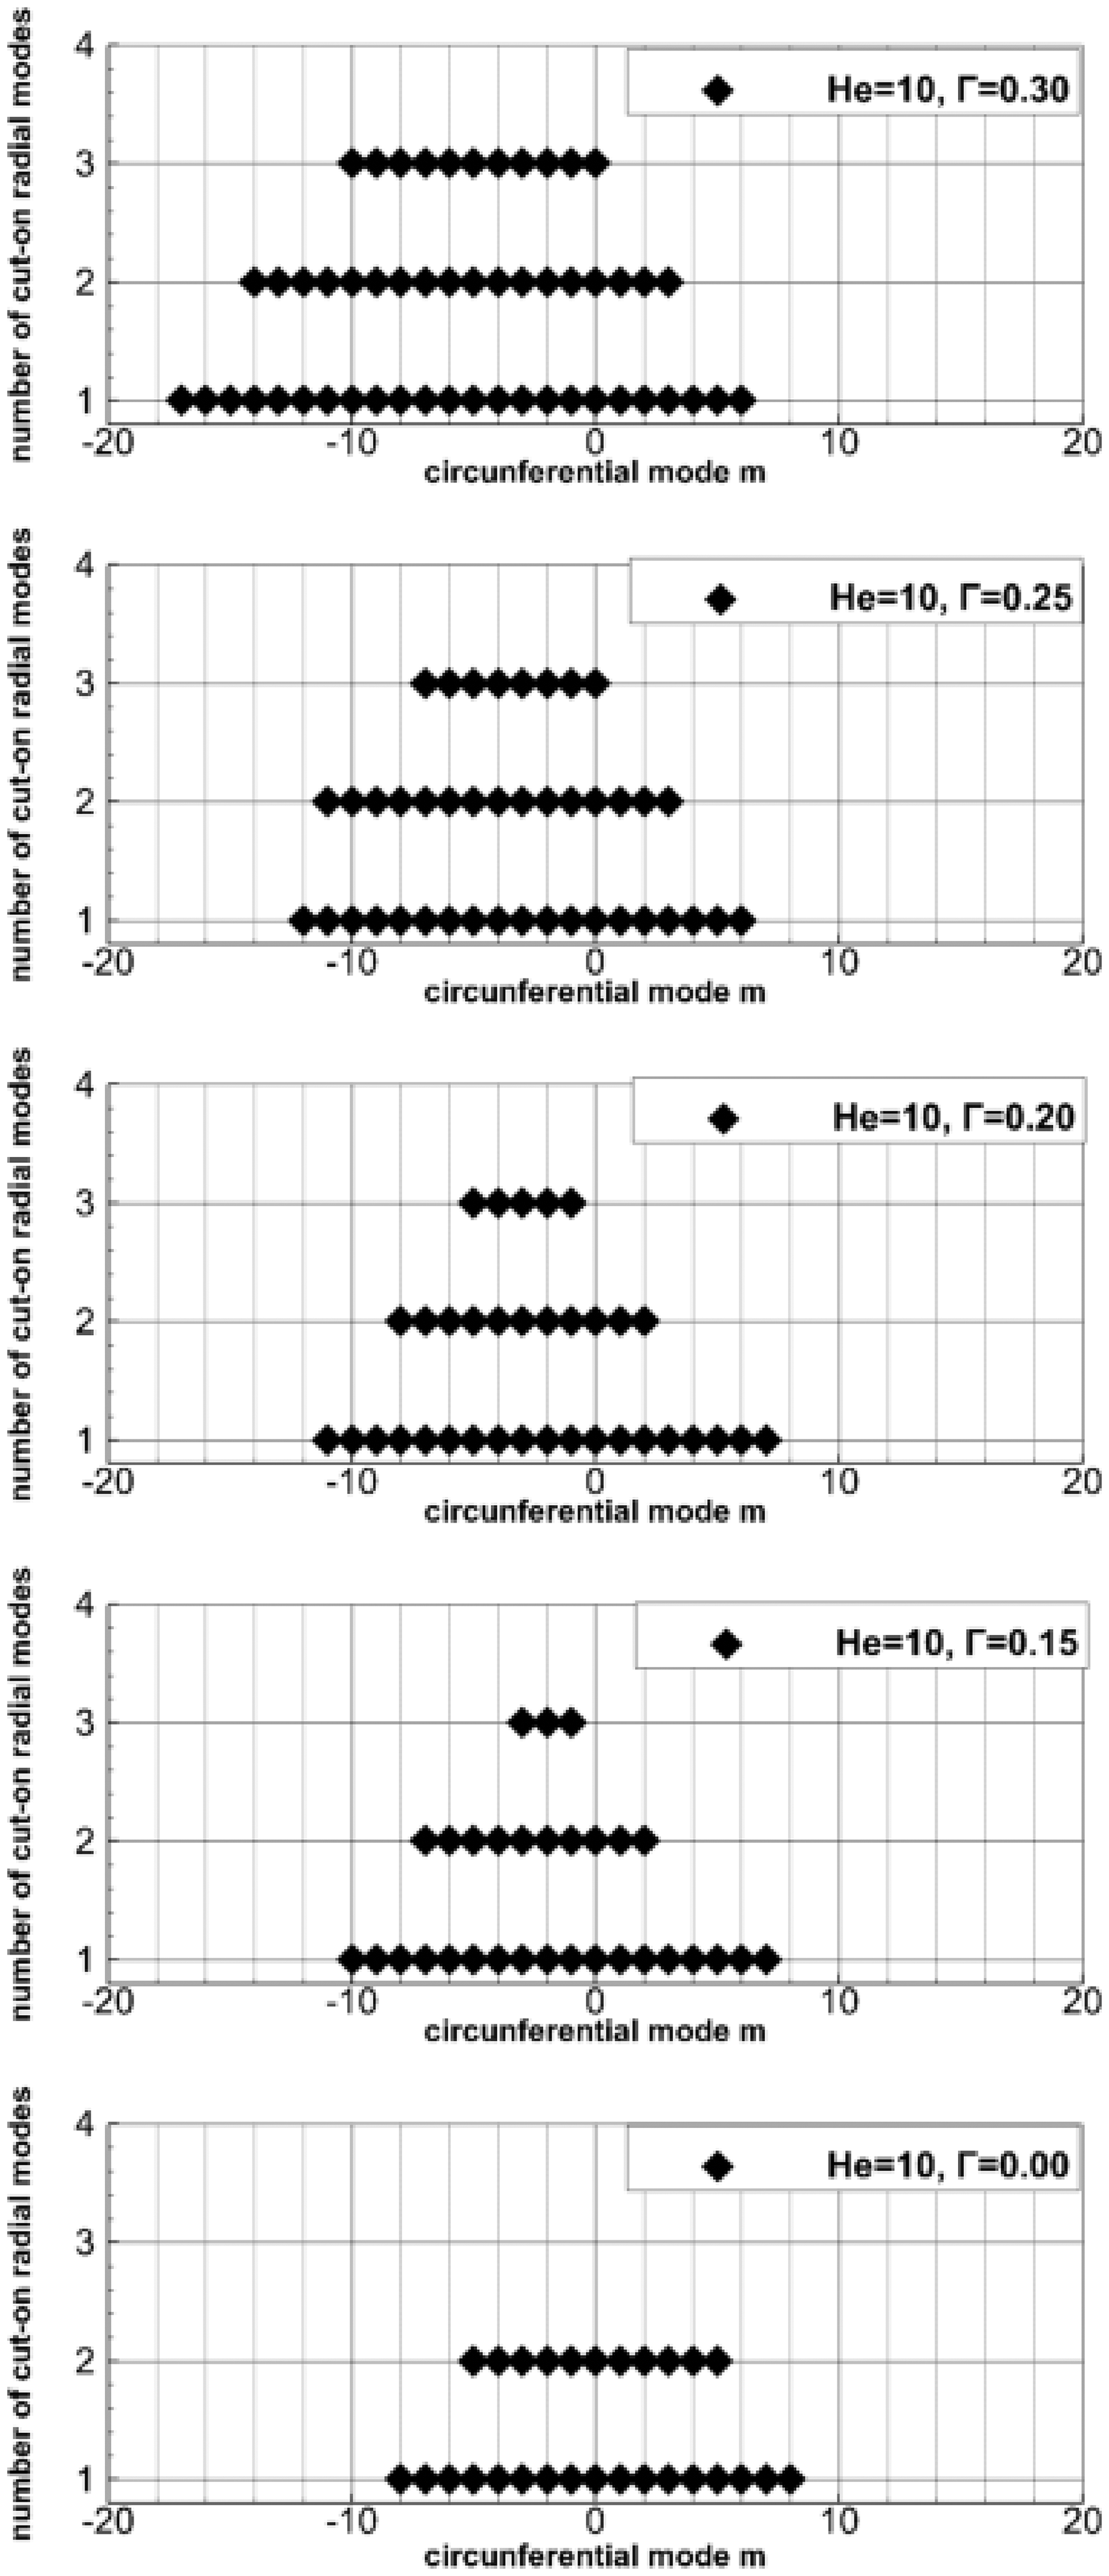
Variation of the modal triangle at cut-on modes for varying levels of vortex swirl and He = 10.
Variation of the modal triangle at cut-on modes for varying levels of solid body and He = 10.
Increasing the frequency, the number of cut-on modes increase results for a vortex swirl mean flow profile and
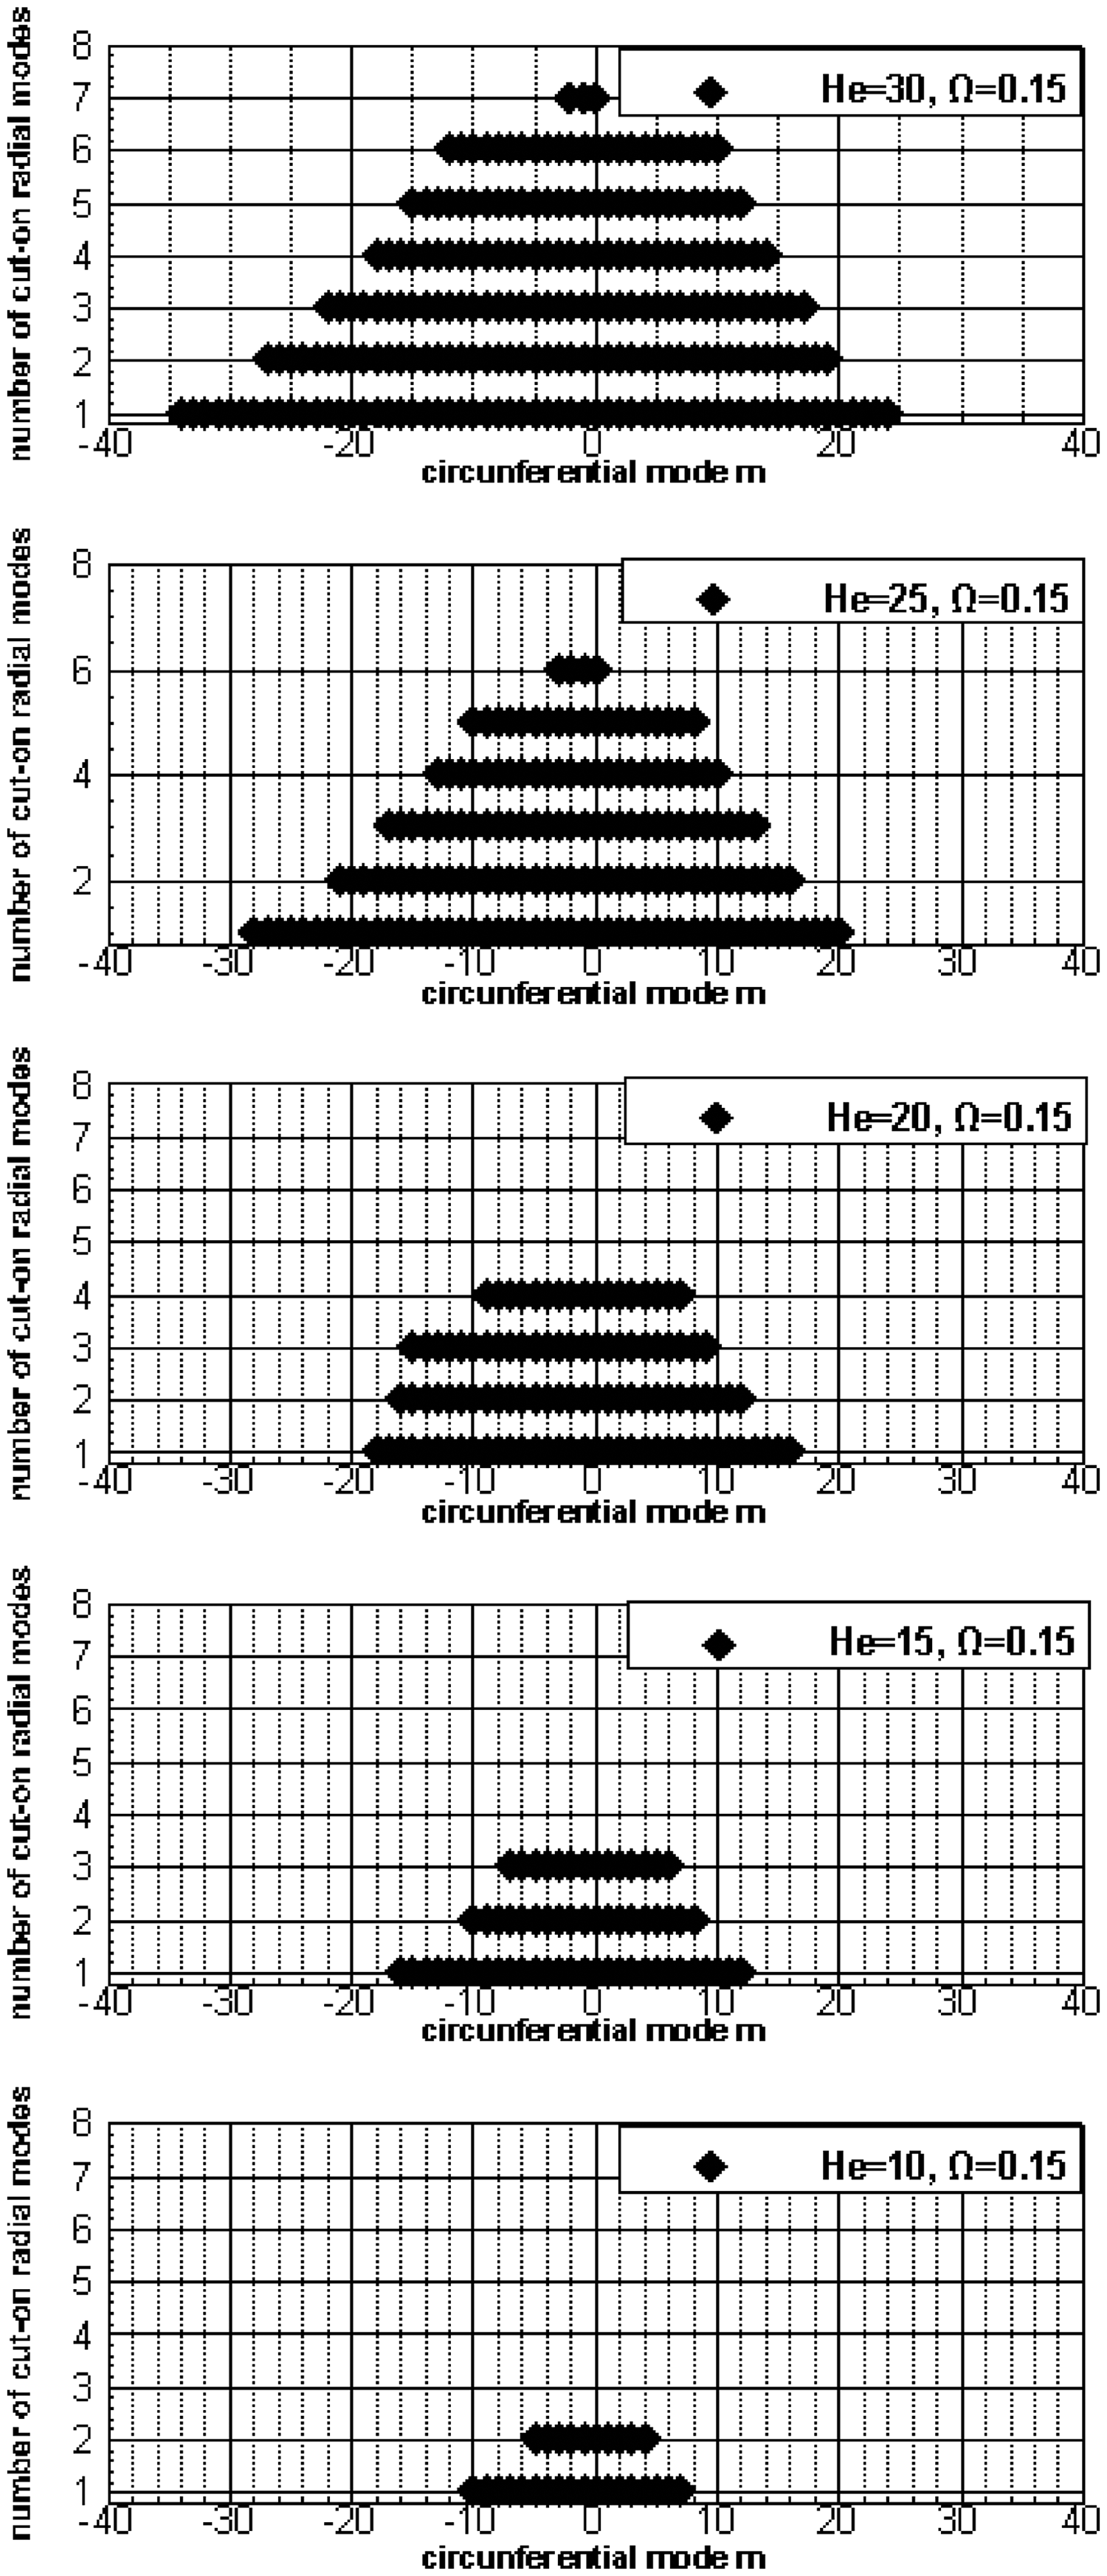
Increasing the frequency, the number of cut-on modes increase results for a solid body mean flow profile and
In all the cases presented in this section the geometry is for an annular duct with a hub to tip ratio 0.4 which is a reasonable value for the interstage region of a modern turbofan engine. In terms of mean flows, two cases are presented. The first case in which the axial mean flow Mach number is
Testcase: mean flow.
Variation of the modal triangle of the cut-on modes for varying levels of vortex swirl at a single frequency (He = 10) are presented in Figure 5. It is observed that the location of the cut-on the acoustic modes are highly influenced by the mean swirling flow. The modal distribution for a no-swirling flow is symmetrical. When swirl is included, this symmetry is broken. The higher the swirling flow magnitude is, the more the modal content is shifted to negative mode orders. Similar results for a rigid body swirl profile are presented in Figure 6.
When comparing Figures 5 and 6, it is observed that modal triangles for the vortex swirl are more affected by the increase of the swirling flow magnitude than the ones for rigid body. Notice that although the magnitude of the rigid body mean flow profile
The effect of frequency on the number and location of cut-on modes for a fixed mean swirling flow is ilustrated in Figures 7 and 8. If the frequency is increased, more acoustic modes cut on, as expected 15 and the bias towards negative azimuthal moode orders is preserved.
The effect of swirl on liner attenuation
The purpose of this section is to analyse the effect of swirling flow and liners on the optimum impedance and optimum insertion loss of a liner in a region where the flow is highly swirling. Currently the swirling mean flow is not generally taken into account when designing liners for the interstage region of a turbofan engine and this parametric study aims to evaluate whether the insertion loss is significantly affected by the swirling flow.
The test case
The geometry is exactly the same as the described in the previous section, i.e. an annular duct with a hub-to-tip ratio of
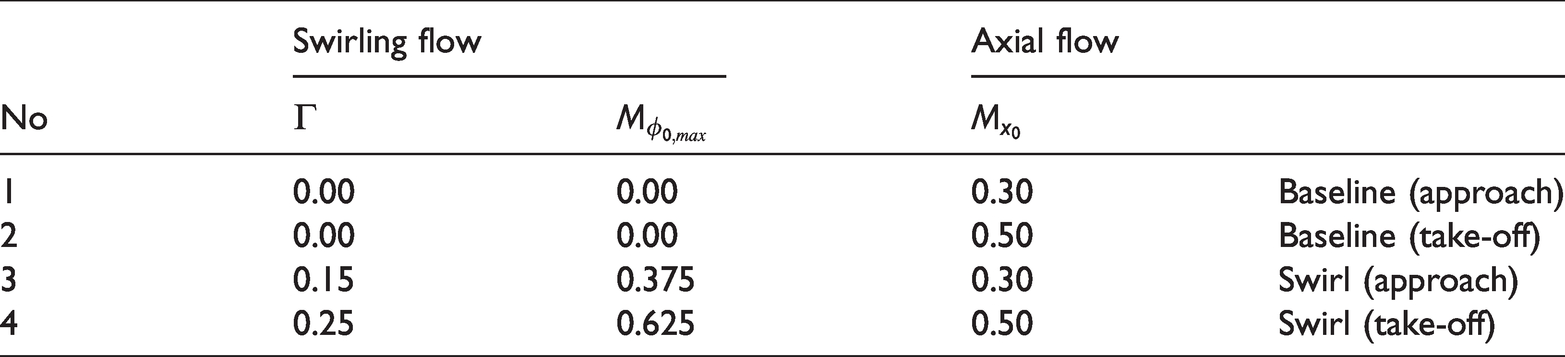
The flow conditions are described in the Table 1. This study intends to assess the liner performance using a baseline case case which is the case without swirl for a given liner resistance and reactance frequency and mean flow. There are two baseline cases because the take-off and approach regimes have different axial Mach numbers. Only vortex swirl mean flow profiles are used here. Indications suggest that this type of flow corresponds more closely to realistic mean flow profiles in an interstage than a rigid body swirl.
Characteristic modal attenuation for a lined case
The computation of each case described in the previous section will generate a set of axial wavenumbers for a given resistance and reactance frequency and mean flow parameters. Each axial wavenumber is associated with a radial and circumferential mode number. The attenuation (or insertion loss) for a single mode is given by
5

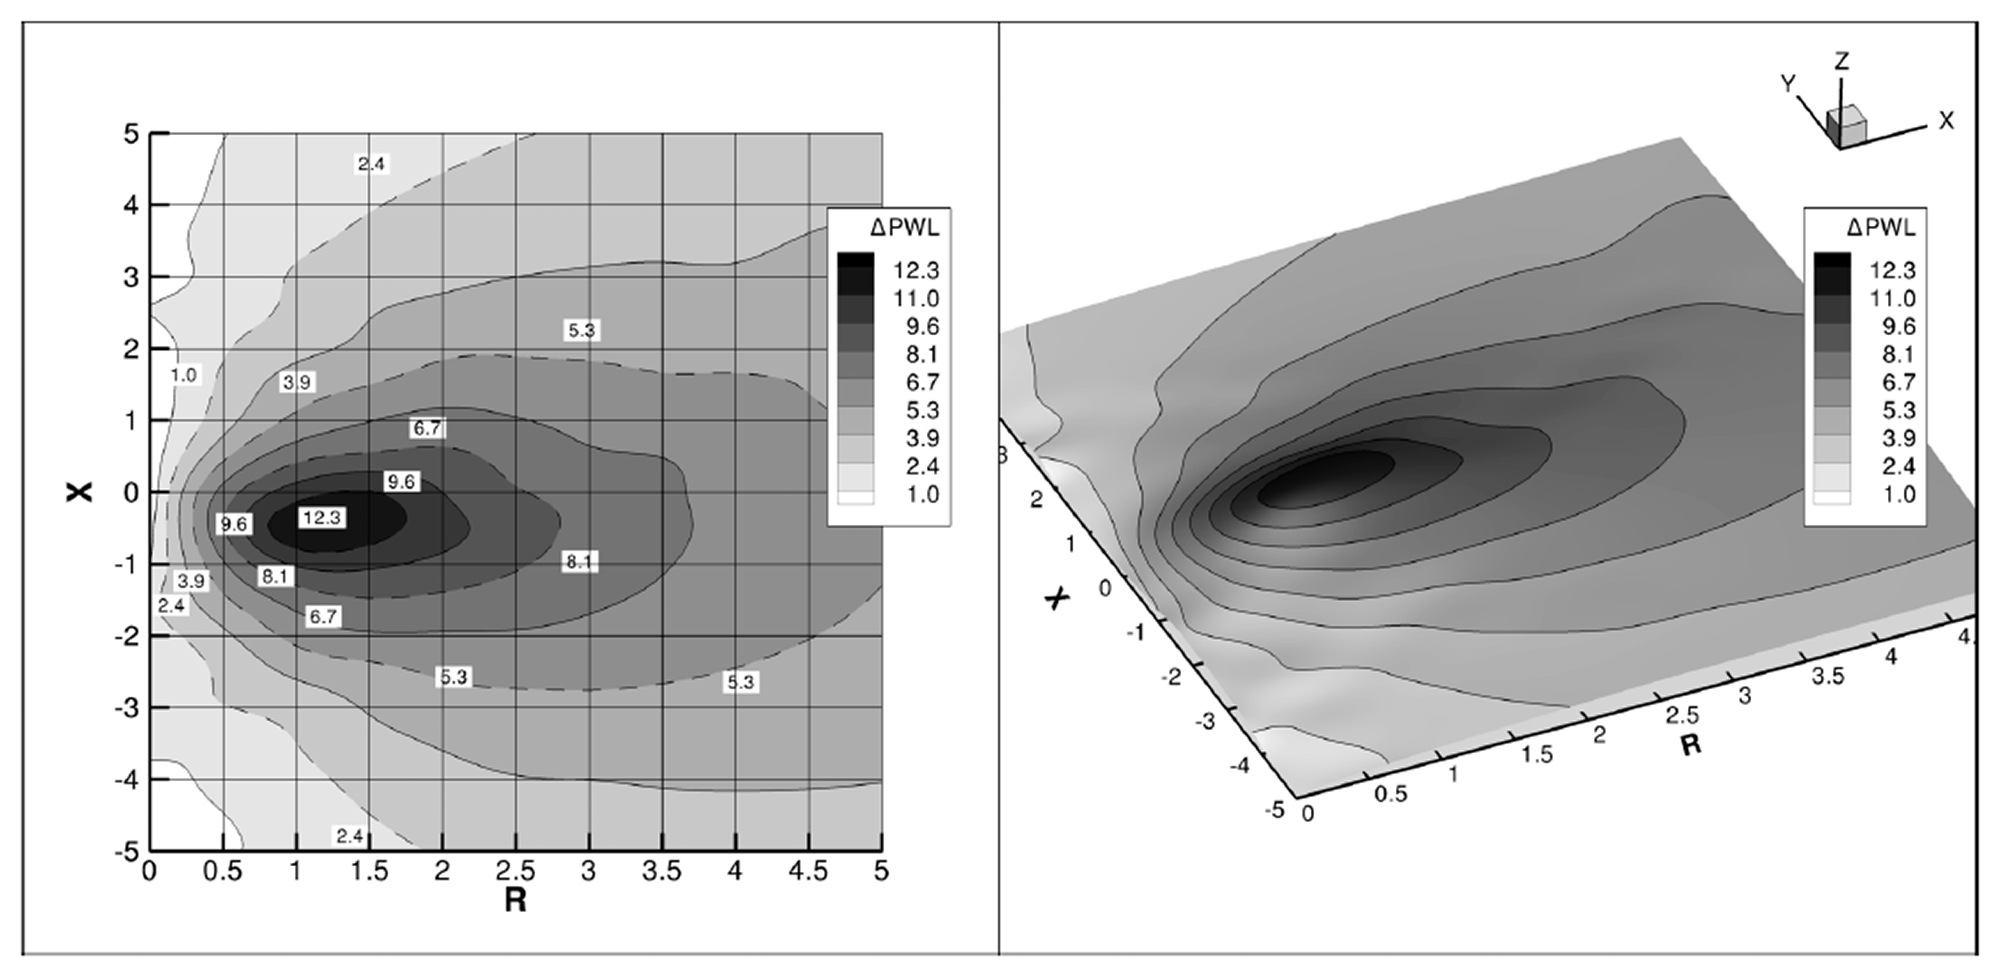
The intent of this subsection is to illustrate the modal distribution of the calculated liner attenuation for a single frequency and a given impedance. Figure 9 shows the liner attenuation as a function of the azimuthal and radial mode orders for the take-off case, for a frequency of 1250 Hz and non-dimensional impedance of
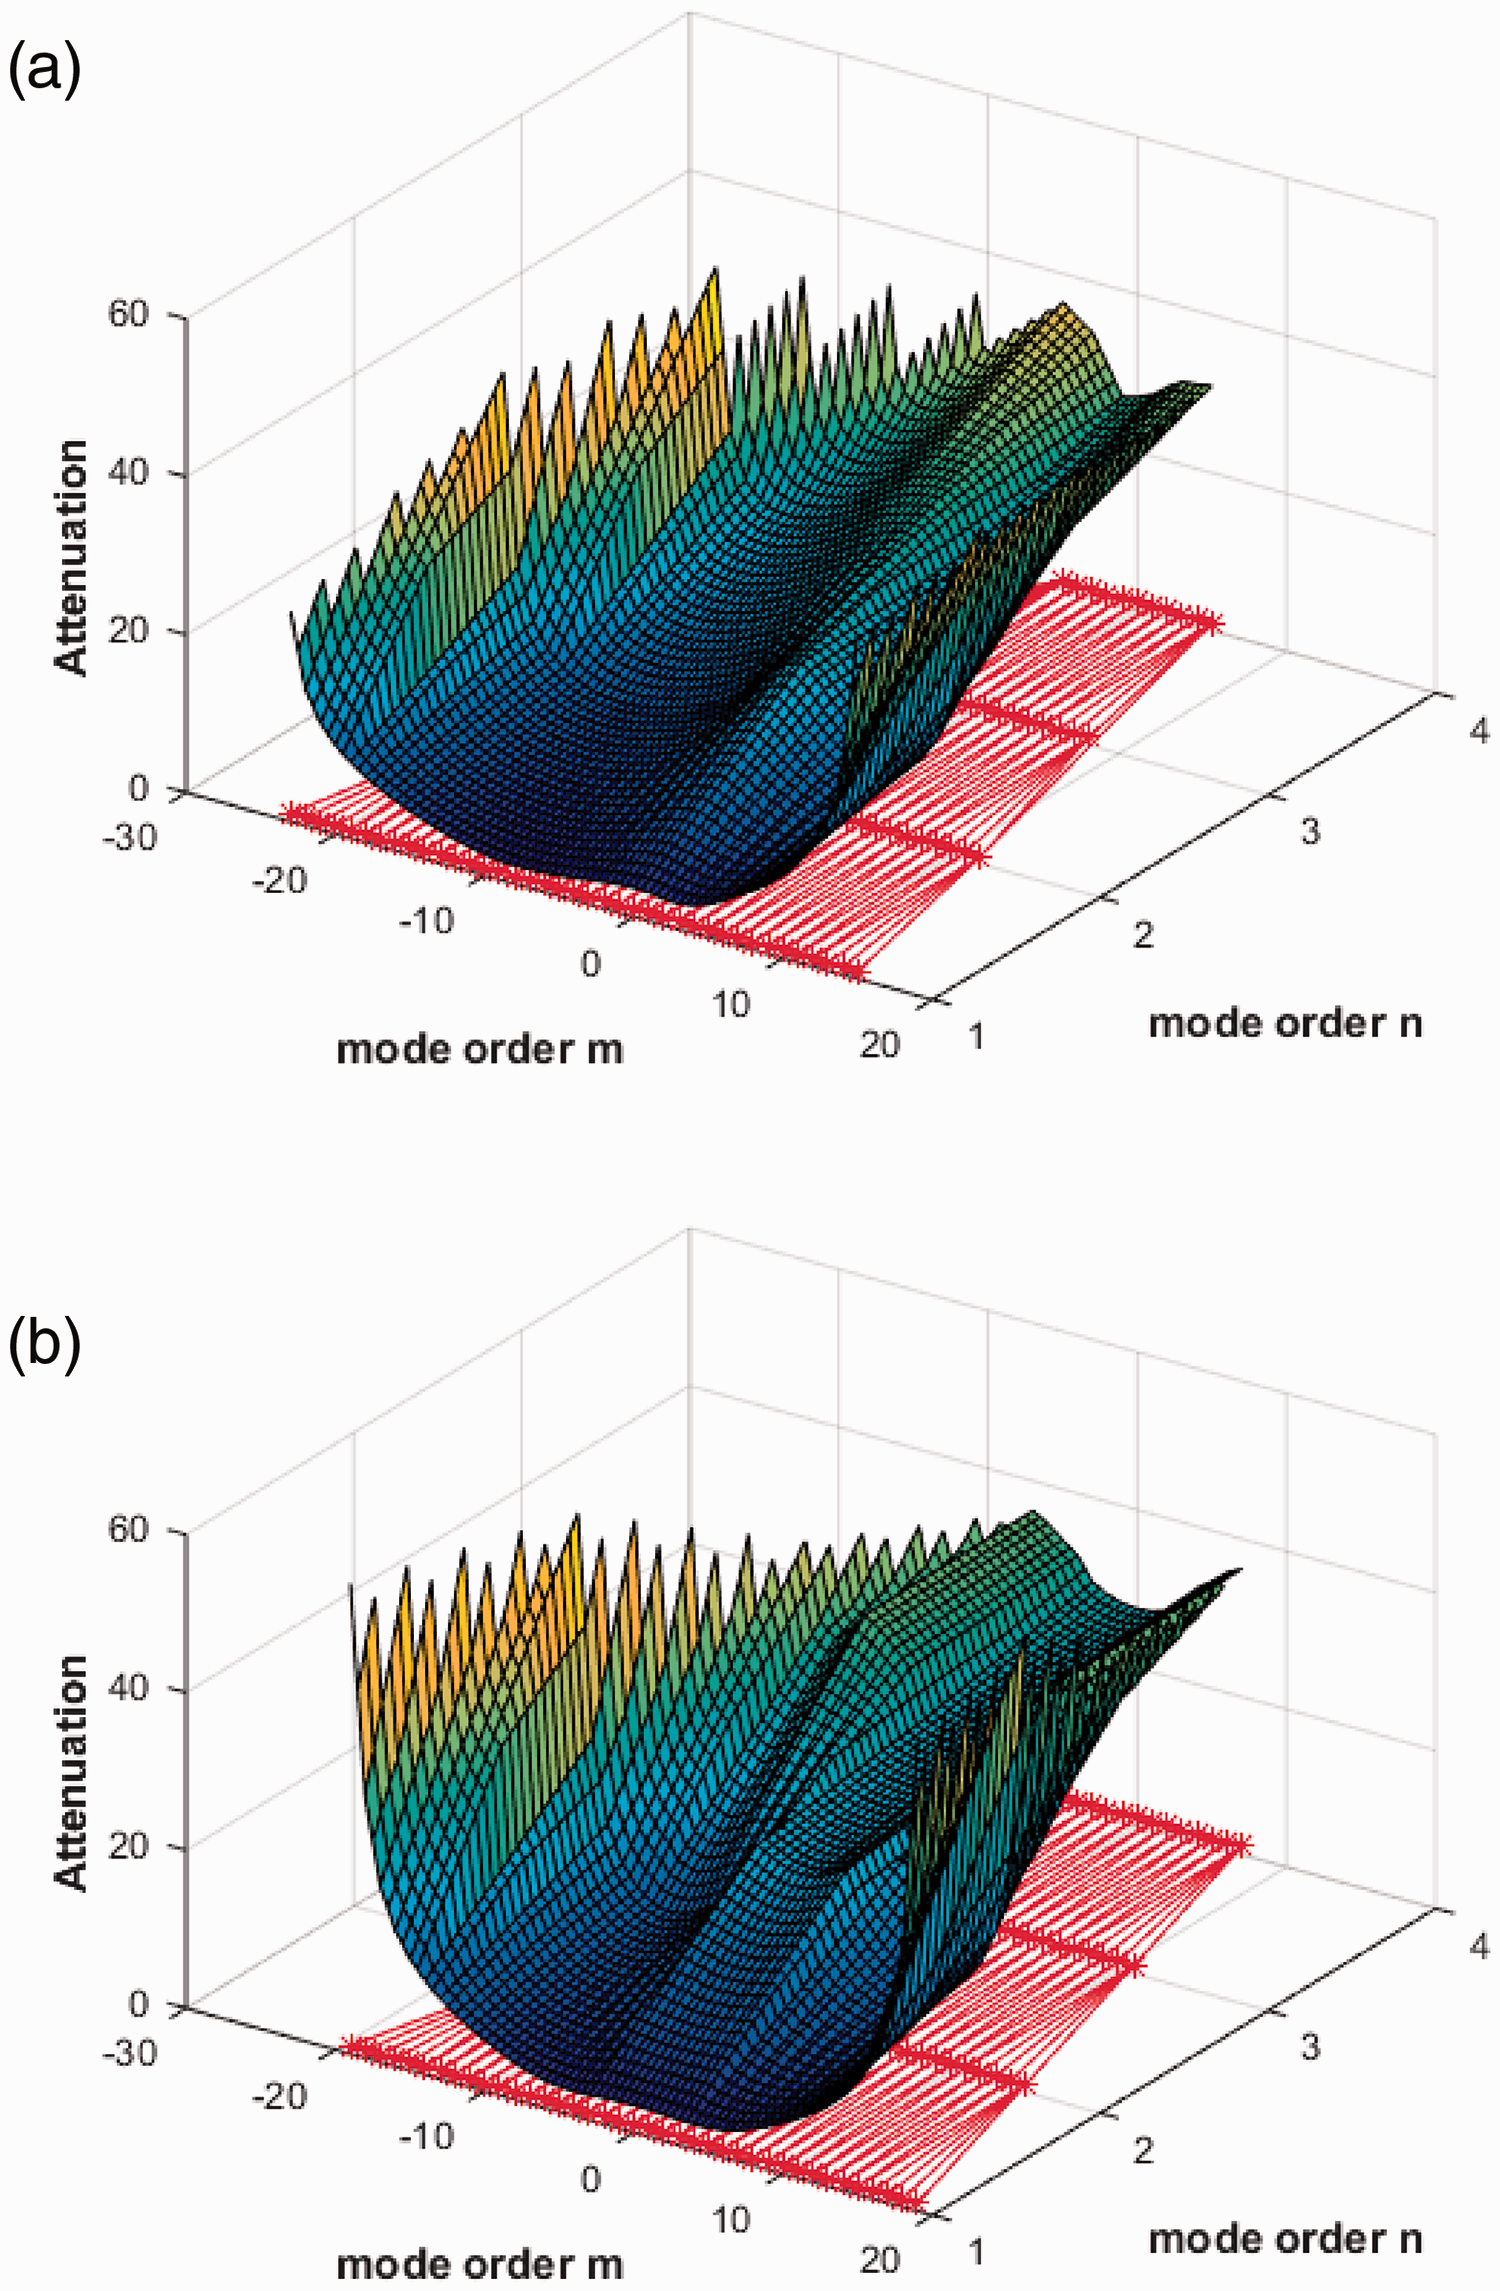
Liner attenuation as a function of the azimuthal and radial mode orders for the take-off case, frequency 1250 Hz and impedance
Defining a broadband source
The current study aims to investigate how the swirling flow affects optimum impedance by carrying out multimode calculations for a simulated broadband noise source propagating upstream from the stators towards the fan in the interstage region. The insertion loss for a broadband source is calculated from equation (17). The modal content to be considered is defined based on modal triangles from Figures 5 to 8. All cut-on modes from the hard-walled case were considered in the lined case.
For a given frequency and azimuthal mode order m, the axial wavenumbers corresponding to each radial mode order n are calculated and stored in order of attenuation (from lower to higher). A script reads the modal triangle for the same case, checks how many radial modes should be considered for a certain azimuthal mode order and calculates the transmission loss for a each radial and circunferential mode order, for a single frequency and single impedance using the first nHW radial modes. The transmission loss for the multimode case is then obtained by assuming equal power in each mode and applying equation (17).
By changing the impedance value and repeating the same calculations, one can obtain attenuation plots presented in Figures 10 to 13 in the next section. Those plots were made by using the software package Tecplot and the optimum impedance was obtained by picking the location of the optimum attenuation in the contour plots.
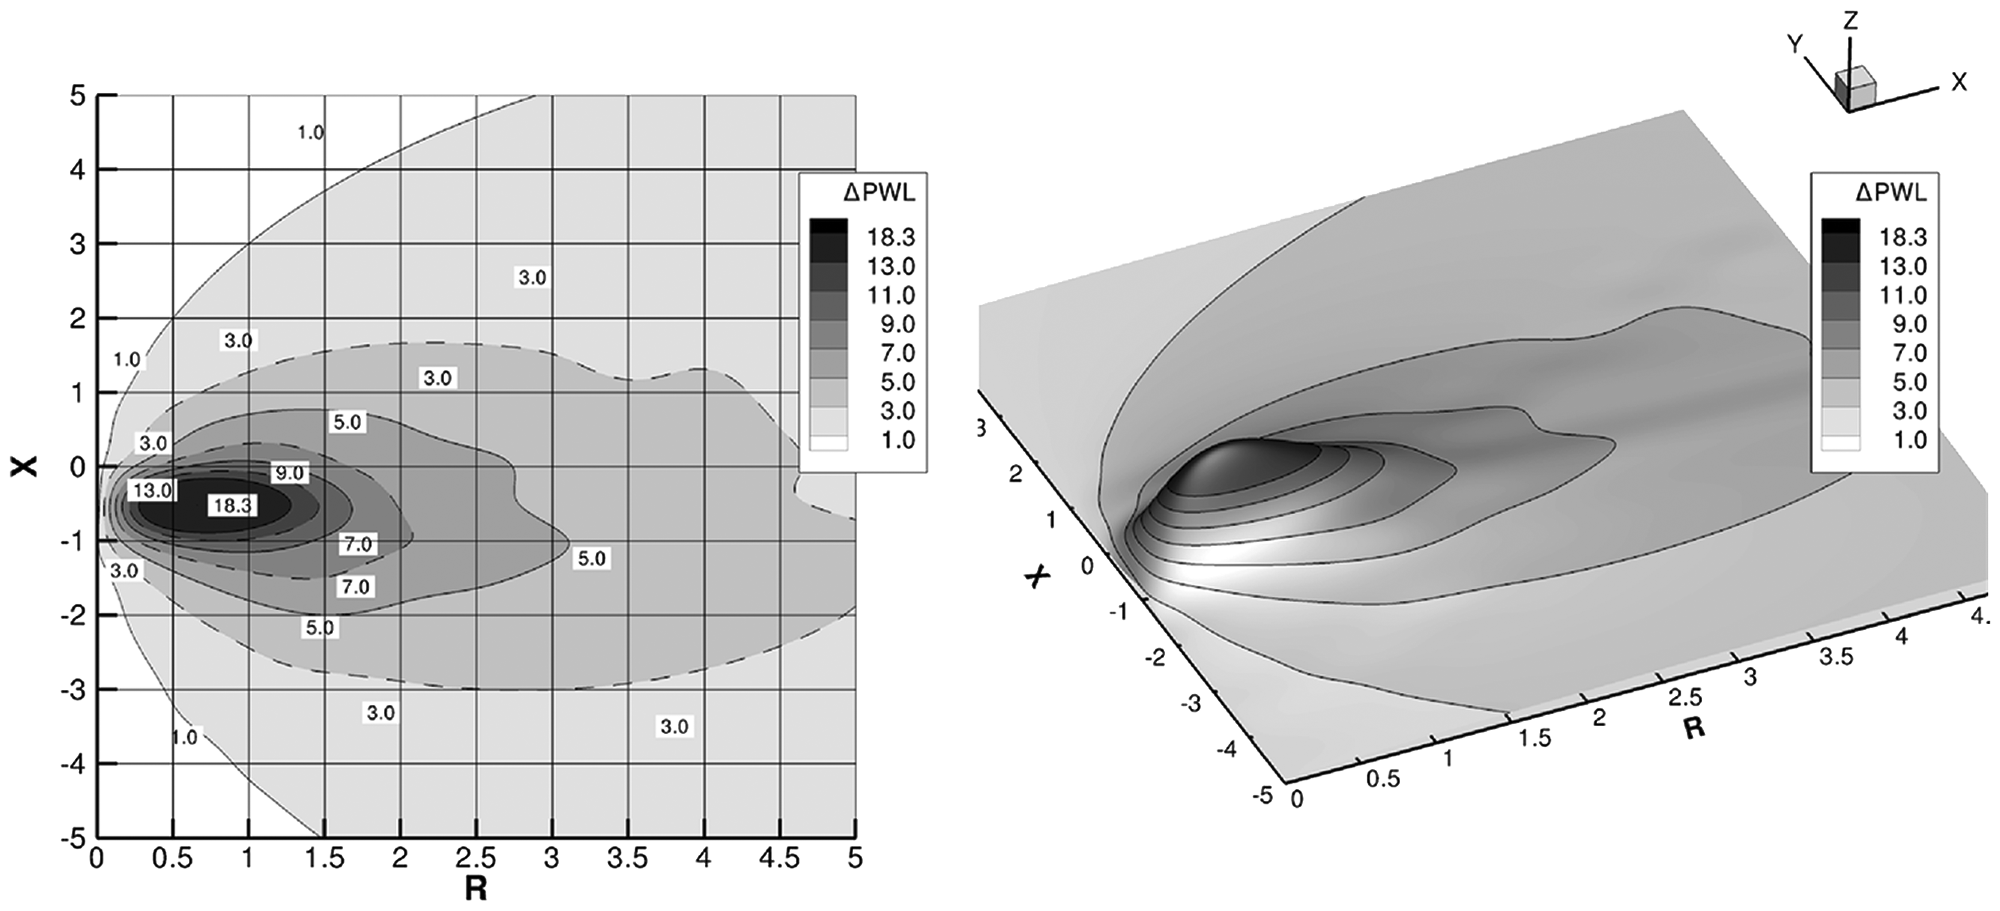
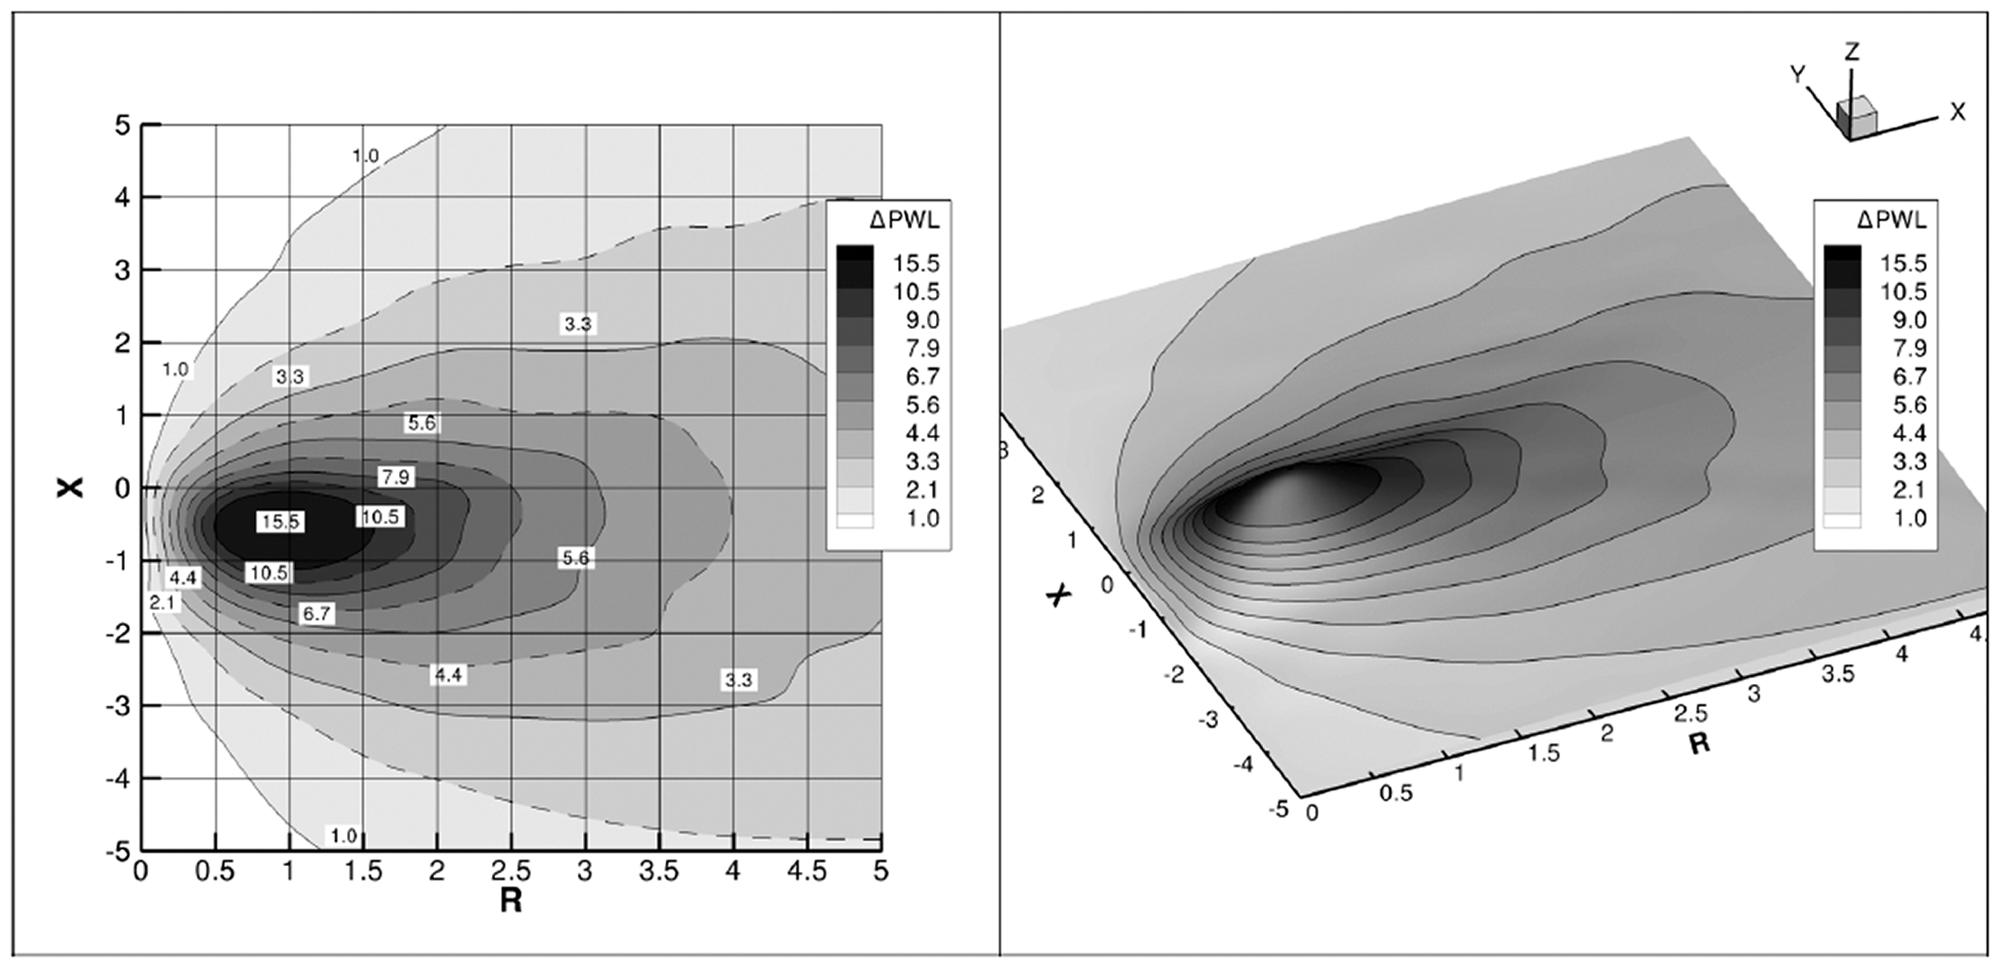
Optimum impedance for the case 500 Hz,
Optimum impedance: 500 Hz,
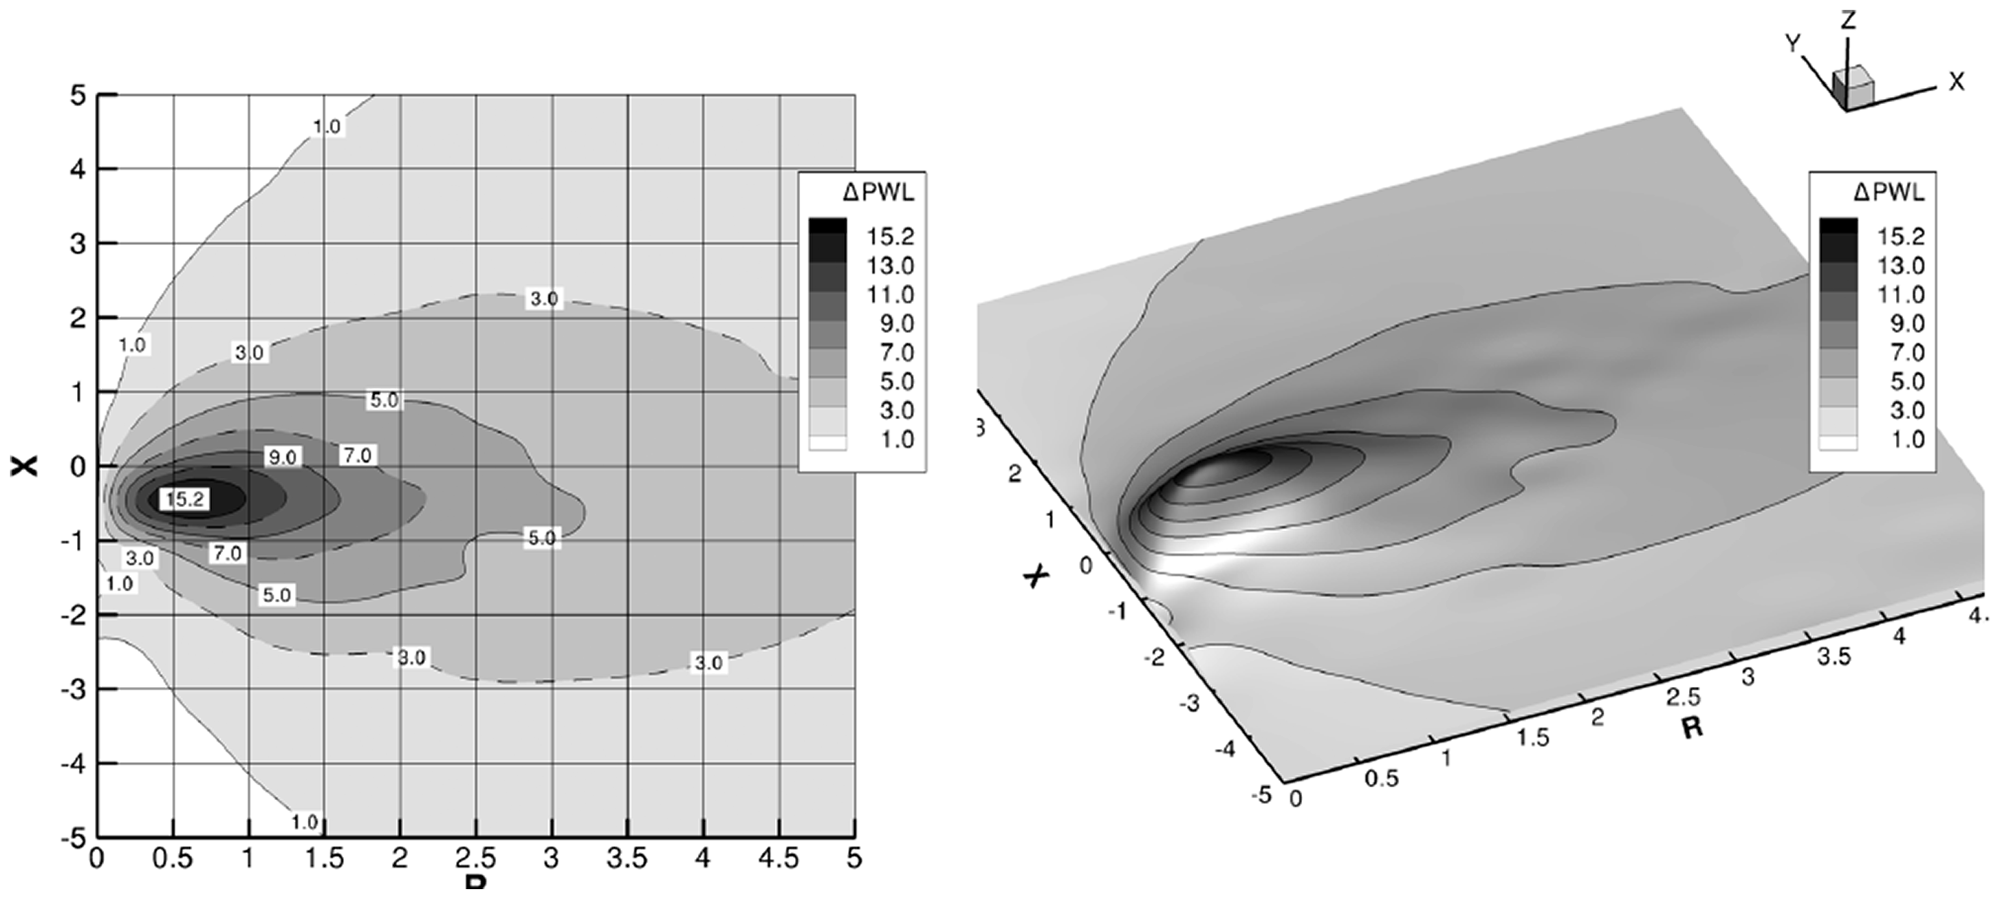
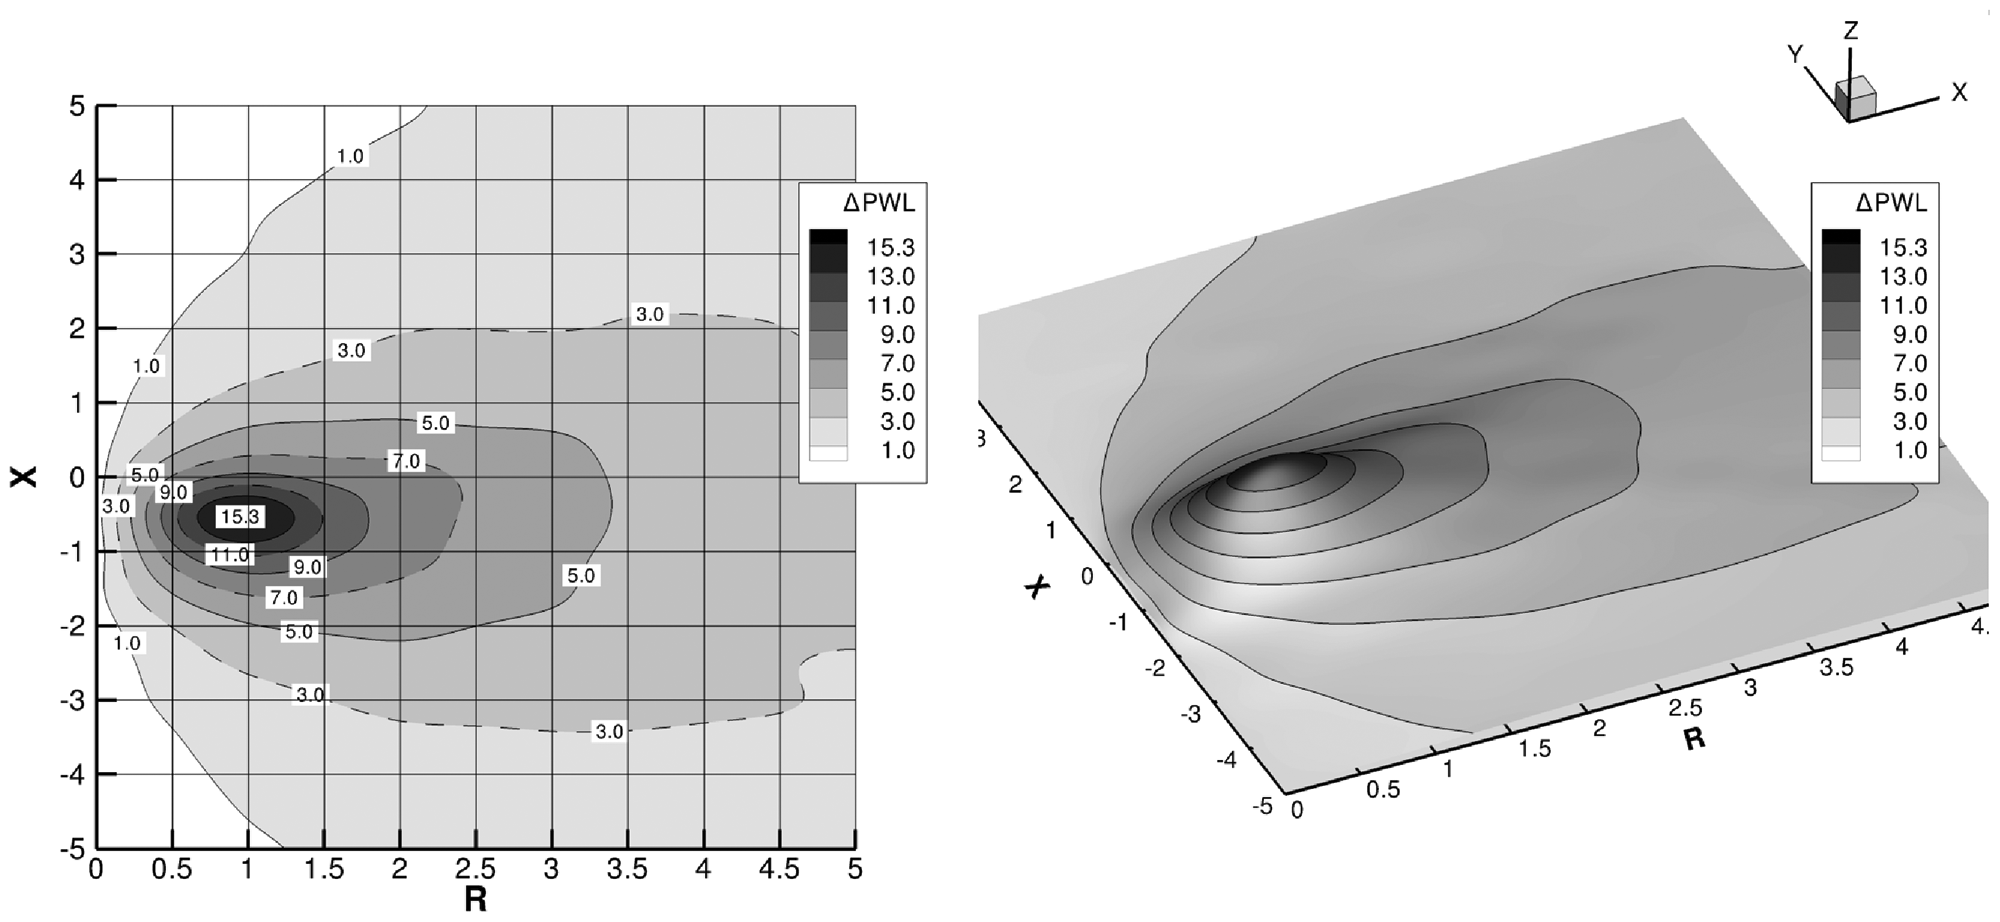
Optimum impedance for the case 500 Hz,
Optimum impedance: 500 Hz,
Optimizing the insertion loss
The computed insertion loss was plotted against liner resistance and reactance for each azimuthal mode m, Helmoltz number He and flow condition. In all the cases that follow, the broadband source is placed downstream so that the sound propagates upstream against the flow. Figures 10 and 11 show the results for the approach condition and frequency of 500 Hz (He = 9.24) for the cases whithout swirling flow and when the swirling flow is present, respectively. For the case without swirl, the optimum attenuation is 18.30 dB/m and the optimum impedance is
Figures 12 and 13 show results in the same format for the Take-off condition at the same frequency of 500 Hz (He = 9.24). For the axial flow case, the optimum attenuation is 15.22 dB/m and the optimum impedance is
To observe the effect of the calculated frequency on optimal impedance, similar results were plotted for the frequencies of 630 Hz (He = 11.64), 800 Hz (He = 14.67),100Hz (He = 18.47) and 1250 Hz (He = 23.28).
Variation of optimal impedance with swirl magnitude and frequency
Results obtained for optimum impedance and transmission loss presented in the previous section are now analysed. Optimum resistance and reactance values as well as optimum insertion loss are plotted against frequency for the four mean flow cases to identify general trends. Figure 14 shows the variation of optimum resistance with frequency for the cases with and without swirl for the approach and case. Figure 15 shows the variation of optimum resistance with frequency for the case without swirl for the approach and take-off cases.
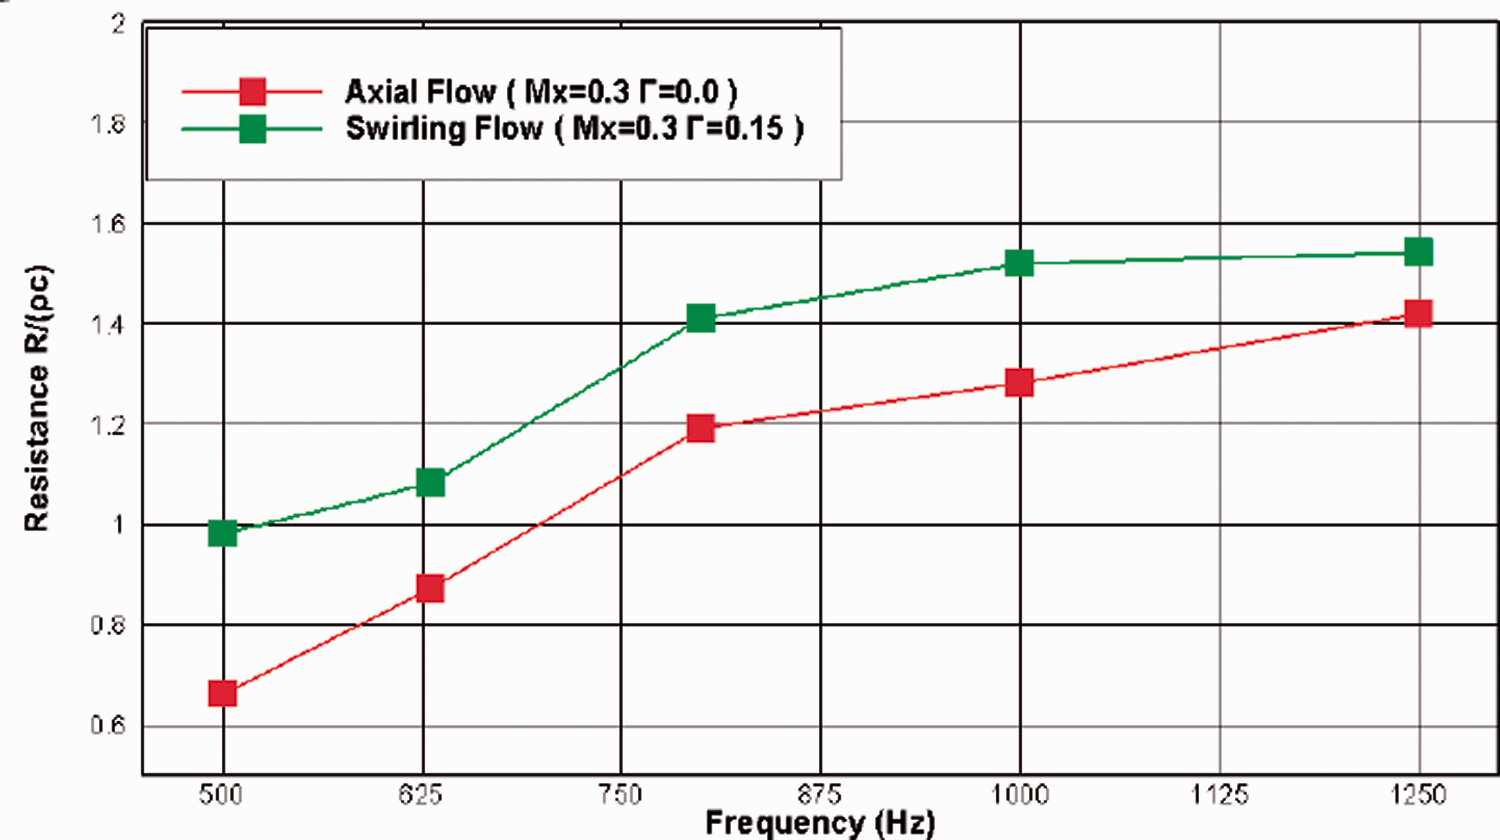
Variation of optimum resistance with frequency for the cases with and without swirl for the approach case.
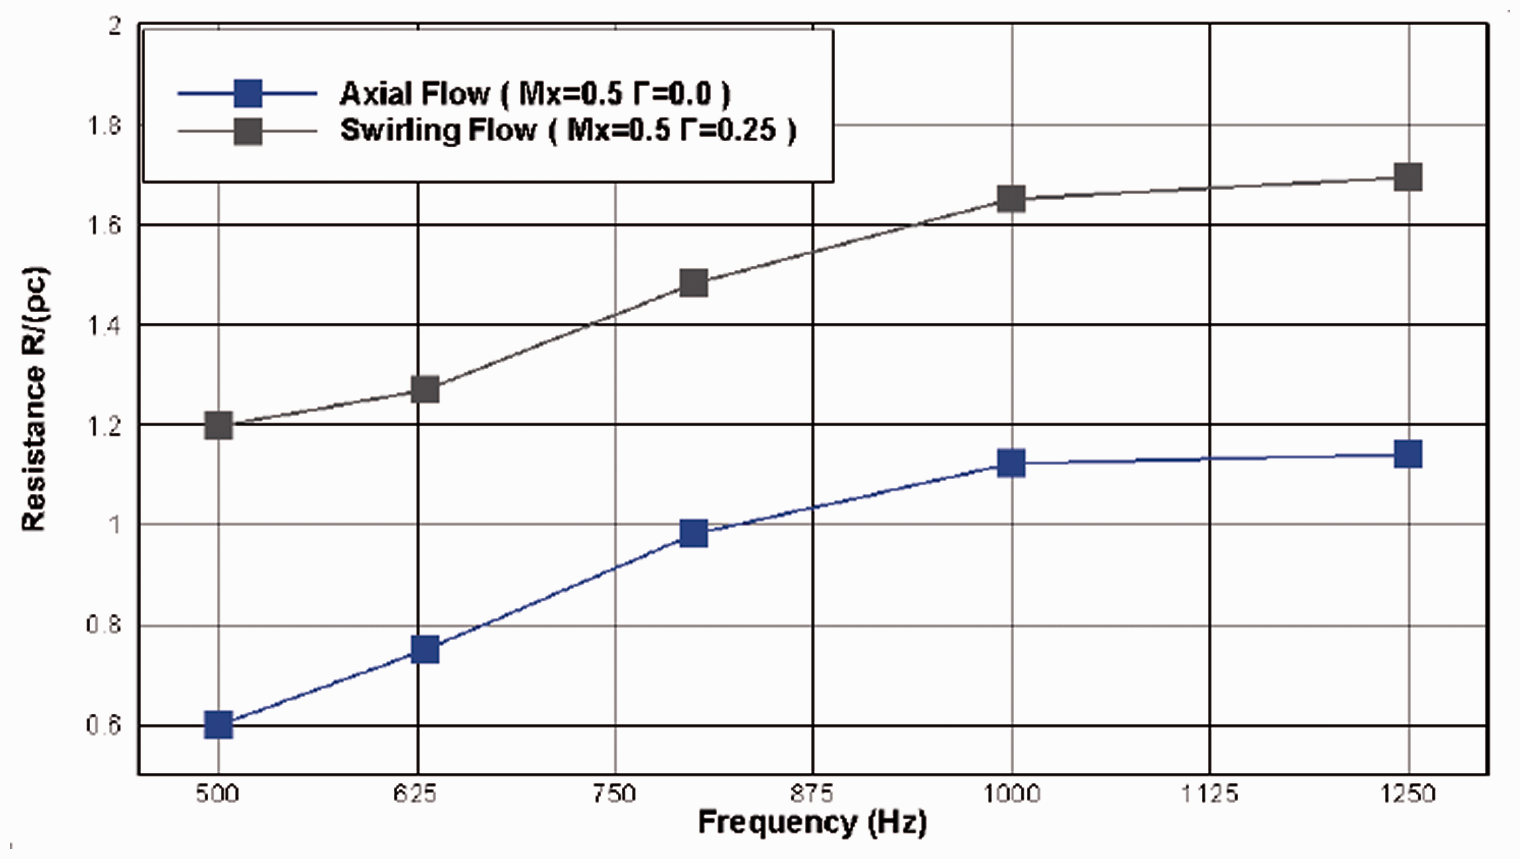
Variation of optimum resistance with frequency for the cases with and without swirl for the take-off case.
When swirl is present, the optimum resistance increases for all frequencies in the cases presented. The difference is greater for the take-off case in which both axial and swirl Mach numbers are larger.
Figures 16 and 17 show the variation of optimum reactance with frequency for the cases with and without swirl for the approach and take-off cases. For both swirling and no-swirling flow cases, the optimum reactance increases with frequency. When swirl is considered, the optimum reactance changes, but whether it increases or decreases depends on the frequency range and Mach number.
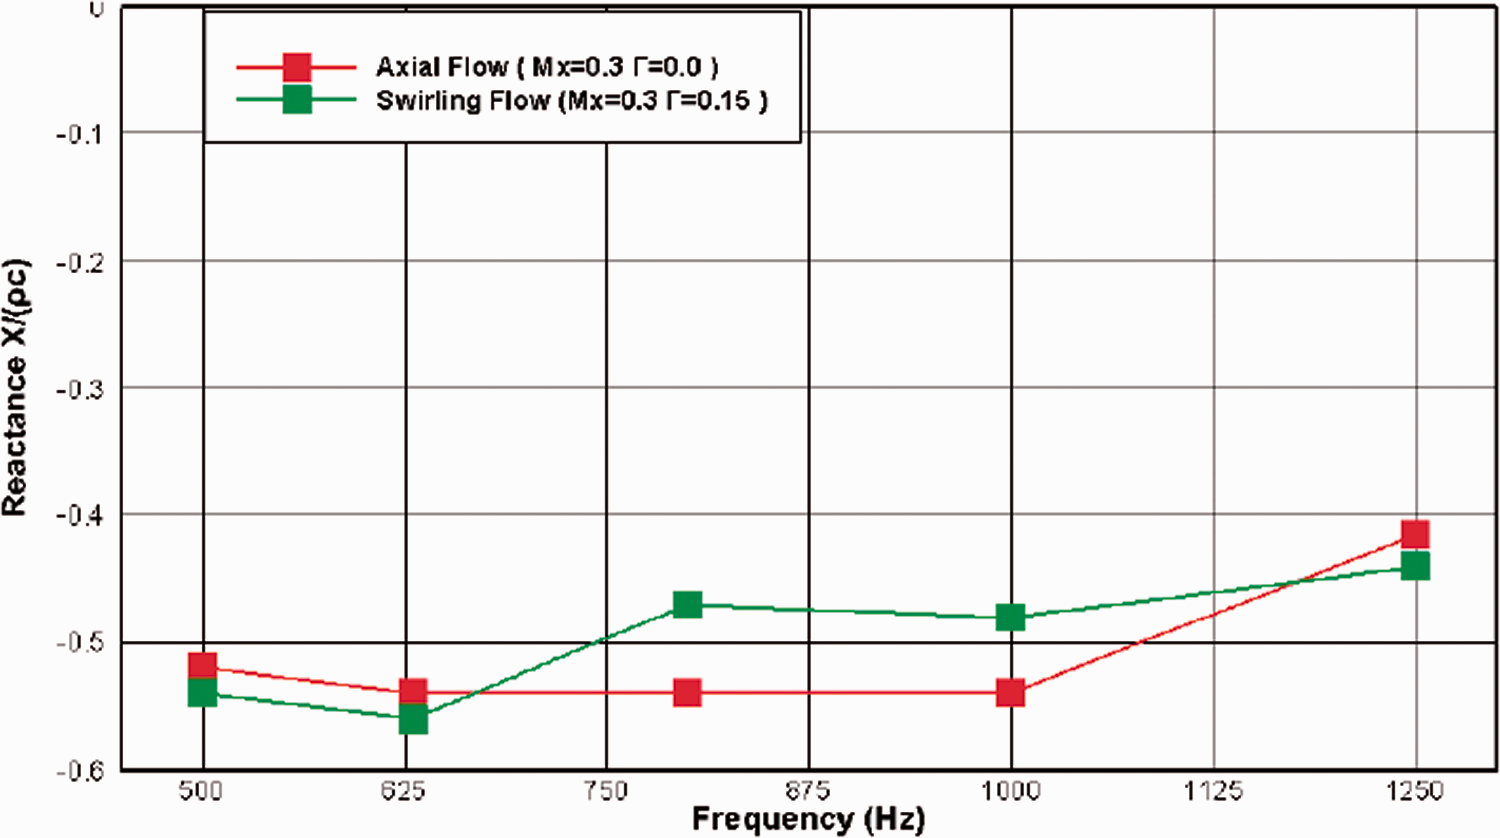
Variation of optimum reactance with frequency for the cases with and without swirl for the approach case.
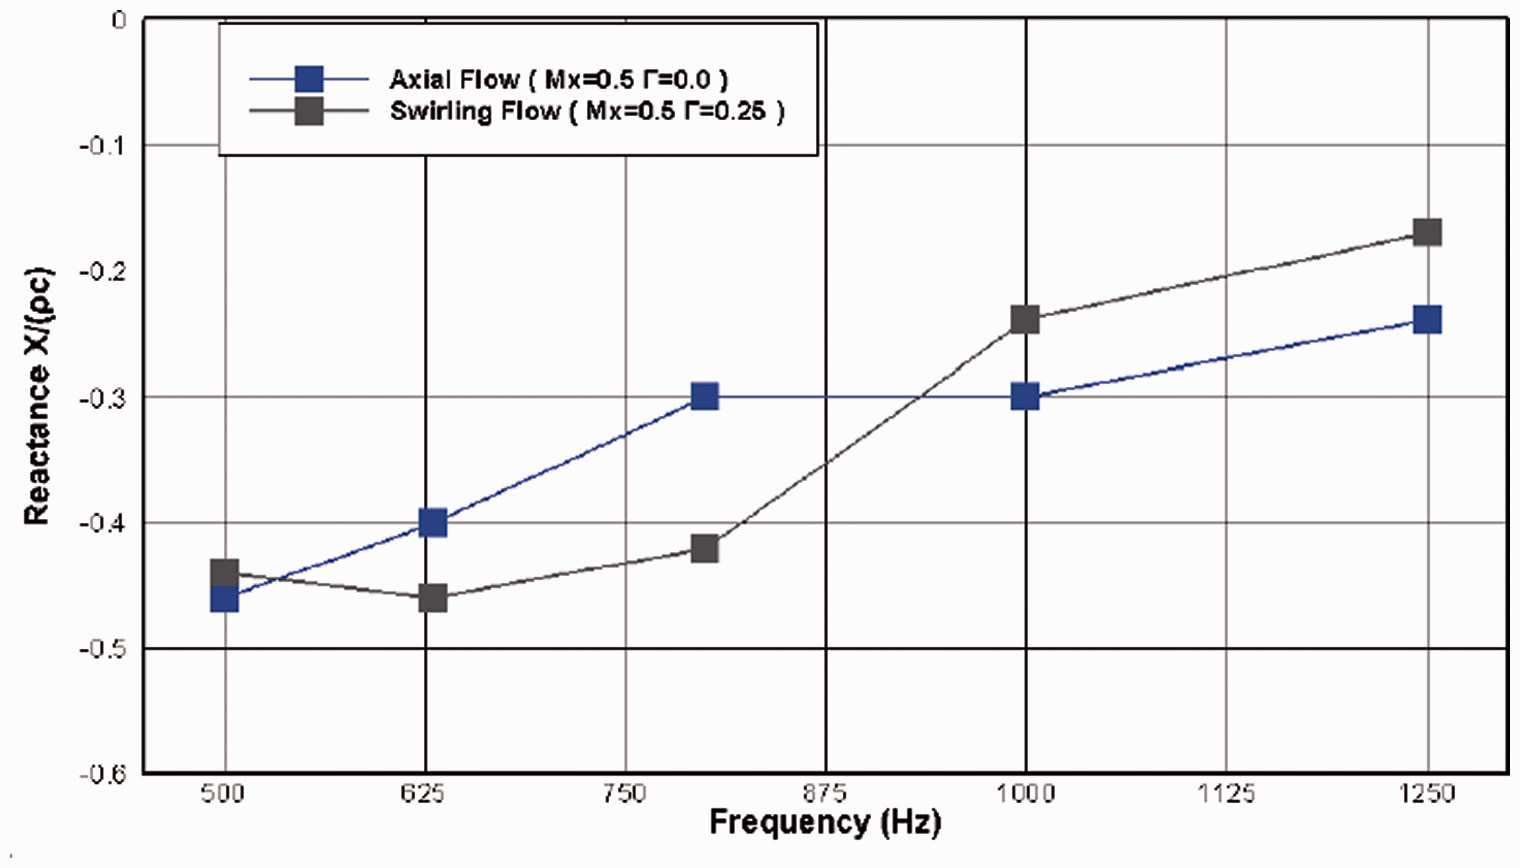
Variation of optimum reactance with frequency for the cases with and without swirl for the take-off case.
Figures 18 and 19 show the variation of optimum insetion loss with frequency for the cases with and without swirl at approach and take-off. The swirl causes the insertion loss to decrease for most cases, except for the approach case at 800 Hz, where the insertion loss is almost the same for both cases. At take-off the trends are more straightforward. In this case the insertion loss decreases when swirl is present.
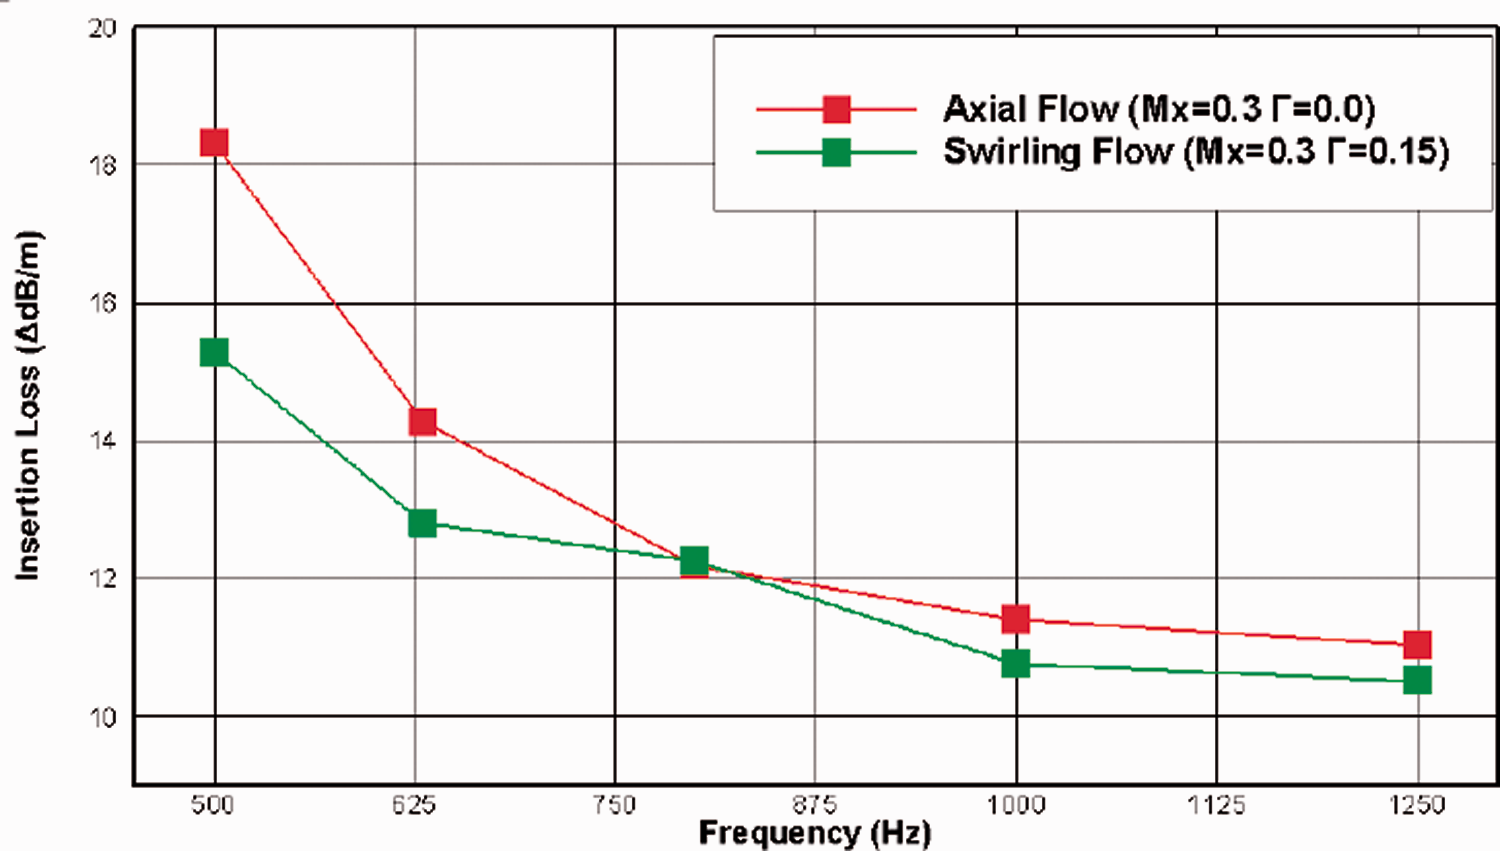
Variation of optimum insertion loss with frequency for the cases with and without swirl for the approach case.
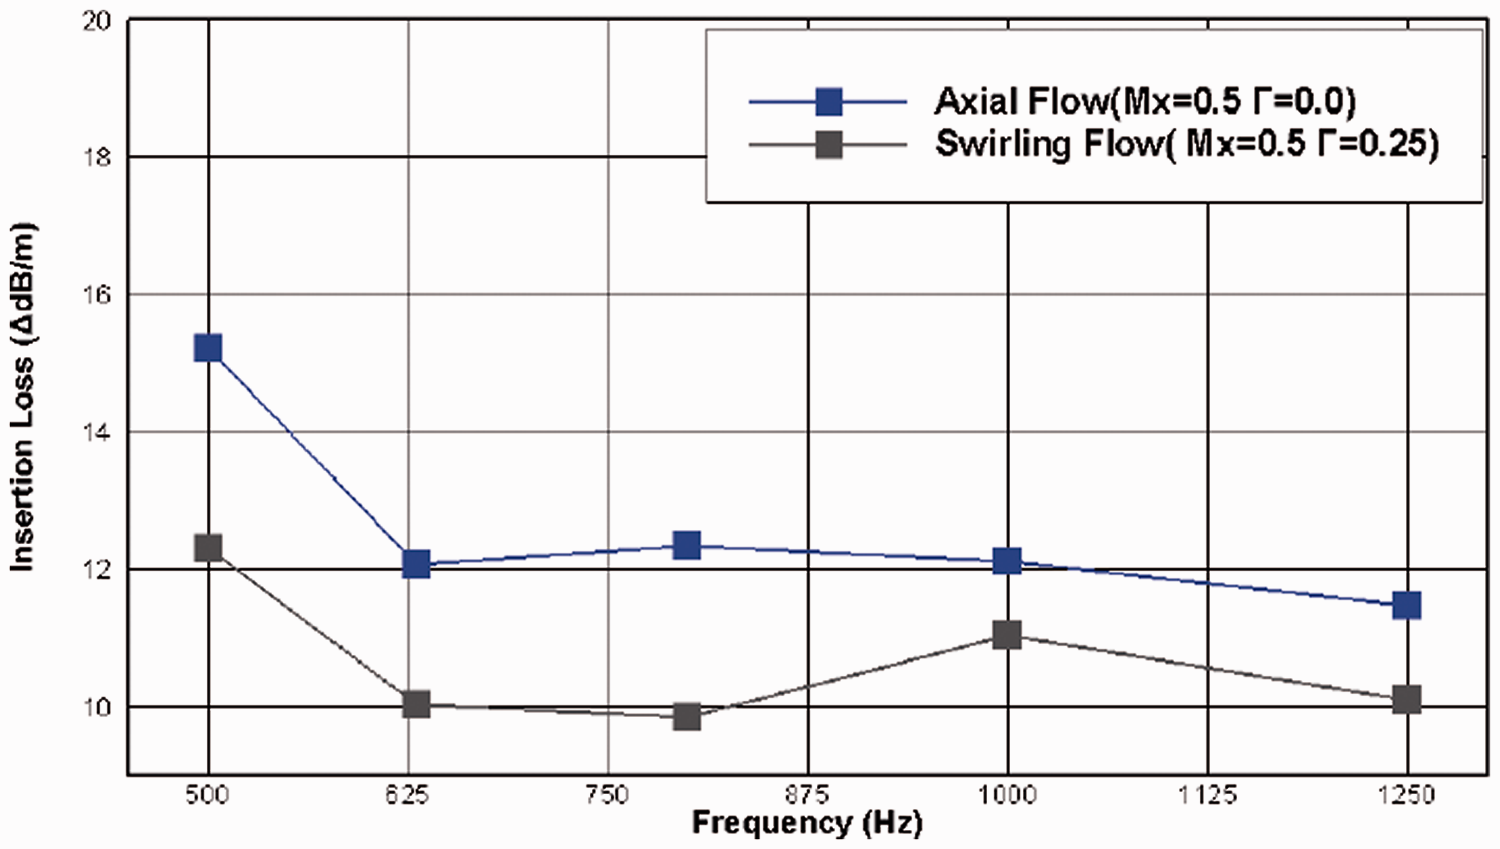
Variation of optimum insertion loss with frequency for the cases with and without swirl for the take-off case.
Variation of optimal impedance and insertion loss with the direction of propagation
So far, the parametric study that investigated how the swirling flow affects optimum impedance was undertaken by carrying out multimode calculations for a simulated broadband noise source propagating upstream from the stators towards the fan in the interstage region. The results are different when a simulated broadband noise source propagating downstream of the rotor towards the stator in the interstage region is considered.
To illustrate the case in which a simulated broadband noise source propagates downstream from the rotor towards the stator in the interstage region, further calculations were carried out for this case for the approach condition at a frequency of 500 Hz (He = 9.24).
The insertion loss for the broadband source was calculated in the same way as previously (from equation (17)). The modal content considered was defined again based on modal triangles previously presented. The nearly convected modes, which also propagate downstream, are not considered in this calculations because they carry a very small pressure component and are assumed not to be of significance for the calculation of acoustic power.
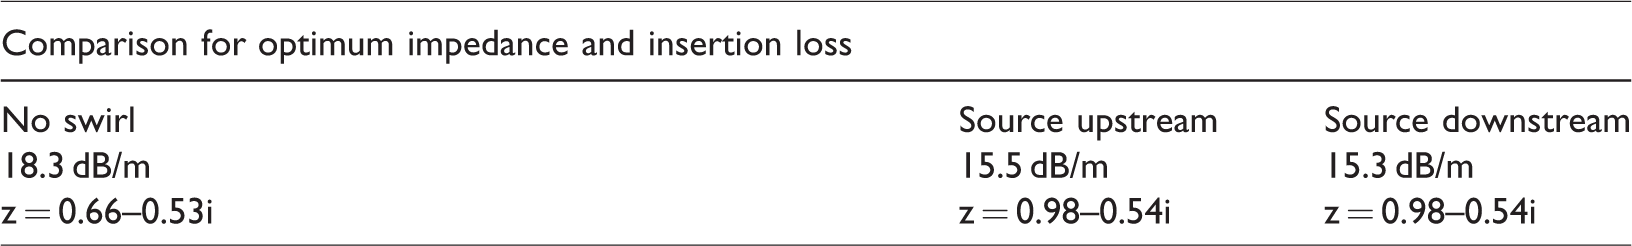
Results for a simulated broadband noise source propagating downstream of the rotor towards the stator in the interstage region. Approach condition and frequency of 500 Hz (He = 9.24).
It is observed that when the source is placed upstream the trends remain the same when the swirling flow case is compared to the case in which the swirling flow is neglected in terms of optimum insertion loss and optimum impedance. When swirl is considered, the optimum insertion loss decreases, the optimum resistance increases and the change in optimum reactance is not of significance. When the two swirling flows are compared, it is observed that the optimum insertion loss is lower for the case in which the source is placed downstream, although the optimum impedance remains the same.
Conclusion
Swirl can prevent unsteady disturbances from reaching the walls and make expensive wall treatments ineffective. The swirl changes the phase speed relative to the mean flow. On the one hand the relative phase speed decreases in modes that rotate in the same direction as the swirl and those modes become more cut-off. On the other hand, the relative phase speed increases in modes that rotate in a direction opposite to the swirl and they become more cut-on as the swirl increases. 4
A parametric study has been presented in the current paper to evaluate the effect of swirl and liners on sound propagation in the insterstage region of a turbofan engine. The study focuses on a broadband noise source generated by the OGVs propagating upstream in a swirling flow. Geometric and mean flow parameters and frequency were chosen to correspond to realistic values in a turbofan engine at approach and take-off conditions. The first part of the study was carried out for hard-walled ducts. It was observed that the swirl changes the modal content. The higher the swirling flow magnitude, the more modal content is shifted to negative circumferential mode orders. Co-rotating modes become more cut-on and contra-rotating modes become more cut-off.
The second part of this study focused on the effect of swirling flow on optimal liner attenuation in the interstage region. It is considered that the broadband noise source is placed downstream and that the sound propagates upstream, against the flow. The modal content for the broadband source was defined based on equal energy power distributed among the cut-on acoustic modes for the hard walled case. Contour plots of attenuation versus impedance were generated for approach and take-off mean flow conditions. When swirl is present, the optimum resistance and the optimal resistance increase and the change in optimal liner reactance is not as pronounced. The swirling flow also reduces overall attenuation when the optimum impedance is chosen. The insertion loss is lower when swirl is present. As a conclusion, the effect of swirl is significant and should be considered when designing liners for the interstage region.
To exemplify the case in which a simulated broadband noise source propagating downstream of the rotor towards the stator in the interstage region is considered, further calculations were carried out for the approach condition and frequency of 500 Hz (He = 9.24). It is observed that when the source is placed upstream the trends remain the same when the swirling flow case is compared to the case in which the swirling flow is neglected in terms of optimum insertion loss and optimum impedance. When swirl is considered, the optimum insertion loss decreases, the optimum resistance increases and the change in optimum reactance is not of significance. When the two swirling flows are compared, it is observed that the optimum insertion loss is lower for the case in which the source is placed downstream, although the optimum impedance remains the same.
Footnotes
Acknowledgements
The first author is the recipient of a Dorothy Hodgkin Postgraduate Award jointly funded by the Engineering and Physical Sciences Research Council (EPSRC) of the UK and Rolls-Royce plc and the work published in this paper is part of a PhD at the University of Southampton funded by those institutions. The remaining authors from the University of Southampton were supported through the Rolls-Royce University Technology Centre in Gas Turbine Noise at the University of Southampton. The first author would like to thank Brian Tester for his helpful advice on all aspects of this work and Paul Murray for fruitful discussions about liner design.
Declaration of conflicting interests
The author(s) declared no potential conflicts of interest with respect to the research, authorship, and/or publication of this article.
Funding
The author(s) received no financial support for the research, authorship, and/or publication of this article.