
Abstract
Pylons are commonly used for the mounting of engines in the aircraft industry. On the other hand, the installation of a pylon influences the noise generation mechanisms and therefore alters the broadband noise characteristics of a given turbomachinery setup. In this investigation, a counter-rotating open rotor with and without a pylon is investigated in order to determine its effects on broadband noise sources. The various broadband noise sources and their typical frequency ranges have been determined using beamforming maps and spectral analysis. In order to attain a clear impression regarding the broadband noise sources, the Double Filtering beamforming method has been utilized in the investigation. This method removes the tonal components from the recorded signal of a microphone array, resulting in a purely broadband signal. Using beamforming maps, the dominant broadband noise source amplitudes and locations can therefore be investigated in great detail. Compared to other methods, the investigation of measurement data and beamforming maps helps determine the amplitude, the frequency range, and the significance of the various types of broadband noise sources that are truly present in the emitted noise. It has been found for lower frequencies, that the broadband noise sources at the blade root of the aft rotor are dominant, while for higher frequencies, the significant broadband noise sources are localized to the trailing edge region of the forward rotor and the leading edge of the aft rotor. The installation of a pylon has resulted in an additional broadband noise source appearing at the blade tip of the aft rotor.
Introduction
Counter-Rotating Open Rotor (CROR) aircraft propulsion systems consist of two unducted rotors rotating in opposite directions. They are considered as having better efficiencies than single rotor turbomachinery configurations.1–6 Such propulsion systems have been investigated multiple times by the aircraft industry in order to reduce fuel costs, improve fuel efficiency, and increase flight range. One of the first published investigations which looked at dual rotating propellers appeared in the 1940s. 7 A significant research campaign was carried out later on in the 1970 s and the 1980 s.1,2,8 This campaign ended with the end of the so-called “oil crisis” of the time, as further research was not funded. In the early 2000 s, environmental awareness sparked a renewed interest in highly efficient propulsion systems, and hence CROR technology was once again investigated.9–12 Currently, the fast-paced development of drone, Unmanned Aerial Vehicle (UAV), and Urban Air Mobility (UAM) technology, along with the increasingly widespread development of and demand for electric vehicles, has provided yet another push to the investigation of alternative aircraft propulsion systems with high efficiencies.6,13,14
In today’s world, it is not sufficient to focus entirely on aerodynamic investigations, as it is also necessary to carry out aeroacoustic investigations in order to observe whether the technology meets the strict requirements of noise pollution regulations. Phased array microphone systems and beamforming technology provide a valuable measurement tool, often used to localize and investigate the dominant noise sources of turbomachinery components, such as isolated airfoils and cascades,15–17 industrial fans,18,19 single rotor engines,20–23 and CROR systems.24–29 Using beamforming technology, the locations and the amplitudes of the most dominant noise sources can be investigated, making it possible to determine the most dominant noise generation mechanisms. Upon identifying the noise generation mechanisms, further developments explicitly aimed at decreasing the noise characteristics can be made.
The noise generated by CROR has been investigated in many publications, including Refs 2–10,20,24–28, and 30. The published results show that multiple noise generation mechanisms result in noise components that can fall in coinciding frequency bins. As an illustration, consider broadband noise, which is by definition present in a wide frequency range, while multiple tonal noise components can appear in various narrow frequency bands along the same frequency range, typically having relatively large amplitudes compared to the broadband noise components. As a result, when investigating the spectra and the beamforming maps of the broadband noise sources, which show the locations of the dominant noise sources of the investigated frequency range, the results are often difficult to comprehend as a result of the disturbing tonal components and vice versa the broadband components disturb the investigation of the spectra and the beamforming maps of the tonal components. To improve the investigations' output, the tonal and broadband noise sources should be separated and investigated individually.
Methods can be found in the literature for removing the tonal components from noise signals.30,31,32,33 Sree and Stephens32,33 have developed a technique and applied it in removing the tonal components from single microphone CROR measurement data. The authors of the current investigation have further developed this method and applied it to phased array microphone data, providing a broadband time-domain signal, which is then processed using beamforming technology in order to localize the broadband noise sources. 25 In the first step, the algorithm removes the tonal components from the signal related to the rotors' rotation. However, other tonal noise components can also appear in the recorded signals, which are not related to the rotors' rotation. These tonal noise sources can be generated by almost anything, including the measurement equipment and test facility. Therefore, it is essential that these tonal noise components also be removed from the signal. Therefore, the authors have further improved the processing method and applied an additional filtering process using the same concept, but with other parameters in order to remove the effects of additional, non-rotational tonal noise sources. The removal of the tonal components from the signal makes it possible to investigate the broadband components of the emitted noise of the CROR. The method is referred to as the Double Filtering beamforming method. 25 Applying additional signal processing methods makes it possible to isolate and separately investigate the tonal components, 34 but the current investigation will focus only on the broadband noise components.
The Double Filtering beamforming method was first introduced via investigating the broadband noise sources of an uninstalled CROR. 25 In the given case, the rotors were mounted on a test rig, extending out a considerable distance in front of the rig’s support structure in order to minimize aerodynamic interference between the rotors and the test rig. CROR engines need to be mounted on the wings or fuselage in real applications using support structures called pylons. Many configurations are possible, but in general, there are two categories, pusher and tractor configurations. In the pusher configuration, as investigated herein, the streamlined pylon is positioned upstream of the rotors, disturbing the flow which reaches the rotating blades. As a result, the pylon changes the noise characteristics of the rotors by altering the existing noise sources and generating additional ones and therefore needs to be better understood.11,24,35 In, 24 the effect of a pylon on the noise sources of a CROR for takeoff nominal flight conditions has been studied, but it was difficult to define its impact on the broadband noise sources due to the presence of the tonal components. Applying Double Filtering has made it possible to determine the pylon’s effect on the broadband noise generation mechanisms. In this article, the Double Filtering beamforming method has been further developed, resulting in a broadband noise signal that better resembles the original broadband component. Therefore, it provides better spectral results and cleaner beamforming maps of broadband noise sources. The further developed Double Filtering beamforming method is applied herein to an installed (with a pylon) as well as an uninstalled case (without a pylon). The broadband noise sources are localized, identified, and compared, providing an opportunity to observe a pylon’s effect on the broadband noise generation mechanisms of a CROR in great detail. This contribution is significant as compared to the state of the art available in the literature, as it investigates the amplitudes and locations of the various dominant broadband noise sources of an installed CROR with a pylon and an uninstalled CROR by beamforming without the presence of the tonal noise sources.
Measurement setup
In order to investigate the noise of CROR, measurements have been carried out in the NASA Glenn Research Center 9×15 ft Low-Speed Wind Tunnel (LSWT), mounting the investigated rotors on the Open Rotor Propulsion Rig (ORPR).10,11,27,28 The measurement setup can be seen in Figure 1. Data from the phased array microphone measurements of the test campaign are processed and presented in this article. The blades under investigation are those of the F31/A31 historical baseline blade set.
10
The forward blade row of the design consists of 12 blades with a diameter of 0.652 m, while the aft rotor has 10 blades with a diameter of 0.630 m. View of the camera located in the center of the microphone array color online.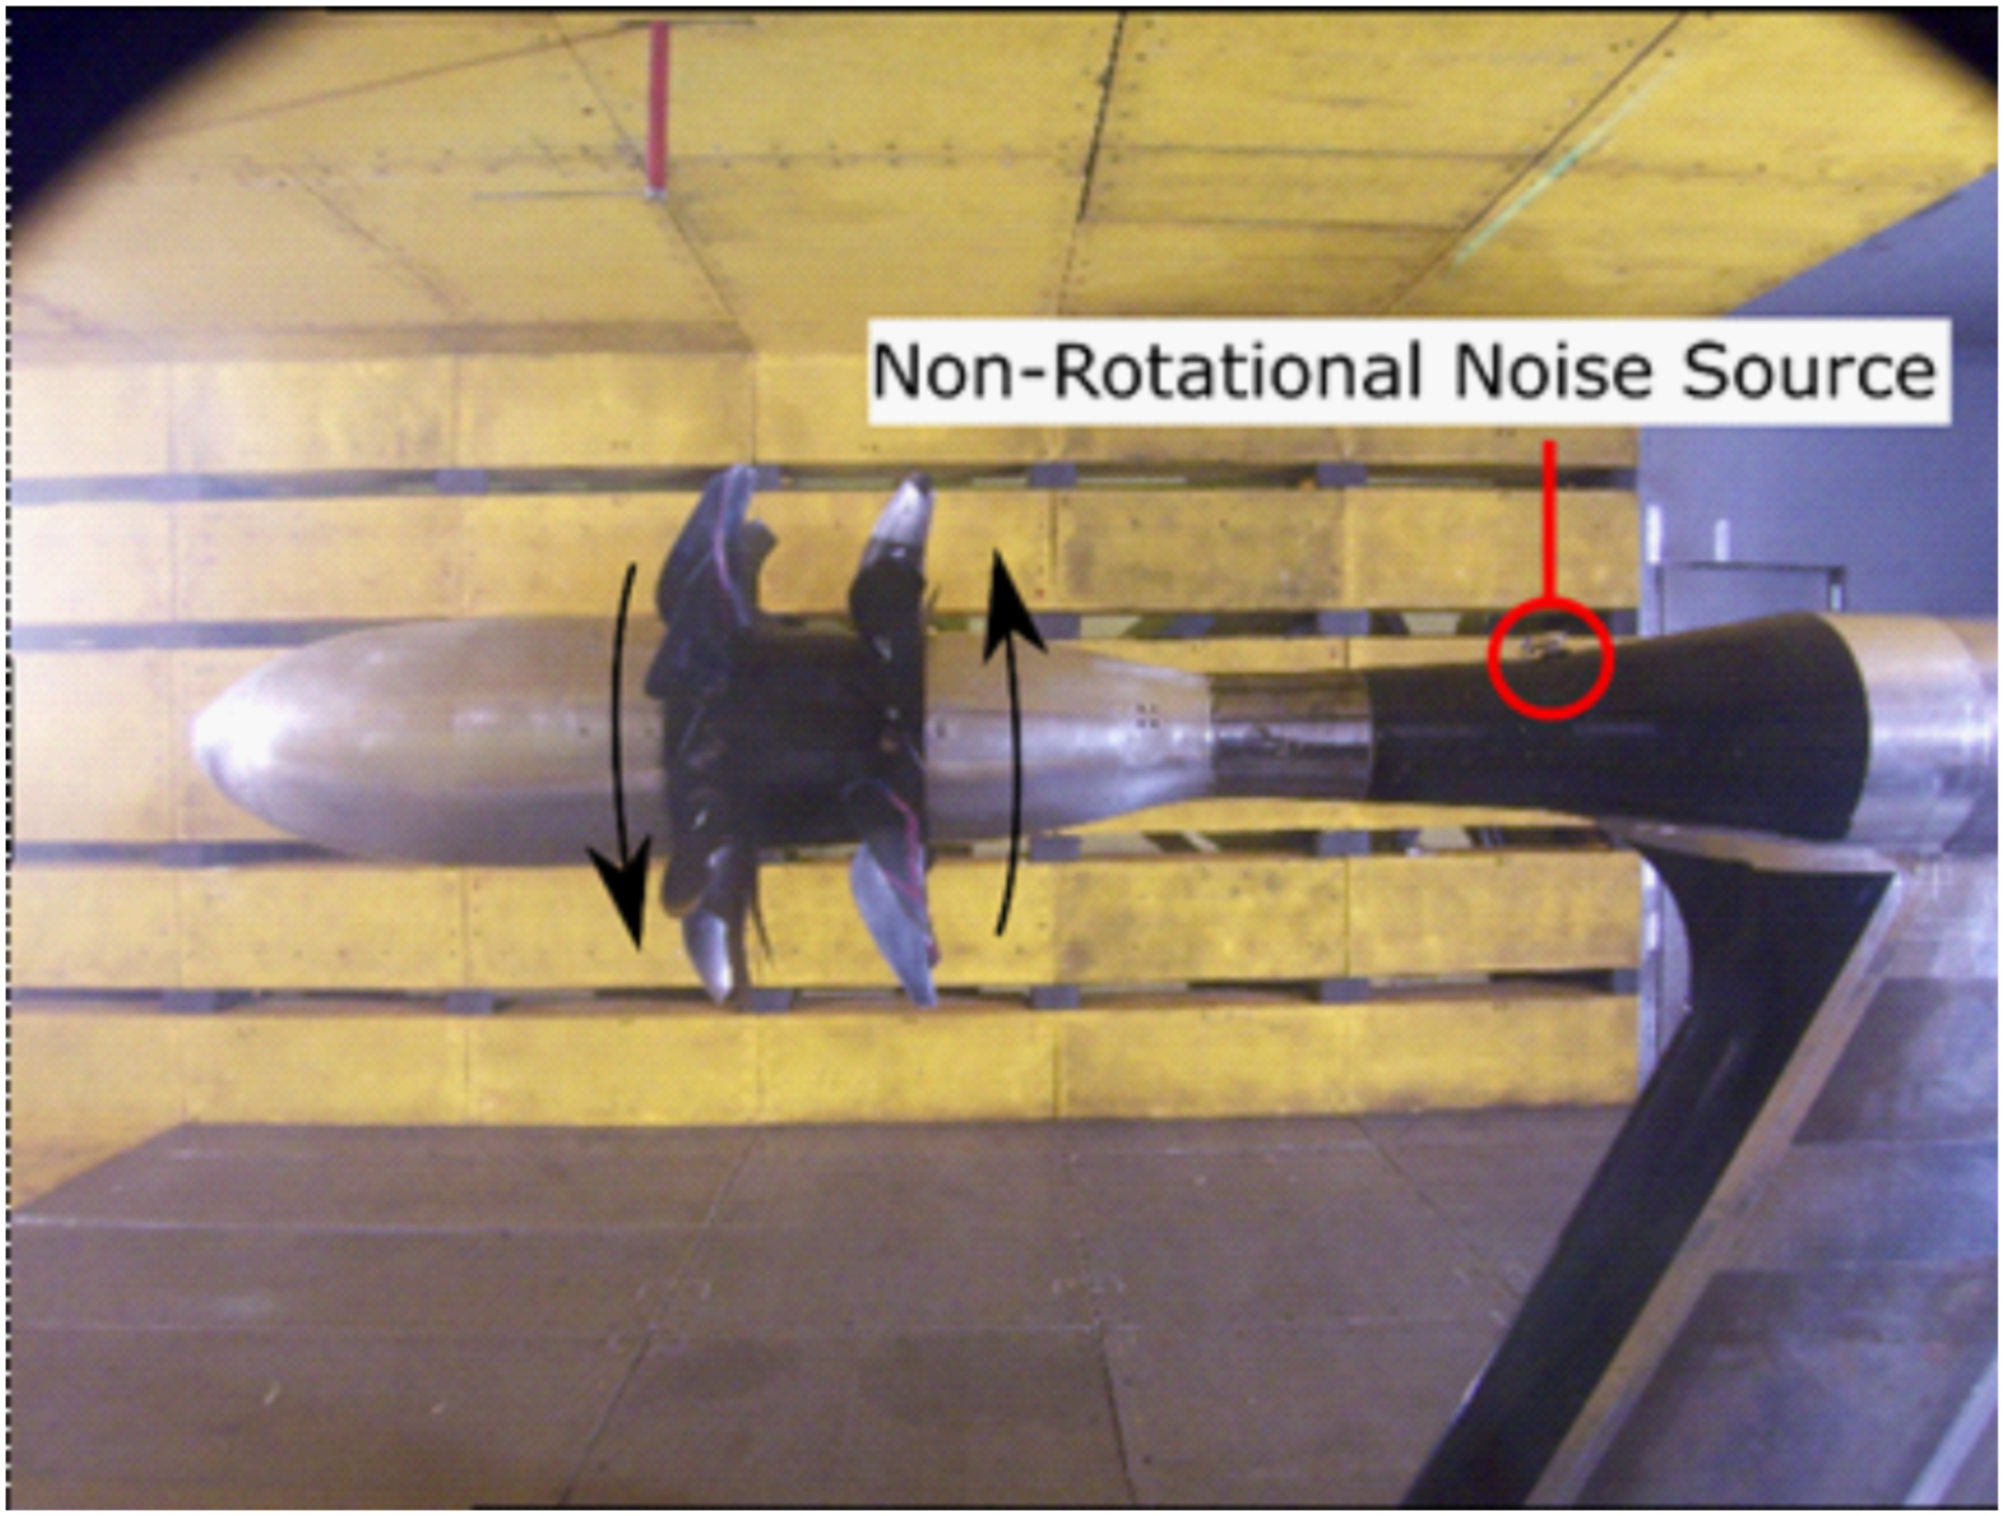
The configuration to be investigated here is the design approach condition, with a blade angle of 33.5° on the forward rotor and a blade angle of 35.7° on the aft rotor. The Mach number of the flow was Mx = 0.2, while the angle-of-attack of the flow with regard to the test rig was 0°. The rotational speeds of both rotors were set to be equal when corrected for standard day operating conditions, having a value of 5598 r/min. As seen from the upstream direction, the forward rotor rotates in the clockwise direction, and the aft rotor rotates in the counter-clockwise direction (marked in Figure 1). Further details regarding the test setup and the test matrix can be found in Ref.10,27,28
Acoustic measurements have been carried out using the OptiNAV Array48 phased array microphone system. 36 The signals from the 48 microphones have been simultaneously recorded at a sampling rate of 96 kHz and then processed using Delay-and-Sum beamforming in the frequency domain. 37 The chosen beamforming method provides a set of beamforming maps that can easily be investigated for all categories of CROR noise sources looked at here, as no important information is removed from the beamforming maps while providing an appropriate signal-to-noise ratio. This could not be said for any of the advanced deconvolution methods looked at during preliminary investigations. The Delay-and-Sum processing method works by taking advantage of the phase difference between the microphone signals in order to localize noise sources in an investigation area. If a noise source does exist in an investigated point, then the delayed and summed signals will result in a large value on the beamforming maps (a noise source is localized), while investigated points that do not have any noise sources will have small values on the beamforming maps. 37 The cross-spectral matrix, which has been utilized during the data processing, has been created using a Fast Fourier Transformation (FFT), having a transform length of 4096 with 50% overlap. 6 dB is subtracted from the results to account for the pressure doubling on the microphone array’s surface. The phased array has been mounted in a cavity along the wind tunnel facility’s southern wall directly across from the test rig during testing. A Kevlar® fabric has been tightly stretched over the cavity’s opening to remove the microphones from the flow, leaving a gap between the fabric and the phased array. Others have developed and tested this technique in Ref,37,38,39 demonstrating the technology’s ability to improve the signal-to-noise ratio. The signal-to-noise ratio has been further improved using a long time series (45 s) and removing the diagonal of the cross-spectral matrix.
During the measurements, the microphone array has been located at a distance of 1.6 m from the center plane of the test rig, the plane under investigation, which is in the acoustic far-field according to simulations carried out by Horváth et al.27,28 In addition, an artificial noise source (deer whistle) has been mounted on the investigated setup to verify the positioning of the beamforming maps. The location of this source is marked in Figure 1 as a non-rotational noise source. Unfortunately, this noise source was present during all of the measurements, and its effect appears in the spectral results and beamforming maps. Therefore, Double Filtering is utilized herein to remove the effect of the non-rotational noise source from the measurement data.
Counter-rotating open rotor noise sources
Earlier studies carried out by the research group have already investigated CROR noise sources using beamforming technology.24,27,28 In these investigations, a manual sorting method has been carried out in order to separate the frequency bins into groups according to the dominant noise generation mechanisms appearing in each frequency bin under investigation, as explained in Ref.
24
The sorting has been carried out based on the locations, the frequency ranges, and the amplitudes of the noise sources, as these best define what category a given noise source belongs in. The noise sources of turbomachinery systems can be categorized based on the characteristics and the spectrum of the emitted noise and the movement of the noise sources. Based on the characteristics of the emitted noise and its spectrum, coherent and incoherent noise sources can be distinguished. In CROR applications, coherent noise sources are typically narrowband noise sources that are related to the rotational speed. The noise generation mechanisms of incoherent noise sources are, in most cases, broadband. According to the literature, CROR broadband noise is random but statistically stationary.
33
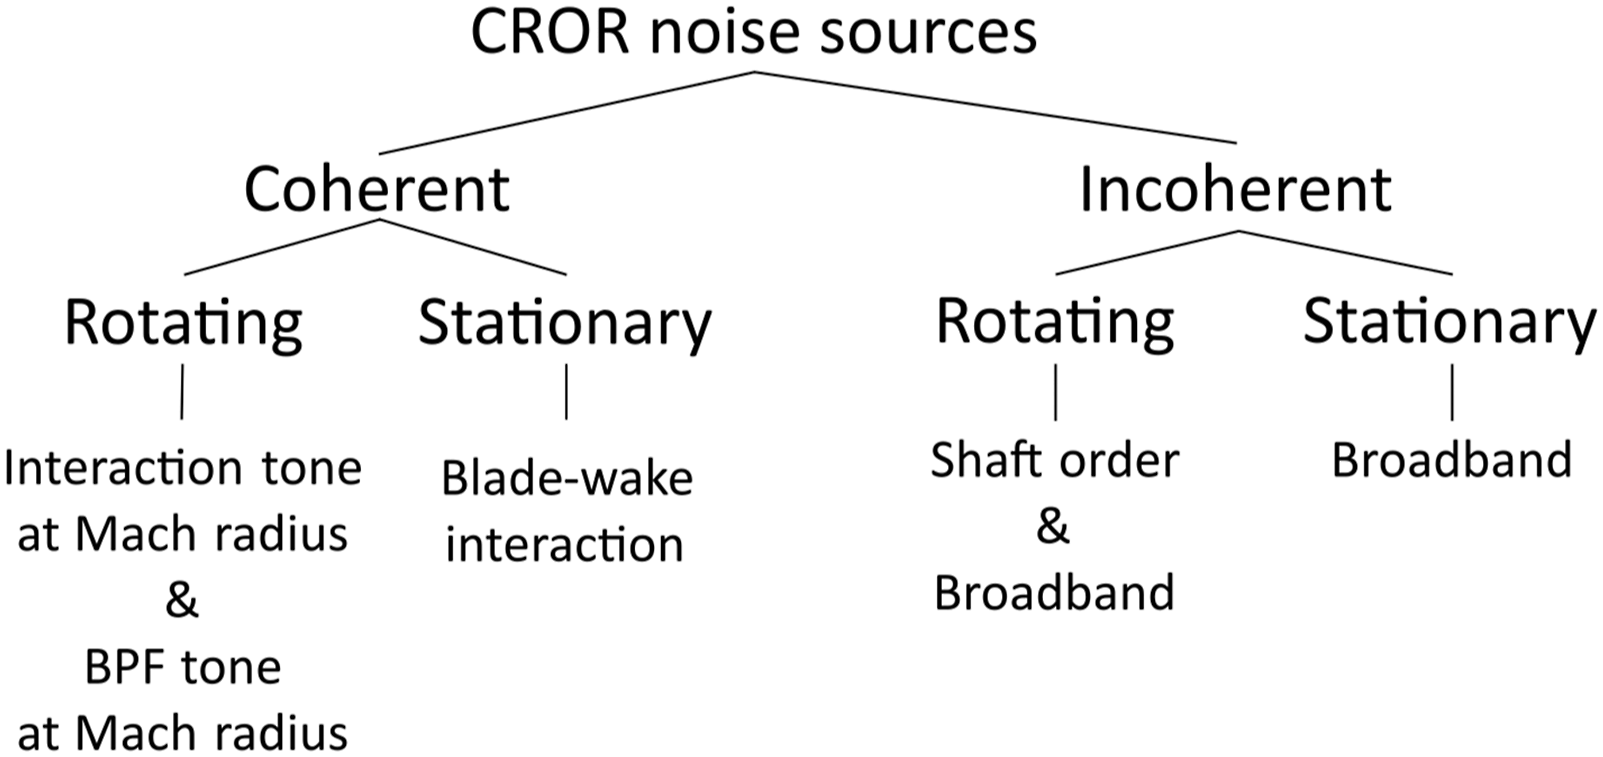
Categorizing turbomachinery noise sources according to their movement, they can be rotating or stationary. Rotating noise sources are generated mainly by the rotors and their interaction, while stationary noise sources are generated mainly by a piece of non-rotational equipment or its interaction with a rotating rotor. Investigating a CROR with and without a pylon, the following noise source categories can be identified: rotating coherent noise sources, stationary coherent noise sources, rotating incoherent noise sources, and stationary incoherent noise sources. These CROR noise source categories are summarized in Figure 2. The identified noise source categories are explained in the following sections. The noise source categories of a CROR.
24
Rotating coherent noise sources
Rotating coherent noise sources result from coherent noise generation mechanisms associated with each blade of a given rotor or rotor pair. Two rotating coherent noise source categories have been identified herein. These are Blade Passing Frequency (BPF) tones and interaction tones. Their frequencies and harmonics can be determined based on the rotational speeds and the blade numbers of the various rotors. The rotation of the individual rotors generates BPF tones. This noise source category also appears in the case of single rotor turbomachinery. Interaction tones are generated by the interaction of two blade rows, as the potential field of one rotor interacts with the body of the other rotor, which is significant in the case of the potential field of both the forward as well as the aft rotor. Rotating coherent noise sources are often the most dominant noise sources of a CROR. As a result of their presence, the broadband noise sources are often hidden below the dynamic range of the beamforming maps.
Stationary coherent noise sources
Stationary coherent noise sources have a fixed location, as they do not move or rotate with the rotors. They can be generated by the interaction between the rotor blades and something that is fixed in space. For example, the interaction of the pylon’s wake with the forward and the aft rotor blades generates stationary coherent noise sources, which are referred to as blade-wake interaction tones, and are localized to the corresponding rotors on the beamforming maps. These noise sources appear in the bins associated with the BPF of their respective rotors, since the interactions occur every time a blade cuts through the wake of the pylon. This noise source category does not appear in the results of the current uninstalled case, but has been considered as one of the most dominant noise sources of a CROR installed with a pylon. 24 In the currently investigated case with a pylon, if the Double Filtering beamforming method were not applied, some broadband noise sources would appear in similar positions as stationary coherent noise sources. Since these stationary coherent noise sources often dominate over the broadband noise sources, the broadband noise sources associated with the given frequency bins would most often be hidden below the dynamic range of the beamforming maps. 24
Rotating incoherent noise sources—Shaft order tones
Shaft order tones (otherwise known as once-per-rev tones) are the result of rotating incoherent noise sources, which emit random signals as they rotate together with the blades. These shaft order tones can come about due to blade-to-blade inconsistencies occurring on a given blade row. 8 It is anticipated, that if an observer were to move together with the sources, noise sources in this category would be experienced as broadband noise sources. However, here they appear as tonal peaks in the spectrum, since, from the viewpoint of the stationary observer (phased array), they appear in the same locations once every revolution, having an envelope curve that oscillates at the same frequency as the once-per-rev.8,24 In CROR measurement test cases, shaft order tones have been identified as having smaller amplitudes than rotating and stationary coherent noise sources and being similar in magnitude to broadband noise sources. 24 In the cases investigated herein, they have been identified as appearing on the beamforming maps in a unique location of the aft rotor, which happens to align rather well with the location of one of the broadband noise sources. Therefore, without the application of the Double Filtering beamforming method 25 or other advanced Proper Orthogonal Decomposition (POD) based beamforming methods, 29 it would be difficult to distinguish between these two noise source categories.
Rotating incoherent noise sources—Rotating broadband noise sources
Another subcategory of the rotating incoherent noise sources is that of rotating broadband noise sources, which are the main subject of this article. These noise sources are generated by the broadband noise generation mechanisms of the blades of the rotors. Every blade has broadband noise generation mechanisms, which rotate together with the rotors. The typical broadband noise sources of an airfoil are trailing edge noise, vortex shedding noise, boundary layer separation noise, tip vortex noise, and leading edge noise.15,17 These noise generation mechanisms are present in the case of single rotor as well as CROR configurations. According to the literature,28,46 the most significant broadband noise sources of CROR are leading edge noise, trailing edge noise, and tip vortex noise.
Broadband noise sources generally appear along a wide frequency range. The beamforming investigation of these noise sources as a function of frequency can therefore provide more information about the noise sources than currently available from spectral analysis. Broadband noise sources typically have a smaller amplitude than most tonal noise sources, therefore, their presence is hidden on the beamforming maps of those frequency bins, which are dominated by a tonal noise source. In a former study of the authors, 24 the broadband noise sources have been investigated in only those frequency bins which did not contain tonal noise sources. The Double Filtering applied to microphone array data now makes it possible to study the broadband noise sources by beamforming along the entire frequency range of interest. 25
Stationary incoherent noise sources
Stationary incoherent noise sources are non-moving noise sources, which emit a stochastic signal. They are generally independent of the rotors. In most cases, they will be generated by the system’s non-moving parts, which behave as blunt or streamlined bodies in the flow. The noise generated by the installed pylon belongs to this category. The self-noise generated by a pylon has been investigated in. 40 In this study, a CROR system has been investigated without the rotor blades, providing an opportunity for investigating the noise resulting from only the ORPR and the pylon. As an outcome of the investigation, the noise sources of the pylon were localized on the beamforming maps, but their magnitude is much smaller than that of the noise emitted by the rotors. Therefore, though stationary incoherent noise sources are present in the results of the current investigation, they are not the most significant noise sources of a CROR system, and are therefore not seen on the beamforming maps.
Non-rotational noise sources
Non-rotational noise sources are not directly related to CROR noise, but are discussed herein, as they are also removed from the acoustic signal using the Double Filtering beamforming method. The name “non-rotational noise source” means that their emitted noise is not generated by the rotors of the CROR. They can be any type of tonal noise source with specific frequencies that can be generated independently from the test case, by objects such as the measurement equipment and test facility or other single rotors. In the current test cases, they are generated by a deer whistle, which is mounted downstream of the rotors. The amplitudes of the non-rotational noise sources can be large, as in the cases presented herein, and therefore the broadband noise sources associated with the given frequency bins would be hidden below the dynamic range of the beamforming maps if Double Filtering beamforming methods were not applied. 24
Signal pre-processing and beamforming
Removing the tonal noise components
From among the noise sources discussed above, the large number of tonal components, which are primarily associated with the rotation of the blade sets, makes it hard to investigate the broadband components of CROR. Most of the tonal noise sources dominate over the broadband noise sources of any given frequency bin, hiding them below the examinable dynamic range, and therefore the beamforming maps are not appropriate for carrying out examinations on broadband noise sources. As a result, earlier CROR broadband noise source investigations were only carried out in those frequency bins, which were dominated by a broadband component. Since the interaction tones, blade passing frequencies, and shaft order tones dominate more than half of the investigated 725 frequency bins, in order to examine the broadband components in greater detail, it is advisable to remove the tonal components from the recorded signal. Sree and Stephens have developed a signal pre-processing method,32,33 which removes the tonal components related to the rotational speed, and which will be referred to as Rotational Noise Source (RNS) filtering throughout the text. The pre-processed signal created using RNS Filtering will be referred to as Single Filtered signal throughout the text. In the recorded signal, there is a tonal component that is generated by a non-rotational noise source, which in this case is a deer whistle. This whistle has been used to verify the beamforming maps in the current measurement setup, hence its location has been well defined. Moreover, the non-rotational tonal component can be considered as a validation test case for a tonal noise source, which is not generated by the rotors. For instance, the noise of the fuselage, the wing, or the noise of the wind tunnel. The tonal noise of the non-rotational noise source also has to be removed from the signal in order to investigate the broadband noise sources of given frequency bins. An additional filtering process has been used for removing this component. 25 This filtering process will be referred to as Non-Rotational Noise Source (NRNS) filtering throughout the text, and the output of the entire filtering process will be referred to as Double Filtered signal.
The method used to acquire the Double Filtered signal is based on the subtraction of neighboring segments of the recorded signal of a microphone

Considering the remaining tonal component as a periodic signal, the appropriate segment lengths for the NRNS Filtering can be defined. These new segments will be utilized in removing the undesired non-rotational tonal component from the time signal. The new segment lengths can be defined with the help of the frequency of the NRNS. In determining the segment lengths, one oscillation of the noise source can be considered as one sub-segment. Since the non-rotational noise source frequency is relatively high, a short segment length consisting of one sub-segment would result in significant information loss at lower frequencies, and therefore, to apply NRNS Filtering successfully, the segment length has to be chosen as a multiple of the sub-segment length, while also satisfying other criteria.
25
After defining the NRNS segment length, the Single Filtered segments have to be subdivided into NRNS segments

In earlier studies,25,32,33 one Single Filtered segment has been generated from two segments of the original signal, and one Double Filtered segment has been generated from four segments of the original signal. The filtering process has therefore resulted in a shorter signal than the original signal. In this case, the original signal has a length of 45 s, and the resulting length of the Double Filtered signal would be 9 s. This has been caused by the fact that only the second segment has been subtracted from the first, and then the fourth segment has been subtracted from the third and so on in the case of both the RNS and NRNS Filtering. A completely different signal can be generated using the original signal without the first revolution, which results in the subtraction of the third segment from the second segment and the fifth segment from the fourth segment of the original signal. As a result, a second set of Double Filtered signal can be generated, which is statistically equivalent to the first set of the Double Filtered signal. A longer signal can be generated by combining these two signals, consisting of only the broadband components of the emitted noise. The beamforming results of this further developed Double Filtered signal generated by the new further developed filtering process better resembles the spectrum and the beamforming maps of the original broadband component. As a result, the broadband noise sources can be investigated more precisely along the entire frequency range.
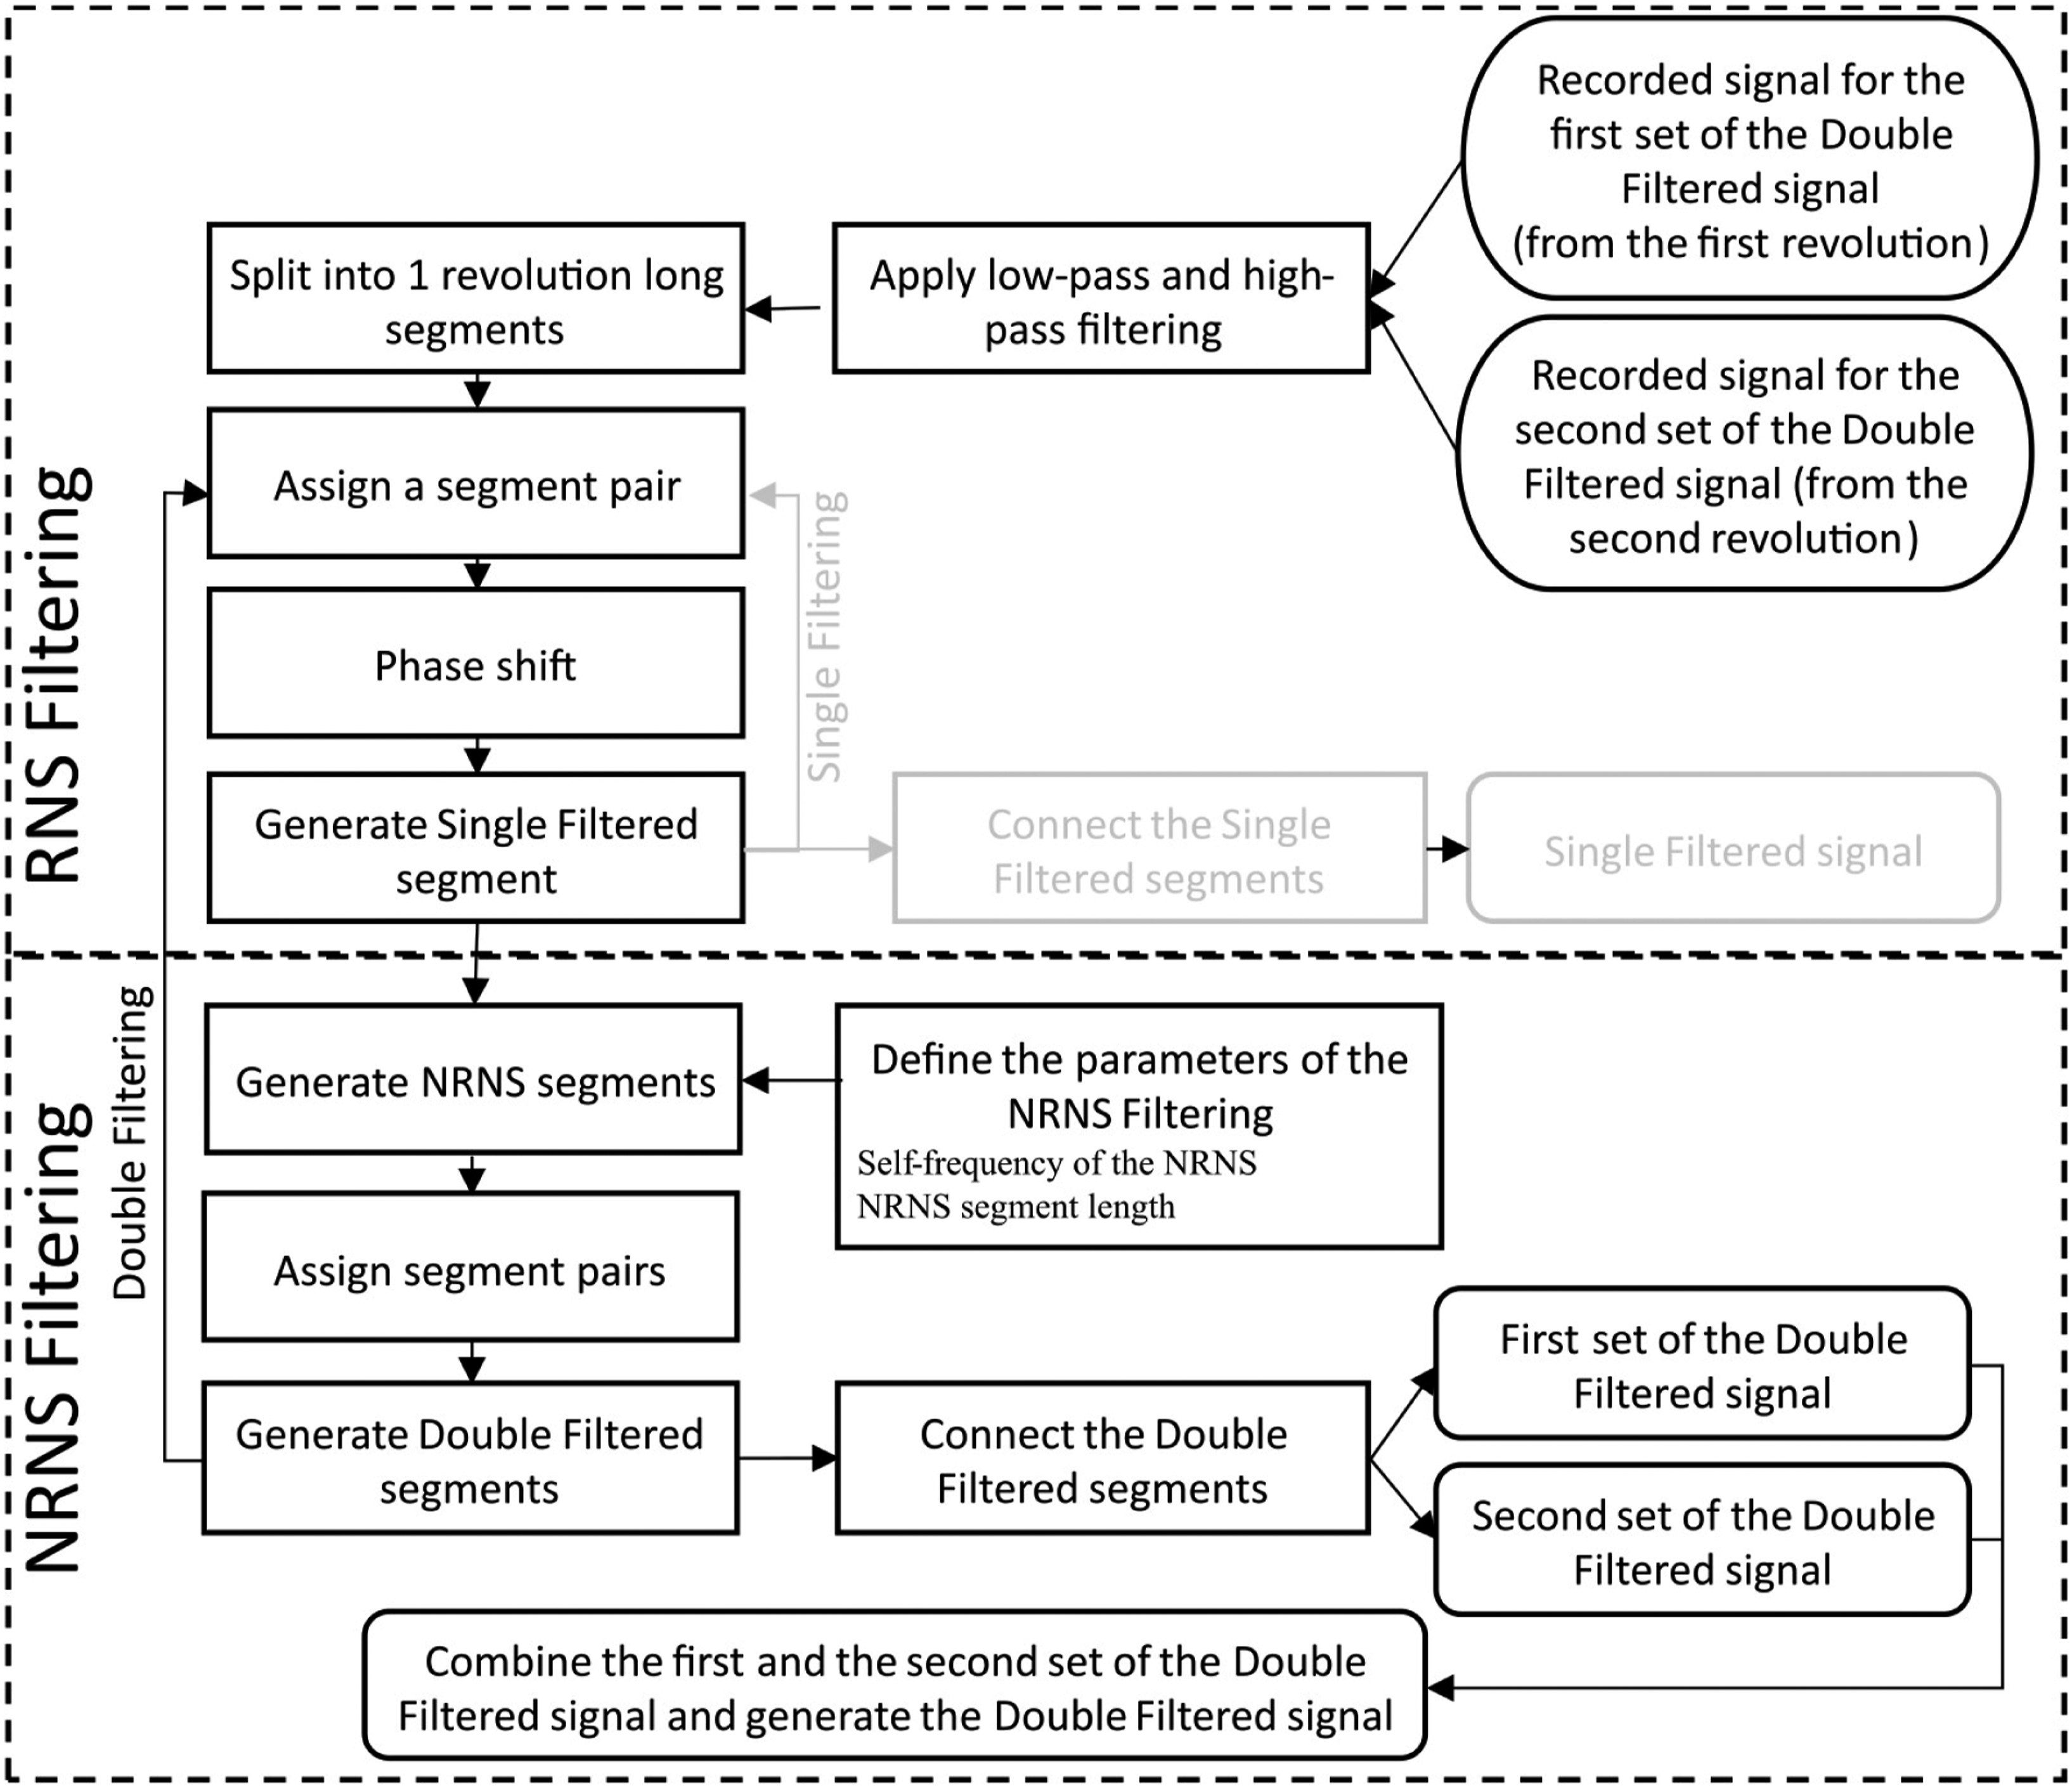
The Double Filtering process can be seen in Figure 3 and consists of the following steps, which are described in greater detail in Ref.25,32,33: 1. Filter the recorded signal below the frequency of 1500 Hz and above the frequency of 20 kHz. 2. Split the recorded signal into one revolution long segments and define segment pairs. 3. Phase shift one of the neighboring segments so that the subtraction can be performed with maximum correlation. Then, perform the subtraction of the segments according to equation (1) to generate a Single Filtered segment. (Repeat step 3 for every segment pair to generate the Single Filtered signal.) 4. Define the parameters of the NRNS Filtering. 5. Split the Single Filtered segment into NRNS segments. 6. Perform the subtraction of the neighboring segments. 7. Repeat steps 3–7 for every segment pair. 8. Connect the generated Double Filtered segment pairs using a Hanning window and generate the first set of the Double Filtered signal. 9. Repeat steps 2–9 using the original signal, starting from the second revolution, and generate the second set of the Double Filtered signal. 10. Connect the first and the second set of the Double Filtered signal to generate the combined Double Filtered signal, referred to as Double Filtered signal in the following. The process of the Double Filtering (from step 1 to step 9).
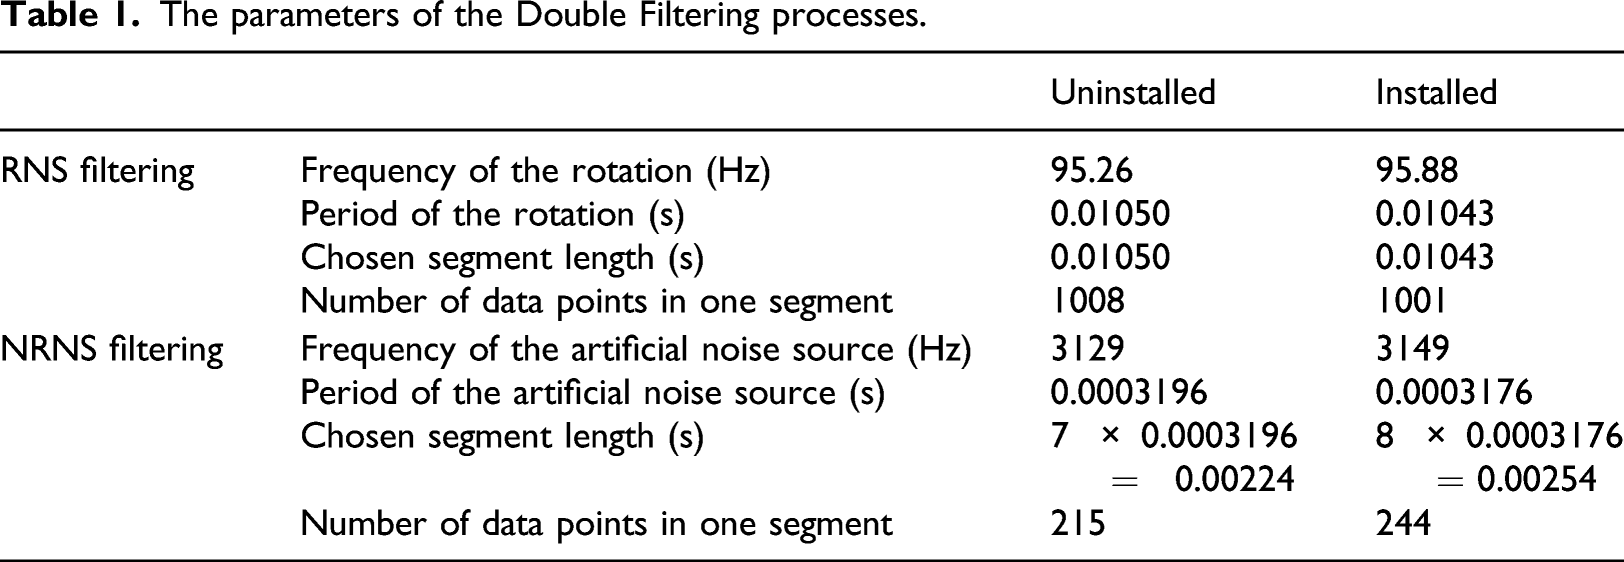
The parameters of the Double Filtering processes.
After the required signal pre-processing steps have been carried out, the data is processed using Delay-and-Sum beamforming in the frequency domain,
37
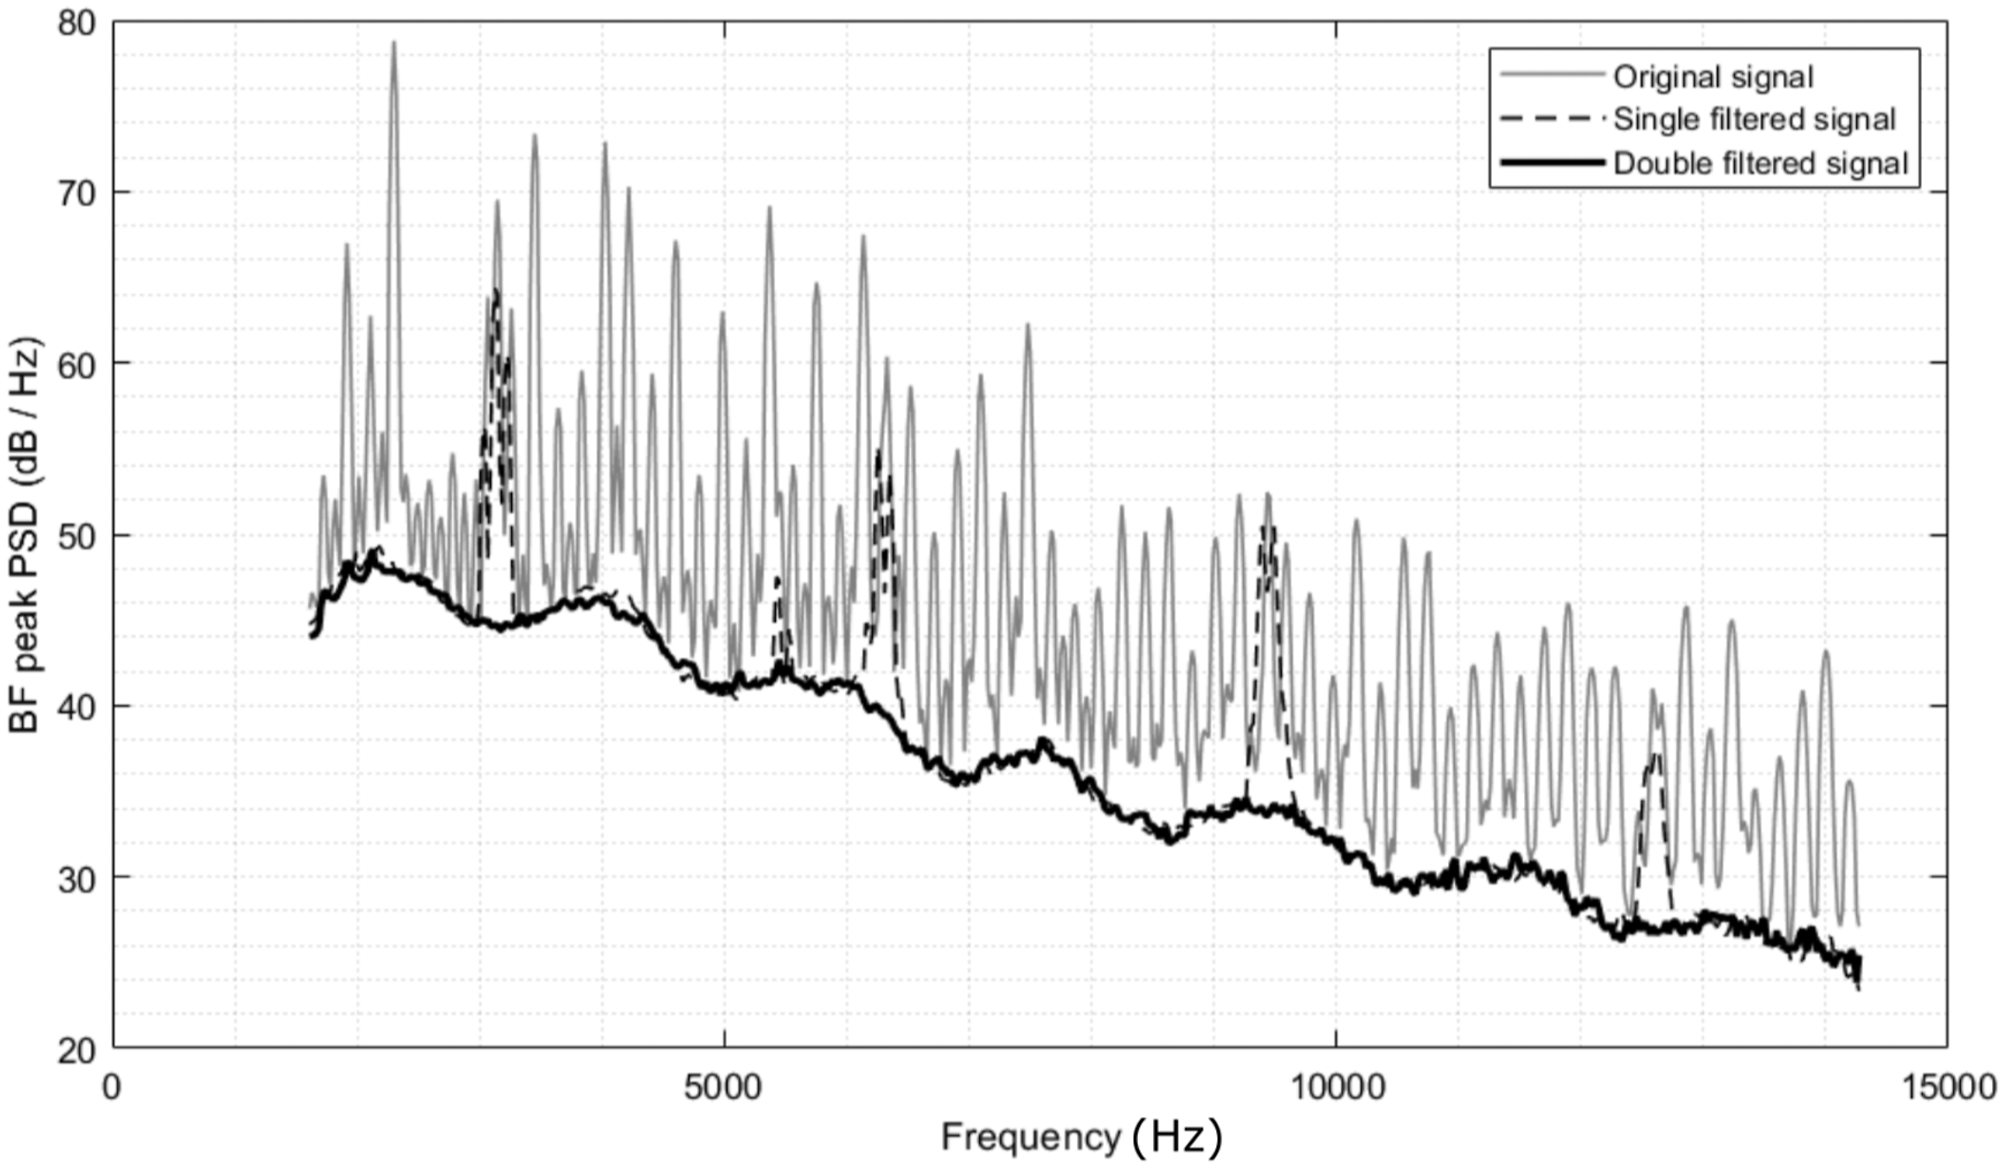
as described in Measurement Setup. Figures 4 and 5 show the BeamForm peak (BFpeak) spectra of the original, the Single Filtered, and the Double Filtered signals of the uninstalled and installed cases, respectively. As a result of the further developed Double Filtering, the spectra of the uninstalled and installed cases are generated from longer Double Filtered signals, 29 s and 33 s, respectively, than was possible with the original Double Filtering method (9 s). The BFpeak levels are the maximum (peak) beamforming levels calculated by the beamforming method for each frequency bin (each beamforming map). The location of this peak shows the location of the most dominant noise source of the investigated frequency bin. The BFpeak Power Spectral Density (PSD) dB/Hz values are used for presenting the spectral results in this article. In Figures 4 and 5, it can be seen that the RNS Filtering removed the rotational tonal components, while the NRNS Filtering removed the non-rotational tonal components, which has provided us with the purely broadband components of the noise of the CROR in both cases, the uninstalled and the installed. The results of the RNS and NRNS Filtering in the case of the uninstalled CROR (without the pylon). The results of the RNS and NRNS Filtering in the case of the installed CROR (with the pylon).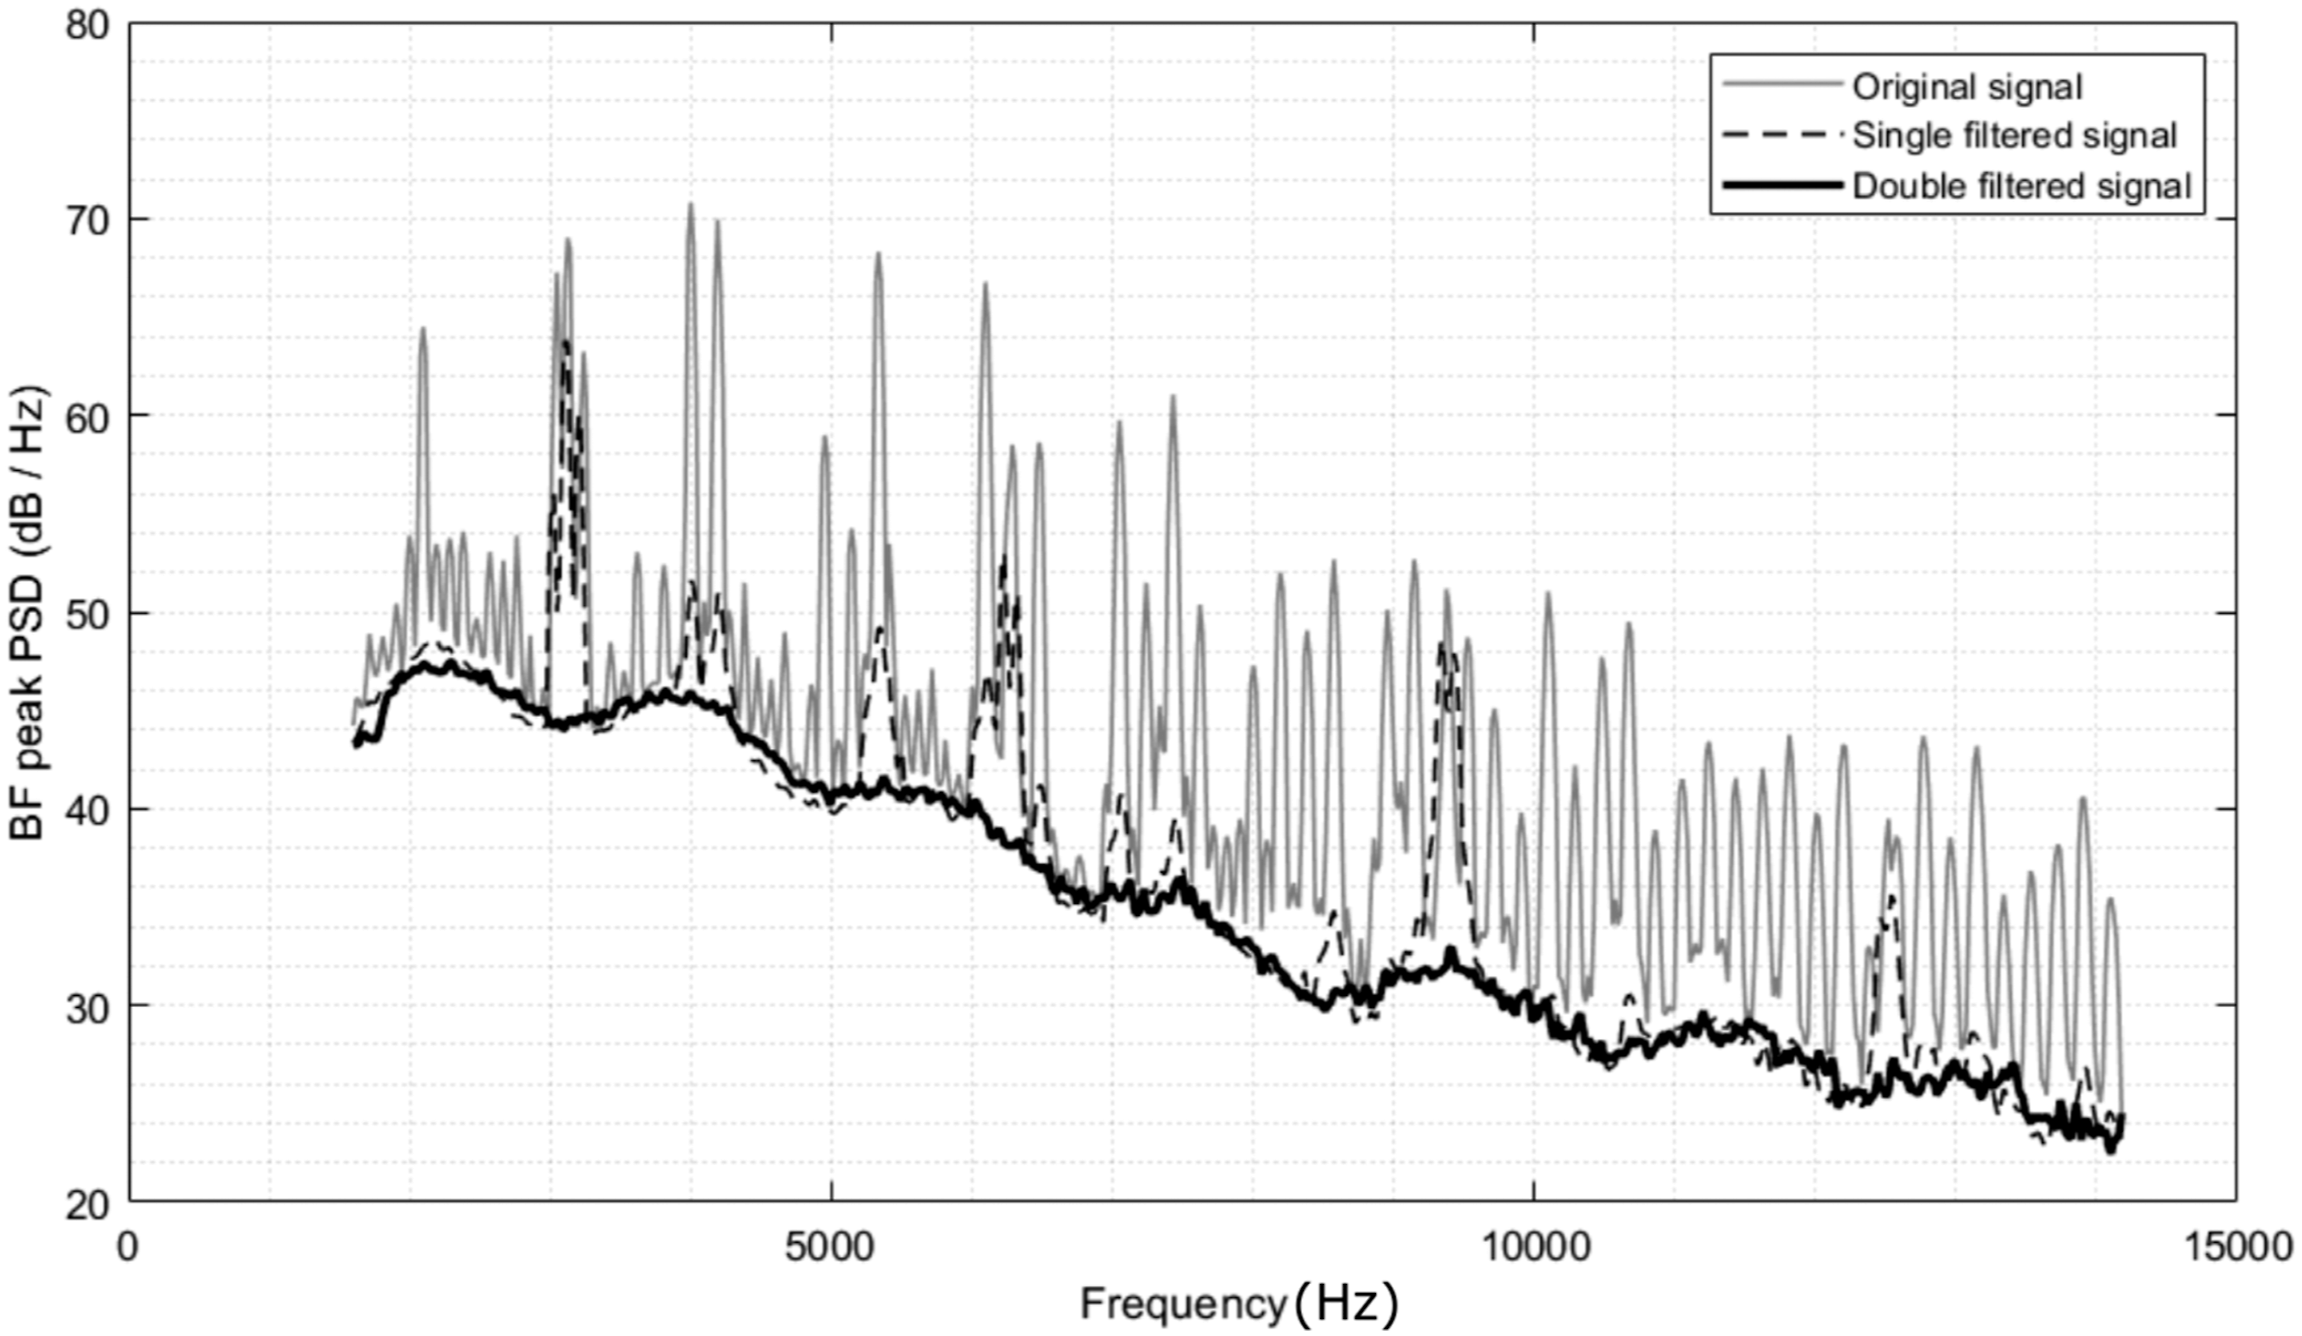
In earlier studies,24,28 our research has shown that there are frequency bins which are dominated by the broadband noise. There is no tonal component in these frequency bins, or they are weaker than the broadband components. The noise sources and noise generation mechanisms of only these frequency bins, which is approximately half of the total number of the investigated frequency bins, could be investigated earlier as the broadband component. In contrast, the new pre-processed spectra have a PSD value for every frequency bin (19.1 Hz resolution) of the investigated frequency range. The beamforming maps contain only localized broadband noise sources. The new Double Filtered spectra do not contain any tonal peaks originating from rotational or non-rotational noise sources.
Signal pre-processing in the case of the installed counter-rotating open rotor with a pylon
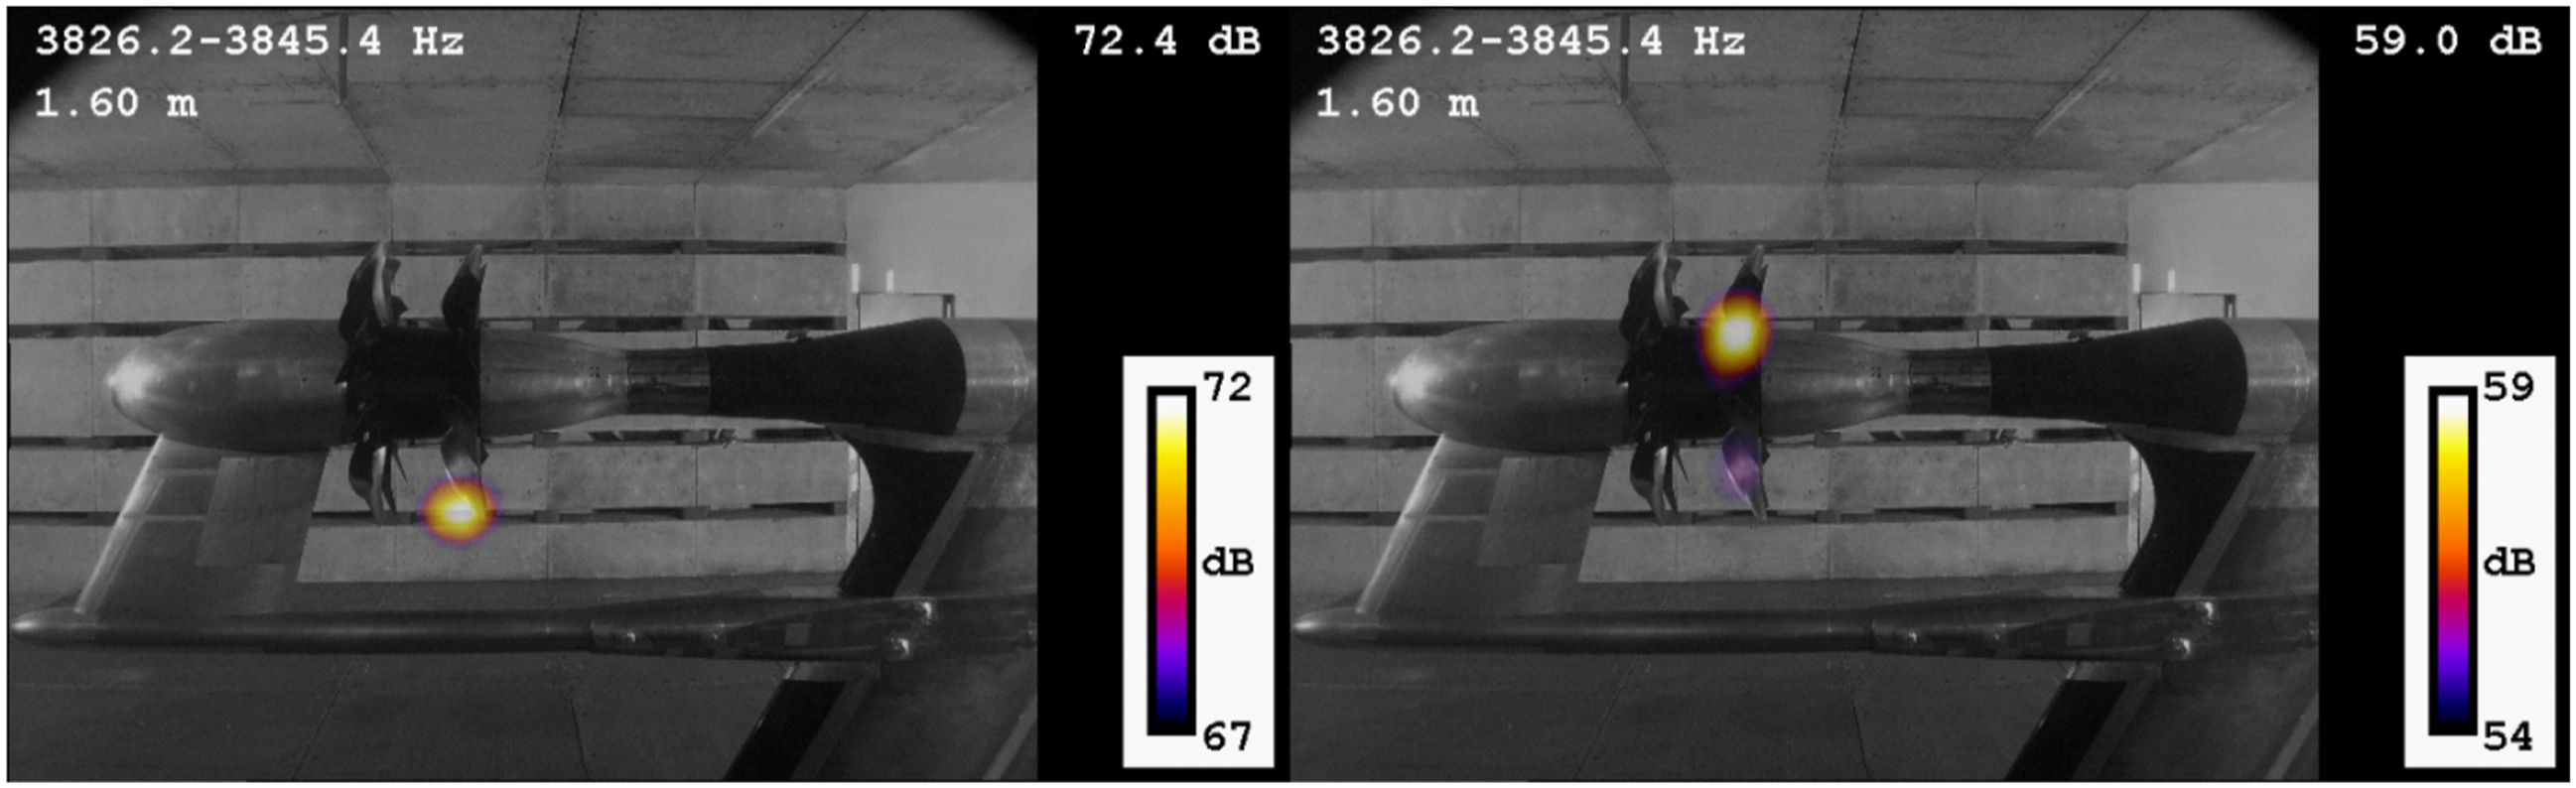
The requirements of the beamforming maps of the Double Filtered signal are the following: remove the RNS localizations, remove the NRNS localizations, do not change the broadband noise source localization, and the newly localized broadband noise sources have to be similar to the localized broadband noise sources of the neighboring segments. The filtering process has removed all tonal noise sources from the signal, the interaction tones, blade passing frequency tones, shaft orders, and the noise of the non-rotational noise source. The Double Filtered signal of the case with the installed pylon has to meet the same requirements. The filtering process has to remove the same tonal components as in the uninstalled case, and it also has to remove the blade-wake interaction tones, which are the most significant noise sources of the installed CROR, but are not present in the uninstalled case. In Figure 5, it can be seen that the Double Filtering process has removed all tonal components from the spectrum. Figures 6 and 7 show the beamforming maps of the original signal and the Double Filtered signal at the forward and the aft rotor’s blade passing frequencies of the installed case. The beamforming maps of a blade-wake interaction noise source of the forward rotor, which is removed by the filtering in the frequency bin 2291.9–2311.1 (left: original signal, right: Double Filtered signal). The beamforming maps of a blade-wake interaction noise source of the aft rotor, which is removed by the filtering in the frequency bin 3826.2–3845.4 (left: original signal, right: Double Filtered signal) color online.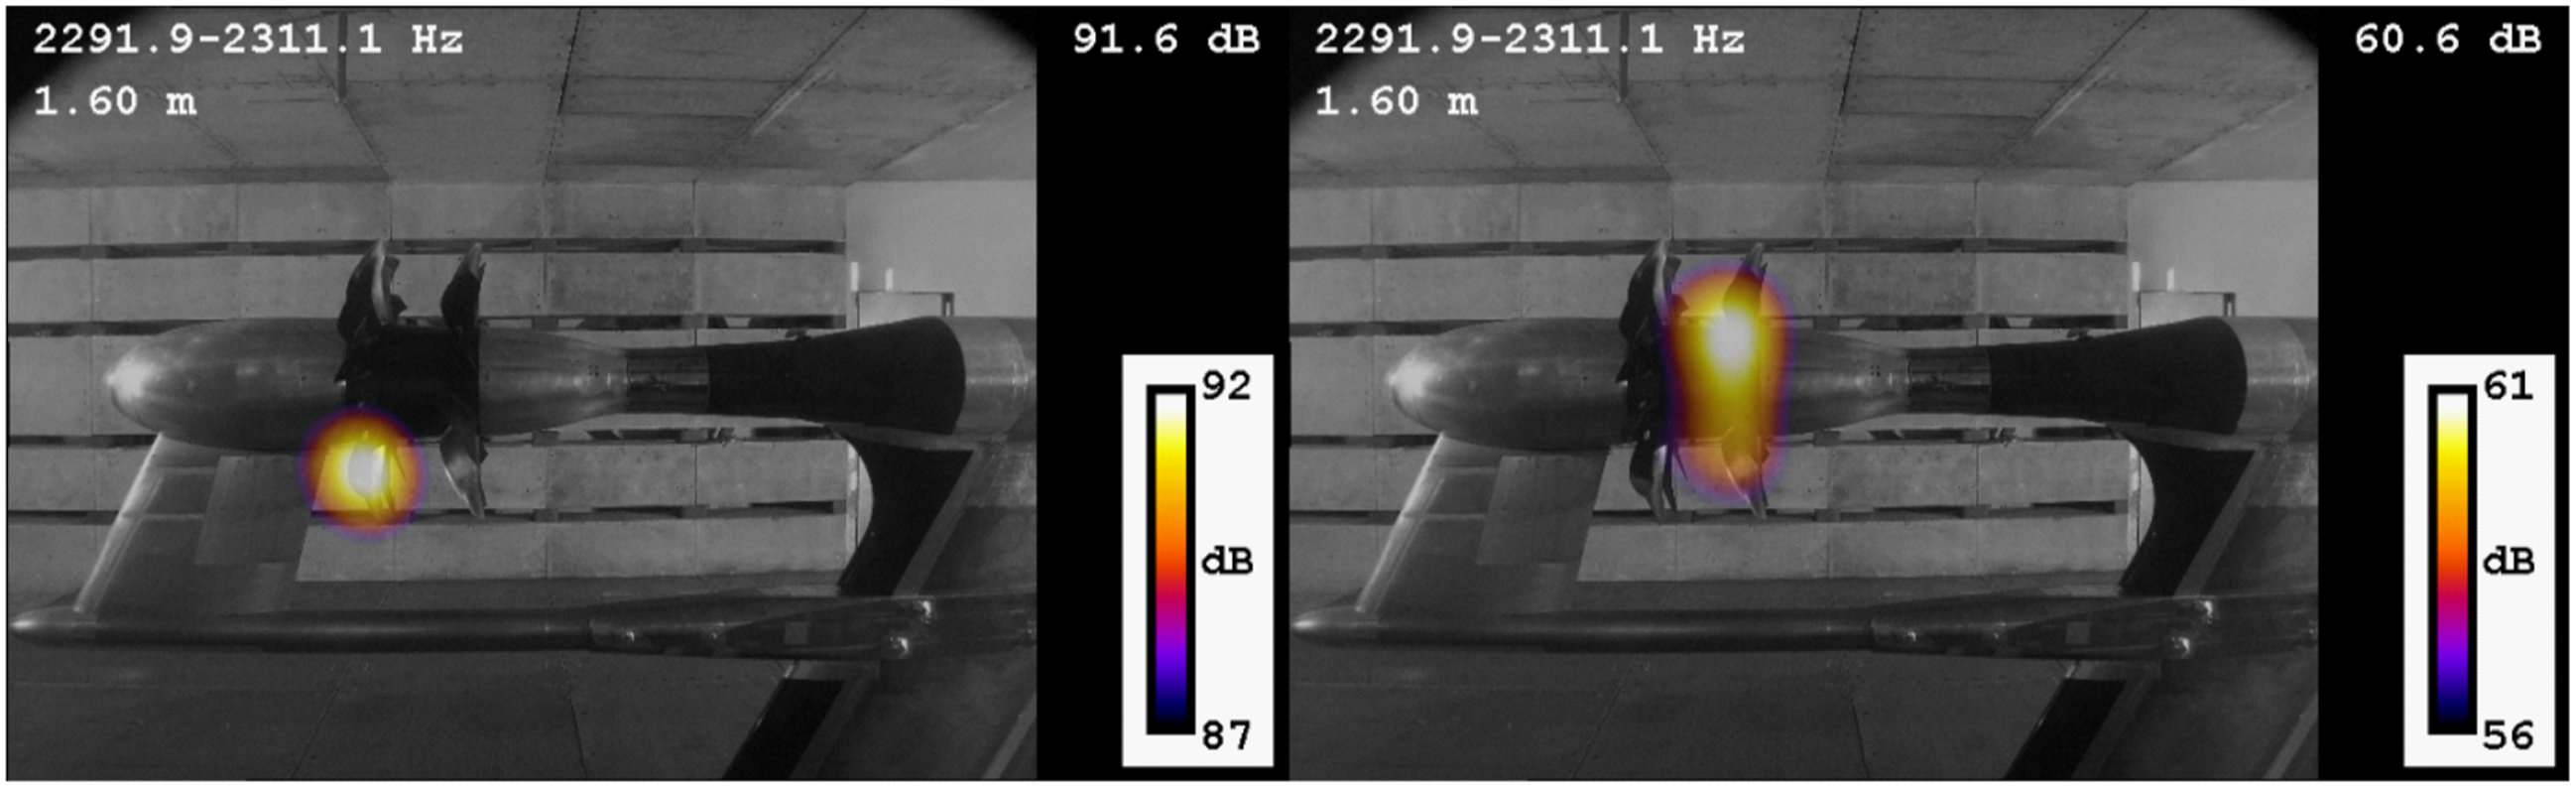
On the left side of Figure 6, a blade-wake interaction noise source can be seen on the forward rotor. The noise generation mechanism of the dominant noise source is the interaction of the rotating forward rotor and the wake of the pylon. 24 On the right side of Figure 6, the Double Filtered signal’s beamforming map can be seen. It can be observed that the blade-wake interaction noise source disappeared from the beamforming map and the newly localized noise source is not the BPF tone of the forward rotor, since it is not localized to the Mach radius. The Double Filtering process removed the entire RNS component from the signal. The Double Filtered signal’s dominant noise source is the broadband component of noise emitted by the installed CROR with pylon. The localized noise source is similar to the dominant noise source of the neighboring segments, therefore it can be stated that this noise source is the broadband noise source of this frequency range.
Figure 7 shows the noise source of the frequency bin of a blade-wake interaction noise source of the aft rotor, 24 in the case of the original signal on the left and the Double Filtered signal on the right. It can be seen that the noise source of the blade-wake interaction is localized onto the aft rotor of the CROR, where the blades interact with the wake of the pylon. This noise source disappears from the beamforming map as a result of the Double Filtering process. On the right side of Figure 7, the localized dominant noise sources are similar to the localized dominant noise sources of the neighboring frequency bins. One of them is localized onto the aft rotor above the shaft, but one weaker localized noise source is present on the aft rotor below the axis. This noise source also appears in the neighboring segments, and its exact location can be associated neither with the location of the blade-wake interaction noise source nor the BPF tones of the aft rotor, therefore it is a broadband noise source of this frequency range.
The Double Filtering removed all categories of RNS and the NRNS components from the recorded signal of the emitted noise of the CROR with an installed pylon. The Double Filtering removed the effect of the blade-wake interaction noise source from the signal, which was not present in the uninstalled case. 25 The broadband component of the Double Filtered signal results in similar beamforming maps to the original broadband component. The application of Double Filtering makes it possible to investigate the broadband noise sources of the CROR with an installed pylon in the entire frequency range without the presence of any tonal component.
Broadband noise sources of counter-rotating open rotor
Pylon’s effect on the broadband noise generation
After applying the filtering process to the measurement data of the uninstalled and the installed cases, the effect of a pylon on the broadband noise generation of a CROR can be observed. In former studies,24,28 this effect was tough to investigate due to the presence of the tonal components. As a result of the spectral results of the broadband component acquired with the sorting method,
24
which have amplitude values only in those frequency bins which were dominated by broadband components, the effect of the pylon was considered minimal.12,24 The spectral results of the Double Filtered signals seem to verify this statement, but the beamforming maps show some hidden and yet uninvestigated features. In Figure 8, the BFpeak values can be seen as a function of frequency using 250 Hz wide frequency bins. The broadband BFpeak spectrum of the uninstalled and installed CROR.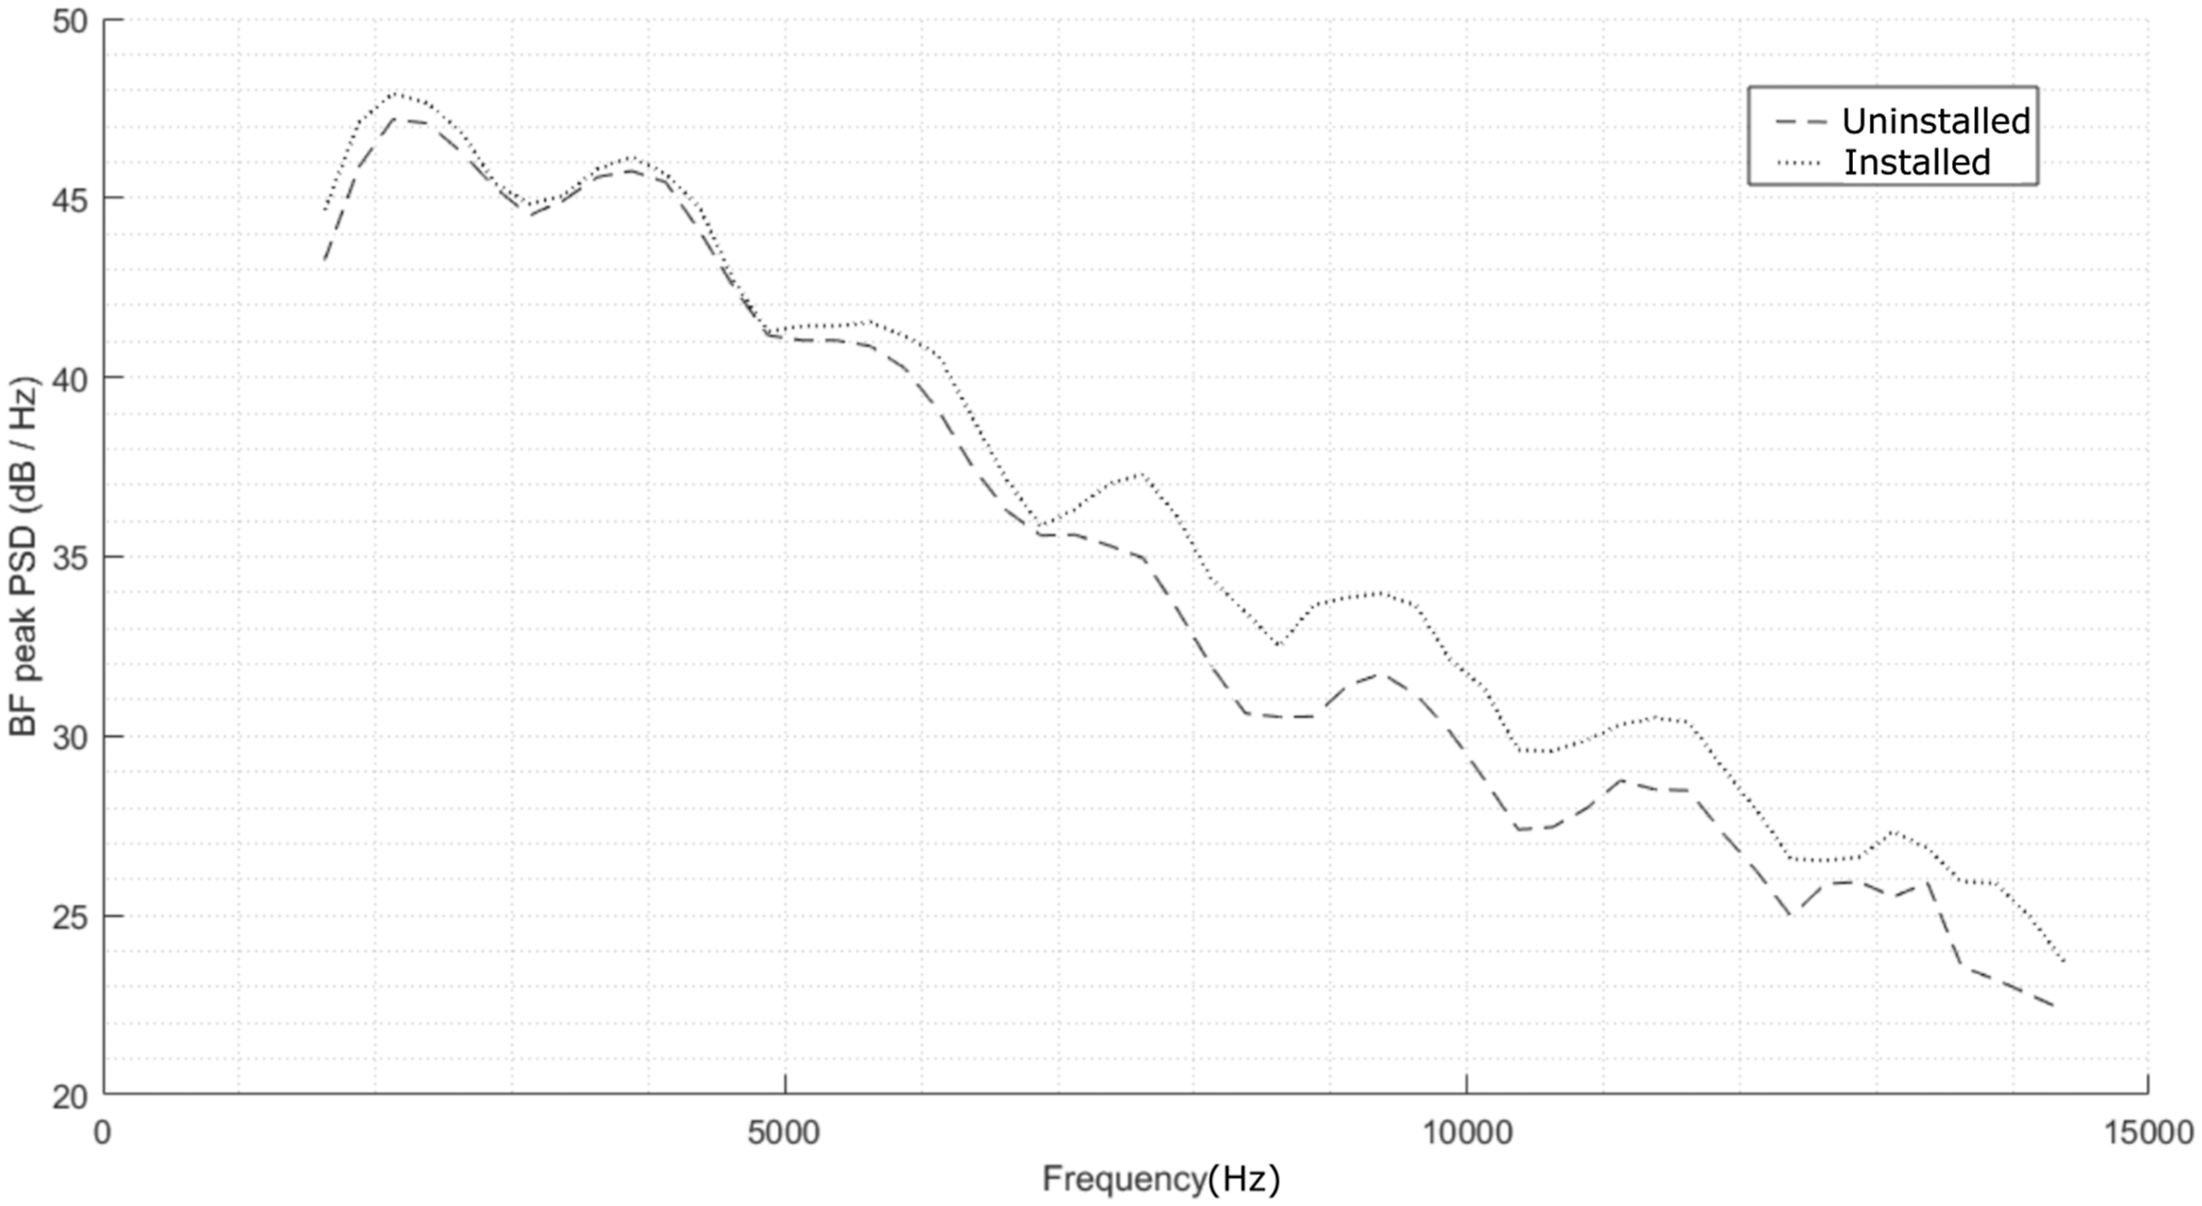
Examining these BFpeak spectra, the effect of the pylon on the broadband noise generation can be observed. Generally, in the investigated frequency range, the noise generation of the installed case is larger, but the amplitude difference depends on the frequency. From 1500 Hz to 3000 Hz, the pylon slightly increases the amplitude of the noise generation (approximately 1 dB). Between 3000 and 5000 Hz, the amplitudes of the installed and uninstalled cases are almost the same (the difference is below 1 dB). From 5000 Hz to 7000 Hz, the difference is around 1 dB. For higher frequencies, above 7000 Hz, the amplitude difference is approximately 2 dB.
Visual inspection of the beamforming maps has made it possible to define broadband noise source locations linked to various broadband noise generation mechanisms. Carrying out separate beamforming calculations on regions of interest that include only specific areas of the beamforming maps, specifically those associated with a given broadband noise generation mechanism, the effect of the pylon on each broadband noise source has been determined separately for each broadband noise generation mechanism. In a first step, the localized noise sources have been categorized according to their locations on the blades, which results in the following categories: blade root noise sources, leading edge noise sources, trailing edge noise sources, and blade tip noise sources. The noise sources have also been categorized according to which rotor they are localized to; therefore, the noise sources have been categorized as forward rotor noise sources and the aft rotor noise sources. The side of the rotor to which the noise sources are localized determines a third categorization possibility. If a noise source has been localized on the side of the rotor which moves toward the observer, it has been considered as being localized on the pressure side of the blade. If a noise source has been localized on the side of the rotor, which moves away from the observer, it has been considered as being localized on the suction side of the blade. It should be noted that this does not imply that the noise sources are only related to the given sides of the blades, but were rather localized on the given sides of the blades on the given beamforming maps. Therefore, a noise source localized above the axis on the forward rotor is called a pressure side noise source, and one localized below the axis on the forward rotor is called a suction side noise source. As a result of the counter-rotation, it is the opposite in the case of the aft rotor. A noise source localized above the axis on the aft rotor is called a suction side noise source, and a noise source localized below the axis on the aft rotor is called a pressure side noise source. In some cases, the noise sources of the pressure and suction sides can be generated by the same noise generation mechanism, which radiates in both of the mentioned directions. The features (amplitude and frequency) of the emitted noise in the two directions can be similar, but are localized separately on the beamforming maps. Therefore, these noise sources are investigated separately in this article, even though they could be generated by the same noise generation mechanism. As a result, the following typical noise sources have been determined in both the uninstalled and installed cases: blade root noise source of the suction side of the aft rotor, blade root noise source of the pressure side of the aft rotor, trailing edge noise source of the pressure side of the forward rotor, leading edge noise source of the suction side of the aft rotor, and leading edge noise source of the pressure side of the aft rotor. In the installed case with a pylon, some additional noise sources have been determined, which are the blade tip noise source of the pressure side of the aft rotor and the trailing edge noise source of the suction side of the forward rotor. The locations of these noise sources can be seen in Figure 9. The locations of defined broadband noise sources of a CROR.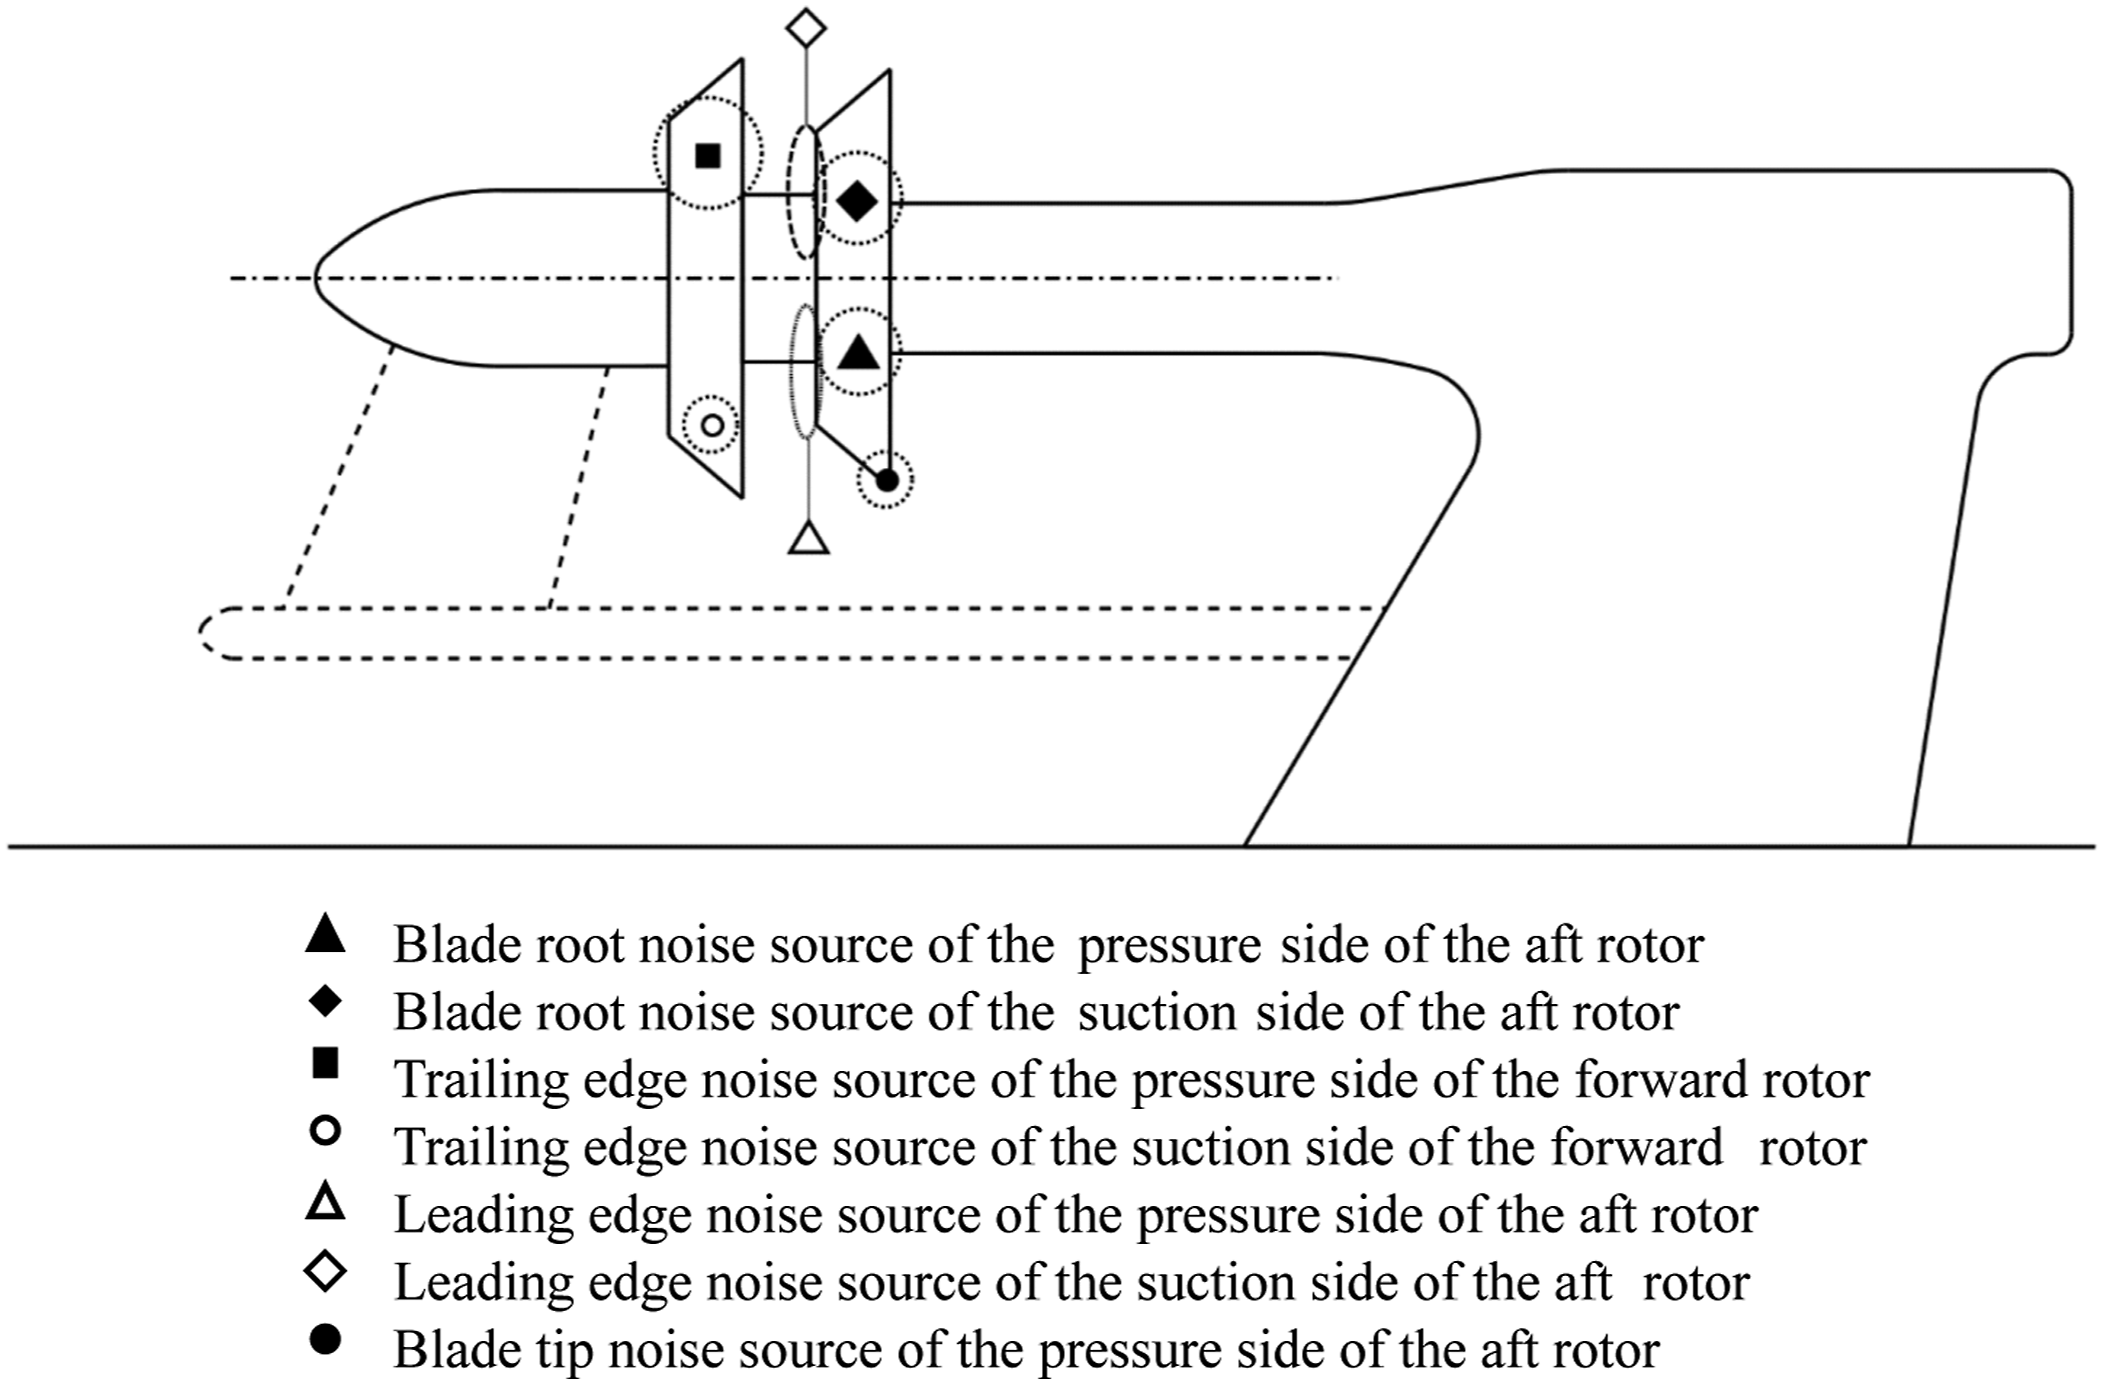
After defining the locations of the typical broadband noise sources, the maximum BFpeak levels for those locations can be collected for each frequency bin by defining regions of interest on which separate beamforming investigations need to be carried out. BFpeak spectra can then be created from these maximum beamforming levels. These spectra of the various noise sources can be investigated separately, and will be presented in the following sections in order to study the various noise sources.
Blade root noise source of the suction side of the aft rotor
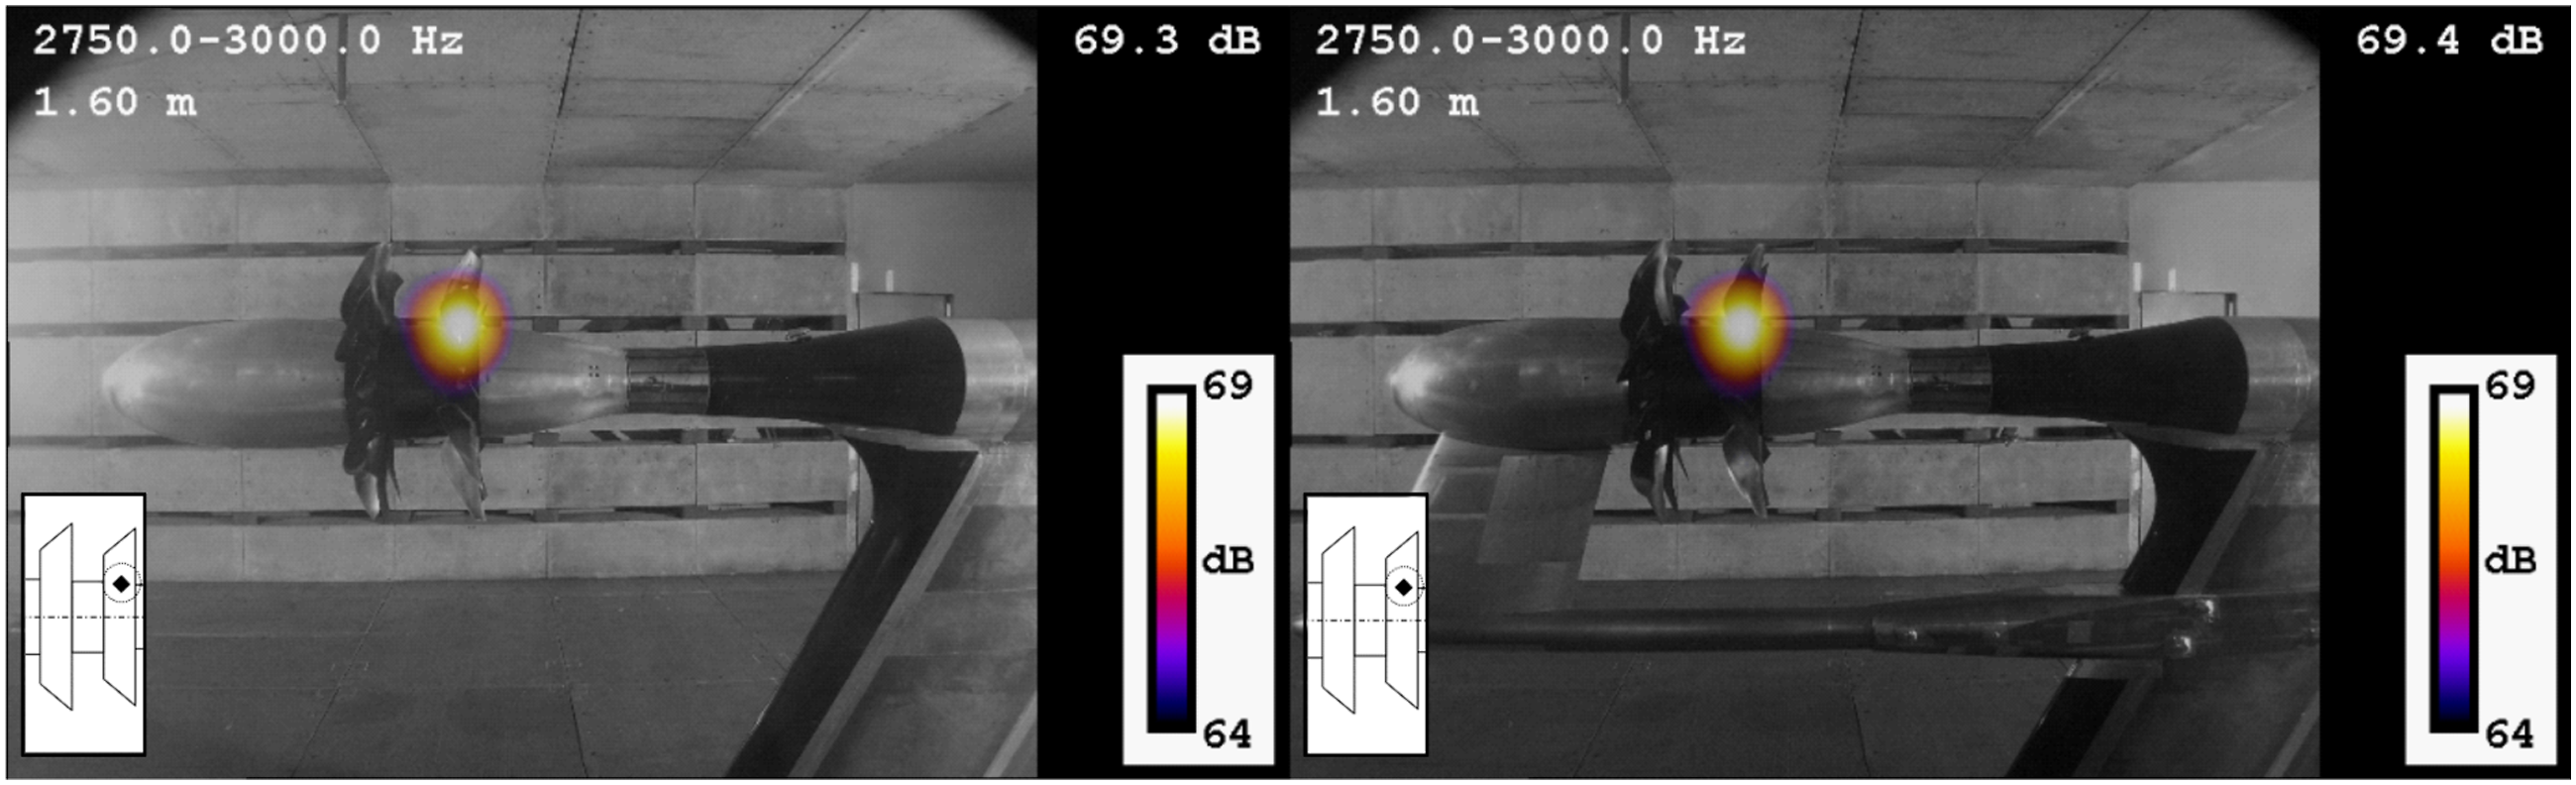
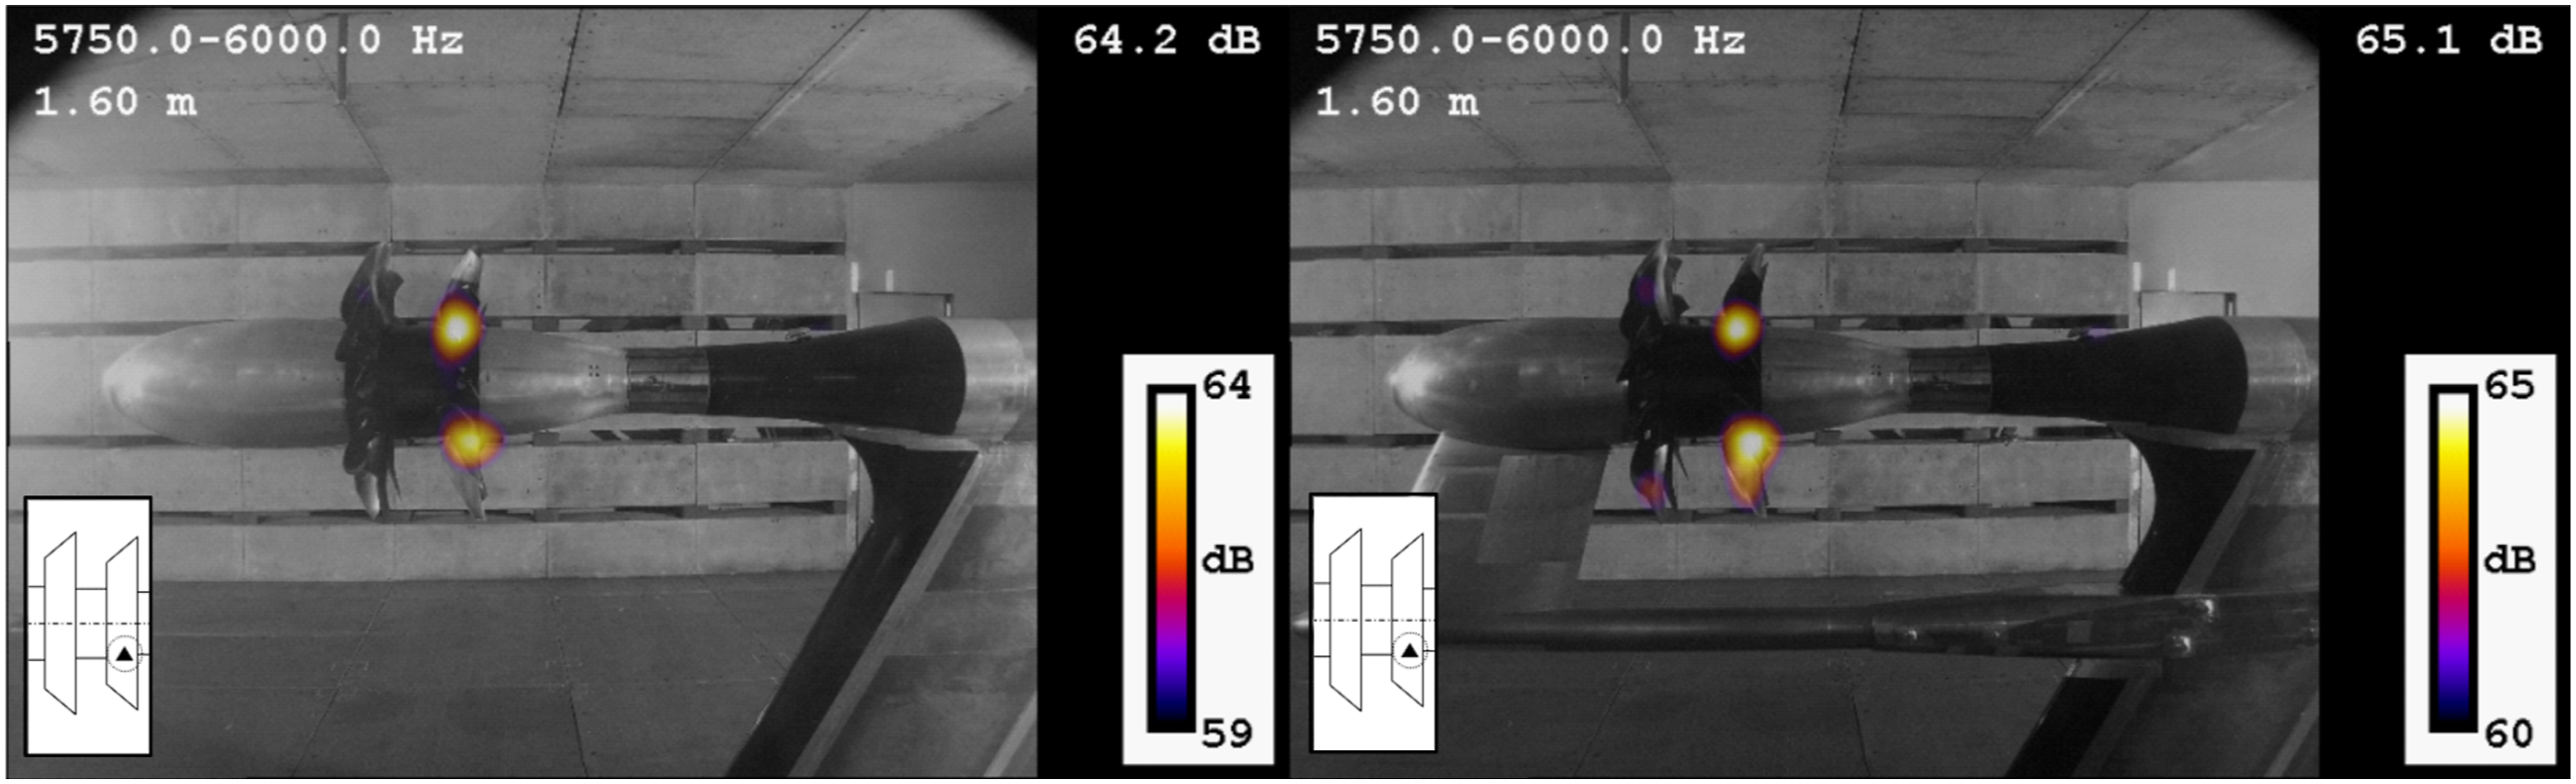
At lower frequencies (below 7000 Hz), the BFpeak spectra of the uninstalled case and the installed case are almost identical. In the first half of the investigated frequency range, 1500–9000 Hz, the most dominant noise source is localized on the suction side of the aft rotor at the root of the blades. According to the literature on the noise sources of the CROR and the beamforming investigations of turbomachinery, these noise sources are referred to as blade root noise sources.41–44 The blade root noise source is generated by the presence of the boundary layer on the shaft of the CROR, which interacts with the rotors, producing flow structures which interact with the shaft or the blade roots of downstream rotors. Numerous noise generation mechanisms can originate from the presence of the boundary layer on the shaft and its interaction with the blade roots. The blade root noise source of the aft rotor’s suction side is the most dominant broadband noise source of the lower frequency range. The BFpeak spectra of this noise source can be seen in Figure 10 and a typical beamforming map of this noise source in Figure 11. In Figure 10 and in the similar figures of the following sections, the BFpeak spectra of the Double Filtered signals of the uninstalled and the installed cases can be seen. In both diagrams, the BFpeak spectrum of the Double Filtered signal of the uninstalled case is shown by a dashed line, and a dotted line shows the BFpeak spectrum of the installed case. On the left diagram, the BFpeak spectrum of the investigated noise source of the uninstalled case can be seen. On the diagram on the right side, the BFpeak spectrum of the investigated noise source of the installed case can be seen. The typical location of the investigated noise source is also shown in the figures. The BFpeak spectrum of the blade root noise source of the suction side of the aft rotor. The beamforming maps of the blade root noise source of the suction side of the aft rotor color online. K. Blade root noise source of the pressure side of the aft rotor.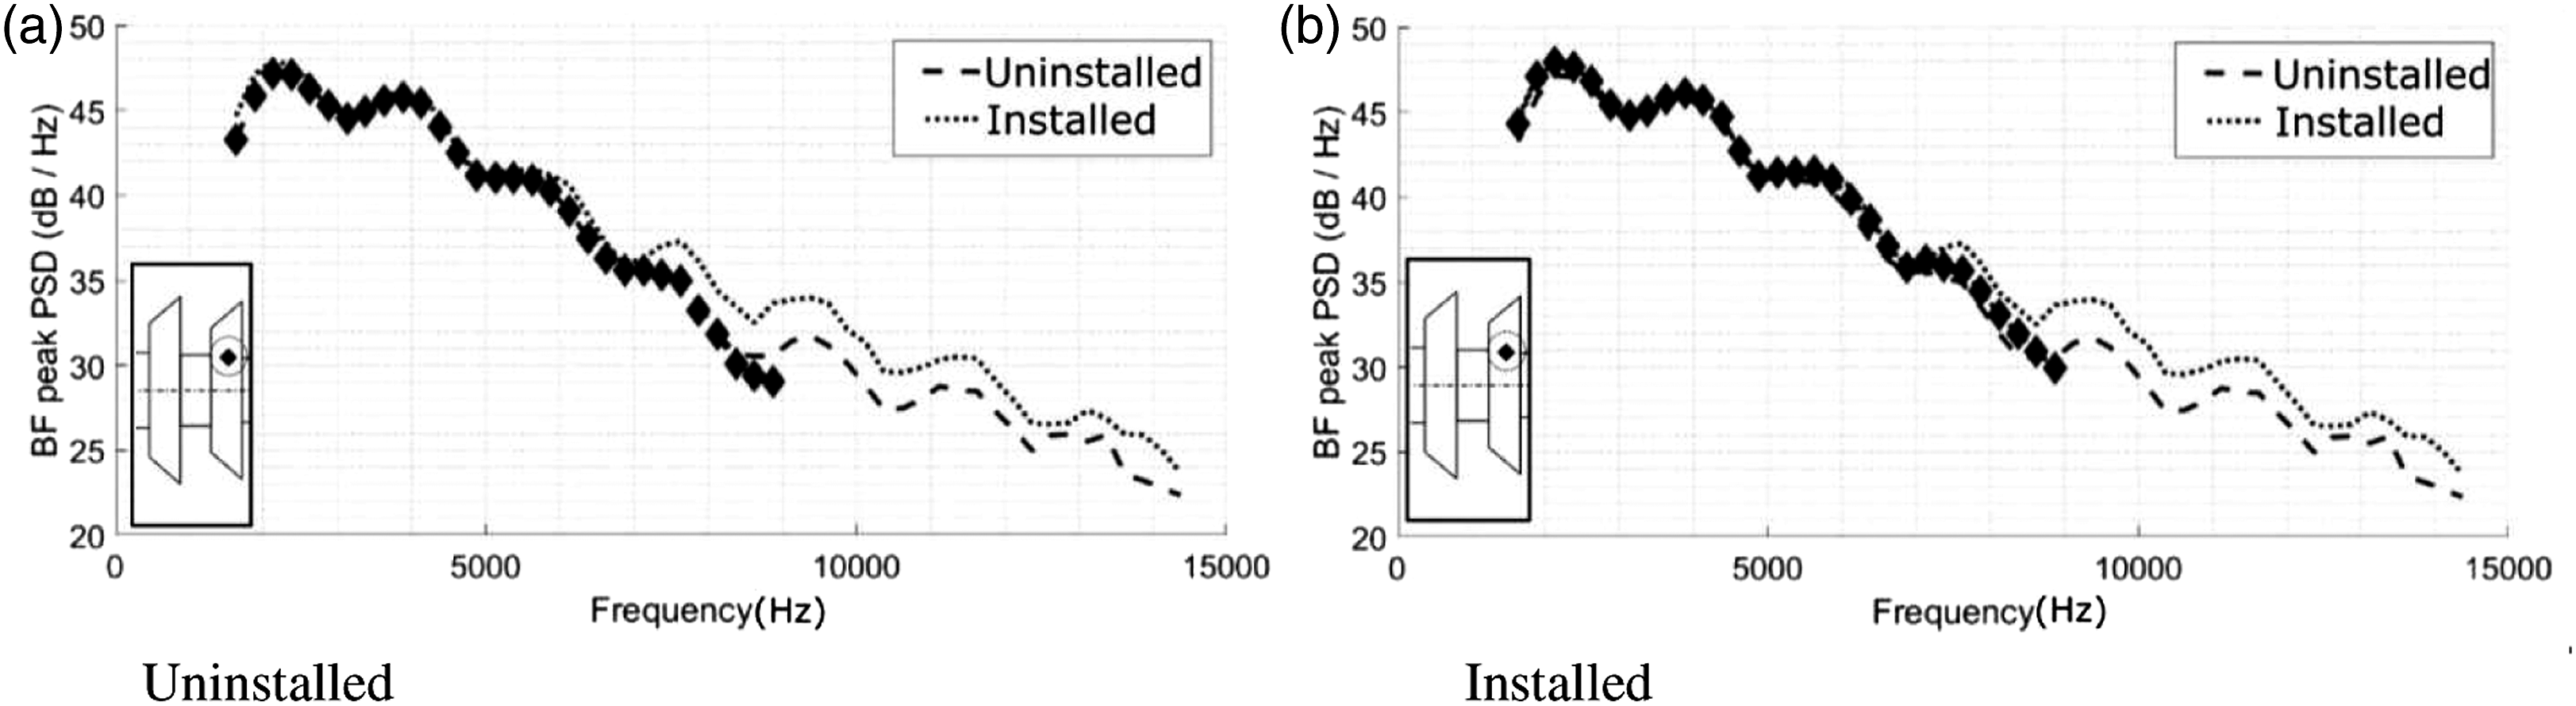
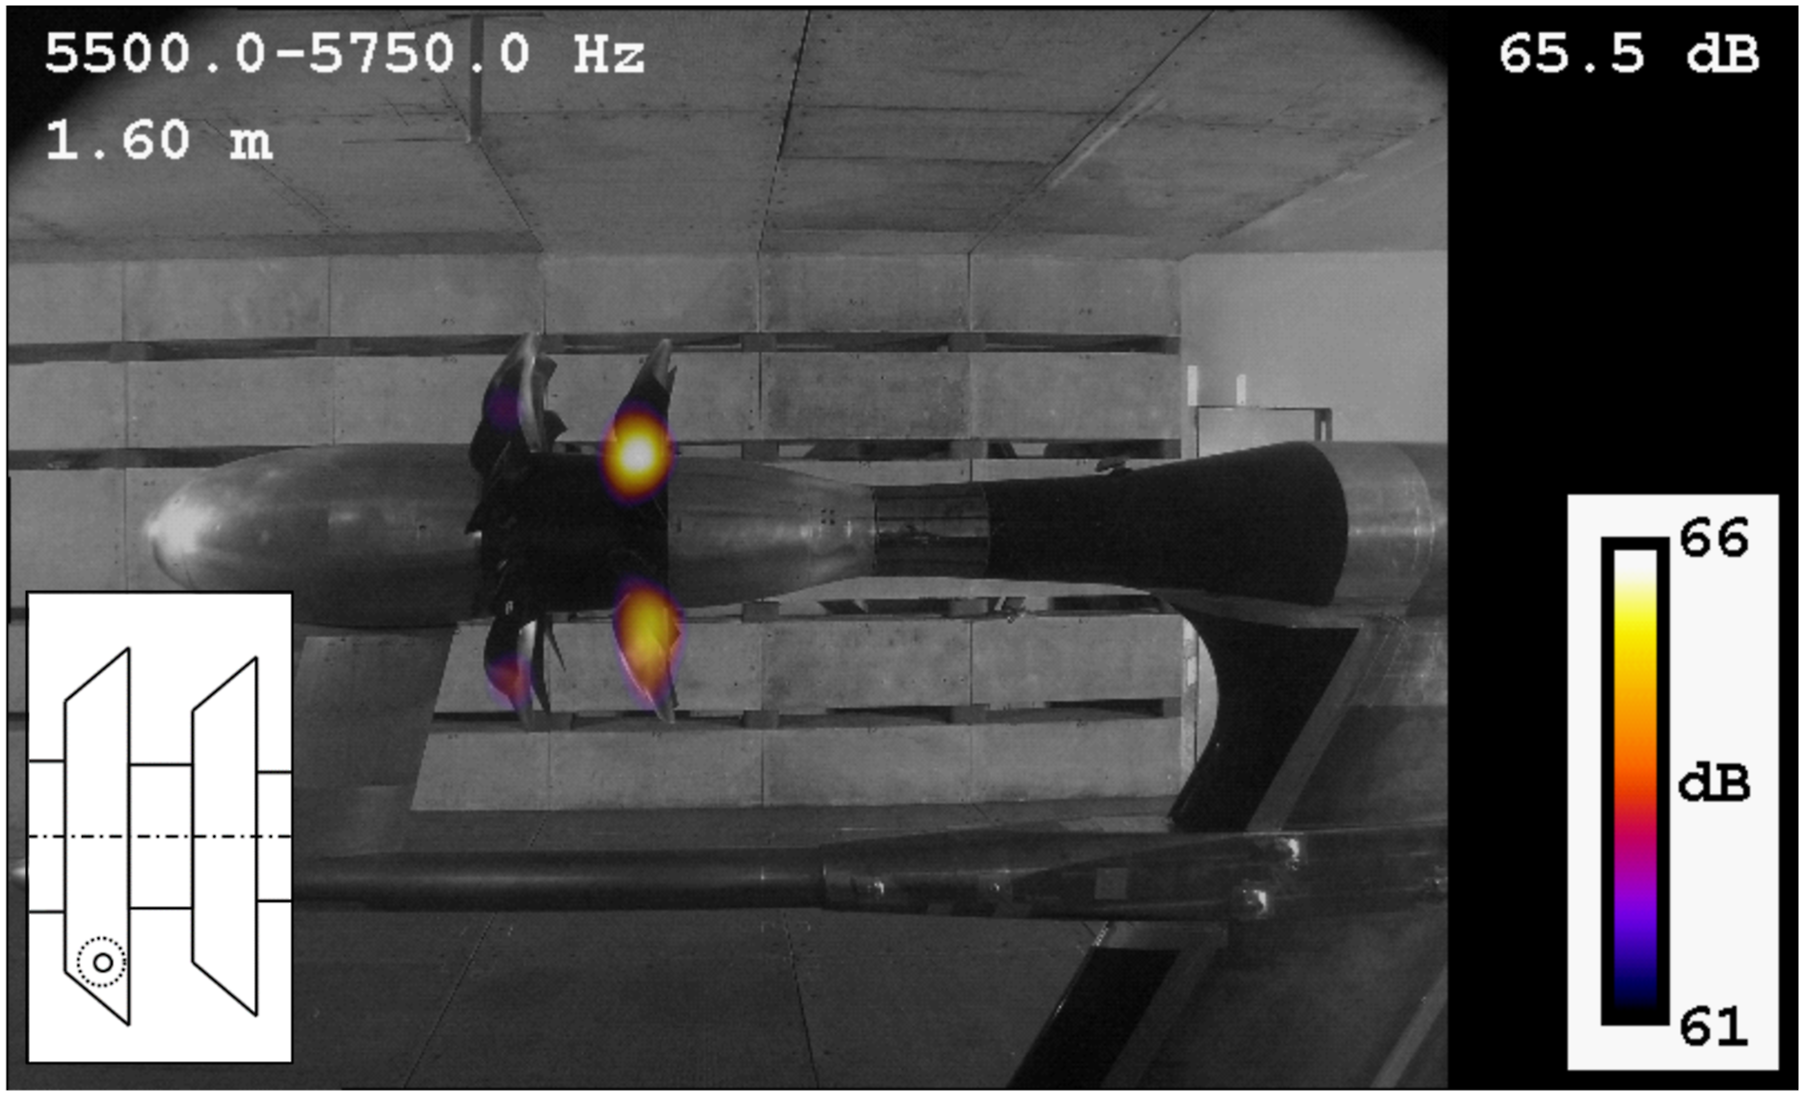
The slight difference at the beginning of the investigated frequency range, 1500–2500 Hz, is caused by a stronger noise source in the installed case. As a result of the altered flow behind the pylon, the noise source at the blade root of the aft rotor on the pressure side has larger amplitude values than without a pylon. The presence of this stronger noise source has increased the amplitude of the emitted noise. Figure 12 shows the BFpeak spectra of this noise source, and Figure 13. Shows the typical noise source localizations on the beamforming maps. As can be seen, the noise source on the aft rotor’s pressure side is weaker in the uninstalled case than in the installed case. The BFpeak spectrum of the blade root noise source of the pressure side of the aft rotor. The beamforming maps of the blade root noise source of the pressure side of the aft rotor color online.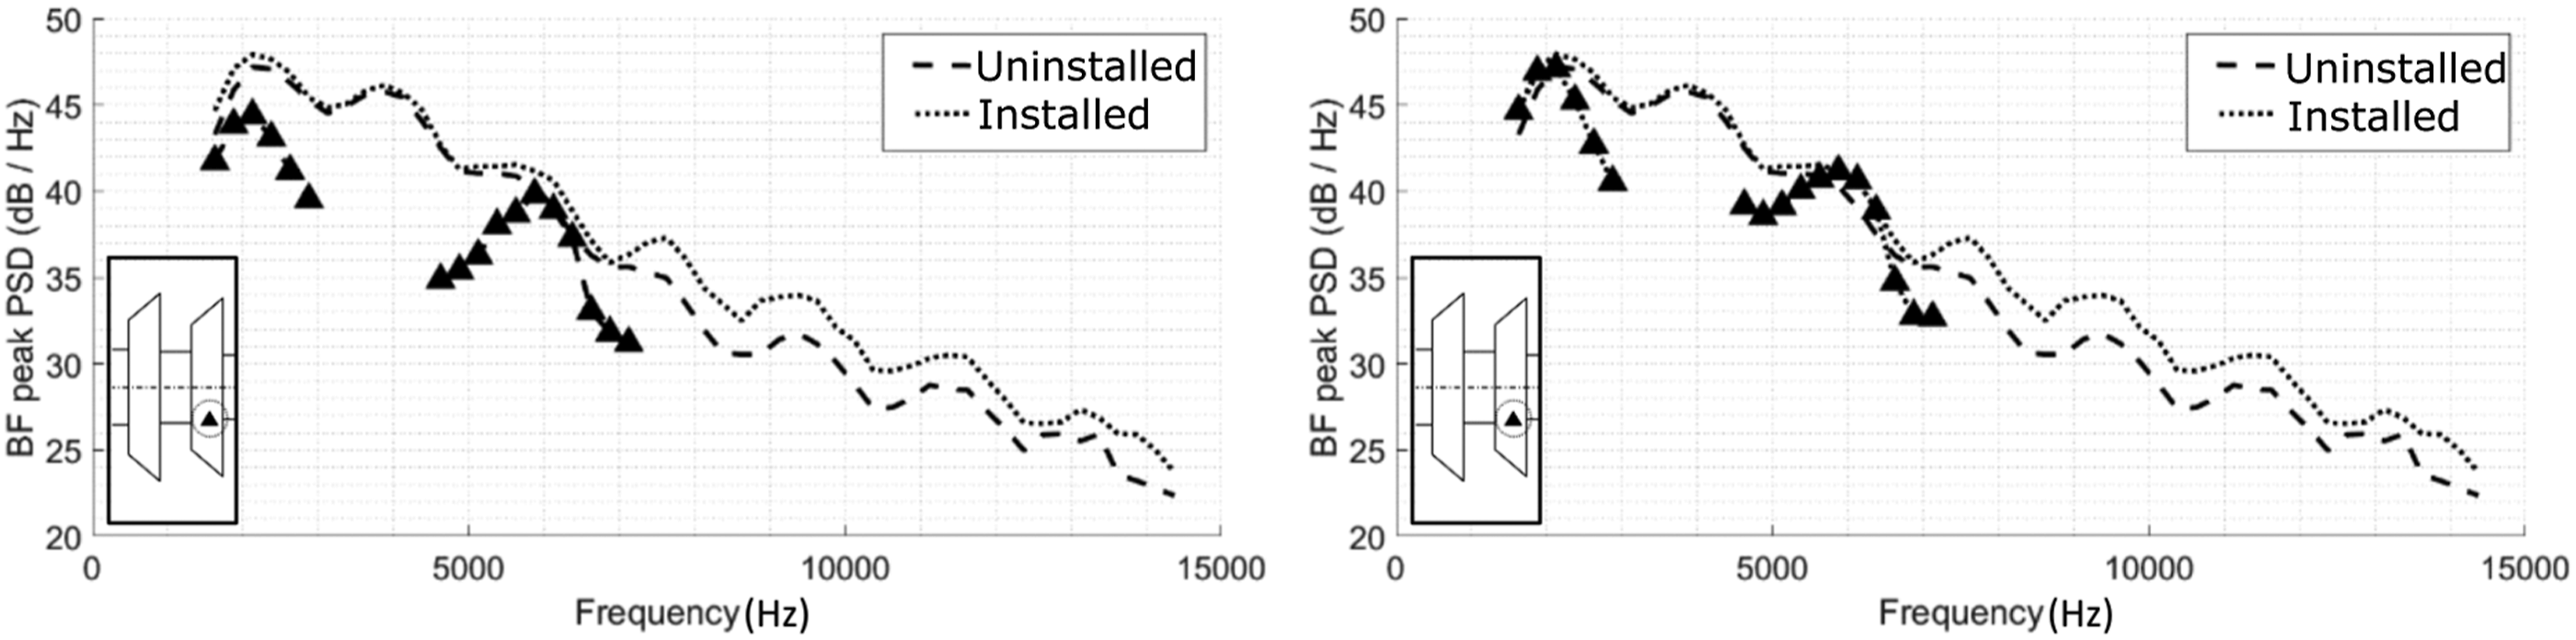
At 5 kHz, the same noise source appears on the pressure side of the aft rotor. In this frequency range, from 5000 to 6500, the blade root’s noise source on the pressure and the suction sides of the aft rotor are dominant and have the same amplitudes in both cases. Thus, between 5000 and 6500 Hz, the blade root’s noise source of the pressure side of the aft rotor is a significant component of the emitted broadband noise of the uninstalled and installed CROR. Although the pylon’s effect can also be seen, as the blade root noise source of the pressure side of the aft rotor is stronger in the installed case, as compared to the uninstalled case.
Trailing edge noise source of the pressure side of the forward rotor
At high frequencies, the most dominant noise source is on the forward rotor’s pressure side in both cases. Figure 14 shows the BFpeak spectra of this noise source, and its beamforming maps can be seen in Figure 15. This noise source is dominant from 6500 Hz to the end of the investigated frequency range, 15 kHz. According to the literature, this noise source can be identified as a trailing edge noise source of the forward rotor blades.42–47 The BFpeak spectrum of the trailing edge noise source of the pressure side of the forward rotor. The beamforming maps of the trailing edge noise source of the pressure side of the forward rotor color online.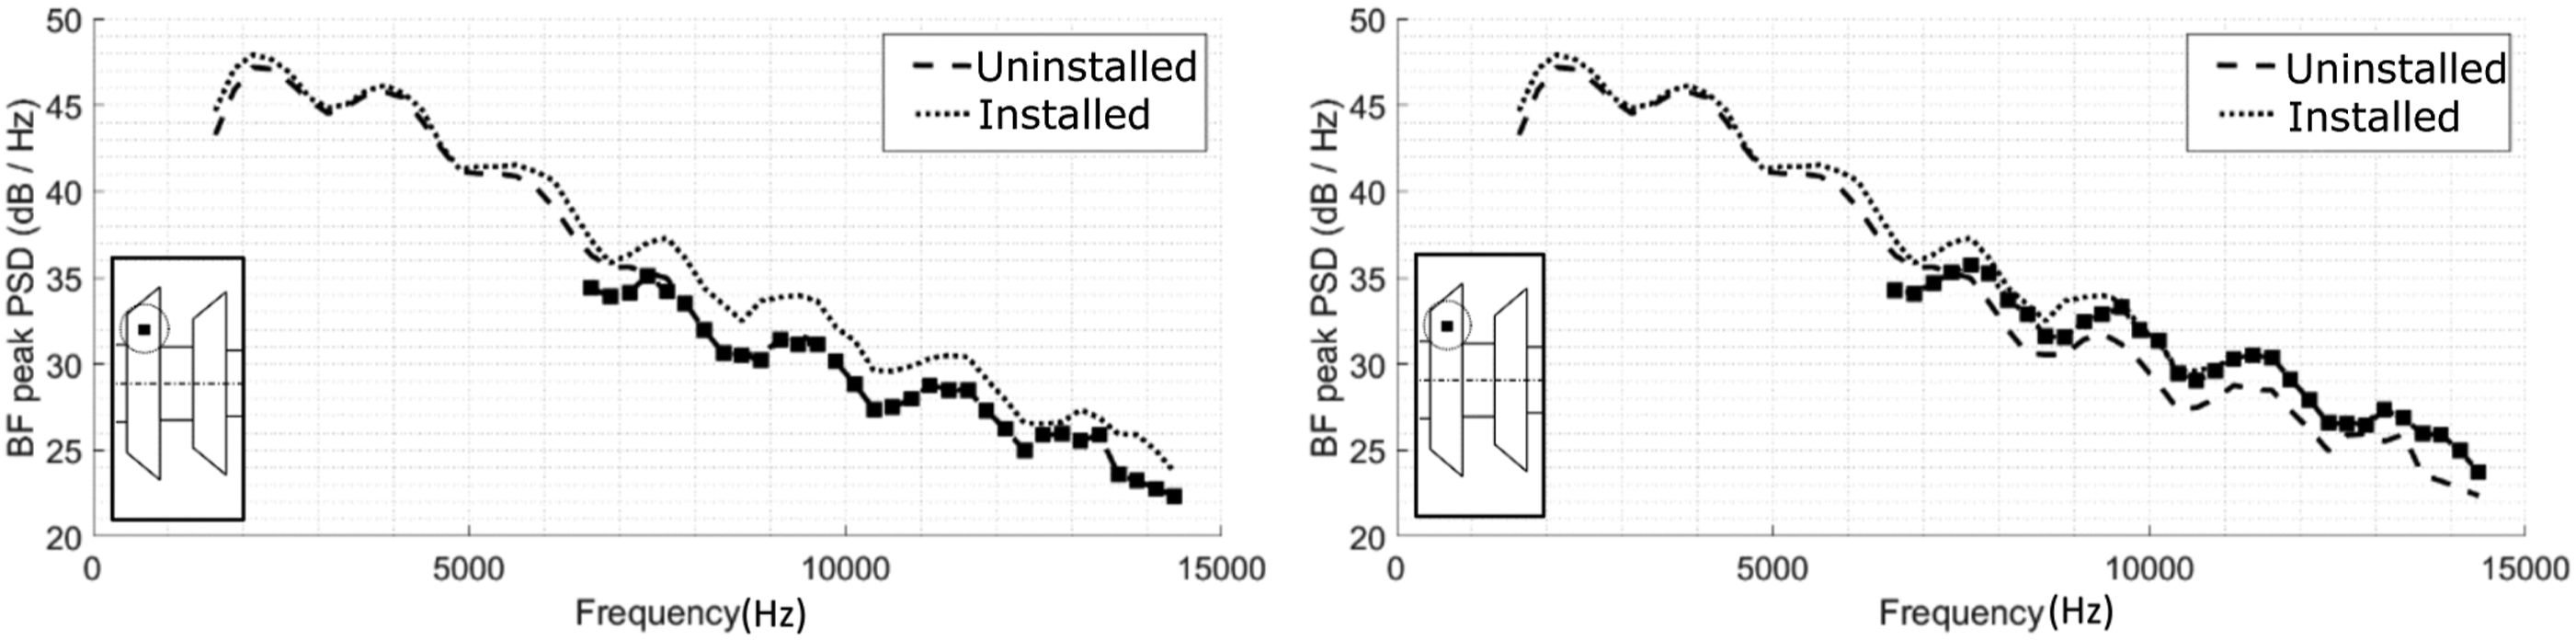
Leading edge noise source of the suction side of the aft rotor
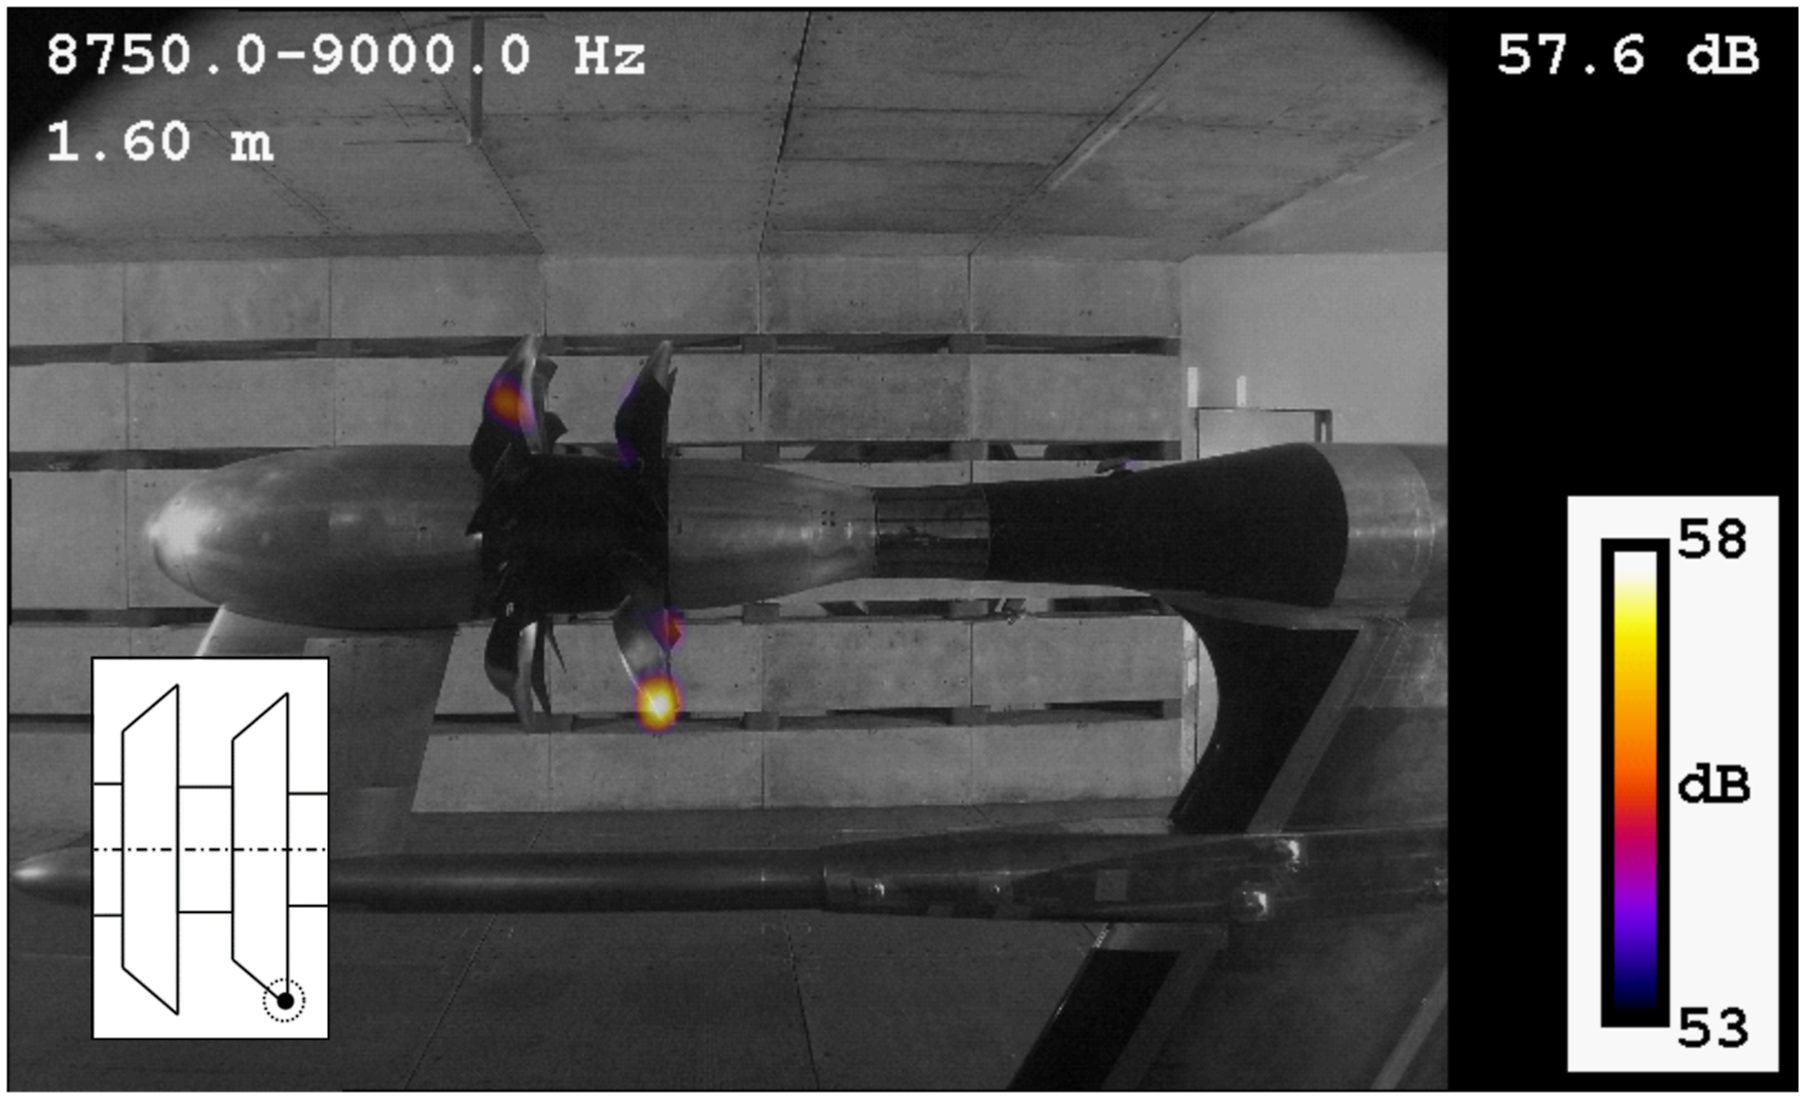
At 7000 Hz, the noise of the leading edge noise source of the aft rotor on the suction side appears in both cases. This noise source is significant till the end of the investigated range, but it is not the most dominant. This noise source is localized onto the leading edge of the aft rotor above the axis, therefore, onto the suction side of the blades. The flow generated by the forward rotor and the pylon interacts with the leading edge of the aft rotor blades and results in a broadband noise source. The BFpeak spectra of this noise source can be seen in Figure 16(a) typical beamforming map with a localized leading edge noise source can be seen in Figure 17. The BFpeak spectrum of the leading edge noise source of the suction side of the aft rotor. The beamforming maps of the leading edge noise source of the suction side of the aft rotor color online. N. Leading edge noise source of the pressure side of the aft rotor.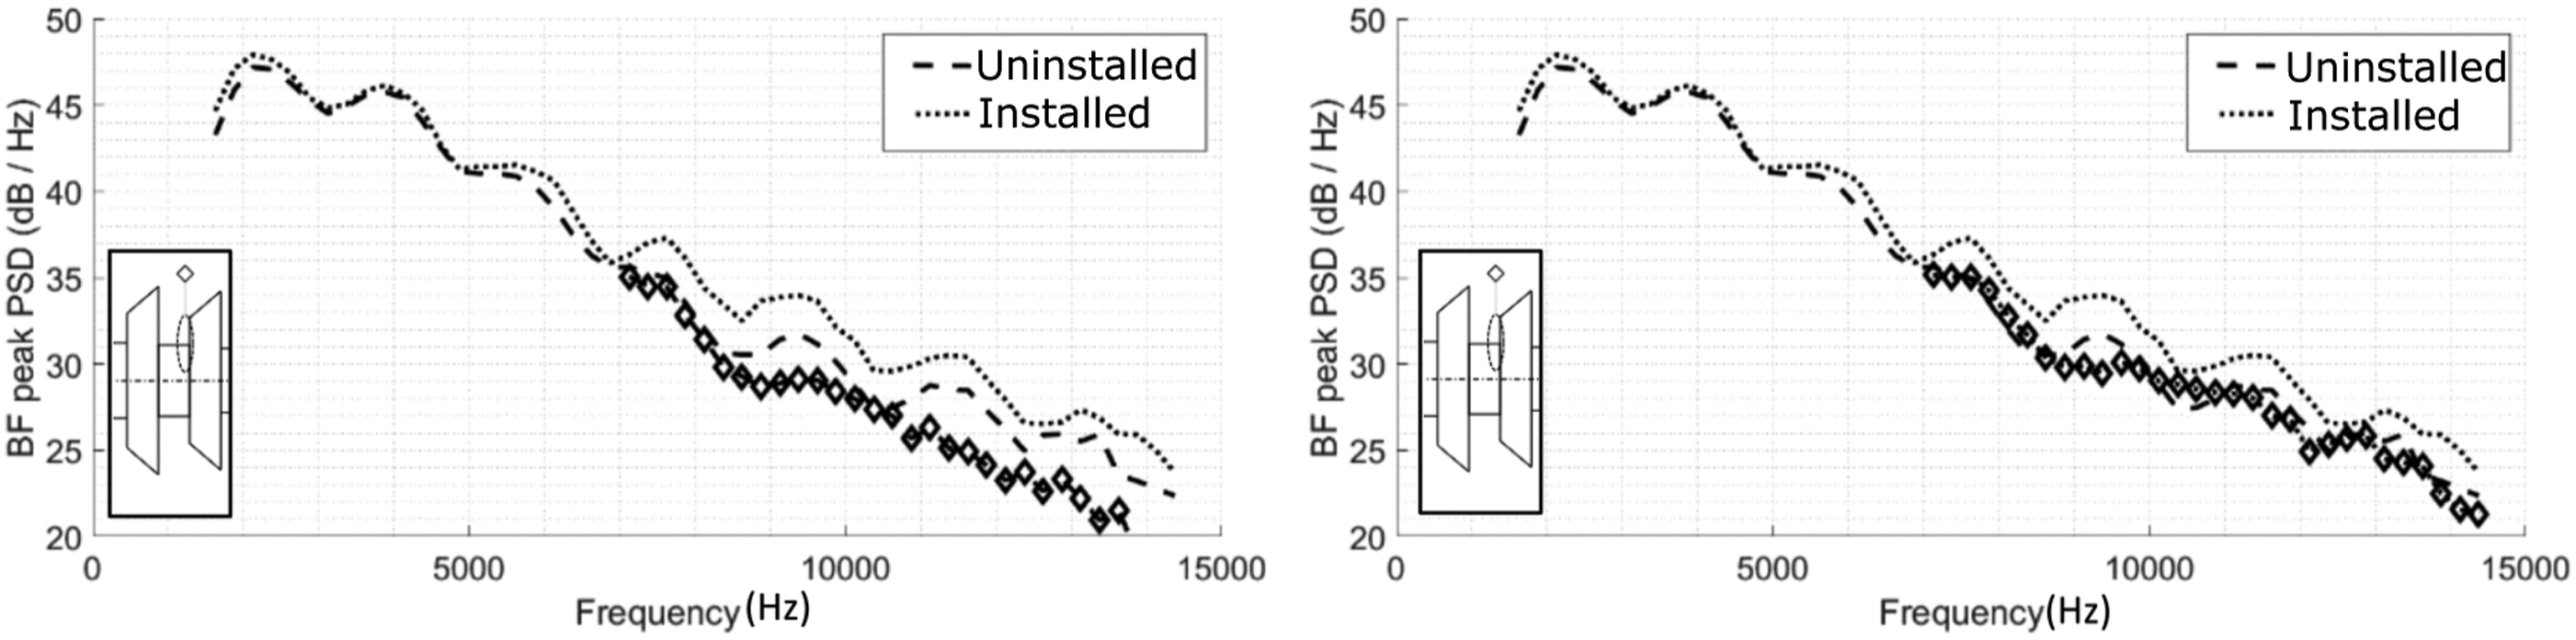

Above 7000 Hz, the leading edge noise of the aft rotor also appears on the pressure side, and is a significant noise source till the end of the investigated frequency range in both cases. The generation mechanism is similar to the leading edge noise source of the aft rotor’s suction side, the flow generated by the forward rotor and the pylon interacts with the leading edge of the aft rotor’s blades. In Figure 18, the BFpeak spectra, and in Figure 19, the beamforming maps of this noise source can be seen in the case of the uninstalled and the installed CROR. The BFpeak spectrum of the leading edge noise source of the pressure side of the aft rotor. The beamforming maps of the leading edge noise source of the pressure side of the aft rotor color online. O. Blade tip noise source of the pressure side of the aft rotor.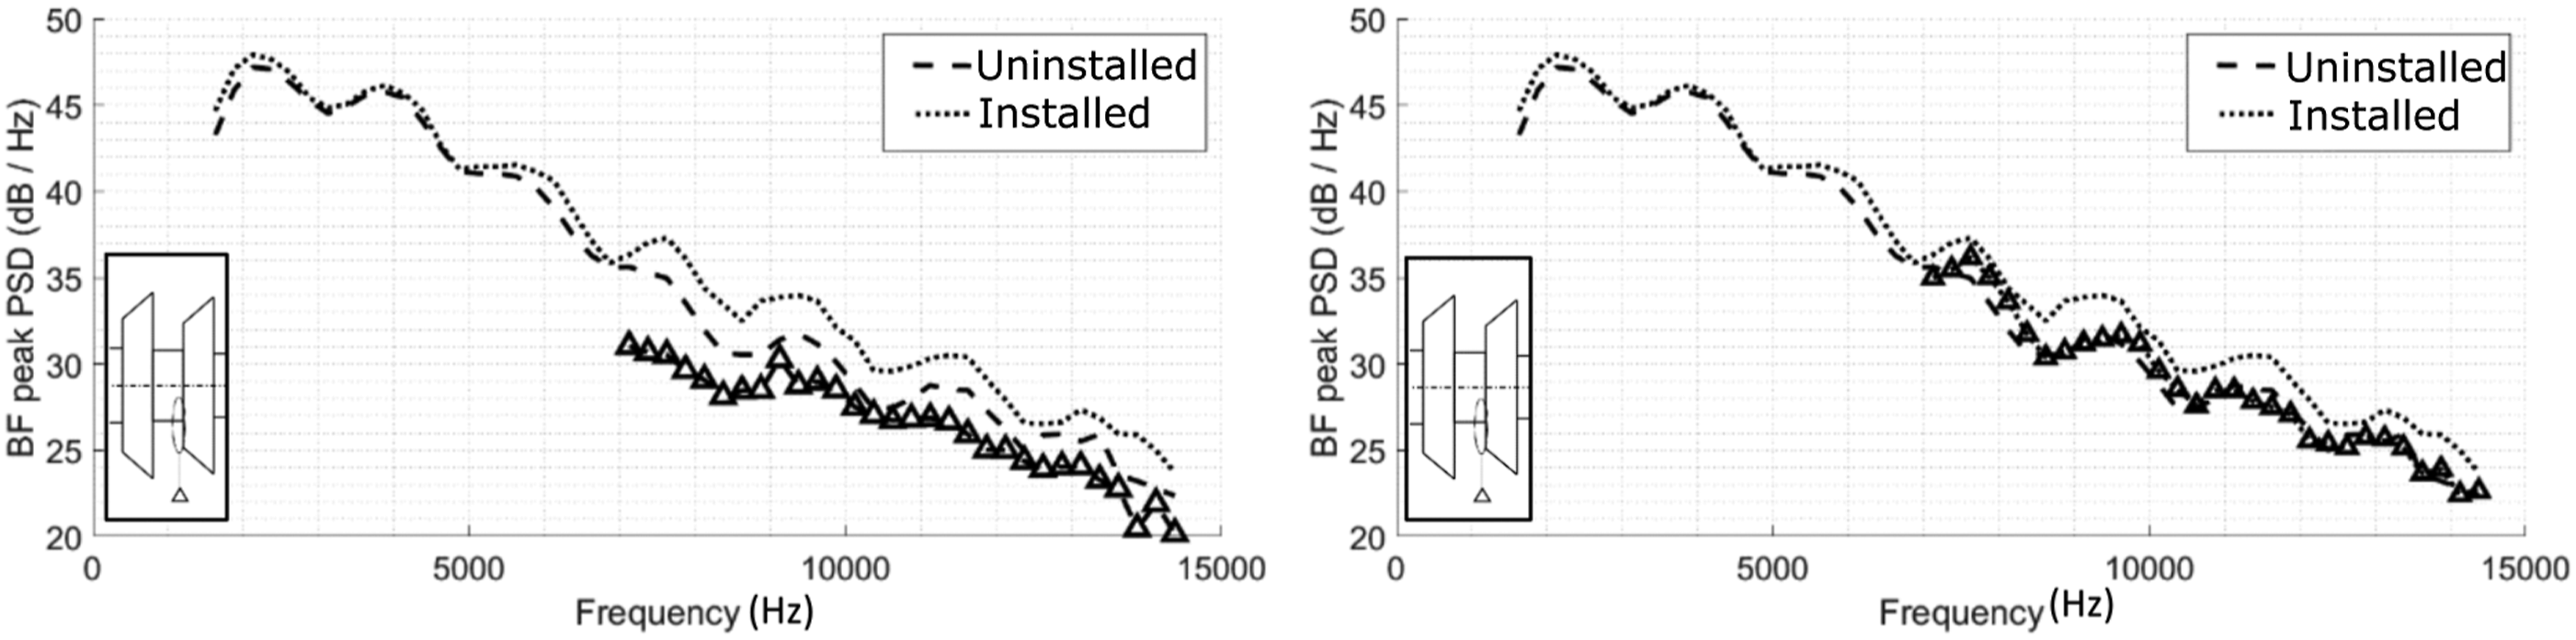
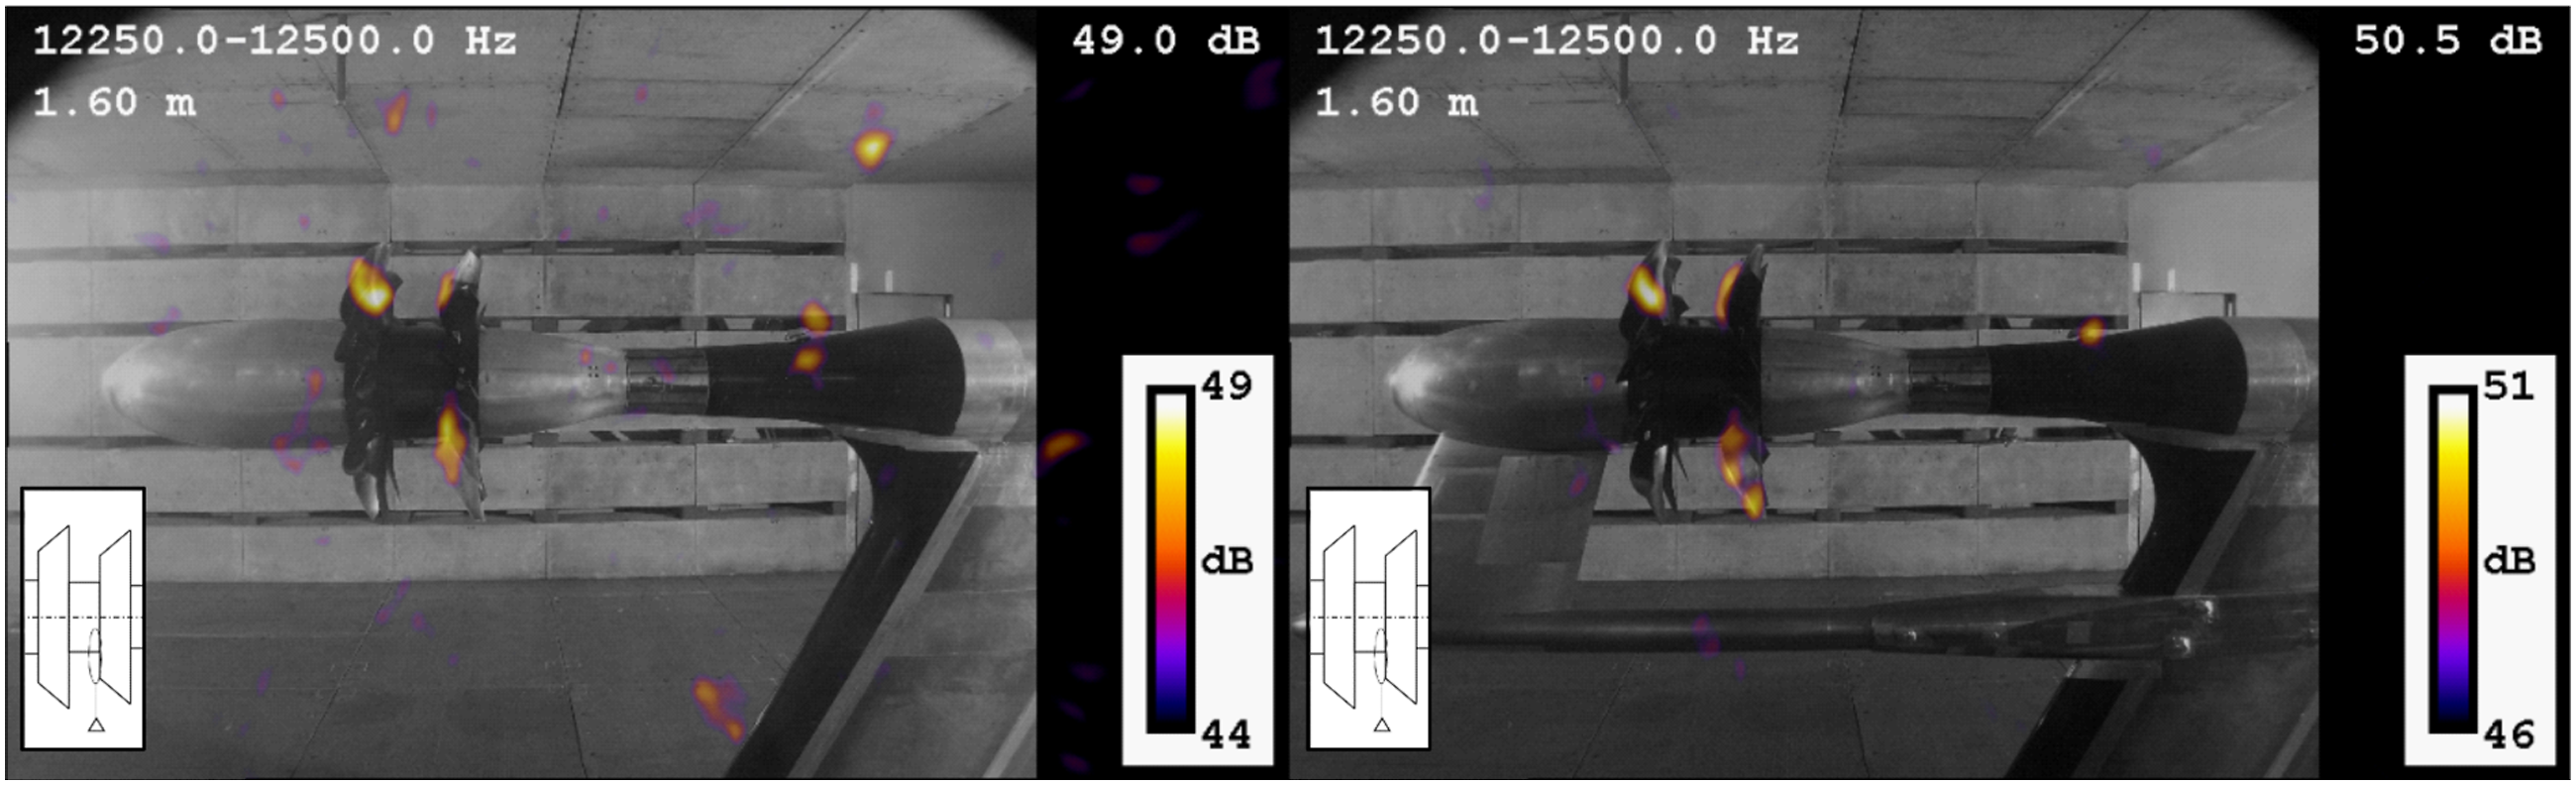
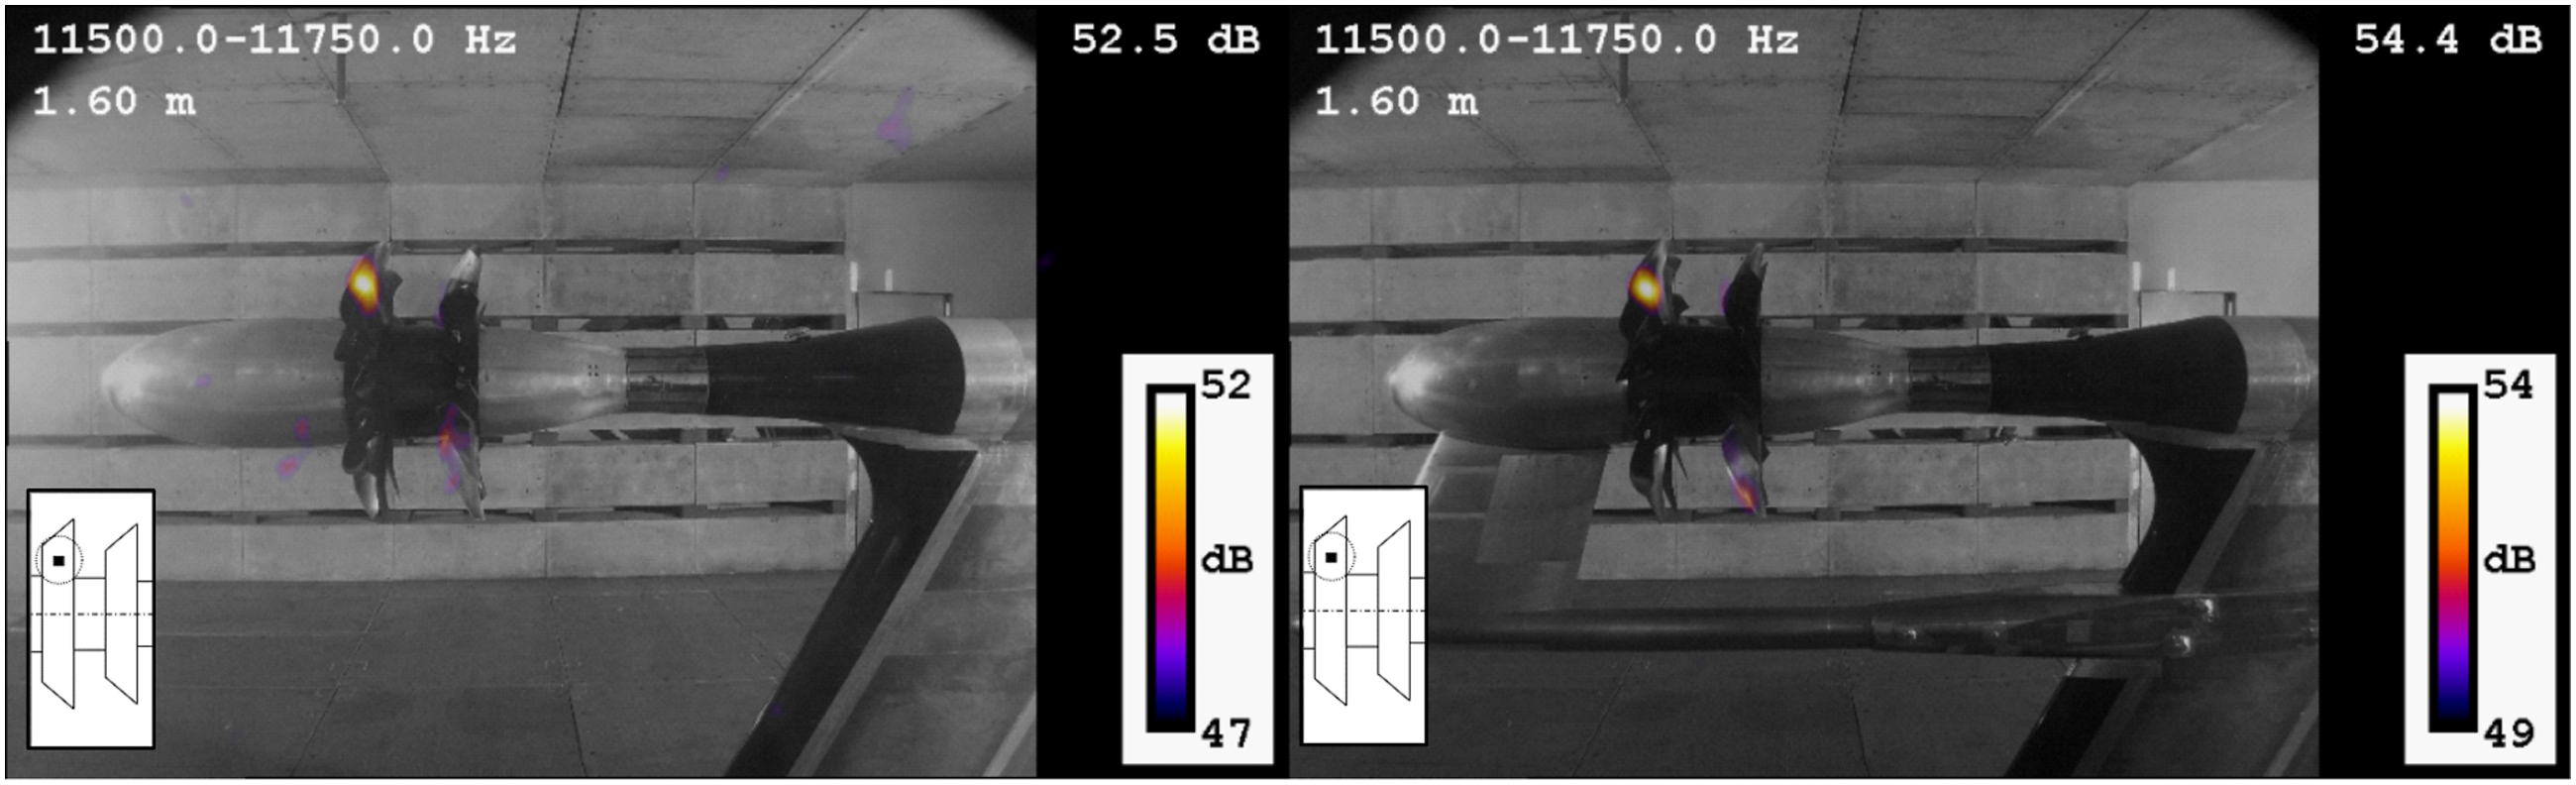
According to the beamforming maps, the main difference between the uninstalled and installed cases is the noise source on the pressure side of the aft rotor’s blade tip. This noise source is present in the installed case from 7000 Hz to 15 kHz. The BFpeak spectrum of this noise source can be seen in Figure 20. and its beamforming map in Figure 21. From 6500 to 10,000 Hz, this noise source is the most dominant noise source of the CROR installed with a pylon, while it is not present in the uninstalled case. The BFpeak spectrum of the blade tip noise source of the pressure side of the aft rotor (installed). The beamforming map of the blade tip noise source of the pressure side of the aft rotor (installed) color online. P. Trailing edge noise source of the pressure side of the forward rotor.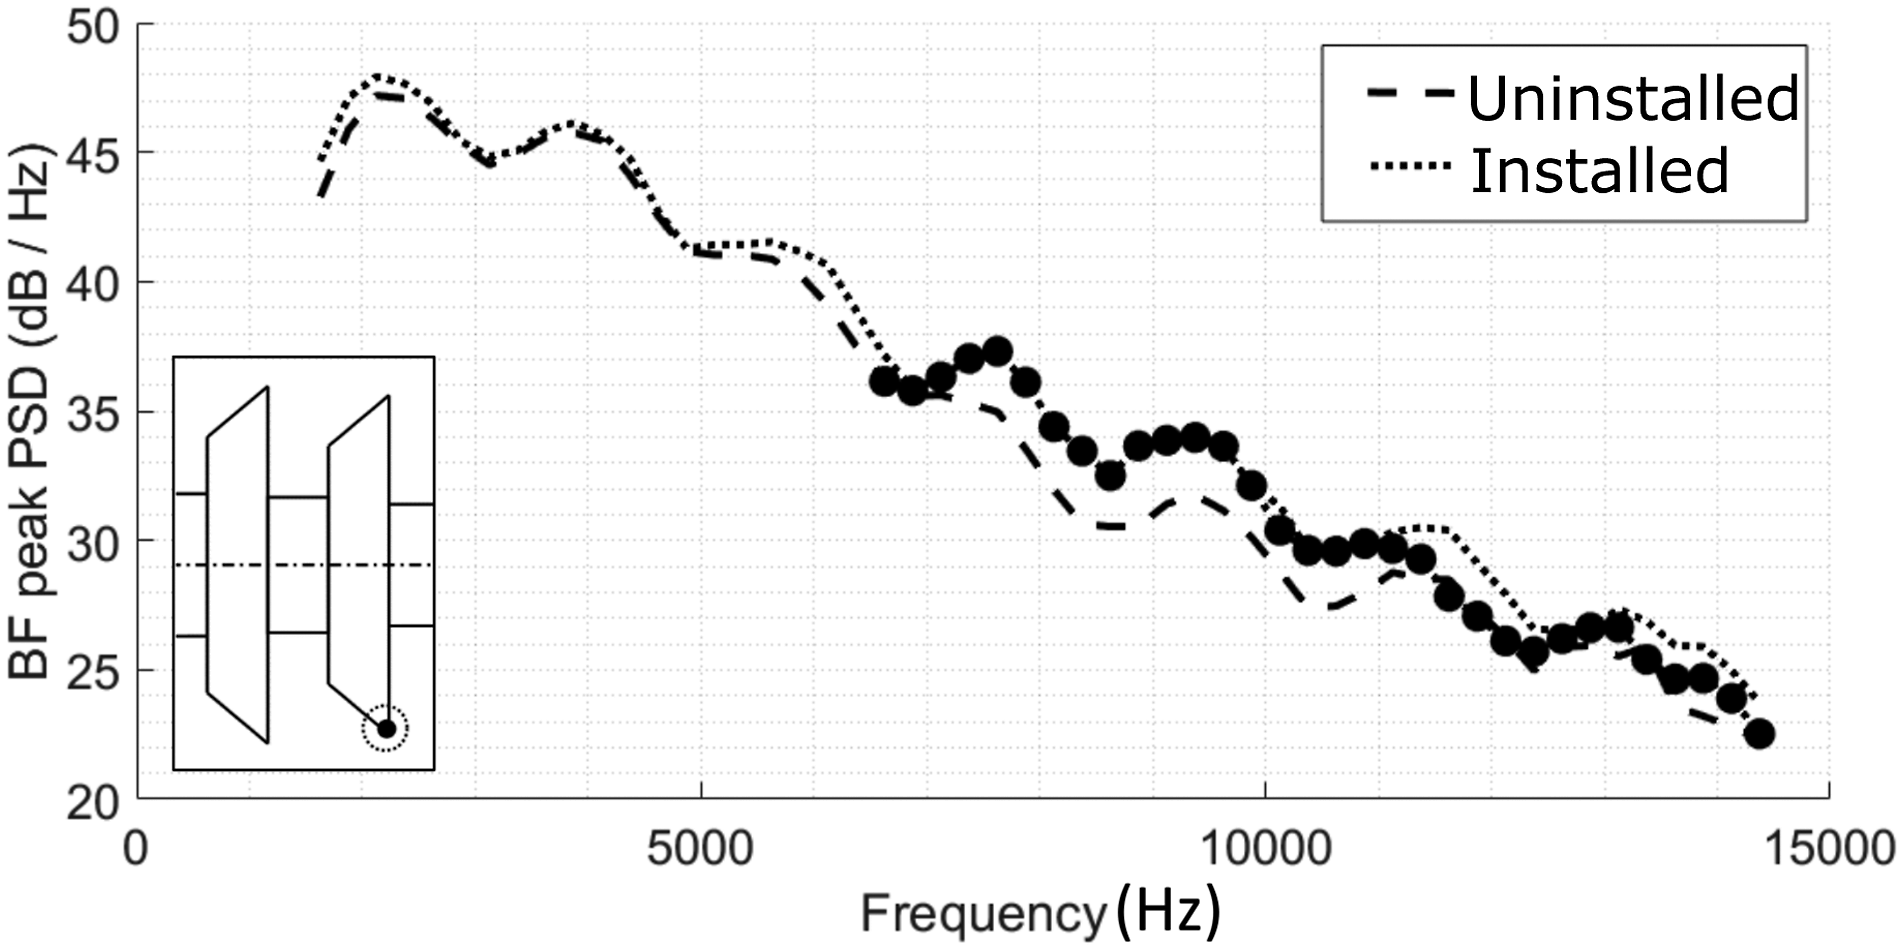
In the mid-frequency range 4500–10,000 Hz, a noise source is present on the trailing edge of the pressure side of the forward rotor in the installed case, which is not present in the uninstalled case. The BFpeak spectrum of this noise source can be seen in Figure 22. and its beamforming map in Figure 23. This noise source appeared as a result of the installation of the pylon. The flow generated by the pylon amplified the noise generation mechanisms of the forward rotor as the flow interacts with the blades. According to the literature,42–47 this noise source can be associated with the trailing edge noise source of the forward rotor. The BFpeak spectrum of the trailing edge noise source of the suction side of the forward rotor (installed). The BFpeak spectrum of the trailing edge noise source of the suction side of the forward rotor (installed) color online.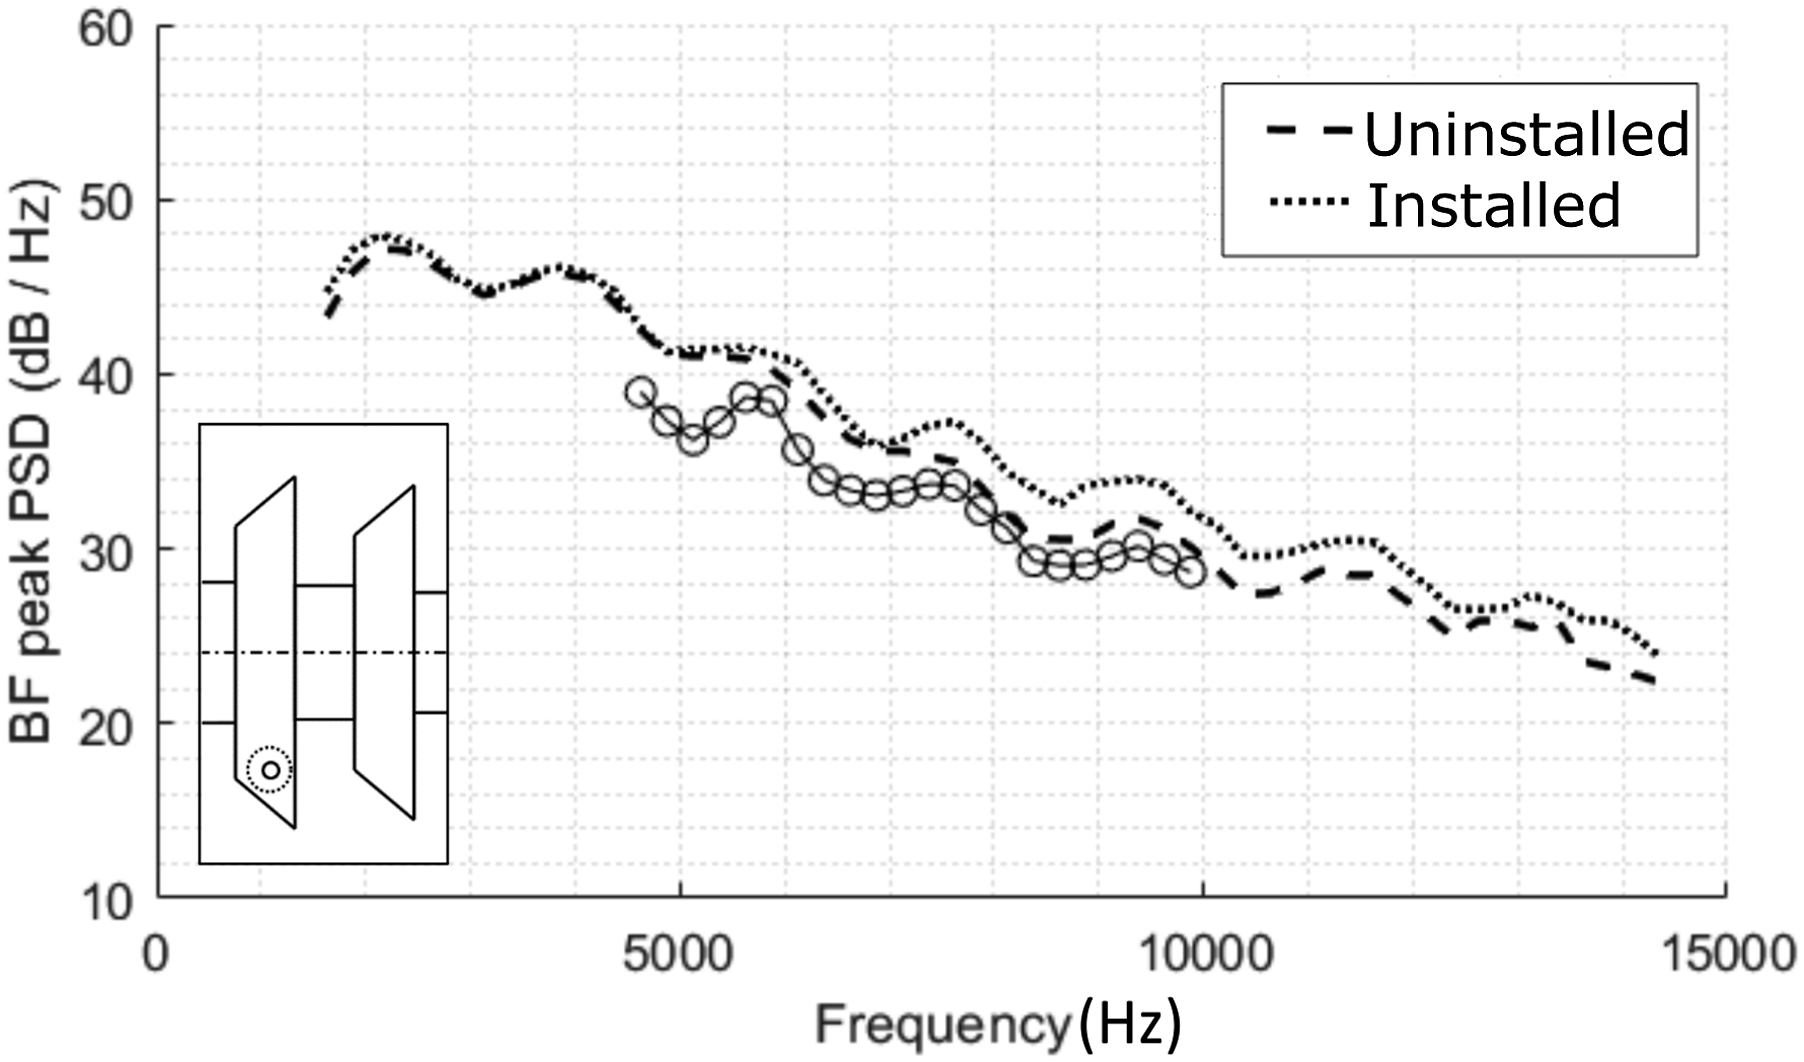
Conclusion
The broadband noise sources of counter-rotating turbomachinery are hard to investigate due to the tonal components. The further developed Double Filtering process can remove the rotational and non-rotational tonal components from the recorded signal more efficiently. As a result, all of the tonal components can be removed from the recorded noise signal of a CROR, leaving only the broadband components. Therefore, it is possible to investigate the amplitudes and locations of the broadband noise sources and determine their noise generation mechanisms. CROR engines are mounted on aircraft with the help of pylons, which affect their aerodynamic and aeroacoustic features. The effect of a pylon is challenging to investigate using single microphone data, because there is no means for distinguishing between the various noise sources and the noise generation mechanisms. However, beamforming maps make it possible to investigate the various noise sources. The beamforming maps of the Double Filtered signal show the broadband noise sources of the CROR, and therefore the pylon’s effect on the various broadband noise generation mechanisms can be investigated. The most dominant broadband noise sources for both the uninstalled (without a pylon) and installed (with a pylon) cases are the blade root noise source of the aft rotor for the lower frequencies, while the trailing edge noise source of the forward rotor and the leading edge noise source of the aft rotor were the typical noise sources of the higher frequency range. The presence of the pylon resulted in the appearance of new noise sources, which were not encountered in the uninstalled case. The pylon amplified the trailing edge noise source of the forward rotor’s suction side, which noise source was not significant in the uninstalled case. The pylon’s interaction with the aft rotor has resulted in a noise source at the aft rotor’s blade tip, which seems to be one of the most significant noise sources of the installed CROR with a pylon at high frequencies. Using the Double Filtering investigation method, it is now possible to investigate the broadband noise generation of the CROR with various configurations and parameters, such as rotational speed, Mach number, and angle-of-attack. As compared to former investigations, the various broadband noise sources can be investigated individually on BFpeak spectra and beamforming maps, which present us with the localized noise sources of the investigated frequency ranges.
Footnotes
Declaration of conflicting interests
The author(s) declared no potential conflicts of interest with respect to the research, authorship, and/or publication of this article.
Funding
The author(s) disclosed receipt of the following financial support for the research, authorship, and/or publication of this article: The testing of the CROR was funded by the Environmentally Responsible Aviation Project of the NASA Integrated Systems Research Program and the Fixed Wing Project of the NASA Fundamental Aeronautics Program. The research reported in this current investigation has been supported by the Hungarian National Research, Development and Innovation Centre under contract No. K 129023, and by the NRDI Funds (TKP2020 IES, Grant No. BME-IE-MISC) and (TKP2020 NC, Grant No. BME-NCS) based on the charter of bolster issued by the NRDI Office under the auspices of the Ministry for Innovation and Technology.