






Abstract
The aeroacoustic investigation of ducted turbomachines is not evident. Wall-mounted and strut-mounted microphones placed in the flow field are both sensitive to installation, placement, and flow-related effects. Therefore, it is advantageous to place the microphone sensors outside of the ducting of the turbomachine while also accounting for the acoustic characteristic of the ducting. In this paper, a ducted low-speed axial flow fan is investigated with the acoustically transparent duct (ATD) and the phased array microphone (PAM) Rotating Source Identification (ROSI) beamforming techniques at design and off-design conditions. The combination of these methods is capable of identifying the dominant sound sources of the fan in a non-intrusive approach at stall condition, pre-stall operation, design condition, and part-load operating condition as well.
Keywords
Introduction
Nowadays, considerable noise pollution is attributed to turbomachines operating in the vicinity of humans. A significant portion of the noise is generated by ducted fans, such as ventilation systems and air conditioning; therefore, it is necessary to gather a fundamental concept of the origin of these fan noises. While external sound absorption proved to be an effective yet expensive method of sound deadening, the gained knowledge can be applied during the design phase of fan development in order to mitigate sound radiation.1–3
In the case of ducted turbomachinery, both mechanical noises and aerodynamically originated sound sources appear. Proper construction with tight tolerances can eliminate the mechanically generated turbomachine noise; however, the aerodynamical sound sources can only be lowered through careful and appropriate design.4,5 In order to take into account the moderation of the emitted flow-related noise of a fan during the design process, it is essential to know the location of the noise sources and the underlying flow phenomena. In the case of low-speed fans, the aerodynamically originated sound sources include turbulence ingestion noise, turbulent boundary layer noise, trailing edge noise, flow separation noise, rotor-stator interaction noise, vortex shedding, and tip leakage flow noise.5–8 The operating condition of the turbomachine influences some of the major sound sources associated with fans; as the developed flow field changes by the shift of the operating point so do the sound source mechanisms as well.8,9
One of the most dominant sound sources is the tip leakage flow (TLF).3,10–12 The TLF results from the pressure difference between the pressure and suction side of the blades and the inevitable tip gap between the casing and the blade tip. The developed tip leakage flow rolls up into a distinct vortex structure called the tip leakage vortex (TLV). The TLF is also highly dependent on the operating condition of the turbomachine.10,13 The tip gap size, the operating condition, and the blade loading determine the strength, origin, and direction of the TLV. The TLV itself presents a dual sound source. Firstly, a strong local sound source can be detected at the tip leading edge as the flow leaks through the tip gap 11 ; the secondary sound generation mechanism of the TLF can be identified as the impingement of the leakage flow on the pressure side of the following blade. 14 As the operating condition of the fan characterizes the TLV, the operating conditions determine the impingement of the vortex and, thus, the emitted sound as well. The phenomenon of double leakage flow (DLF)15,16 is identified in the case the TLV impinges on the following blade, and a portion of the TLF spills through the tip gap once more, further increasing sound emission. 14
Nonetheless, the ability to localize the sound sources combined with a complex understanding of the flow phenomena present in ducted turbomachinery would enable us to pinpoint the most significant sound sources, which could be targeted for suppression in future design processes. Spatially resolved acoustic results, i.e., noise source maps, can be created using the phased array microphone (PAM) measurement technique.9,14,17,18 In the case of PAM measurements, the acoustic sampling is performed synchronously with multiple microphones placed in known positions. Most often, the PAM data are processed using beamforming methods. The basic beamforming method localizes the sound sources based on the phase delay of simultaneously measured acoustic signals. Advanced techniques have also been developed to account for the movement of the source.19,20 The resulting sound source maps show the dominant noise source locations and the primary sound source mechanisms can be identified by means of these noise source maps.
The method has been successfully used for unducted turbomachines in previous case studies.14,21 However, the developed flow inside a ducted turbomachine differs from the one developed around unducted or in short ducted fans. Consequently, extending the PAM beamforming technique for ducted turbomachines would be essential as well.
However, it is generally challenging to identify sound mechanisms in ducted systems due to the acoustic characteristics of the ducting. It is disadvantageous to carry out acoustical measurements from outside the ducting since the duct severely disturbs the sound waves radiating towards the far field. For this reason, previous research often applied microphones placed in the flow and wall-mounted microphones to investigate ducted turbomachines.18,20,22,23 The wall-mounted microphones are unfavorable since they measure the hydrodynamic pressure fluctuations as well as the turbulent boundary layer background noise generated on the solid walls. Additionally, if not installed perfectly flush with the circular air duct, the wall-mounted microphones may influence the local flow, which generates flow-induced self-noise, thus further reducing the signal-to-noise ratio. Also, acoustic measurements carried out from the inside of the duct suffer from sound reflections and scattering by the ducting as well. 24
The method to non-intrusively investigate the acoustics of ducted turbomachinery systems was enabled with the introduction of the acoustically transparent duct (ATD) by Tokaji and Horváth. 25 The technique applies a hydrodynamically sealed duct section which allows acoustical signals to pass through without heavily disturbing the signal. The ATD system enables the application of the beamforming method with the PAM technique for investigating sound sources in a ducted system. It was also shown by Tokaji and Horváth 25 that sound sources could be accurately localized across the ATD with perpendicular and off-axis PAM locations as well. Tokaji et al 26 also showed that the ATD is applicable with the ROtating Source Identification (ROSI) beamforming method 19 as well. The acoustic attenuation of ATD could also be calculated as a function of frequency; however, accurately drawing conclusions on the sound power levels is beyond the scope of the present paper.
The aim of this paper is to show that the acoustically transparent duct (ATD) with the rotating source identification (ROSI) beamforming method is suitable for detecting the change of sound sources in terms of both the location and the strength of noise sources in the case of different operating conditions of an axial flow fan. The combination of these techniques facilitates the possibility of investigating fully ducted turbomachines non-intrusively while maintaining a high level of accuracy. In the following, the effectiveness of the combination of the ATD and ROSI methods is presented through a case study: the effect of throttling a ducted low-speed fan is investigated through noise source maps with a particular focus on the blade tip related sources, specifically the tip leakage flow noise source because, based on the above, it is one of the most dominant noise sources and it is highly dependent on the operating condition.
Measurement setup
A measurement campaign was carried out, with a focus on acoustics at different operating points. The fan was investigated at five operation points as well as three rotational speeds: 950, 1175, and 1400 r/min. The measurement setup is shown in Figure 1. The test rig assembly included the low-speed axial flow fan with a free inlet and ducted outlet. The fan is installed inside a short, d = 0.315 m diameter duct. The fan operated with a short-tapered inlet geometry while the ATD section was connected to the pressure side of the fan. The ATD was installed downstream of the fan for both the upstream and downstream measurements. The diameter of the ATD was somewhat larger than the fan diameter: d
duct
= 0.400 m. The diameter change downstream of the fan was resolved with a backward-facing step. The ATD applied for the present measurement campaign was based on the work of Tokaji and Horváth
25
: identical perforated sheet and covering film were utilized for the present investigation. Measurement setup.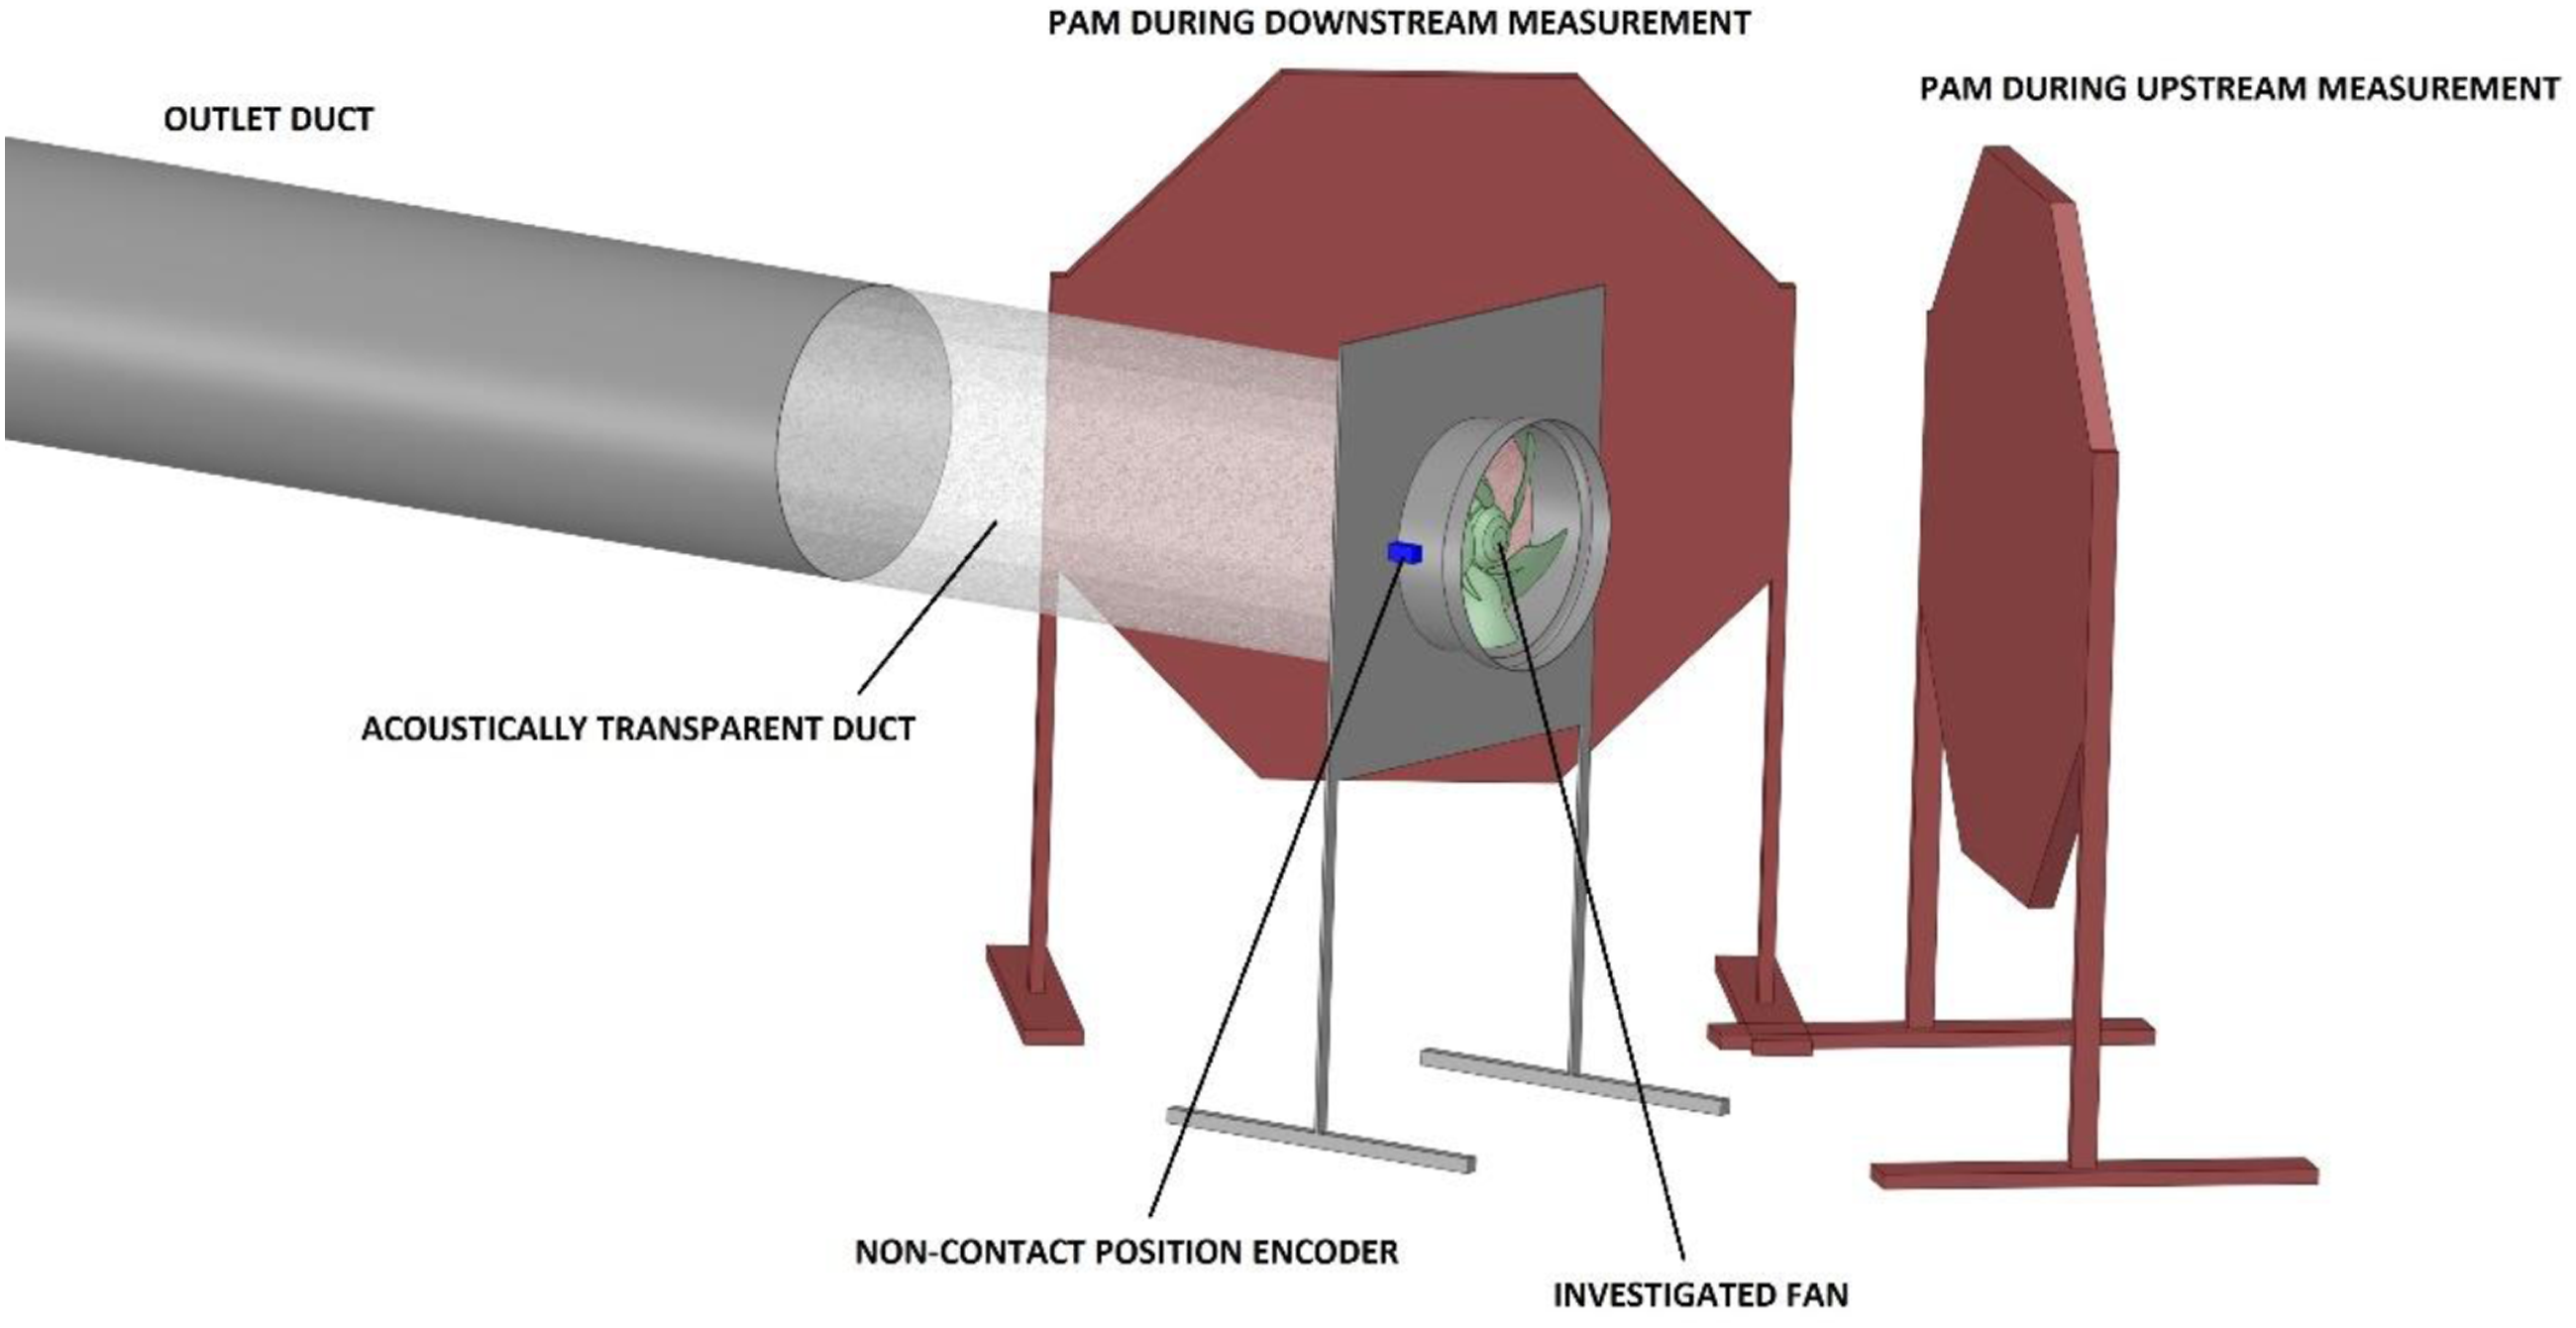
The diameter of the exhaust duct was d
duct
as well, and its length was 10 ⋅ d
duct
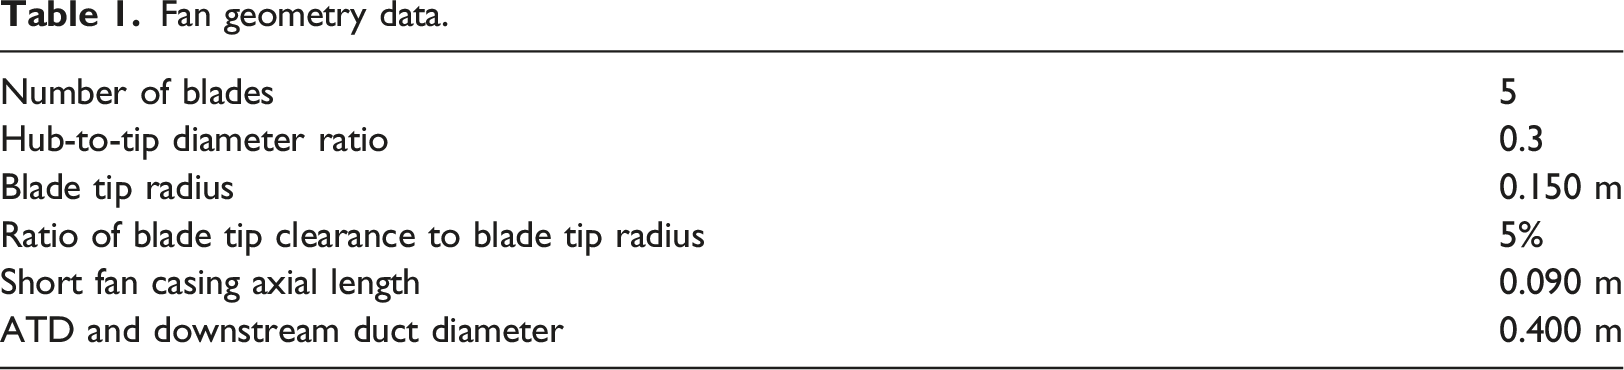
which proved sufficiently long to consider the fan outlet ducted. Phased array microphone (PAM) measurements were conducted on both the upstream and downstream sides as well. The fan casing was not acoustically transparent. Therefore, part of the tip region was obscured by the short casing. However, this had little to no effect due to the long sampling time, during which the anomaly was averaged out, and the effect was not observed in the results. Preliminary studies showed that the PAM does not affect the inflow condition of the fan in the case of upstream PAM measurement. A detailed description of the forward-skewed fan rotor geometry can be found in Figure 2 and Table 1. The geometry of the investigated fan and cross-section of the assembly. Fan geometry data.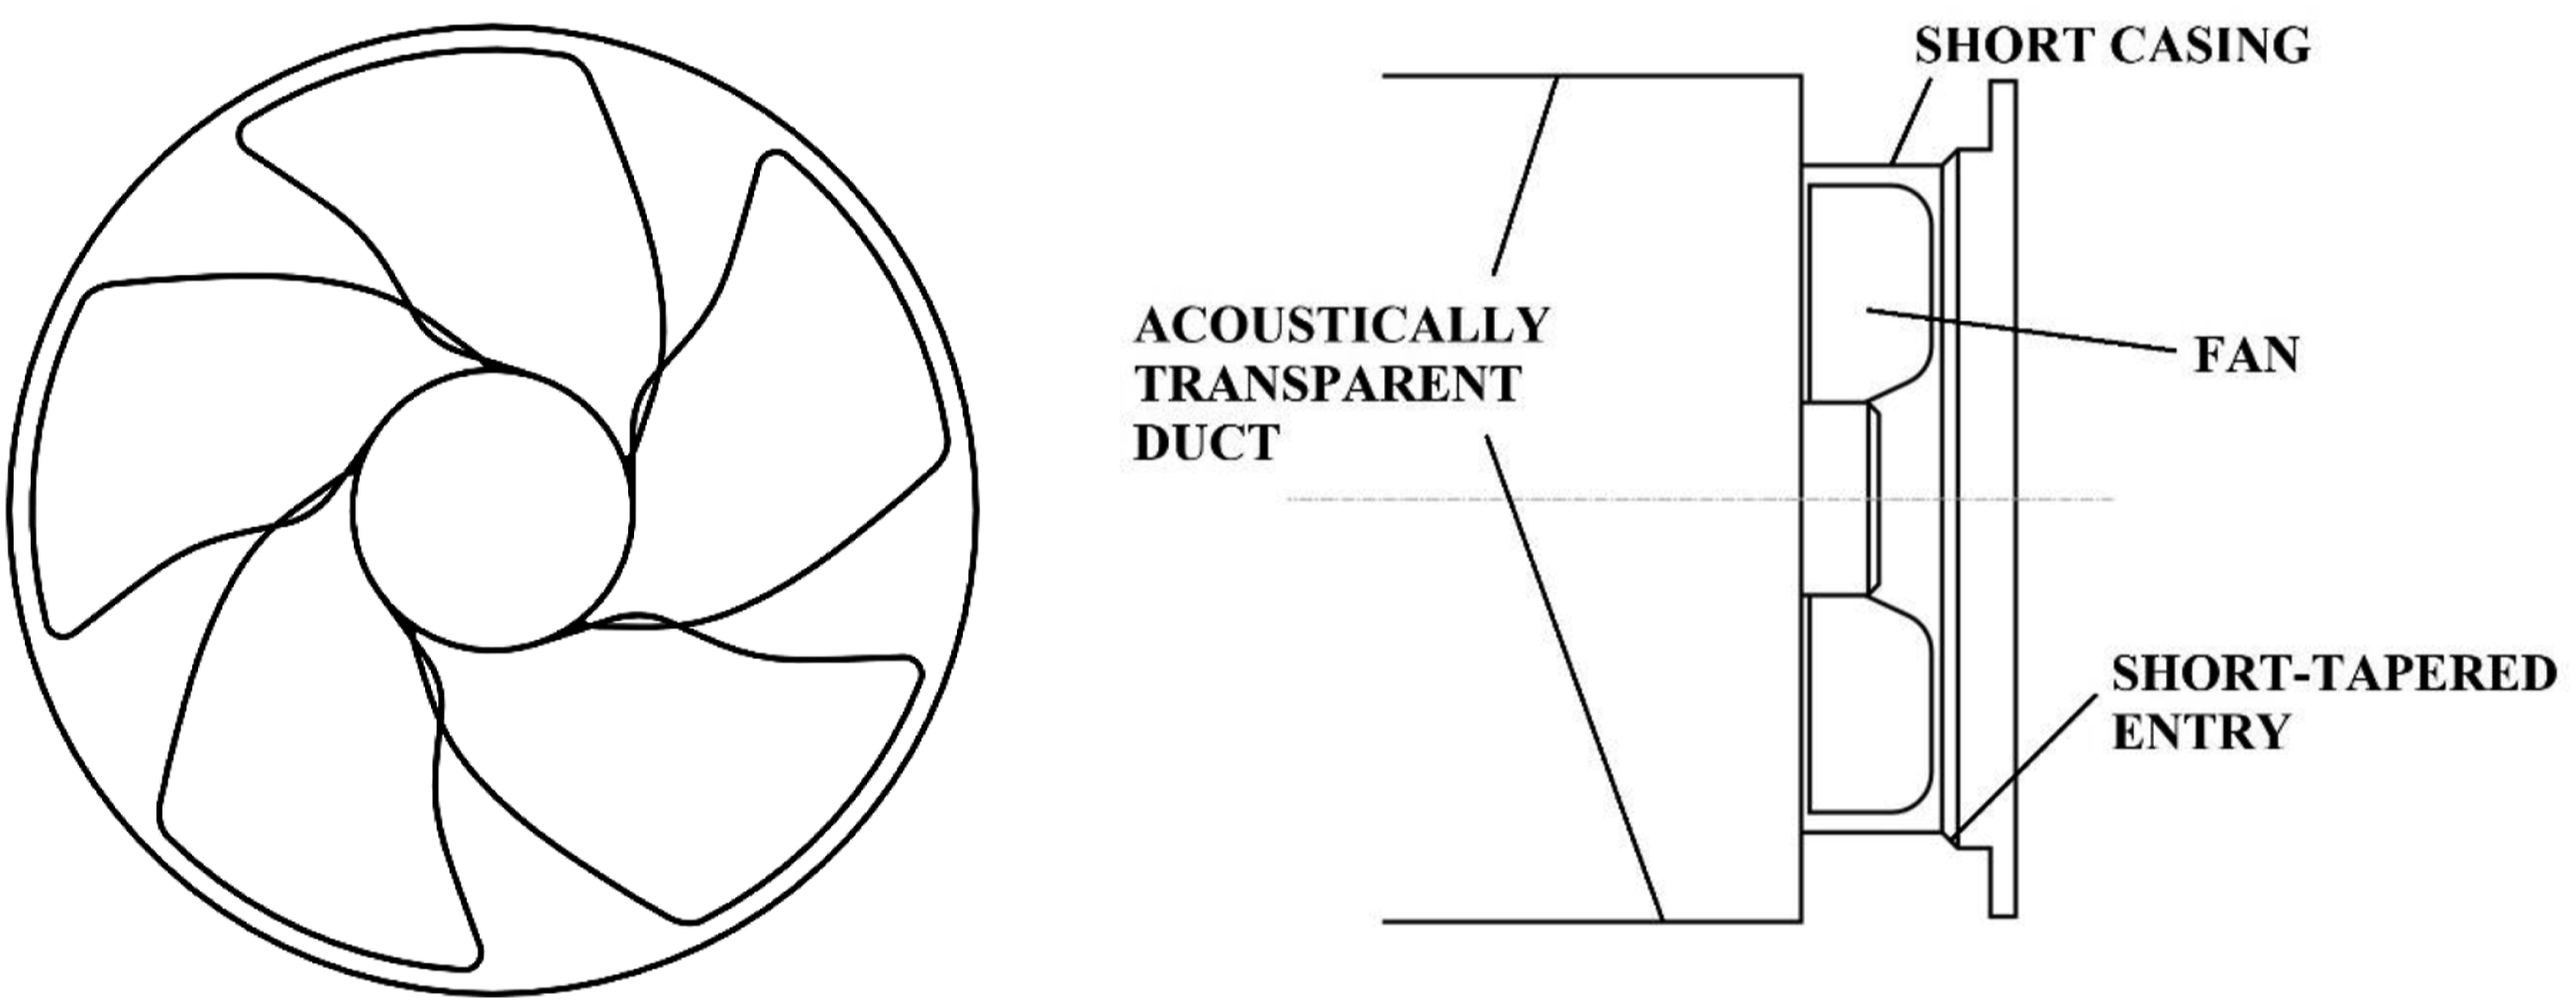
A single crossbar held the whole fan hub assembly in place. The induction motor propelling the fan is located inside the hub. Throttling the fan caused an increase in the slip of the induction motor. However, all presented results were scaled to the nominal rotational speed for comparability. The rotational speed could be adjusted by an external frequency converter. The angular velocity of the impeller was registered via a non-contact optical position encoder. The center of the fan was 3 ∙ d duct above the ground. Therefore, the acoustic reflections off the ground were neglected for the investigation.
Acoustic measurement parameters.

The in-house implemented ROSI beamforming algorithm
19
was utilized to evaluate the PAM measurements for its unique ability to calculate rotating sound sources with arbitrary microphone array arrangement accurately. The ducting of the fan disabled the PAM measurements from being carried out with in-line PAM and fan arrangement. Therefore, the PAM was set at an angle compared to the axis of the fan (off-axis). This is shown in Figure 1. The effect of the off-axis setup must be carefully considered: the main disadvantage of such measurement is that the microphones located at a highly skewed angle to the axis of the fan are significantly affected by the sound radiation directivity of the fan. Therefore, the sound radiation directivity of the fan was measured and the directivity characteristics are shown in A-weighted overall sound pressure levels (OASPL) in Figure 3. Zero degrees corresponds to the axis of the fan. The measurements were carried out in the horizontal plane at one meter distance from the center of the fan with the ATD mounted to the downstream side which causes the reduced OASPL for the downstream angles. The fan rotational speed was 1400 r/min during the measurements. Fan noise OASPL directivity for the investigated setup expressed in dBA. 0° corresponds to the axis of the fan.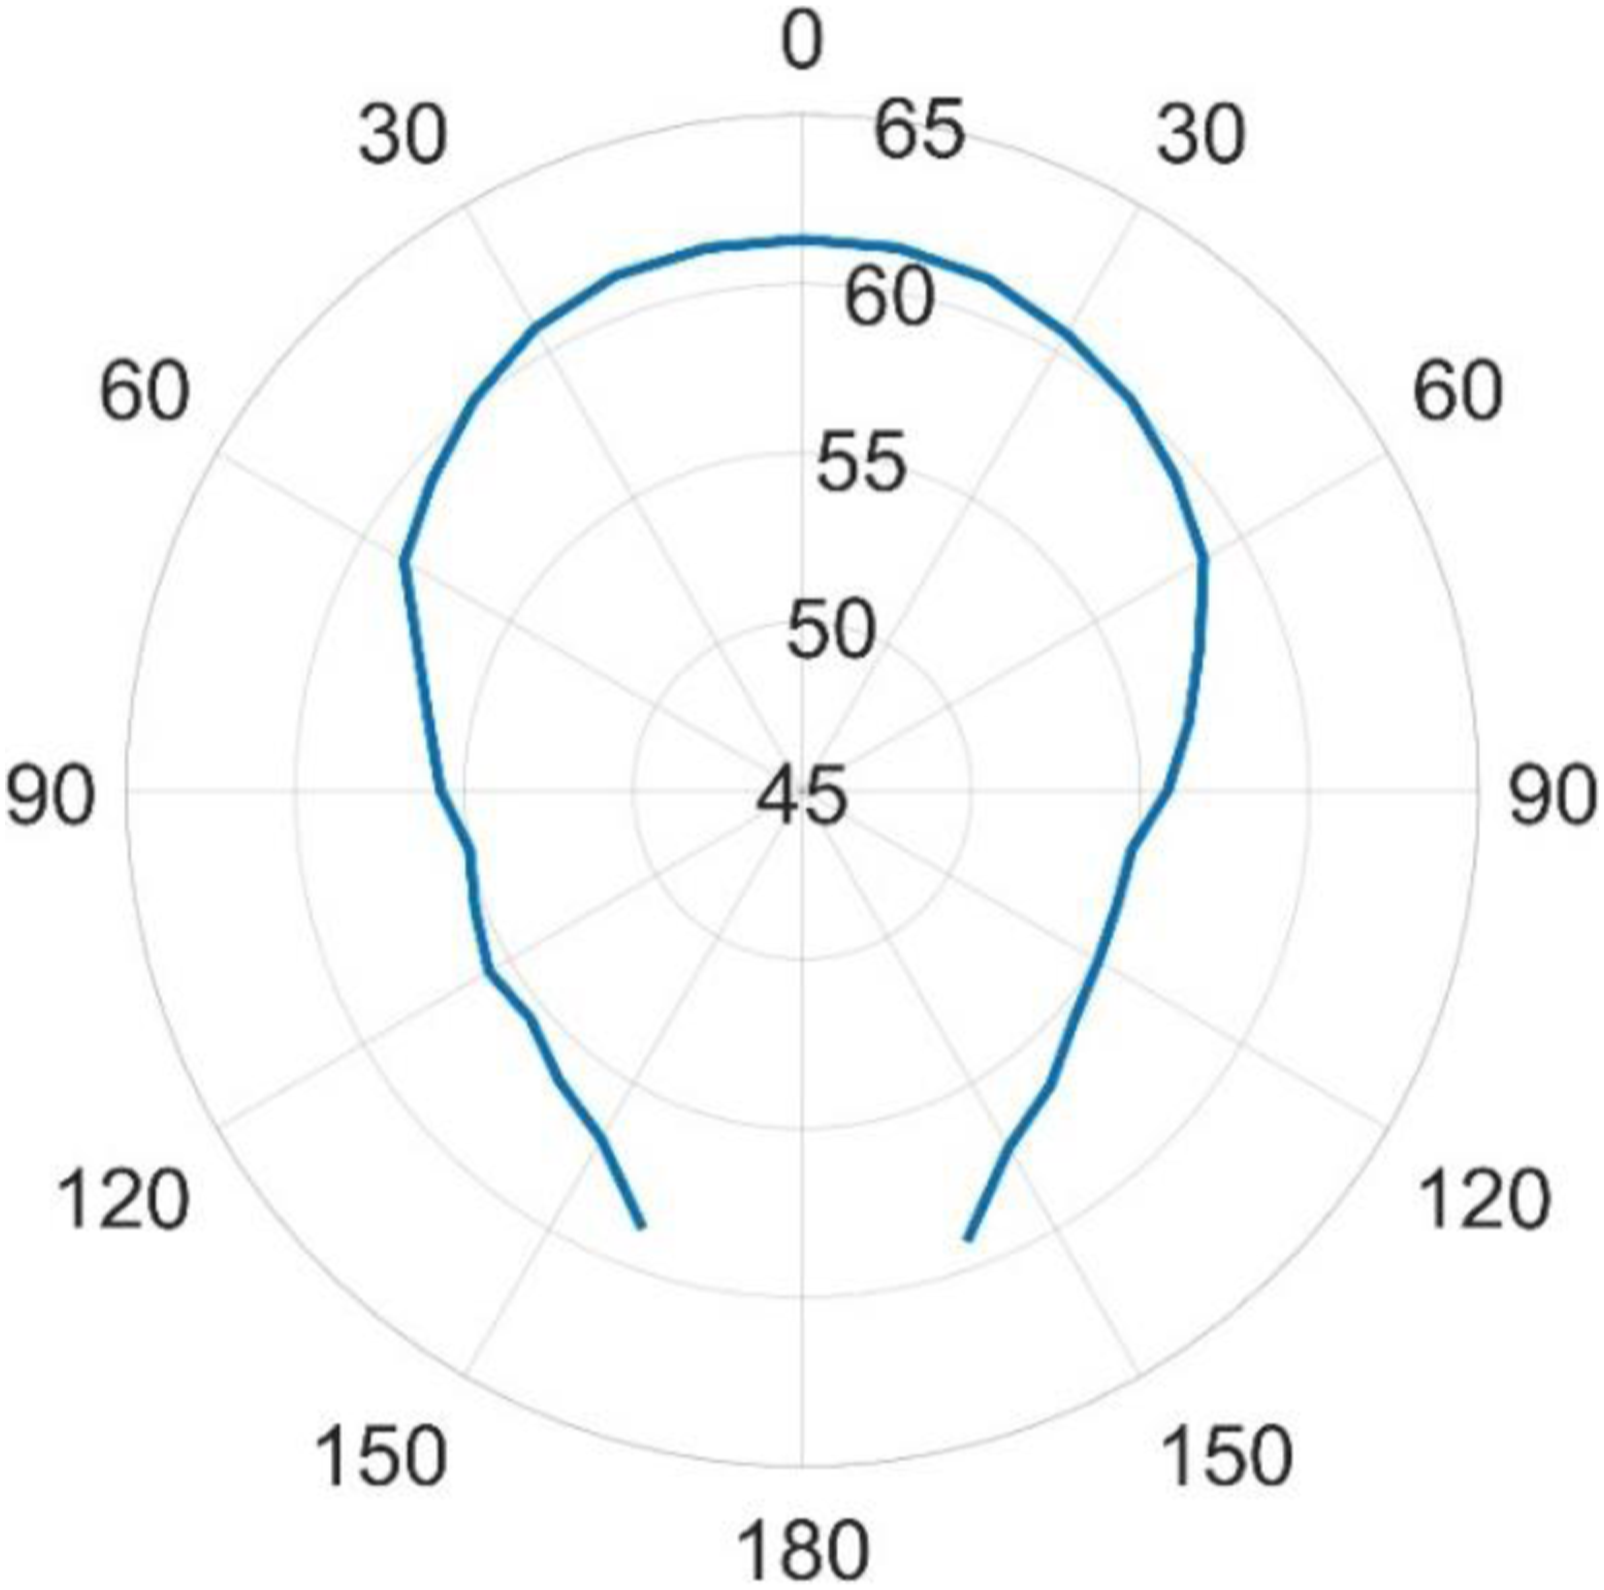
The fan noise directivity causes inaccurate compensation of the sound source strength in the beamforming algorithm. This phenomenon does not affect the delay and sum process of the beamforming. Thus, the resulting sound source maps will be qualitatively adequate; however, quantitative comparisons cannot be made. Tokaji and Horváth 25 also showed that the beamforming method could successfully be applied for the case of off-axis measurement of the ATD with only a slight distortion in the sound source maps at specific frequency bands. Although the depth sensitivity of the beamforming method is poor, radially deformed sound sources can be expected, as the realized ROSI beamforming algorithm was developed for rotation in the focus plane.
Results
Figure 4 shows the characteristic curve of the fan in terms of global flow and static pressure rise coefficient. The measurements were conducted at Φ = 0.05, 0.10, 0.15, 0.20, and 0.30. These operating points correspond to stall operation, two pre-stall conditions, design operation, and part load operating conditions, respectively. In further analysis, the results are indicated by the corresponding global flow coefficient. The global flow and static pressure rise coefficients are calculated in the following way: The characteristic curve of the fan with the investigated operating points highlighted.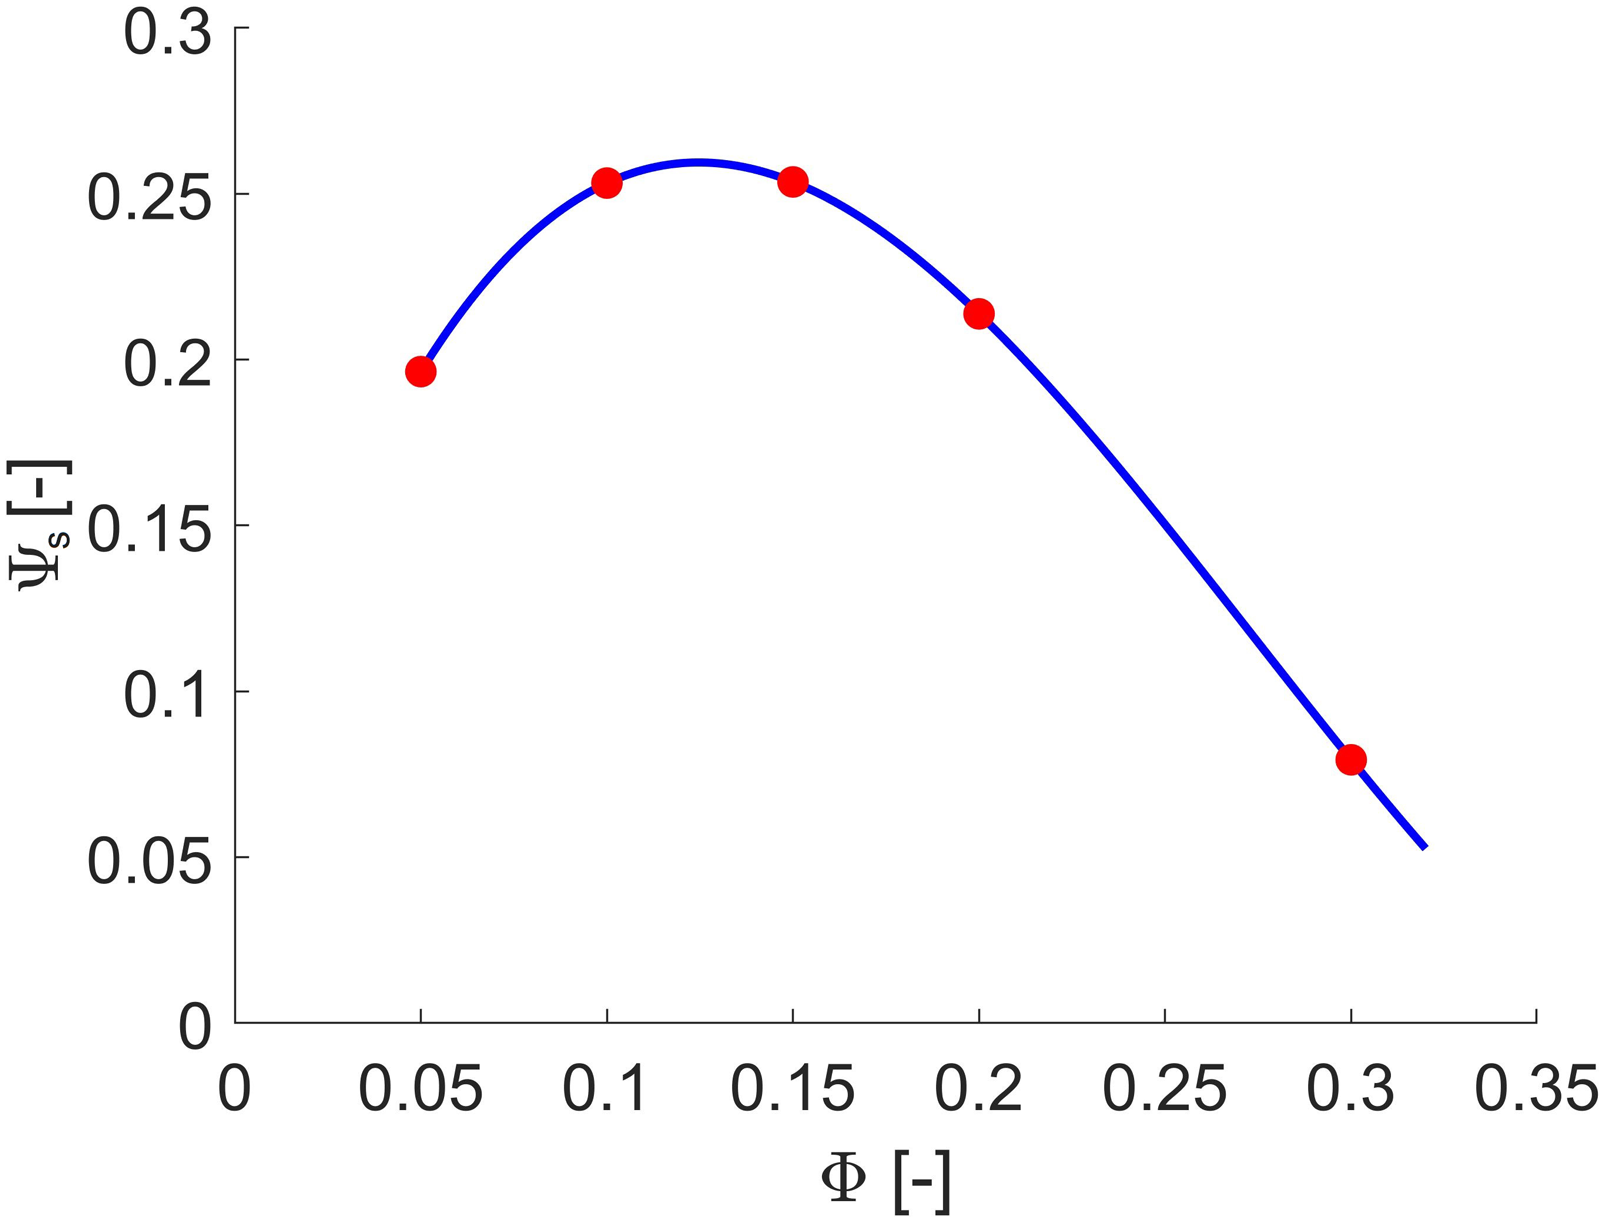
Where Φ and Ψs are the global flow and static pressure rise coefficients, respectively, Q V is the volume flow rate, u is the blade tip peripheral velocity, r b is the blade tip radius, Δp is the pressure rise, and ρ is the density.
Figure 5 compares the background spectrum with the acoustic spectra originating from the maximum of the noise source maps of the fan assembly at the investigated rotational speeds for the case of part load operating condition (Φ = 0.30). Based on Figure 5, the turbomachine sound emission exceeded the background noise by 20–40 dB for the lowest rotational speed; therefore, the fan was considered the dominant sound source. The noise radiated by the fan is broadband; thus, the third-octave evaluation is suitable. Also, the shape of the spectra suggests Reynolds number independent regime of investigation. The tonal peak of the 950 r/min case at 5300 Hz corresponds to the frequency converter of the driving induction motor. Background and fan acoustic spectra at different rotational speeds at part load operating condition (Φ = 0.30).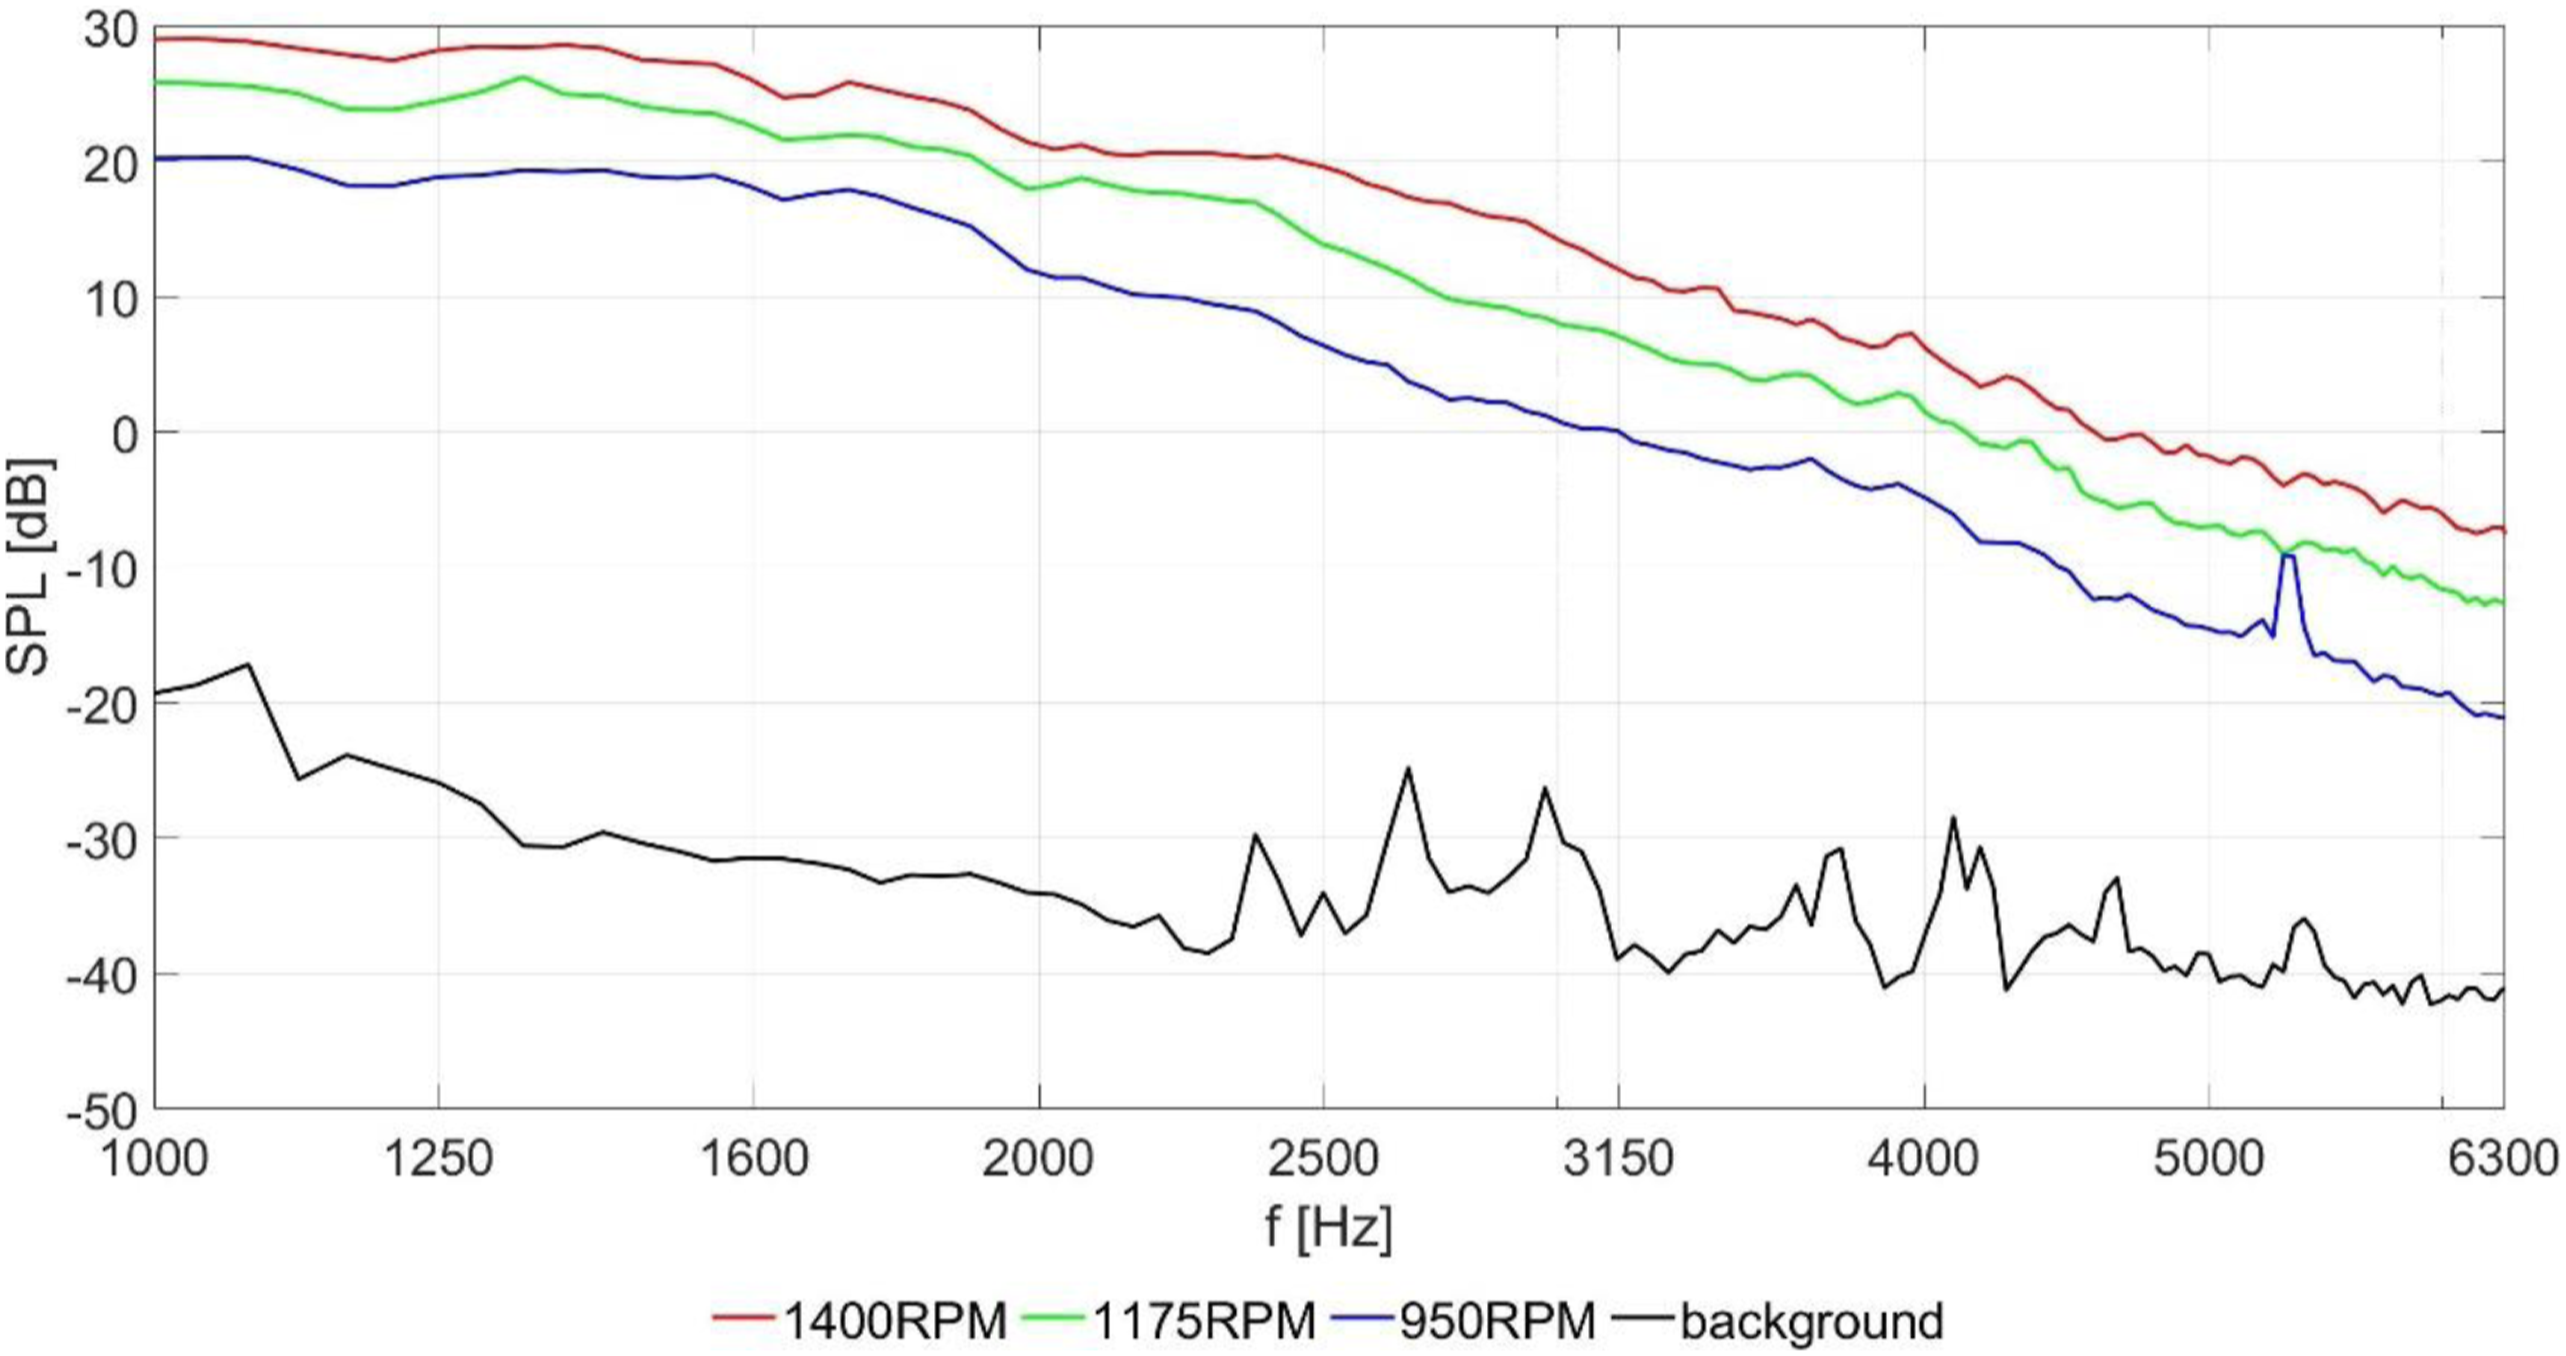
The effect of the off-axis PAM and fan arrangement was also carefully investigated. Due to the nature of the ROSI beamforming algorithm, the rotating sound sources are assumed to be rotating in the investigated plane and therefore appear in a circular pattern. Therefore, a radial shift of the source locations can be expected in the case of off-axis PAM measurements as the assumed sources deviate from the physical path. First, to investigate this effect, synthetic broadband rotating sources were examined with off-axis ROSI beamforming. The resulting source maps can be found in Figure 6. For this investigation, identical PAM and rotating source positions (assuming dominant blade tip sound sources) with identical rotational speed (1400 r/min) were set as the eventual measurements used. The radius of the sources was approximated with an ostensible radius defined as the average of the minimum and maximum radii of the elliptical physical paths of the sources. In the figures, the solid lines correspond to the actual path of the sources, while dashed lines mark the ostensible radii. The ostensible radius shows good agreement with the location of the sources for the investigated frequency range. Source maps of off-axis PAM simulations with synthetic broadband rotating sources. The physical paths are indicated with solid lines, and the ostensible radius is marked with dashed lines.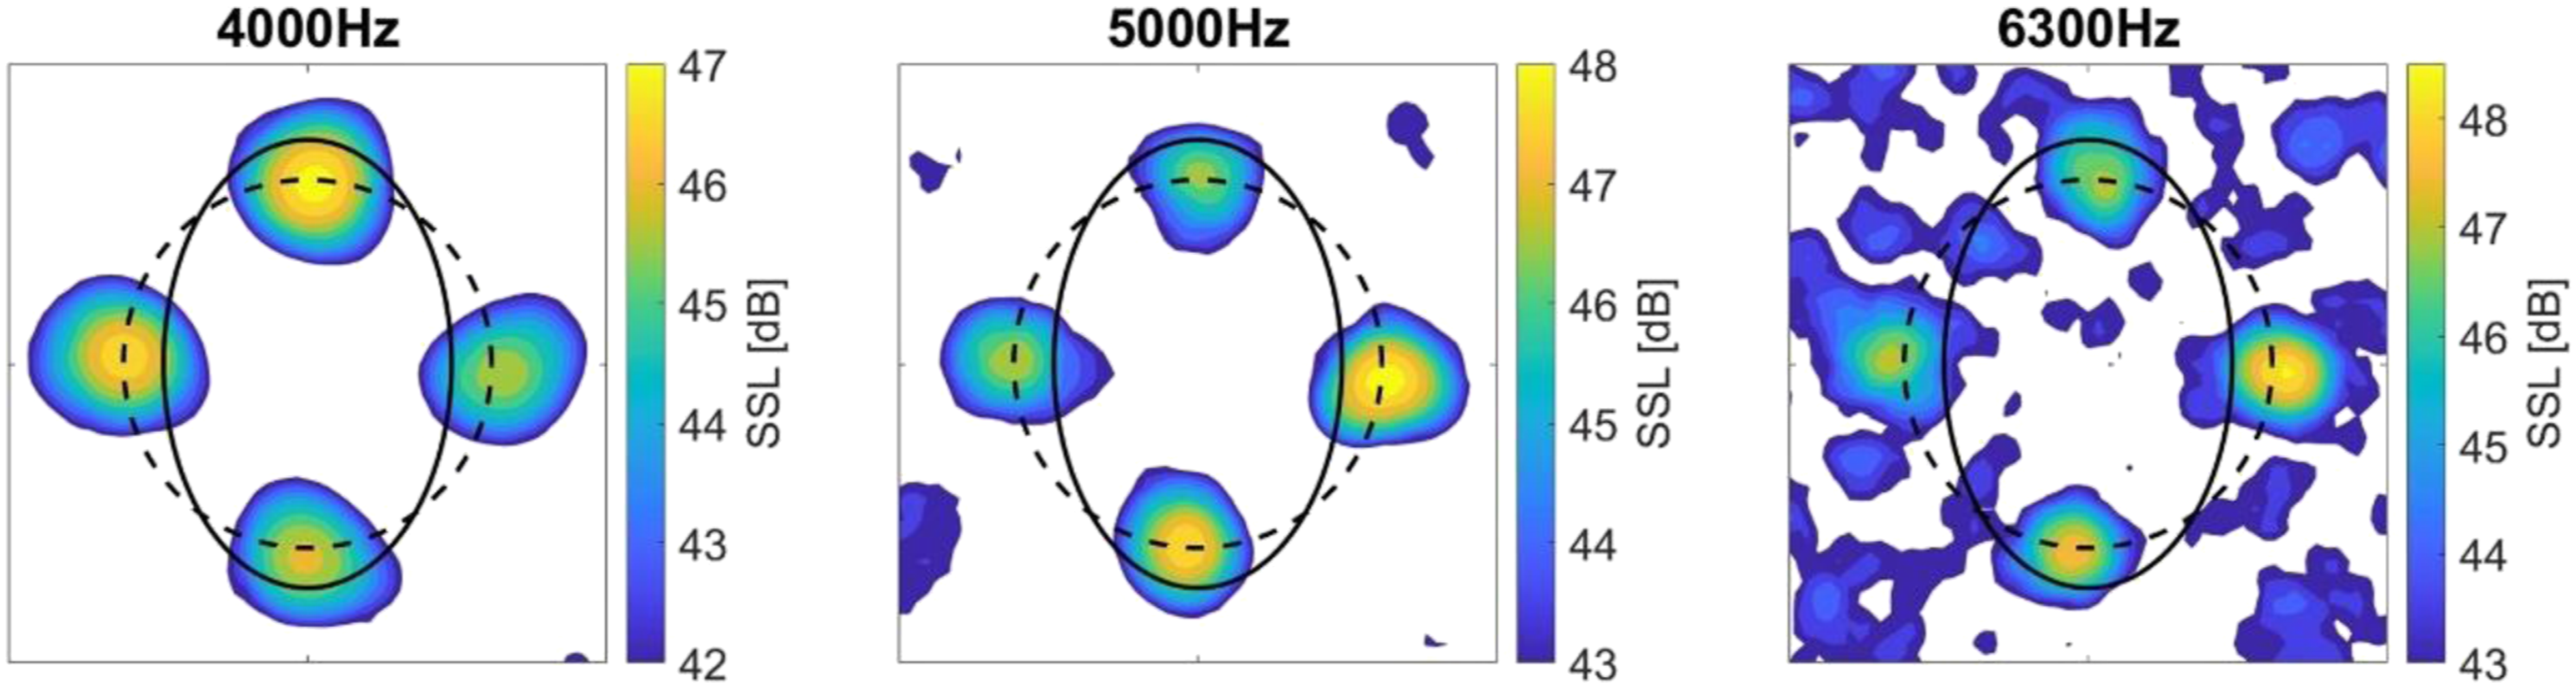
The investigation was also carried out with measurements of the axial fan. The results can be found for the case of part load operating condition (Φ = 0.30) in Figure 7. As expected, Figure 7 shows that the source maps are notably inferior for low frequencies in the cases the PAM axis and the rotational axis of the rotating sources are inclined (off-axis). In the figures, the solid lines correspond to the actual path of the fan rotor blade tip. In the case of the frontal measurement, the blade tip sources appear somewhat outside of the physical path. The ostensible radius indicated with dashed lines showed good agreement with the location of the blade tip sound sources in the sound source maps. For this reason, the fan contour in all further figures was displayed with the ostensible diameter. Even though the actual localized sound sources may shift somewhat radially, based on preliminary measurements, the dominant sound sources originate from the blade tip. The position of the rotor was determined with ±3° of uncertainty, which is below the beamforming method resolution at the blade tip radius. It is also worth mentioning that the difference between the sound pressure levels calculated by the beamforming algorithm is caused by the directivity of the fan's sound emission, as explained in the previous chapter. Source maps from the front (top row) and off-axis (bottom row). The physical paths are indicated with solid lines, and the ostensible radius is marked with dashed lines.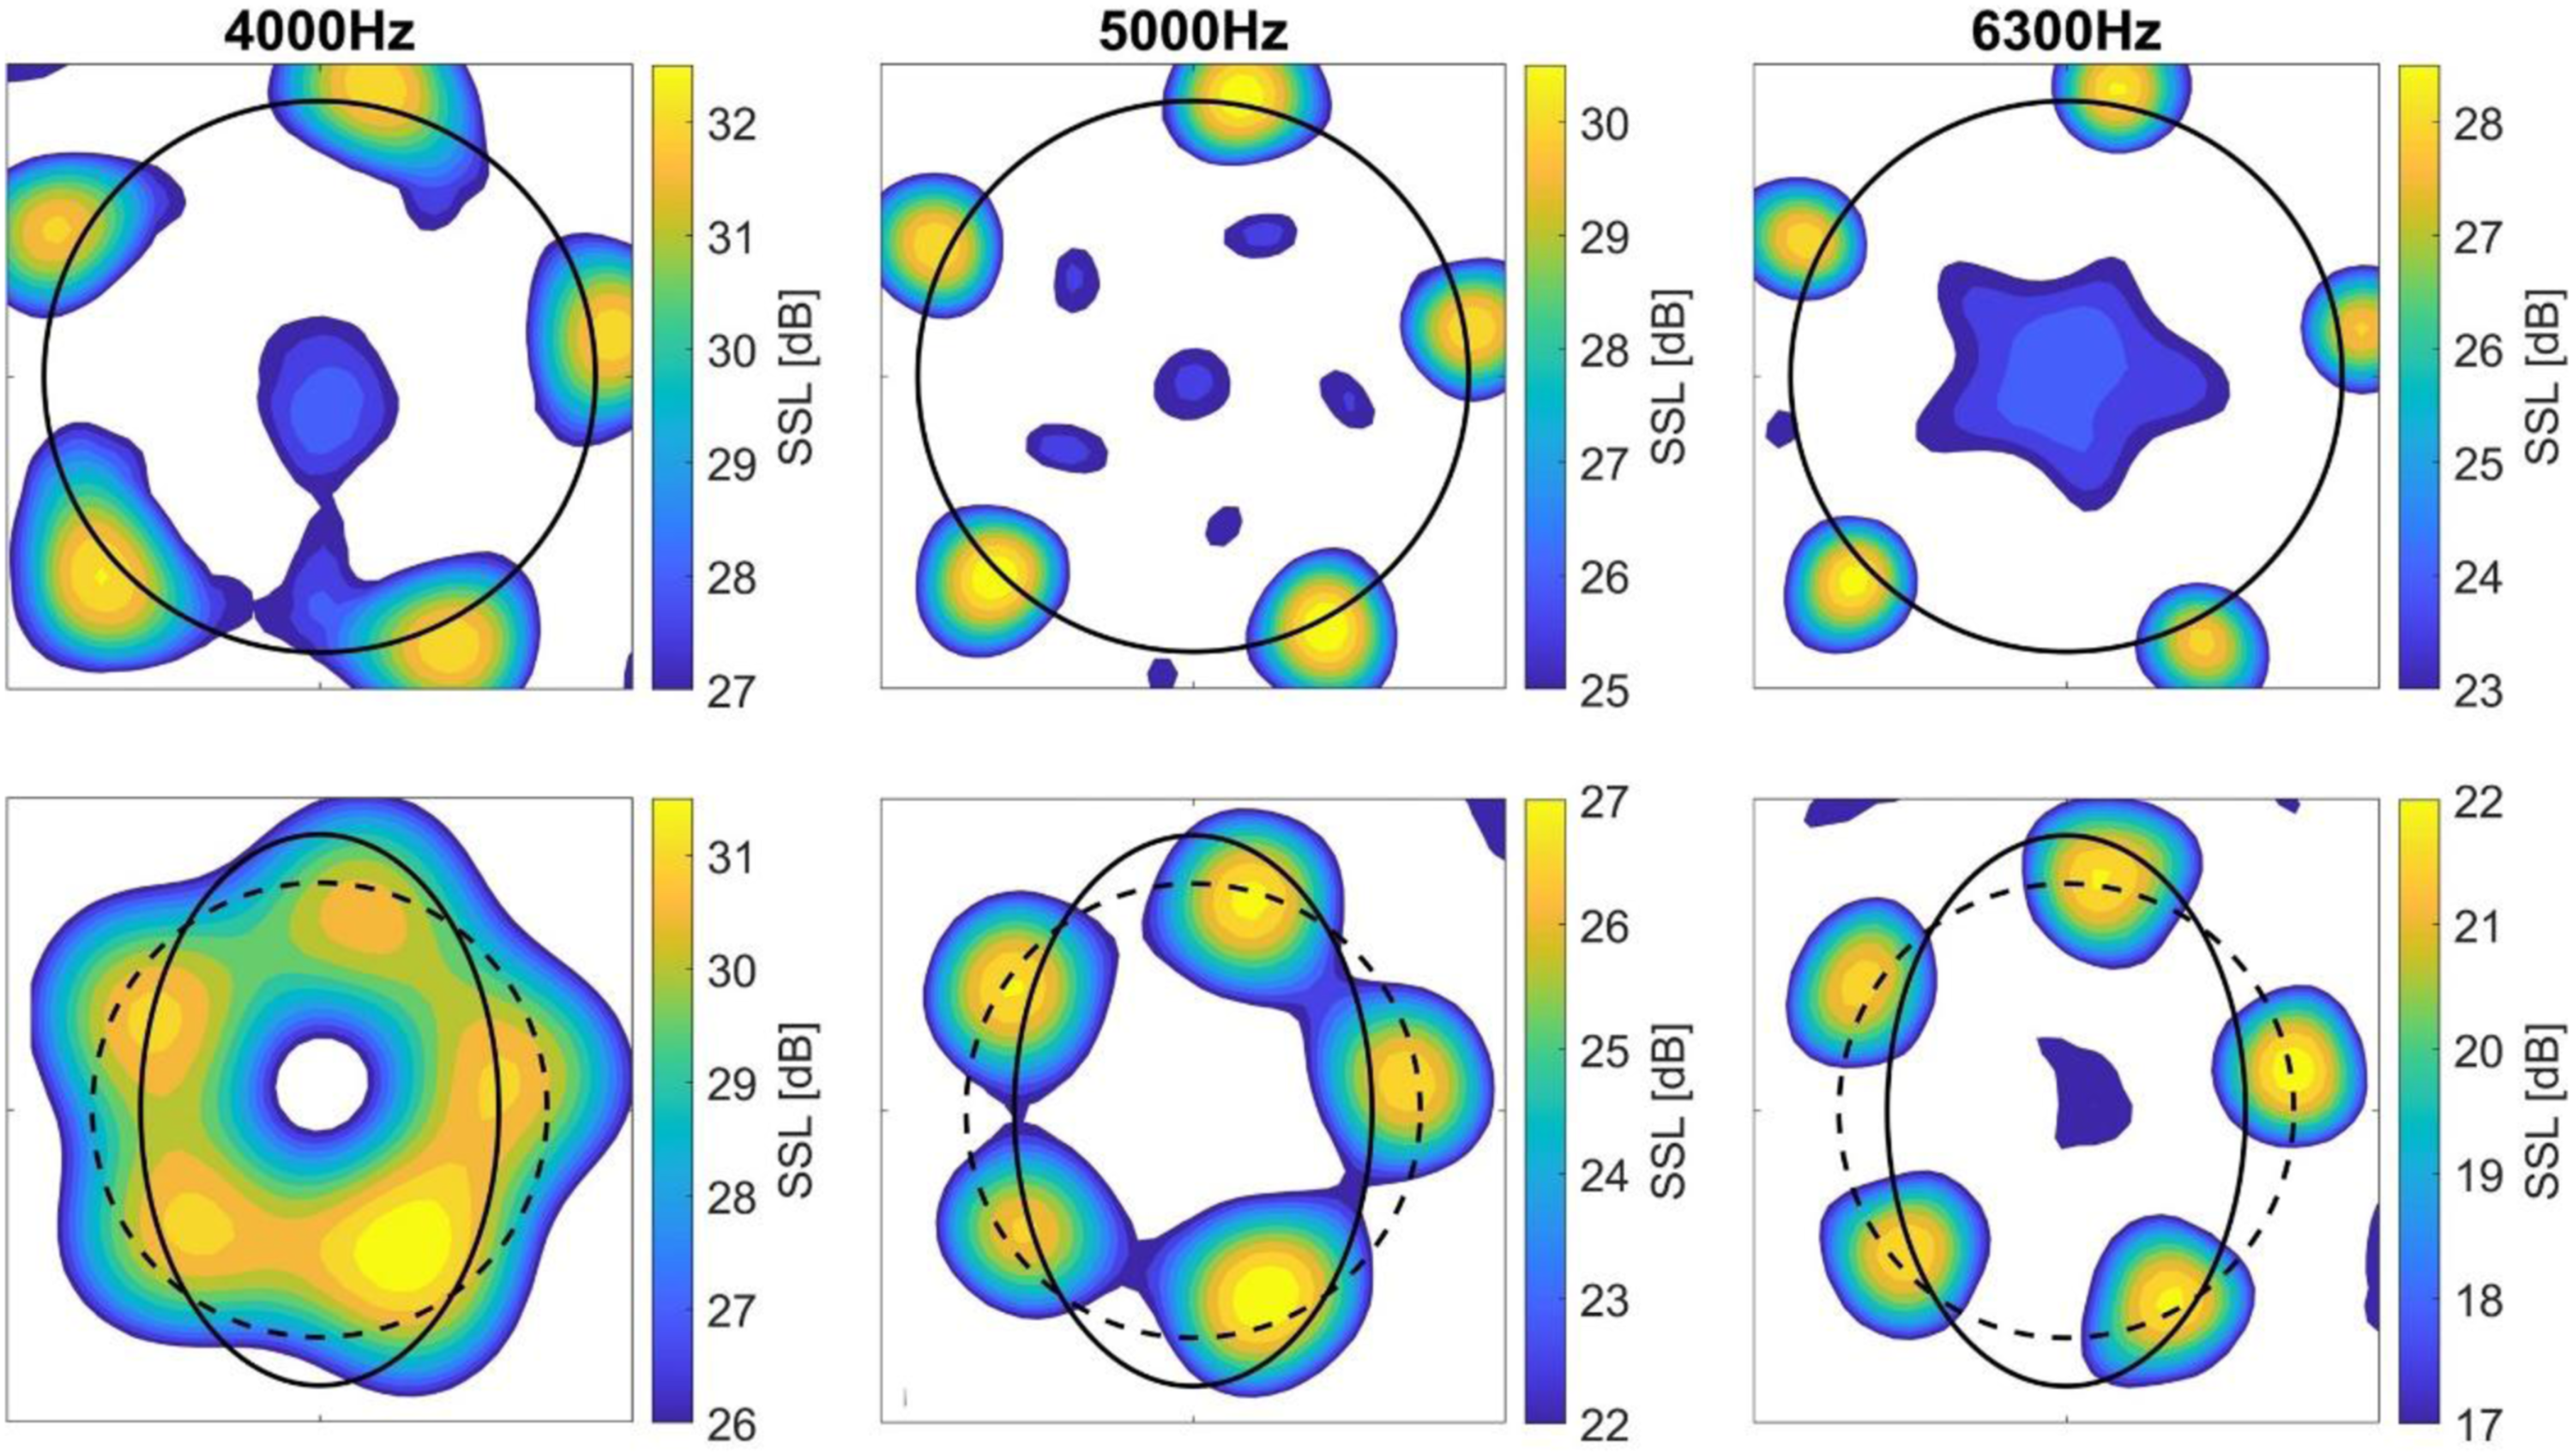
The effect of the ATD on the ROSI beamforming algorithm was also examined. The results are shown in Figure 8 for upstream measurements with upstream mounted ATD for the case of part load operating condition (Φ = 0.30). Even though different inflow conditions apply for the cases of free inlet and forward-facing step inflow, similar sound sources are dominating based on the findings of Benedek et al
14
and Lendvai and Benedek.
27
Thus, the cases can be used to compare sound source maps. Figure 8 shows that the ATD does not influence the beamforming methodology significantly. The sound sources are similar in both cases, with Tokaji et al25,26 having presented equivalent results. It is also visible in the figures that the ROSI beamforming method is capable of producing adequate sound source maps with clearly defined dominant sound sources with the application of the ATD. It is also clear that both upstream and downstream ATD setup measurements can be carried out, yet only a single fan assembly was investigated in the current paper. Even though the off-axis PAM measurements sound source maps are somewhat inferior, Figures 7 and 8 prove that qualitative assessments can be made based on the results. Off-axis sound source maps from the upstream direction without ATD (top row) and with the ATD (bottom row).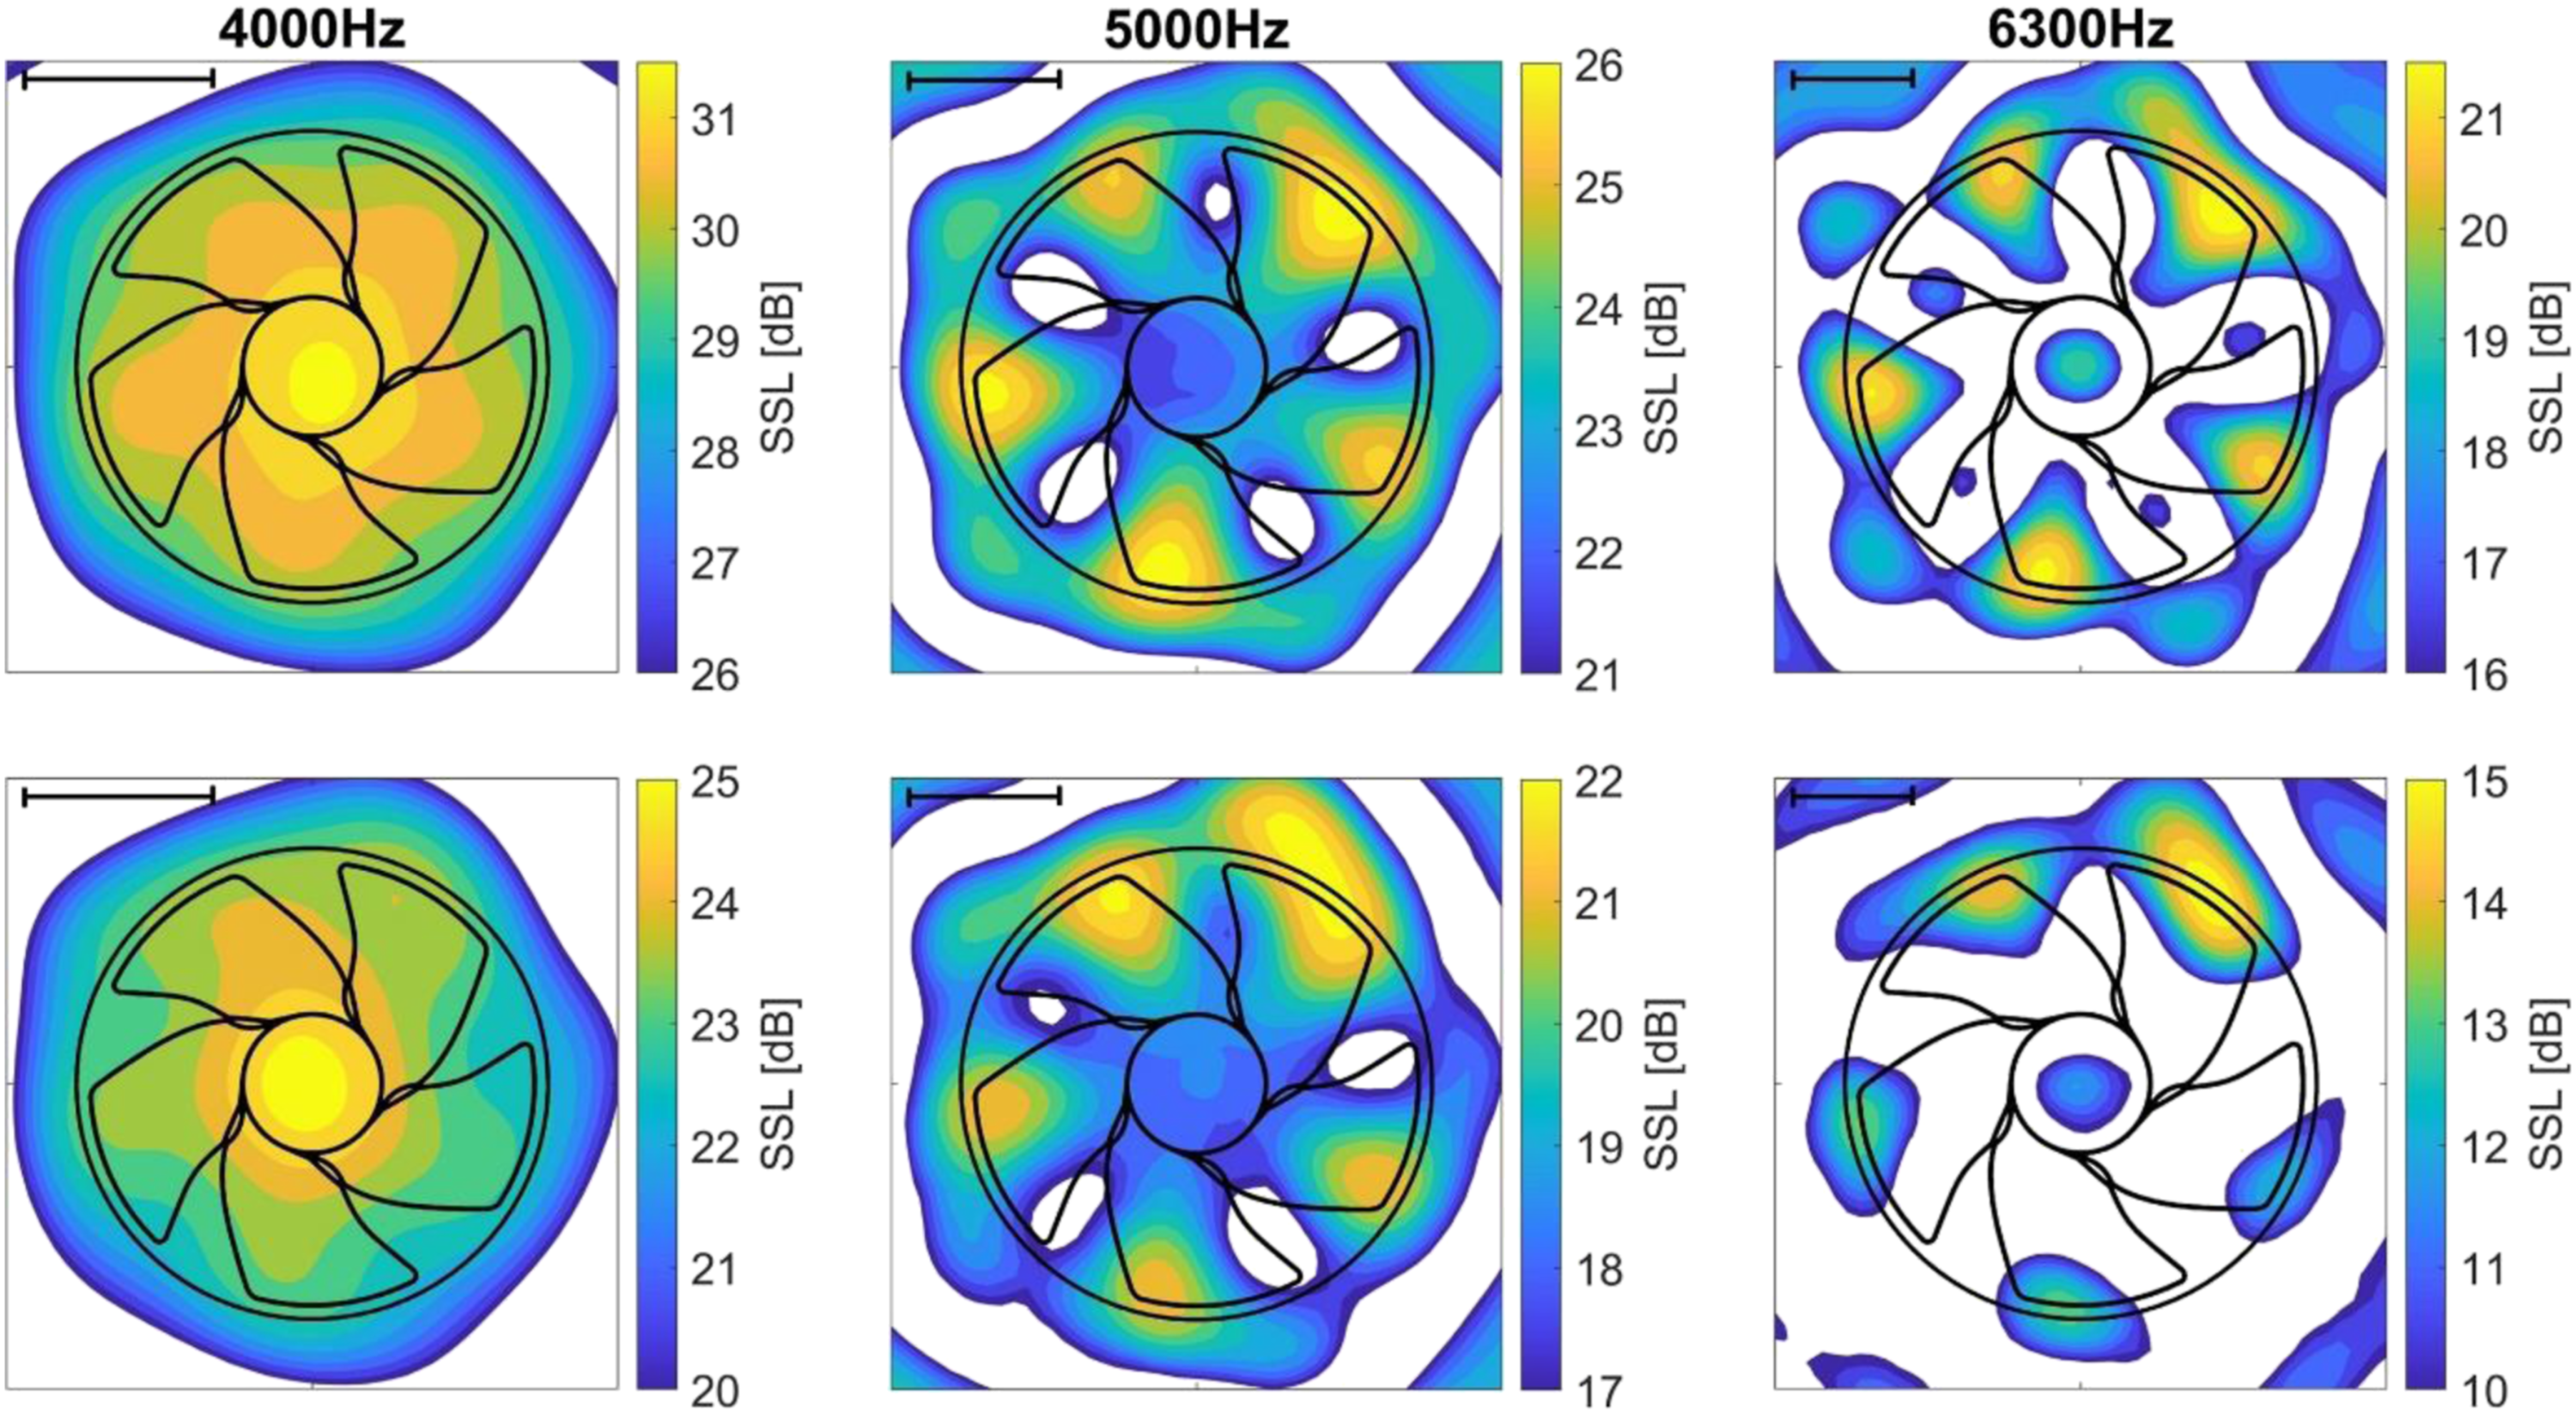
Due to the vast amount of results, the conclusions are presented for the highest rotational speed only (1400 r/min). Nonetheless, the presented results can be considered representative. The sound source maps are shown for third-octave bands of mid-frequencies of 4–6.3 kHz because at these frequencies, the resolution of the beamforming is high enough for adequate evaluation, and the sidelobes of the beamforming do not yet appear. The theoretical resolution of the beamforming algorithm according to the Rayleigh criterion (the theoretical smallest distance for which two sound sources can be distinguished) is indicated for each source map in the top left corner of the figures. The sound source maps are presented with a 5 dB dynamic range.
Although sound source maps are extremely useful for localizing the dominant sound sources, they are unable to identify the sound source mechanism undoubtedly. Therefore, the purpose of the evaluation is not to determine the major noise mechanisms conclusively but to show the applicability of the combination of the ATD and the ROSI method.
Figures 9 and 10 show the sound source maps for all investigated operating points for the upstream and downstream measurements, respectively. Based on the operating condition of the fan, the figures can be categorized topologically into three groups for both measurement setups. Firstly, the case of highly throttled fan operating condition (Φ = 0.05) stands out topologically as the fan is in the deep stall region of operation at this point. For the lowest investigated flow rate, the sound sources cannot be distinguished for the rotor blades, and either the motor noise or the noise generated by the large separation around the hub is dominant for all frequency bands for the upstream measurement. Also, a dispersed sound source distributed over the whole rotor geometry is localized, corresponding to the deep stall on the suction sides of the fan blades. As for the downstream measurement with the ATD, the sound sources corresponding to each blade can be clearly observed. In the third-octave band of mid-frequency of 4 kHz the leading edges of the blades are the dominant sound sources, while, at 5–6.3 kHz mid-frequencies the leading edge blade tip becomes the prevailing source with the motor noise increasing. Herold et al
8
presented similar results for a forward-skewed fan operating in the stall region. For our measurements, some of the blade tip sound sources appear outside of the ostensible blade tip radius. Similar radial shifts were experienced in the case of in-line PAM measurements as well (see Figure 7), although this effect may have been increased by the off-axis measurement layout. Sound source maps for upstream measurements. Sound source maps for downstream measurements.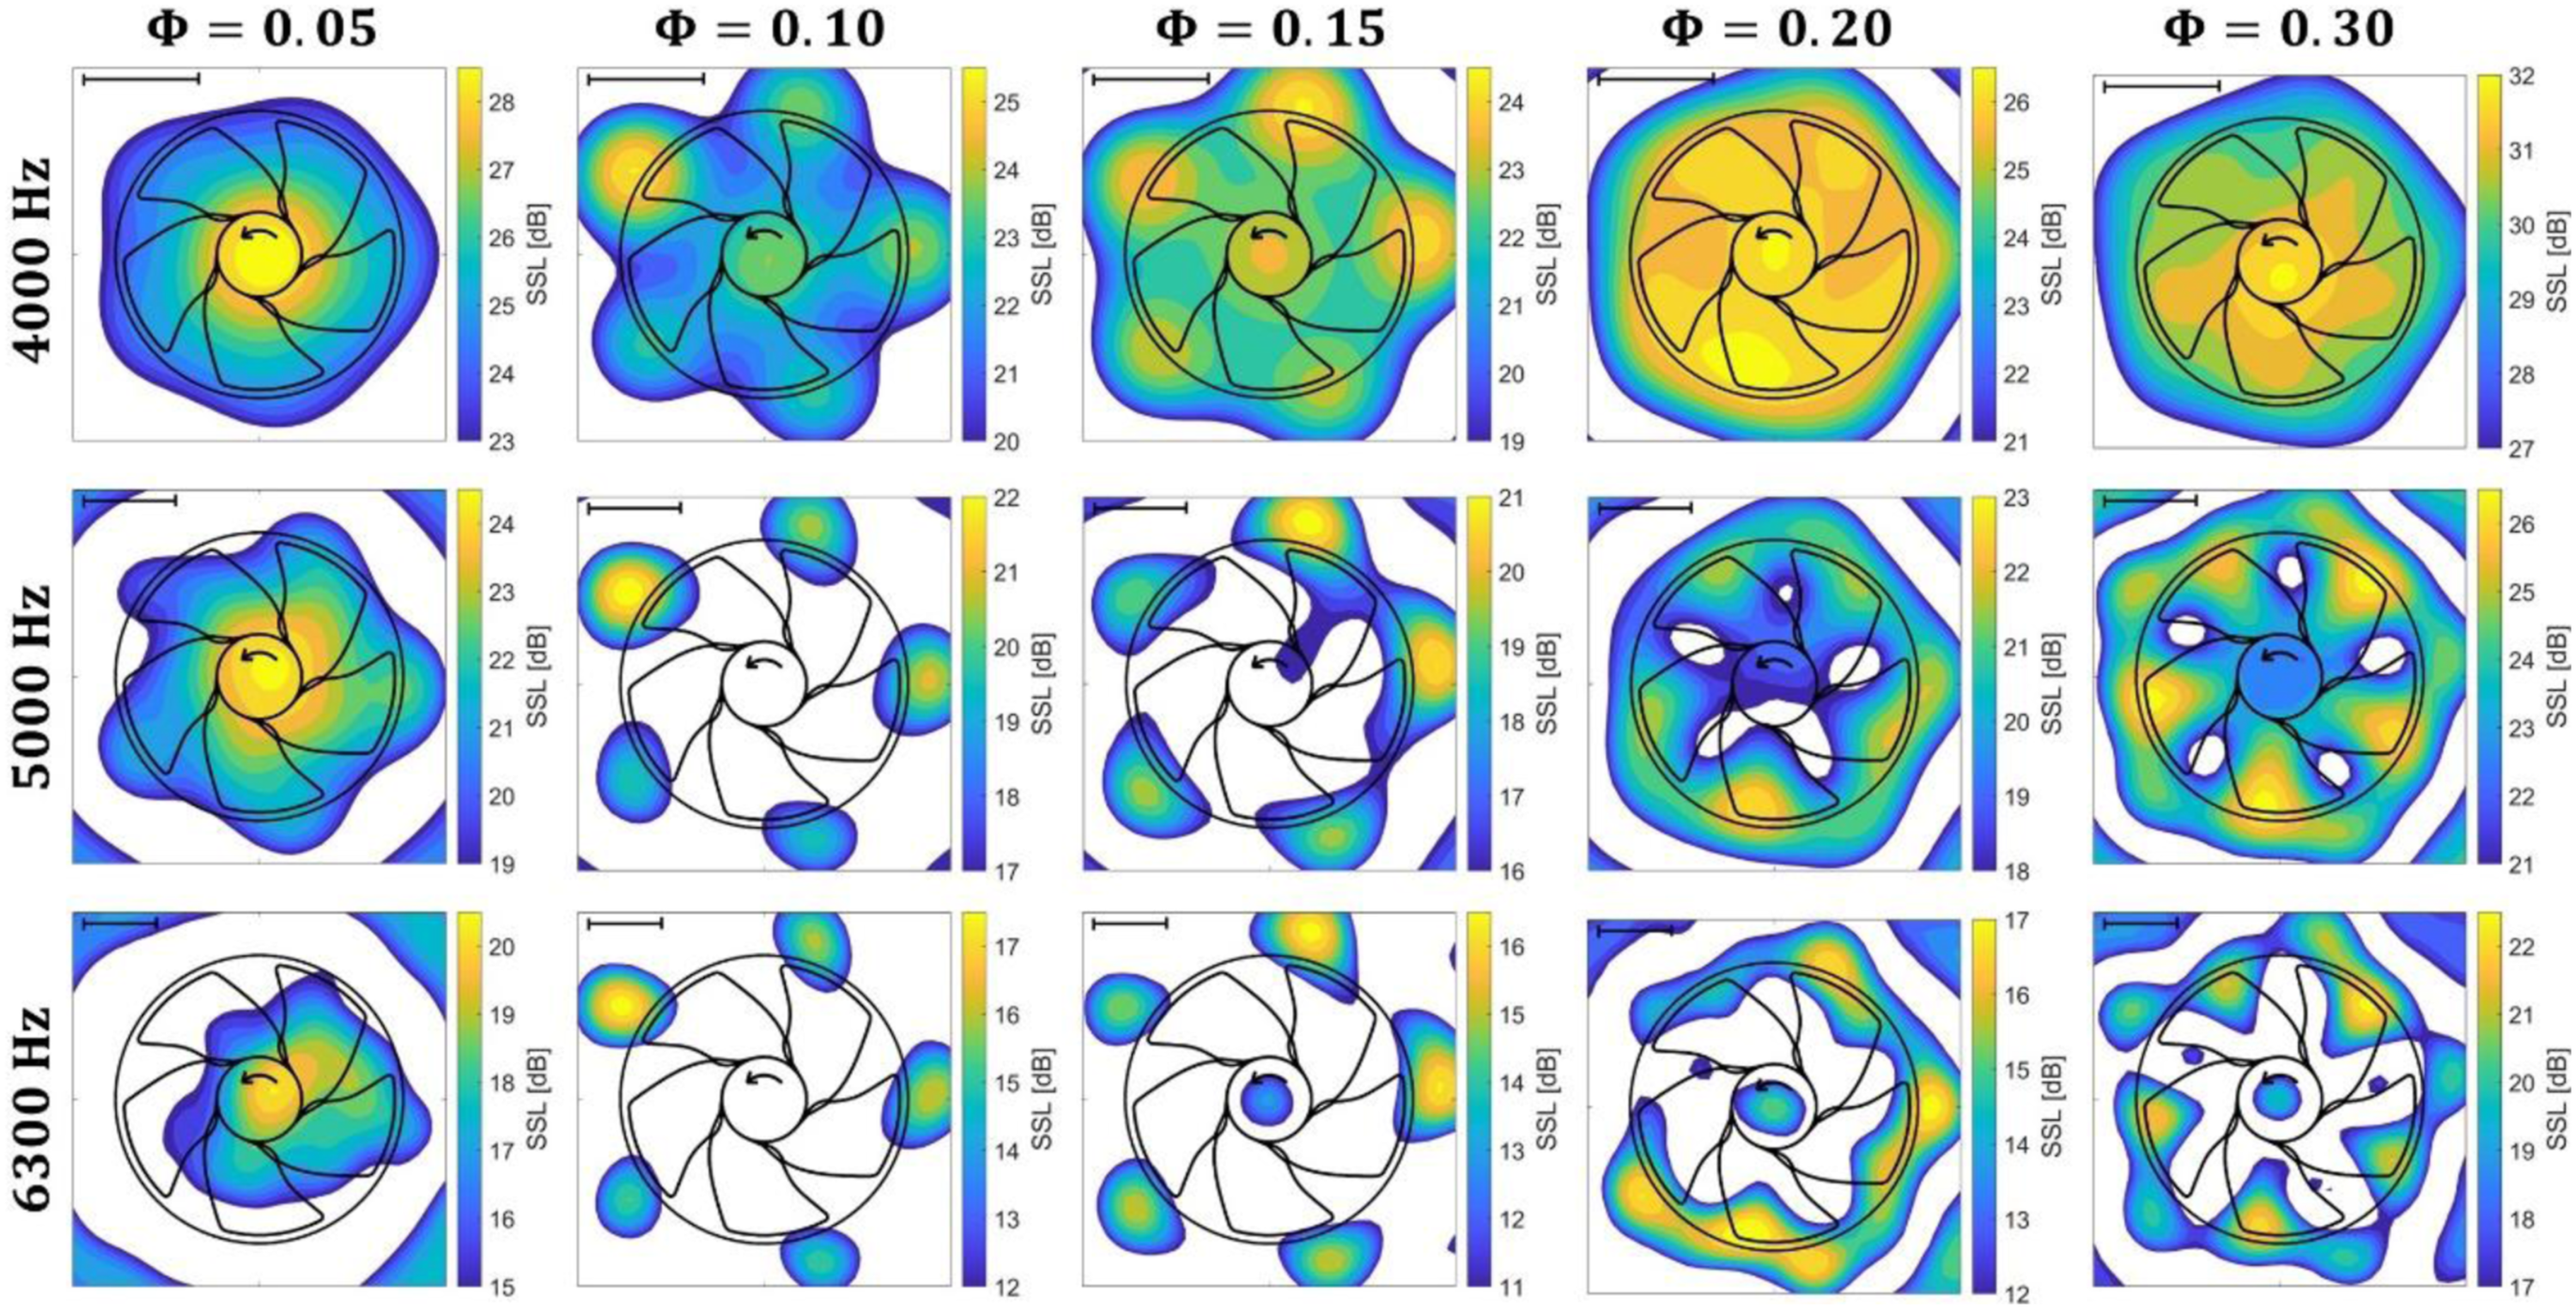

The second topological group consists of the cases corresponding to the pre-stall operating condition of the fan, which is the two investigated medium-flow rates: Φ = 0.10 and 0.15. Both of these cases show dominant blade tip leading edge sound sources for all frequency bands. Both upstream and downstream measurements predict sound sources at slightly larger radii than the ostensible blade tip radius at 5 and 6.3 kHz nominal center frequency. Also, at the highest investigated frequency band for the downstream measurements, the blade tip sound sources become elongated in the circumferential direction, which suggests considerable blade tip trailing edge sound sources. This effect is likely to be connected to the tip leakage flow phenomenon. At 6.3 kHz, downstream measurements indicate significant sound sources located near the hub. As the sound source occurs only for the downstream measurements and in the case of highly throttled operating points it is likely related to annular separation around the hub near the base of the blades and downstream separation caused by the wake of the hub. 27
Finally, the third topological group of cases is the investigated two highest flow rate operating points: the design condition (Φ = 0.20) and the part-load operating condition (0.30). For these cases, the downstream measurements indicate dominant blade tip leading edge sound sources for all investigated frequency bands with increasing motor noise at higher frequencies. On the other hand, upstream measurements are inconclusive at the mid-frequency of 4 kHz as the five blade-related sound sources cannot be separated, and a distributed sound source over the whole rotor geometry is localized. At the mid-frequency of 5 kHz, the dominant sound sources can clearly be identified as they are slightly elongated in the circumferential direction and are shifted towards the blade tip trailing edge. Furthermore, at the 6.3 kHz third-octave band, the sound sources separate to both blade tip leading edge and trailing edge sound sources; thus, ten major noise sources appear on the source maps. This corresponds well with previous reports of PAM measurements of axial fans carried out from the upstream direction. Zenger et al 9 located both leading edge and trailing edge sound sources in the 5–8 kHz frequency range for an unskewed axial fan operating in the design and part load conditions. Furthermore, Herold et al 8 also reported dominant sound sources at the blade tip leading edge proceeding to the blade center at the design condition for a forward skewed fan. However, the reason why this shift appears exclusively in the case of upstream measurement in the present investigation is unclear. In addition, previous studies 14 suggested dominant leading edge sound sources in the case of short-tapered entry geometry in a free inlet free outlet setup. Thus, the duct has a flow-related or acoustic effect, which causes the dominant blade tip trailing edge sound source in the source maps in the case of upstream measurements. Determining the exact cause of the phenomenon requires further investigation.
Generally, it can be said that starting from the lowest flow rate, the radiated sound power level decreases as the flow rate increases up to Φ = 0.15. From that point on the sound power level increases as the throttling decreases while the highest flow rate generates the highest sound pressure level.
Comparing the upstream and downstream measurements further conclusions can be drawn. In most cases, the dominant noise sources are the blade tip leading edges, which conform to previous studies where the fan was investigated in an unducted arrangement.14,21 The exceptions from this are the two highest flow rate cases (Φ = 0.20 and 0.30) measured from the upstream. As previously stated, the cause of this difference is not yet clear.
Furthermore, minor asymmetry in the fan construction can be observed for the pre-stall operating condition cases (second topological group, Φ = 0.10 and 0.15) as the same rotor blade is the primary sound source in both upstream and downstream measurements. For example, this phenomenon can be detected in the cases of the Φ = 0.10 at all frequency bands and Φ = 0.15 at the 5 kHz frequency band.
Summary
In this paper, a ducted low-speed axial flow fan is investigated with the acoustically transparent duct (ATD) and the phased array microphone (PAM) Rotating Source Identification (ROSI) beamforming techniques at design and off-design conditions. It was shown that the combination of these methods is capable of localizing the dominant sound sources of the fan in a non-intrusive approach at design and off-design operating conditions as well. When comparing the sound source maps, similarities and differences were established, both in terms of the upstream and downstream sides, as well as the different working points. • At stall operating condition, the deep stall region over the rotor blades was localized. Also, a dominant sound source associated with annular hub separation and hub wake was revealed. • At pre-stall conditions, the blade tip leading edges were determined to be the prevalent sound sources for both upstream and downstream measurements. This effect is likely to be associated with the tip leakage flow phenomenon. • The design and part-load operating conditions showed different results in terms of sound source maps. Downstream measurements showed predominant blade tip leading edge sound sources which corresponded well with our expectations based on previous studies while upstream measurements indicated blade tip trailing edge noises as well similar to results reported in the literature. Thus, the duct has a flow-related or acoustic effect, which is unclear at the moment, further investigation is required for determining the exact cause of the phenomenon.
The end result is that, based on the case study, the ATD measurements can also be used for beamforming with the ROSI algorithm (the five blades separate from each other in most sound source maps). It was also shown that by the application of the duct, the dominant sound sources change compared to the unducted assembly.
Due to the off-axis nature of the measurement, quantitative evaluation cannot be performed. Also, it is important to keep in mind that the ducted measurement suffers from both unwanted reflections and specific duct modes developing in the downstream duct. Some of these obstacles will be tackled by applying an annular phased array microphone instead of the planar array.
Footnotes
Declaration of conflicting interests
The author(s) declared no potential conflicts of interest with respect to the research, authorship, and/or publication of this article.
Funding
The author(s) disclosed receipt of the following financial support for the research, authorship, and/or publication of this article: This work was supported by the Ministry of Innovation and Technology of Hungary (TKP2021 BME-NVA-02) and Hungarian National Research, Development, and Innovation Centre (K 129023).
