






Abstract
This study investigated the use of trailing edge serrations to reduce the noise generated by axial-flow automotive cooling fans. Three different serration profiles (sinusoidal, rectangular, and triangular) were examined, with the profiles being extended radially along the entire blade length and truncated at half the blade length while keeping the dimensionless wave number k∗ and wave amplitude 2h∗ constant. The simulations employed a hybrid URANS-LES solver for the flow field and Ffowcs Williams-Hawkings analogy for the sound field, corresponding to the maximum volumetric flow rate and fan rotational speed. Acoustic pressure measurements were taken at multiple receivers upstream and downstream of the fan, and the overall sound pressure level was computed based on the results. Furthermore, the study also compared the aerodynamic performance of all serration types with the baseline fan, revealing that the baseline fan was relatively more efficient than their serrated counterparts. Despite the reduced efficiency, the trailing edge serrations offered significant noise reduction benefits of up to 10 dB, making them a promising solution for improving acoustic comfort in automotive cooling systems.
Keywords
Introduction
In most industrial fan systems, aerodynamic, electromagnetic, and mechanical sources are the three primary factors in overall noise generation. The order given indicates their relative significance, with mechanical noise becoming a growing concern for equipment at the extremes of the size range. Aerodynamic noise usually suppresses electromagnetic noise, such as that produced by an electric motor. Cory
1
categorizes aerodynamic noise sources within a fan into the following groups: • Thickness noise: Caused by blades moving through the air. • Torque and thrust: Noise produced by blades crossing a fixed point, such as cut-off. • Vortex shedding: Induced by flow separation from the blades, which is a Reynolds number dependent phenomenon.
2
• Noise from air turbulence: Created by shear forces around the stall point of the blades.
3
• Pulsation noise: Caused by a regular change in flow rate at high system pressures. • Noise from turbulent wakes interacting with obstructions.4,5
The fan produces both pure tones (discrete frequencies) and a broadband (random) component of aerodynamic noise. The discrete component is generated by blade rotation and is frequently referred to as rotational noise. Thickness noise occurs when a passing blade displaces a volume of air periodically, creating sinusoidal pressure fluctuations based on its thickness. On the other hand, loading noise is generated by an acoustic disturbance induced by unsteady fluid forces. 6 The phase velocity of these unsteady blade forces is often significantly larger than the corresponding tip speed and may even exceed the speed of sound. 7 As a result, the unsteady blade forces have very high acoustic radiation efficiency, leading to the creation of tonal noise at the blade passing frequency (BPF) and its harmonics. The BPF is defined as BPF = n b N/60, where n b is the number of blades and N is the rotational speed of the fan in r/min. Additionally, the thickness and loading noise follow monopole and dipole distributions, respectively. Nonlinear effects produce quadrupole noise only when blades rotate at high speeds.8,9
A well-designed fan system generates noise primarily due to the vortex shedding off the rear ends of the fan blades, such as at the trailing edges. This type of noise source acts as a dipole and is usually broadband along with some discrete frequencies. Furthermore, the turbulent boundary layer on the blade surface can also cause pressure fluctuations, leading to noise generation. Investigations have revealed that this noise source is insignificant compared to noise from inflow turbulence and the trailing edge.3,10,11
Despite the development of basic principles of fan acoustics, reducing noise in specific fan systems remains an ongoing challenge. Lighthill 12 developed a seminal theory for aerodynamic noise generation based on acoustic analogies with turbulent jets. This revolutionary framework formed the basis for modern aeroacoustic research. Building on Lighthill’s theory, Ffowcs Williams, J. E. and Hawkings, D. L. 13 generalized the acoustic analogy formulations to account for solid surfaces in an arbitrary motion. Their model enabled the prediction of noise from moving bodies and rotating machinery. This more comprehensive theory was a breakthrough in modeling noise from fans and propellers. 14 The acoustic analogy of Ffowcs Williams and Hawkings is known as the FW-H model. It relates the turbulent flow field statistics to acoustic sources on solid boundaries. The FW-H equations are solved by integrating over the surface of noise-generating components like fan blades. This surface integration approach has become a standard technique in computational aeroacoustics.
Sound absorption is often regarded as the most reliable and effective method of noise reduction, although this is not always the case with certain applications. However, researchers have focused most of their efforts on investigating a variety of passive flow control techniques to reduce fan noise through geometric modifications to the blades. One method explored has been the addition of vortex generators to the suction surface of fan blades. Longhouse 2 examined the noise reduction potential of vortex generators that created streamwise tip vortices. These vortices energized the boundary layer, disrupting the interaction between the turbulent wake and the blade, which generates rotational noise. The vortex generators were able to attenuate noise without compromising fan efficiency. Another approach has been the use of biologically inspired ribbed ridges on blade surfaces, studied by Wang et al. 15 These ridges acted as vortex generators to control boundary layer separation and wake turbulence interaction with the blade. This bio-inspired technique achieved noise reduction while preserving fan performance. Significant research has focused on leading and trailing edge serrations for attenuating fan noise arising from wake and inflow turbulence. Biedermann et al. 16 found both leading and trailing edge serrations effective for reducing noise by controlling flow separation. Chong and Dubois 17 showed that trailing edge serrations decreased vortex shedding and turbulence inflow noise. Czwielong et al. 18 optimized the serration geometry and angle to maximize noise reductions. Lee et al. 19 determined optimal leading edge serration sizes to attenuate inflow turbulence noise. Nath et al. 20 demonstrated that trailing edge serrations attenuated high-frequency noise. Tang et al. 21 varied leading edge serration amplitude and showed increasing noise reduction. The studies found that serrations targeted noise sources like wake turbulence and inlet turbulence interaction with the fan blades. In general, the passive flow control methods created streamwise vortices that prevented boundary layer separation and wake development. This disruption of the noise generation mechanisms of wake-blade and inflow-blade interactions led to noise attenuation. The vortex generators, ribbed ridges, and serrated edges were able to attenuate fan noise without compromising efficiency or performance.
This study aims to investigate the aerodynamic and aeroacoustic characteristics of an automotive cooling fan and evaluate the effectiveness of different trailing edge serration profiles in reducing noise levels. Through comprehensive numerical analyses of various serrated fan designs, this work seeks to enhance understanding of the complex aerodynamic and acoustic phenomena associated with serrated blades.
Axial flow automotive cooling fan
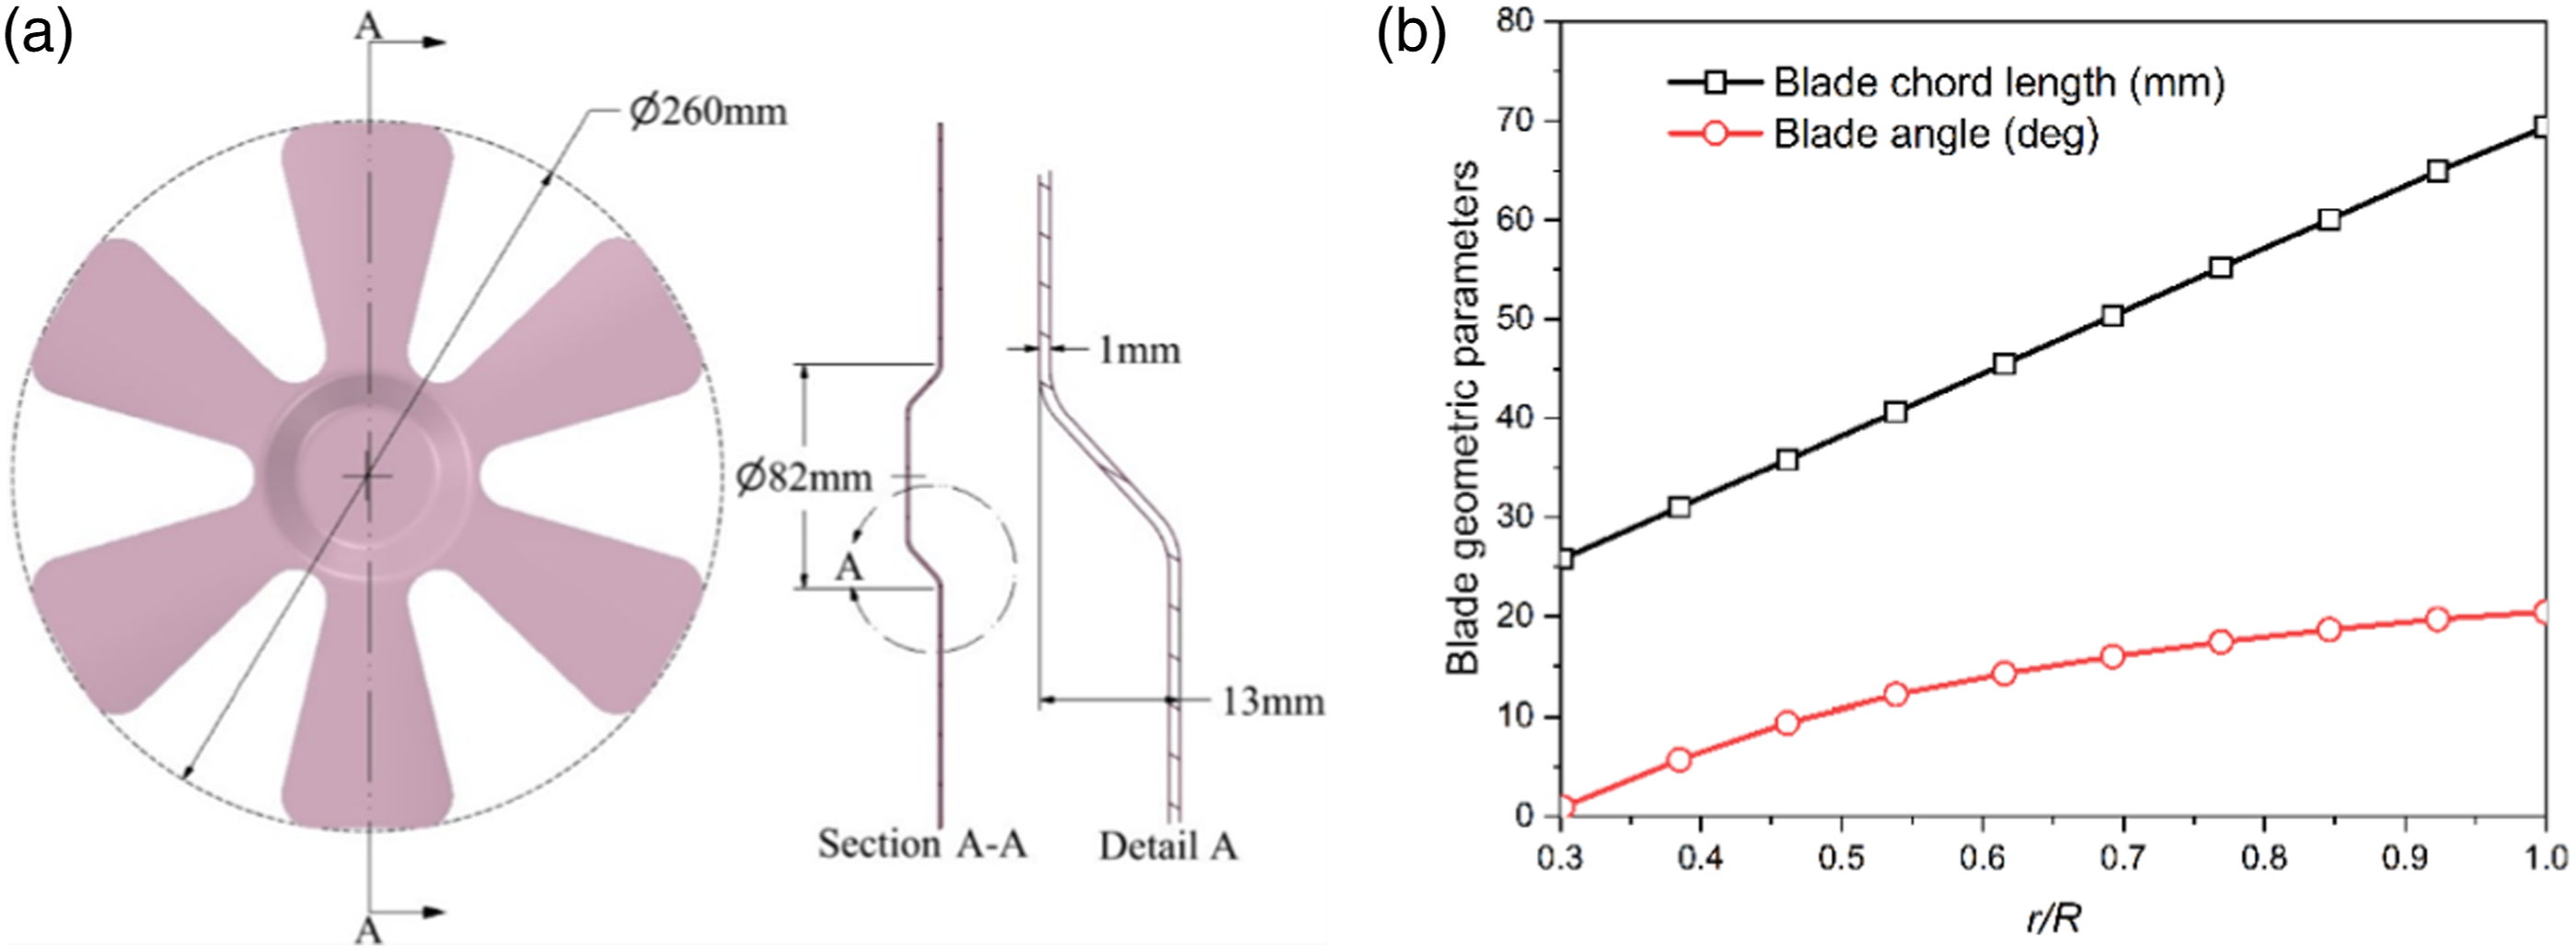
The baseline fan22,23 consists of six blades with a flat plate cross-section, each being 1.0 mm thick. It has a maximum diameter (D) of 260 mm and operates at speed ranging from 300 r/min to 3000 r/min in an anticlockwise direction when viewed from the front end. Figure 1 illustrates the dimensional and graphical representation of the baseline fan and blade parameters. (a) Schematic illustration of main dimensions of baseline fan, and (b) graphical representation of blade chord length and blade angle as a function of dimensionless blade radius.
22
The study involves simulations of six unique fan blades to investigate the impact of various trailing edge serration profiles on fan noise reduction. These profiles consists of full and half sinusoidal, full and half rectangular, and full and half triangular serrations, as illustrated in Figure 2. Serration profiles are characterized by two dimensionless parameters: the wave number Geometry of different fan blades, (a) full sinusoidal (Fan1), (b) half sinusoidal (Fan2), (c) full rectangular (Fan3), (d) half rectangular (Fan4), (e) full triangular (Fan5), and (f) half triangular (Fan6).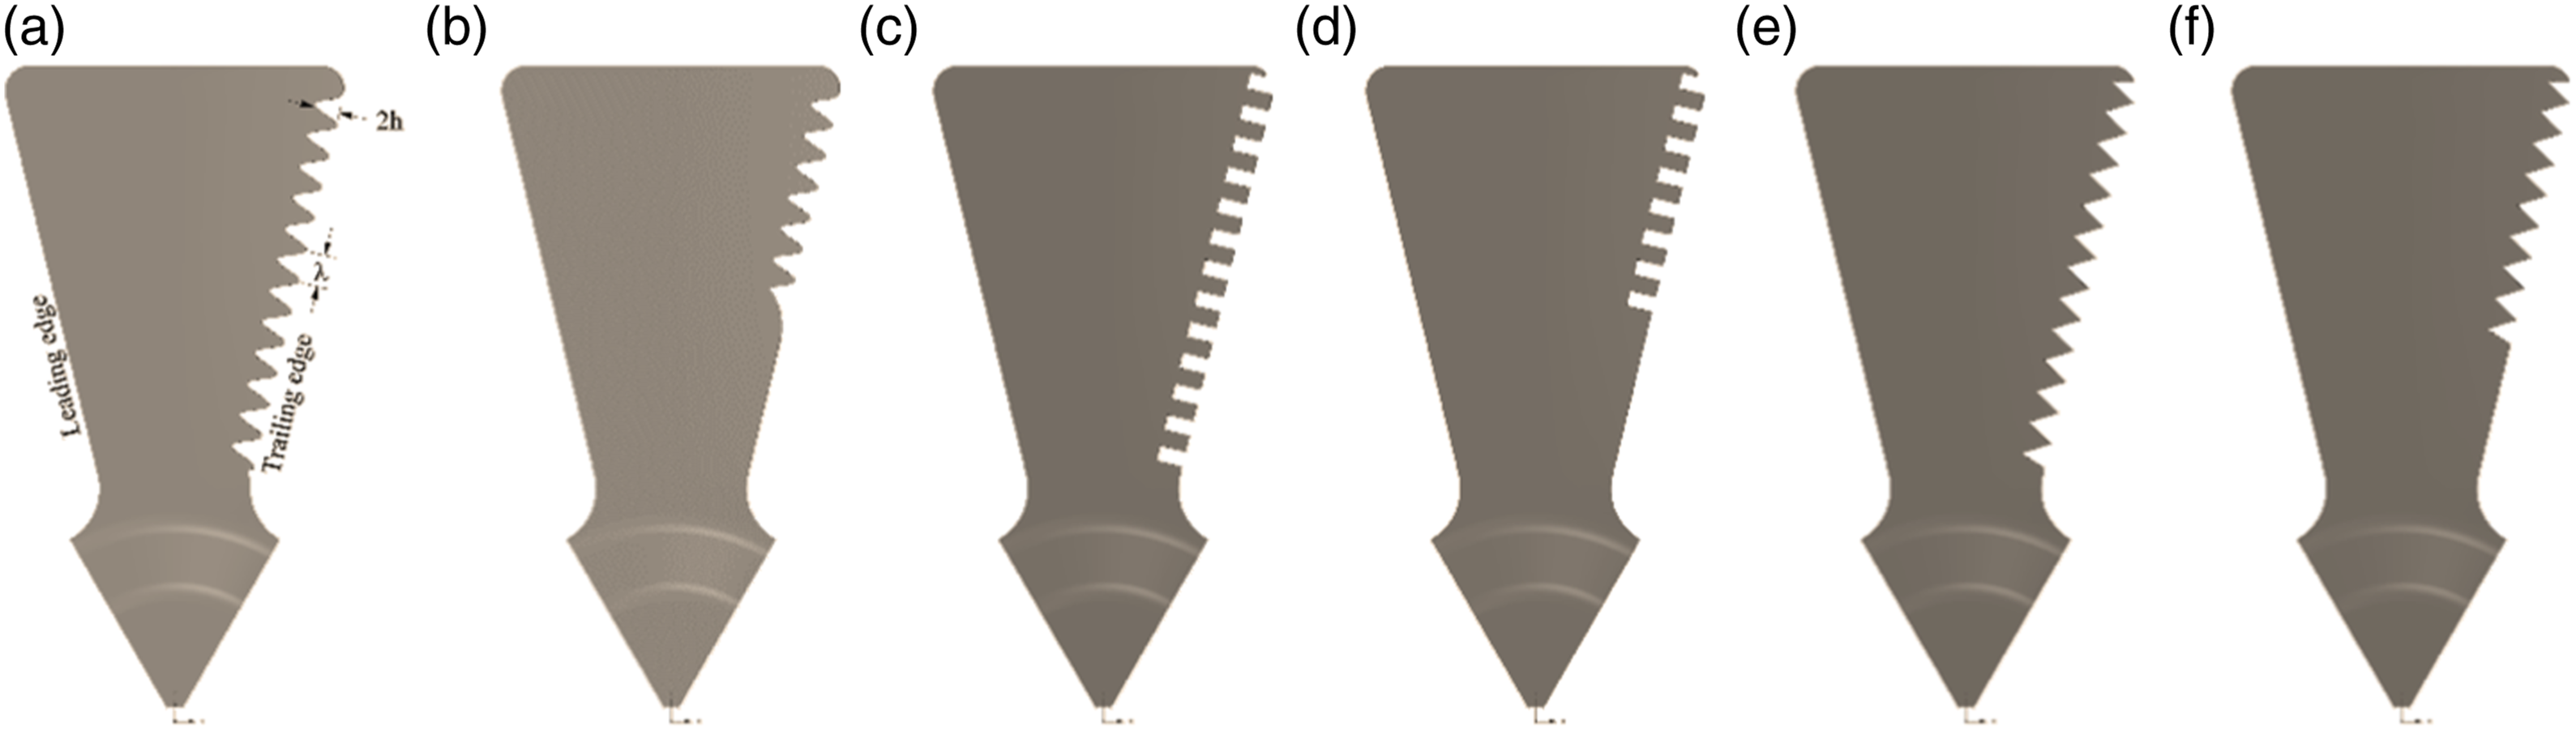
Numerical methodology
The present study investigates noise generation and propagation from the baseline and serrated fan blades using Ansys Fluent, a commercially available finite volume-based computational fluid dynamics solver. The analysis employs a hybrid URANS-LES approach comprising of two main steps:
First, the flow field is modeled by numerically solving the unsteady Navier-Stokes equations. For this, the k-omega SST turbulence model is utilized in the URANS formulation to provide closure. 24 Additionally, a stress-blended eddy simulation (SBES) technique is implemented in conjunction with a wall-adapting local eddy viscosity (WALE) subgrid-scale model in the LES context.25,26 The SBES approach functions as a URANS model near walls and transitions to LES away from surfaces. This hybrid URANS-LES methodology aims to acquire a high-fidelity representation of the intricate flow physics.
Subsequently, the FW-H acoustics analogy model is employed to simulate sound propagation within the computational domain. The FW-H methodology utilizes the simulated flow field data from the preceding step as input to predict the resulting noise patterns and directivity. Specifically, the FW-H integral formulations account for thickness, loading, and quadrupole noise sources by establishing analogies between the turbulence hydrodynamics and acoustics.13,27
Acoustics prediction methodology
The prediction of noise generation and propagation from the axial cooling fans relies on a hybrid computational approach using the FW-H analogy. The FW-H equation establishes an analogy between turbulent flow motion and acoustic sources to predict the propagation of sound from arbitrary surfaces and flow fields. The FW-H formulation is given by equation (1):
The terms on the right-hand side of the FW-H equation represent three main noise source contributions: thickness, loading, and quadrupole sources. The thickness source arises from the displacement of fluid as the blade moves through it. The loading source accounts for the unsteady forces exerted on the fluid by the blade surface. The quadrupole source represents nonlinear propagation effects.
The FW-H equation requires flow field data, including velocity, pressure, and turbulence quantities as inputs to compute the thickness, loading, and quadrupole acoustic source terms. These flow variables are obtained from high-fidelity scale-resolving simulations of the fan flow field. The FW-H equation is solved by integrating over the fan blade surfaces, which act as acoustic sources. These solid surfaces are discretized into mesh elements to enable numerical integration. The unsteady flow data is interpolated from CFD solutions onto the fan blades. Finally, the integrated acoustic pressure signals are stored at various observer points and post-processed to obtain the overall sound pressure levels.
Computational domain and boundary conditions
The computational domain employed for the aeroacoustics analysis comprises two distinct zones: a stationary exterior region containing the far-field flow and an enclosed rotating region coincident with the blade span. An arbitrary sliding interface is implemented between the stationary and rotating zones to facilitate interpolation of flow variables (Figure 3). Computational domain and boundary conditions.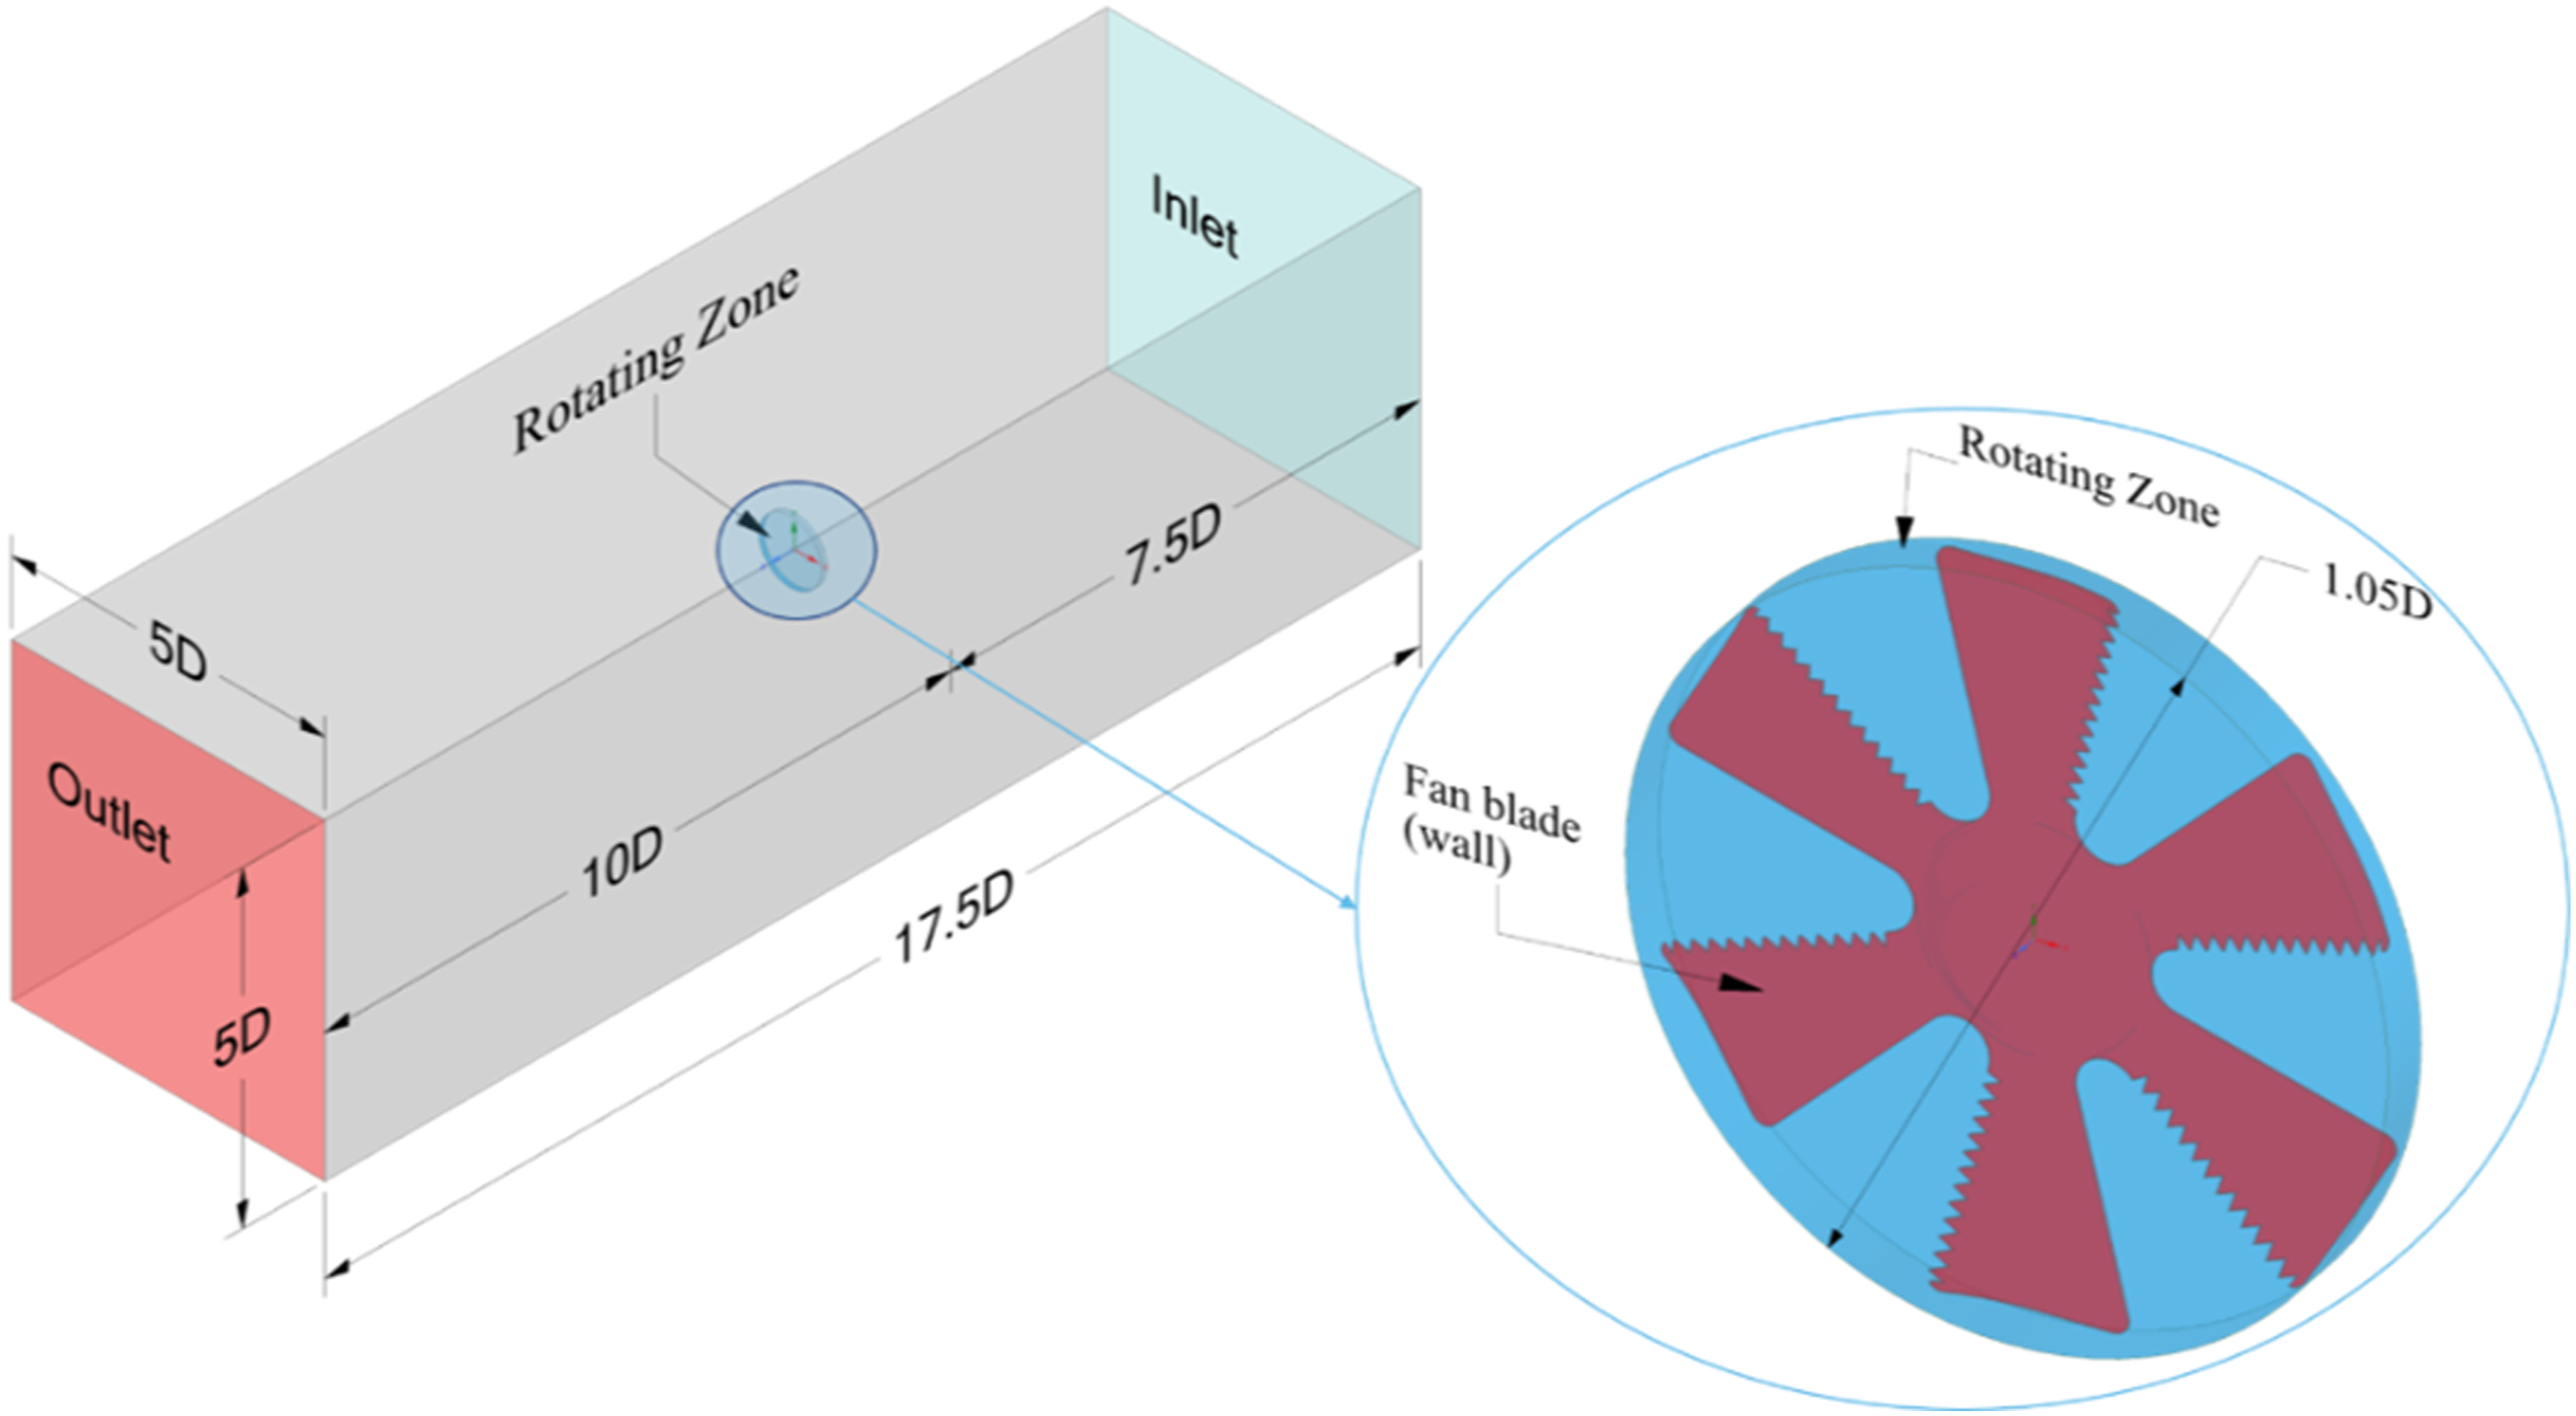
The inlet boundary is situated at an upstream distance of 7.5 fan diameters from the rotational axis, while the outlet is placed 10 diameters downstream. Lateral far-field boundaries are positioned at five fan diameters perpendicular to the axis. The rotating zone extends radially to 1.05 times the maximum blade radius.
Appropriate boundary conditions are imposed on the domain: a mass flow inlet is prescribed to induce flow through the fan; a static pressure outlet is defined relative to ambient conditions; slip wall conditions are applied on the lateral far-field boundaries, and a no-slip condition is specified on the rotating solid surfaces coincident with the fan blades.
The current computational model employs simple boundary conditions without special treatment for acoustics. Thus, some reflections may occur when acoustic waves from the fan interact with these boundaries. To minimize this issue, the inlet and outlet have been placed at substantial distances from the fan itself to reduce reflections impacting the key region around the fan. The current study remains valid for comparative evaluation of the different fan designs, but absolute noise levels may have minor errors due to reflections.
Computational grid and sensitivity study
Unstructured mesh generation provides greater flexibility in discretizing complex geometries, as evidenced in prior investigations.22,28 Given these advantages, the current study implements an innovative poly-hexcore meshing technique to create high-fidelity meshes around the intricately shaped fan blades. As depicted in Figure 4, polyhedral elements are utilized to discretize the blade and zone boundary surfaces, while the core volume is populated with hex-dominant cells. This novel approach enables simultaneously attaining computational efficiency and solution accuracy for the challenging fan flow simulations.
29
The poly-hexcore mesh topology thus provides rapid high-quality unstructured discretization conformed to the fan geometry. To fully resolve the viscous boundary layers, inflation layers with a geometric growth rate are applied adjacent to the blade surfaces, following the relationship in equation (3). Computational grid around the fan blade and in the fluid zones.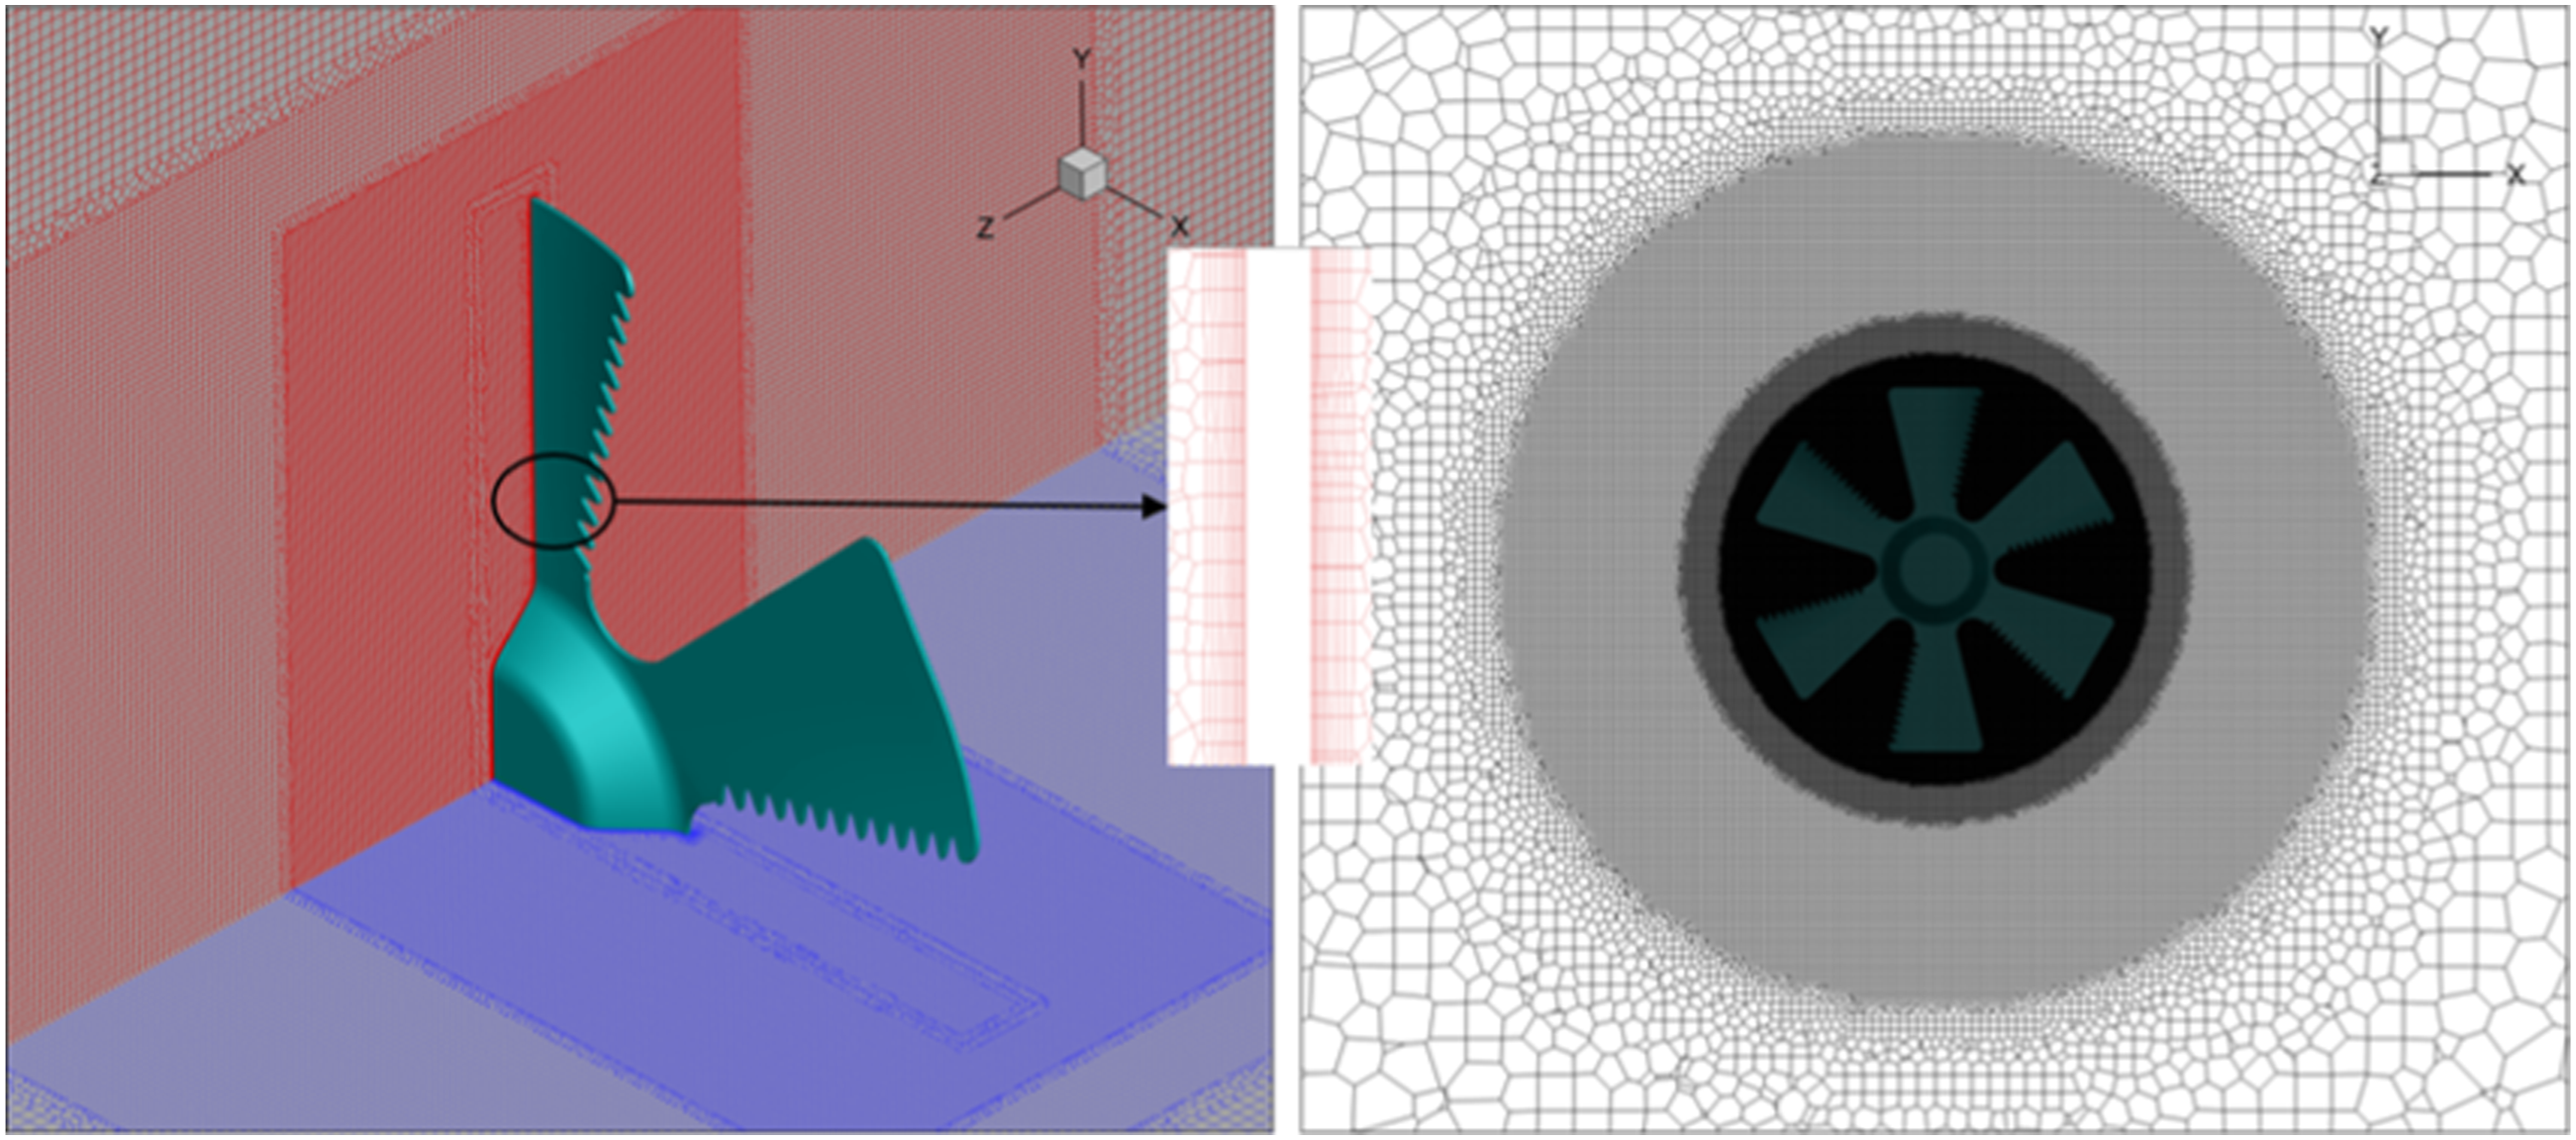
Grid sensitivity study of the baseline fan at 3000 r/min.
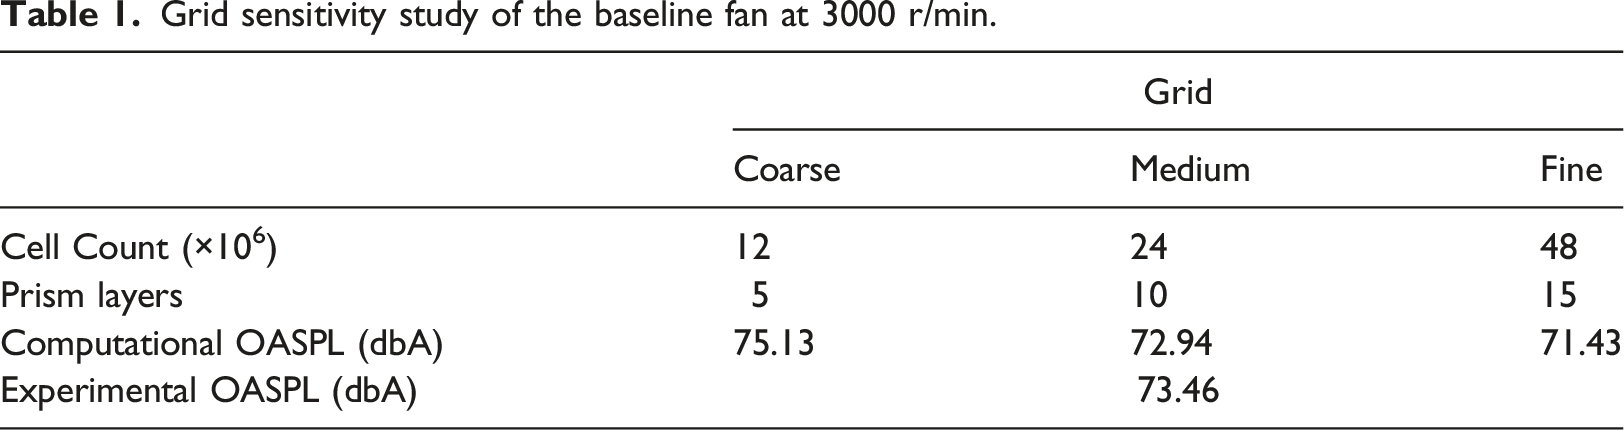
The numerical results are validated against experiments conducted on the baseline cooling fan in a semi-anechoic chamber. The fan assembly is placed at the center of the chamber to minimize acoustic reflections. A condenser microphone is positioned 1.0 m downstream from the fan outlet to record acoustic pressure data. The fan is operated at design conditions matching the computational model. The experimental overall sound pressure levels (OASPL) are compared to numerical predictions at the same microphone location to provide validation. The results show good agreement, thereby instilling confidence in the computational methodology.
Simulation setup
Statistically steady scale-resolving simulations are performed sequentially to develop the fan blade flow field for subsequent aeroacoustics analysis. Initially, the steady-state flow is obtained by solving the RANS equations employing the k − ω SST turbulence model within a multiple reference frame formulation. This approximates the time-dependent rotating blade flow by reformulating the transport equations in a relative frame of reference. The pressure-velocity coupling is addressed using a SIMPLEC algorithm to enable obtaining iteratively converged solutions. Second-order accurate numerical schemes are utilized for spatial and temporal discretizations across the transport equations.
Transient simulations are then performed using sliding mesh modeling between the rotating and stationary domains. An implicit second-order scheme with time steps equivalent to 1.0-degree blade rotation increments is implemented for temporal discretization. Periodic convergence over 20 rotations is attained.
For higher-fidelity aeroacoustic predictions, the flow field is further established using a hybrid URANS-LES turbulence approach. Specifically, a stress-blended eddy simulation model is combined with a wall-adapted subgrid-scale LES model. Identical time integration schemes are employed.
Finally, post-processing of the computational acoustics data is undertaken to evaluate the fan noise characteristics in the frequency domain. The transient acoustic pressure histories obtained at various monitors situated upstream and downstream of the blade are analyzed using spectral methods. Specifically, fast Fourier transforms (FFT) are employed to translate the time-domain signals into the frequency domain. A Hamming window is first applied to the pressure time histories to minimize spectral leakage and improve frequency resolution. The resulting power spectral density distributions provide critical information on the acoustic energy content as a function of frequency, enabling an in-depth understanding of the fan noise signatures.
Results and discussion
Fan performance characteristics
The fan performance is represented by characteristic curves that describe the change in pressure across the fan blades and the fan efficiency as a function of volumetric flow rate. Equation (4) is used to calculate the fan efficiency. Fan characteristic curves (a) fan pressure difference, and (b) fan efficiency as a function of volumetric flow rate.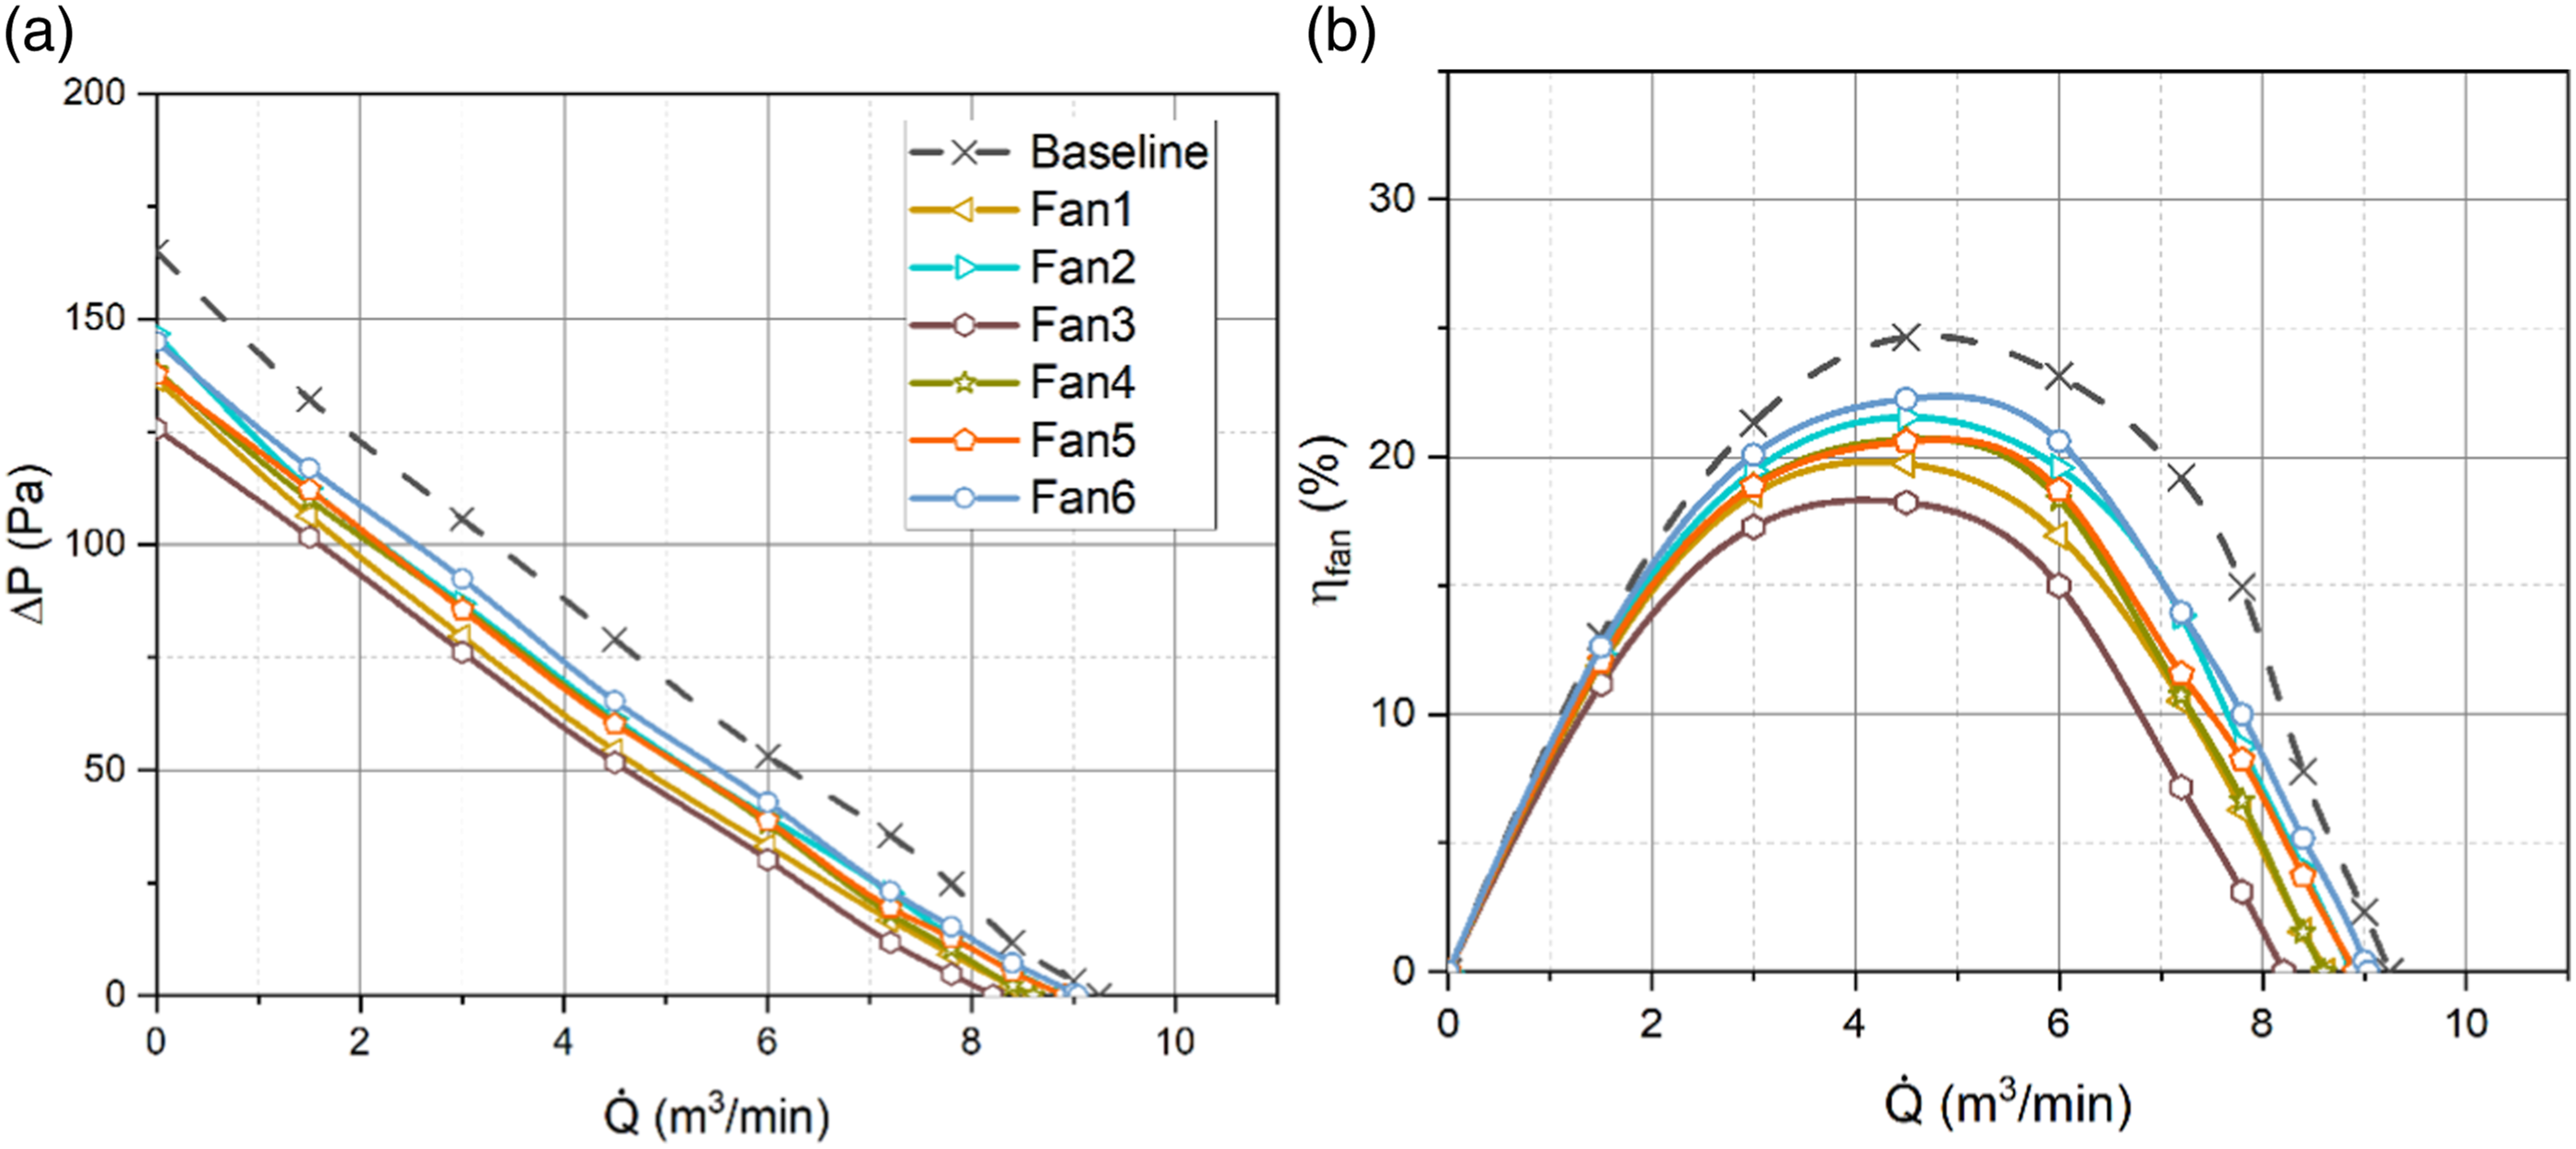
Fan acoustics
The fan blades are considered to be the main source of noise. Acoustic pressure measurements were taken at multiple receiver positions upstream and downstream of the fan in the axial direction. The coordinate system is positioned at the hub, with the negative z-direction representing the upstream, and the positive z-direction representing the downstream of the fan. Figure 6 illustrates the OASPL for both baseline and serrated fan blades, as well as the differences in OASPL between them at various receiver locations for all simulations. (a) OASPL measured at various receiver locations for both baseline and serrated fans, (b) the difference in OASPL between the baseline and serrated fans.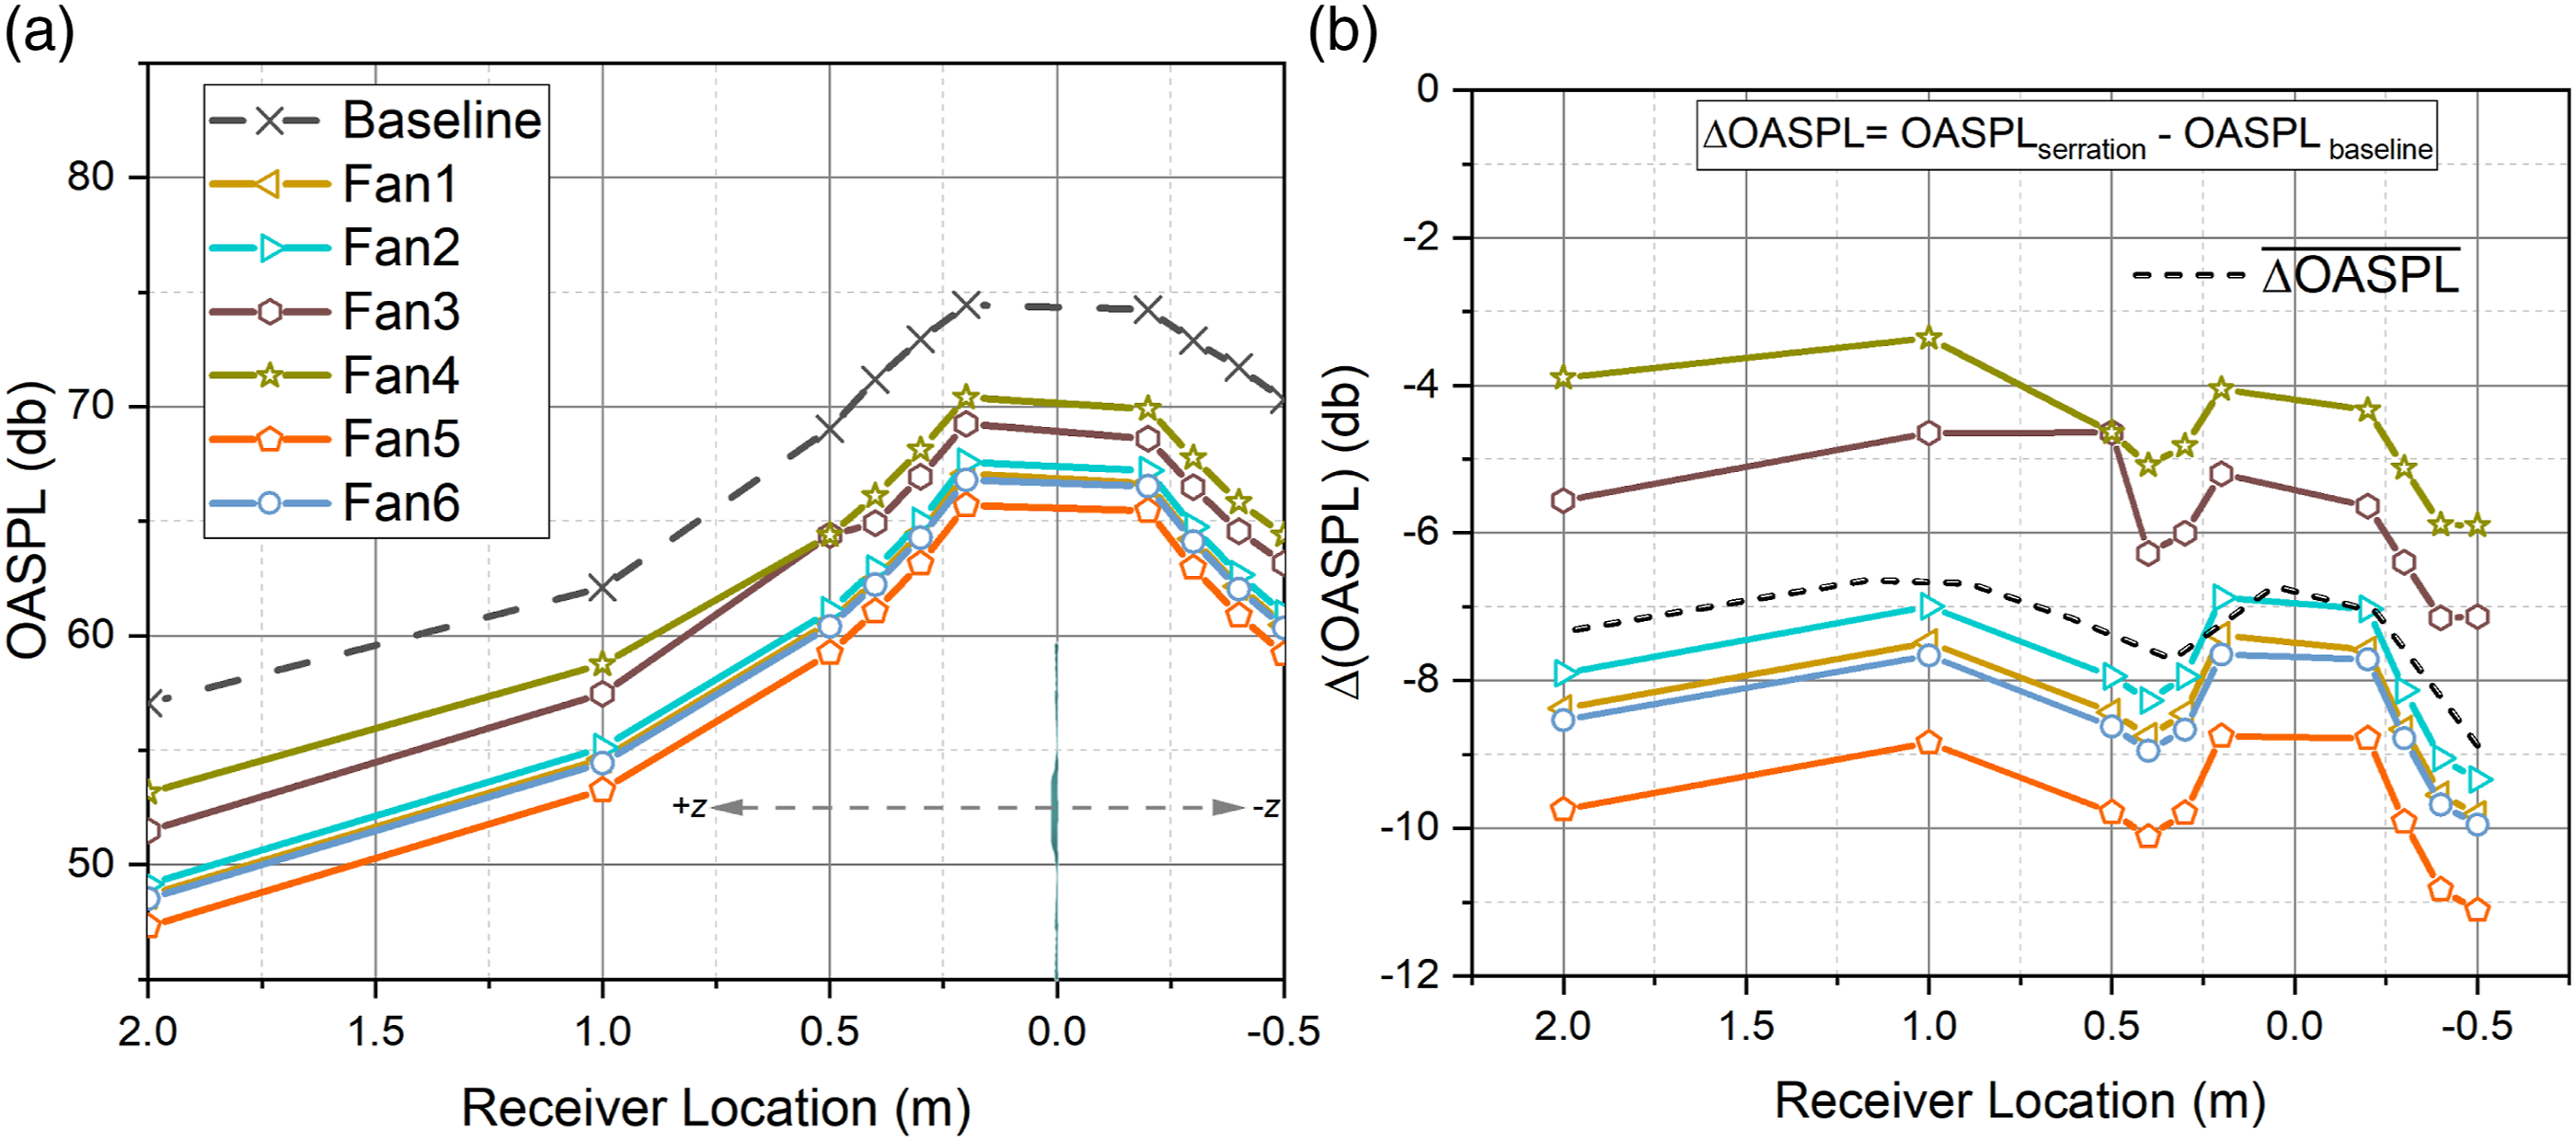
The baseline fan has the highest noise level, while Fan4 has the second-highest OASPL, and Fan5 produces the lowest OASPL at all receiver positions. Moreover, the OASPL decreases as the receiver moves farther away from the fan blade on the downstream side. Additionally, all fan types generate the same OASPL at their respective receiver locations on both the upstream and downstream sides, as shown in Figure 6(a).
Figure 6(b) illustrates the OASPL differences between the baseline and serrated fan blades, highlighting the significant impact of blade trailing edge serration profiles on noise levels and their effective attenuation. Among all the serrated fans, Fan5, which features triangular wave-based serration over the entire length of the blades, reduces noise levels from 9 dB to 11 dB depending on the receiver position, achieving a substantial reduction compared to all competitor serrated fan blades. The average OASPL reduction across all serrated fans is 7 dB.
Acoustic pressure is a fundamental quantity that describes acoustic fields and is measured at a probe placed 1.0 m away from the fan on the downstream side. The continuous sound pressure waveforms and the respective RMS sound pressure of baseline and serrated TE-based fan blades are shown in Figure 7. Serrated fans have considerably reduced sound pressure fluctuations when compared to the baseline fan, which exhibits the most pronounced fluctuations. Figure 7(a)–7(c) presents that Fan3 and Fan4 have relatively high sound pressure amplitude compared to other simulated serrated fan blades. Acoustic pressure variation of baseline and serrated fan blades, normalized with p
ref
= 20μPa.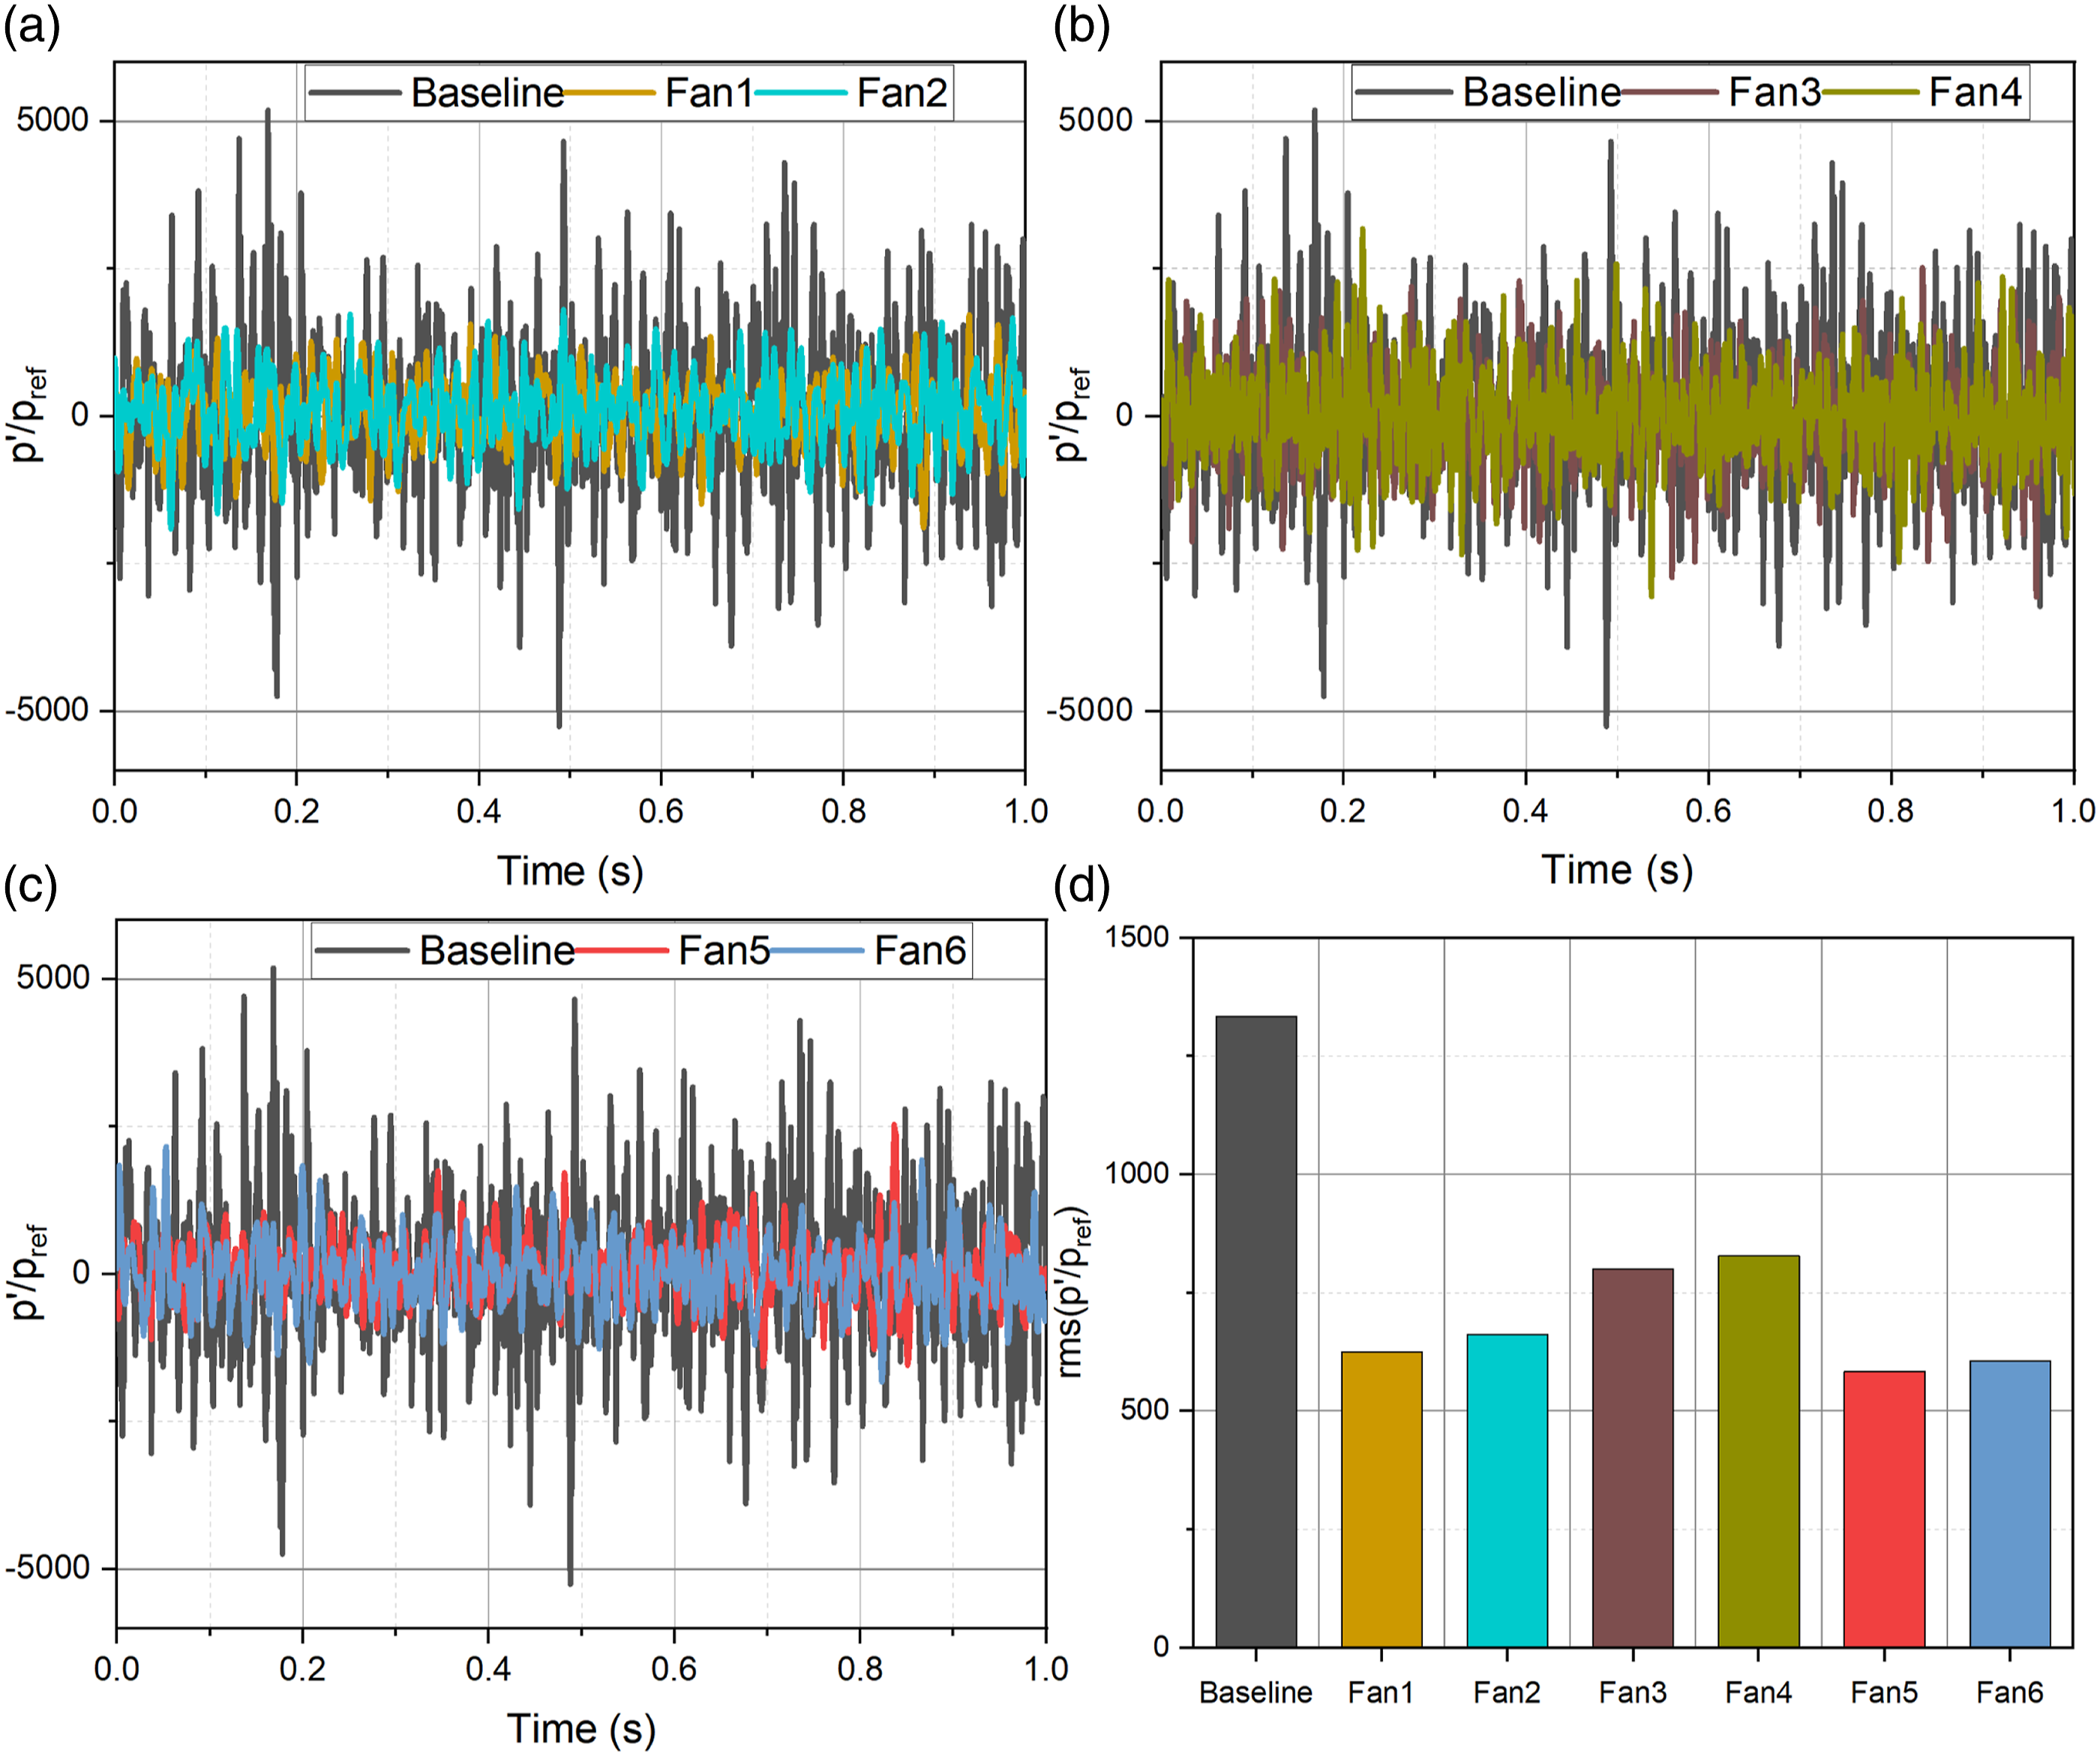
Figure 7(d) presents the RMS sound pressure of the baseline and serrated fans indicating the lowest acoustic pressure for Fan5. The RMS sound pressure of Fan5 shows a significant noise reduction, whereas larger RMS sound pressure values indicate an increased sound level. The SPL is calculated using equation (5), and the spectrum of the SPL is generated by converting time-domain SPL data to the frequency domain using a fast Fourier transformation. The SPL spectrum is computed with a frequency resolution of 10 Hz.
Figure 8 illustrates the comparison of acoustic spectra for baseline and serrated fans in terms of sound pressure level generated from the pressure signals of the microphone located three diameters away from the fan downstream. Figure 8(a) compares the SPL spectra of Fan1 and Fan2 with the baseline fan. The low-frequency components of SPL, which are less than 1.0 kHz, agree well among Fan1, Fan2, and the baseline fan, and there is no clear tonal noise peak that corresponds to BPF. Moreover, the baseline fan has a peak slightly before three times the BPF, as seen in Figure 8(a), while Fan1 and Fan2 do not have a peak at this frequency. The baseline fan may have a peak slightly before three times the BPF because the fan has non-uniform blade geometry along the span, which means that the chord length, thickness, or angle of the blades varies from hub to tip. This can cause variations in the loading and unloading of the blades as they rotate, resulting in tonal noise at slightly lower frequencies than BPF.
4
Furthermore, the acoustic energy spectra in Figure 8 demonstrate that the baseline fan generates the highest noise levels, especially at frequencies above 1.0 kHz, followed by Fan3 and Fan4 in Figure 8(b). The lowest noise energy is produced by Fan1, Fan2 in Figure 8(a) and Fan5, Fan6 in Figure 8(c). The baseline fan exhibits the highest acoustic energy levels across the spectrum, indicating it is the noisiest fan. In contrast, the serrated trailing edge fans have lower energy content, especially at higher frequencies, suggesting they produce less noise than the baseline fan. Acoustics spectrum of baseline and serrated fan blades.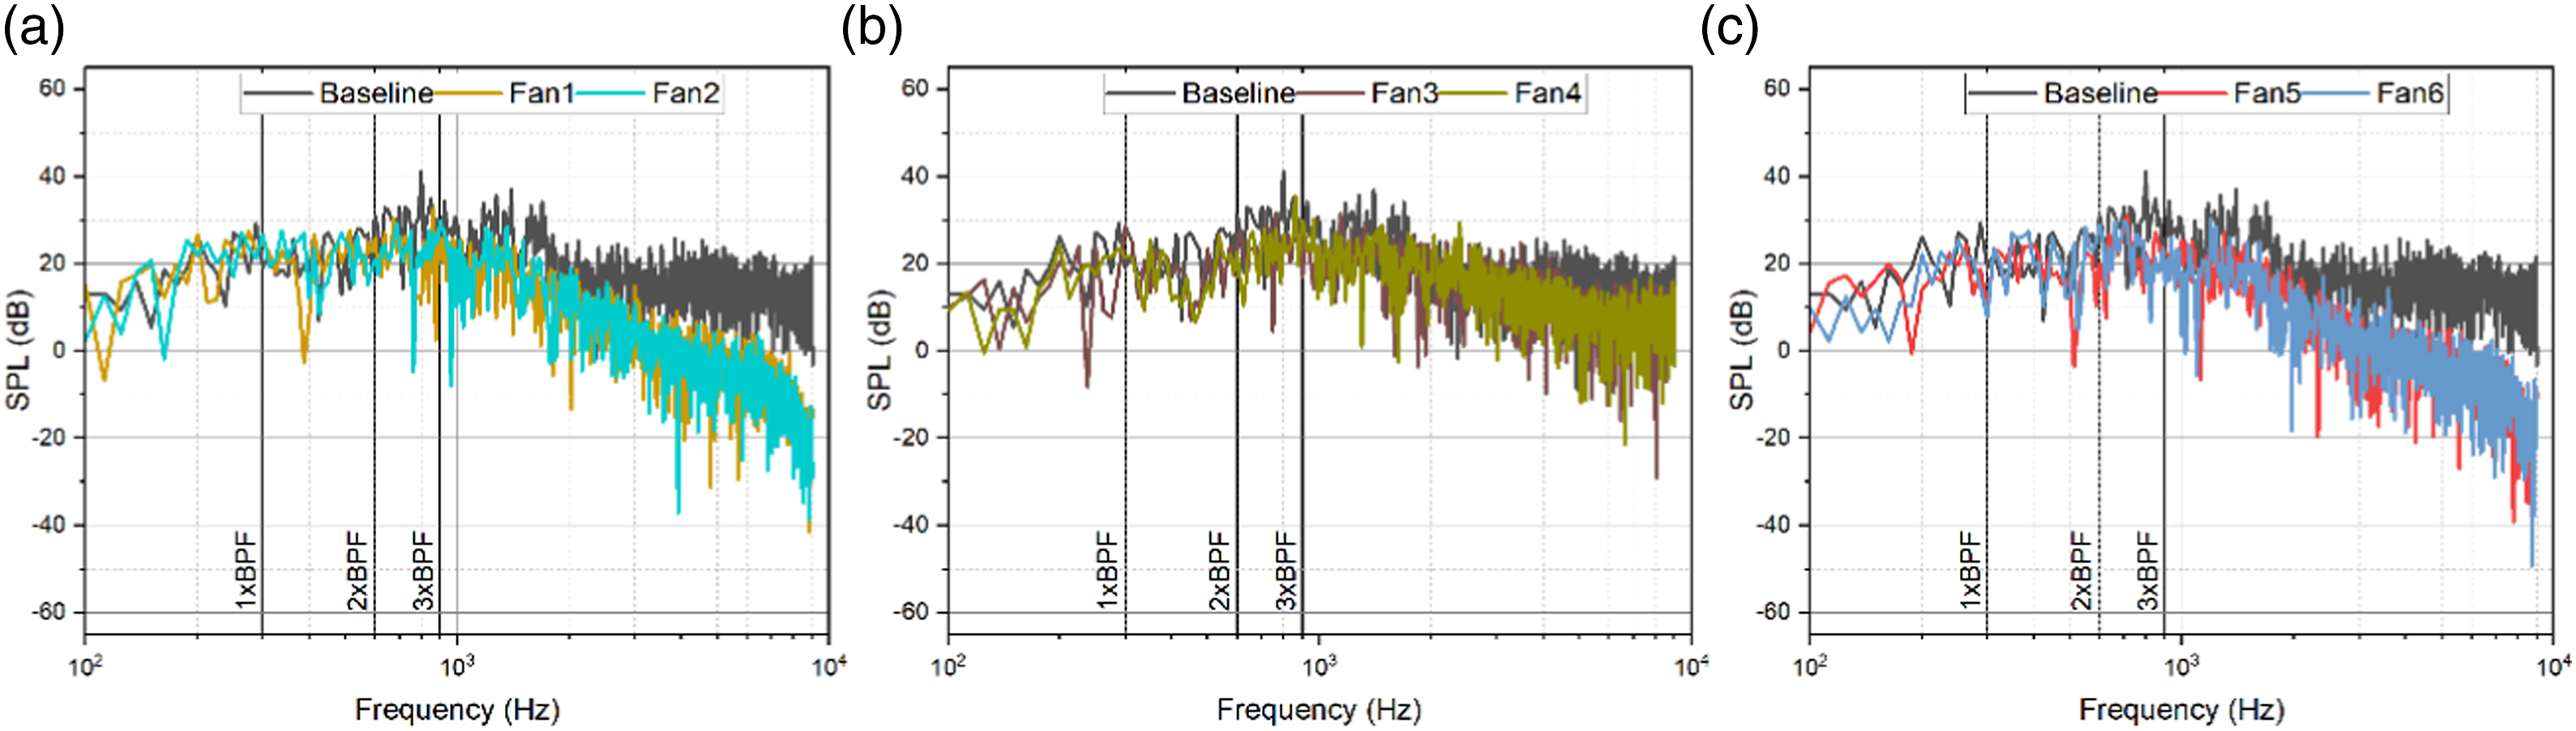
The flow field characteristics of the baseline fan and serrated TE-based fans are shown in Figures 9–15, illustrating a slice of the instantaneous, unsteady velocity field at a scale ranging from 0 m/s (blue in color) to 10 m/s (red in color). The instantaneous flow field consists of turbulent kinetic energy ranging from 0 m2/s2 (blue) to 100 m2/s2 (red). Additionally, the instantaneous Q-criterion characterizes the turbulent structures and is colored by velocity magnitude. Contours of instantaneous (a) velocity magnitude, (b) turbulent kinetic energy, and (c) Q-criterion showing the turbulent structures for the baseline fan. Contours of instantaneous (a) velocity magnitude, (b) turbulent kinetic energy, and (c) Q-criterion showing the turbulent structures for the Fan1. Contours of instantaneous (a) velocity magnitude, (b) turbulent kinetic energy, and (c) Q-criterion showing the turbulent structures for the Fan2. Contours of instantaneous (a) velocity magnitude, (b) turbulent kinetic energy, and (c) Q-criterion showing the turbulent structures for the Fan3. Contours of instantaneous (a) velocity magnitude, (b) turbulent kinetic energy, and (c) Q-criterion showing the turbulent structures for the Fan4. Contours of instantaneous (a) velocity magnitude, (b) turbulent kinetic energy, and (c) Q-criterion showing the turbulent structures for the Fan5. Contours of instantaneous (a) velocity magnitude, (b) turbulent kinetic energy, and (c) Q-criterion showing the turbulent structures for the Fan6.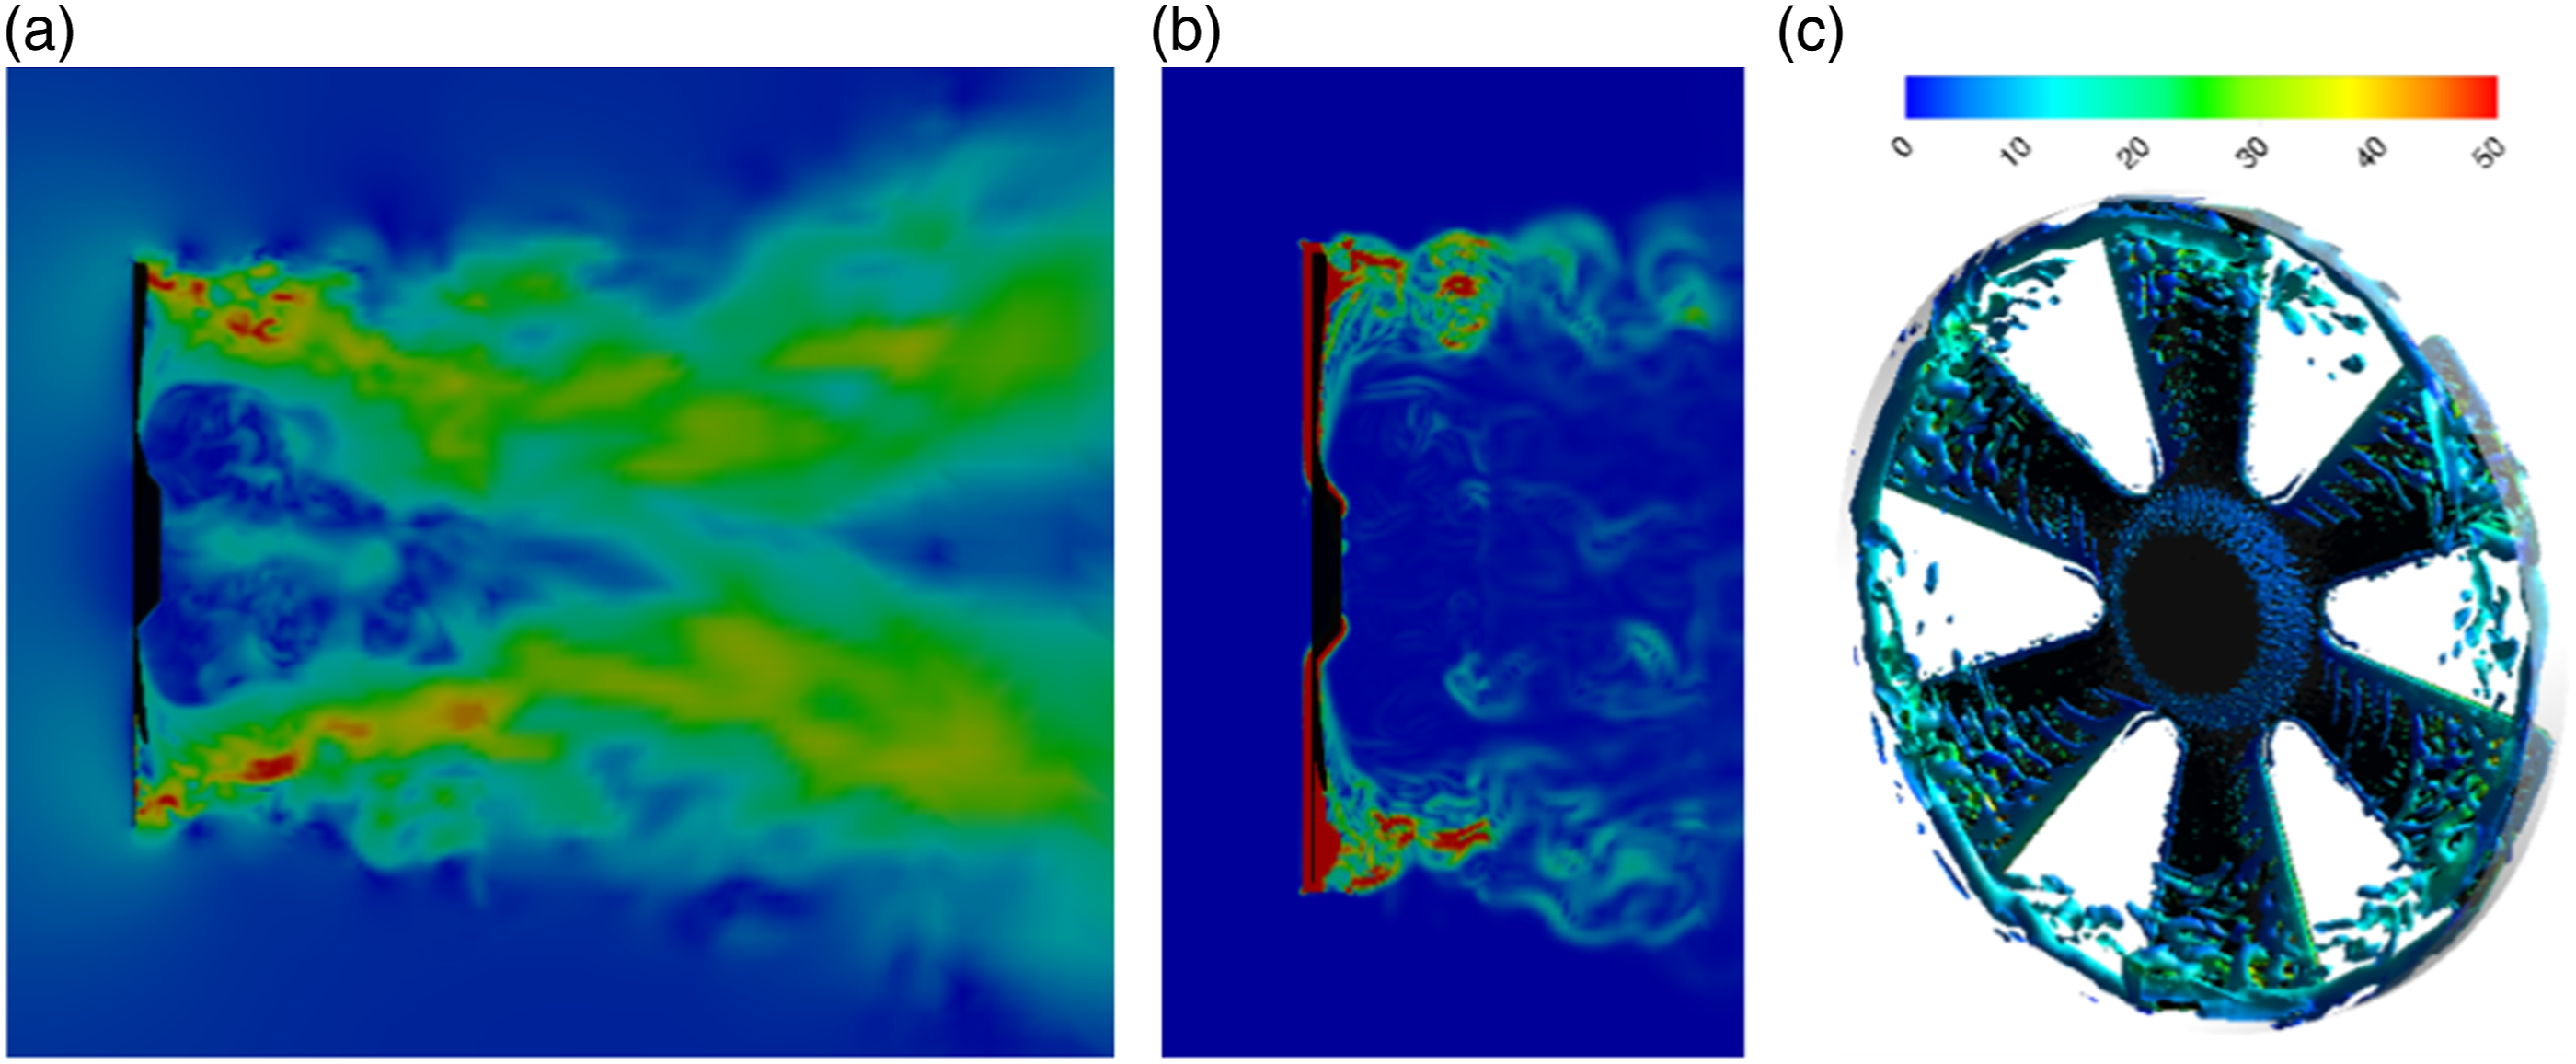


The velocity field upstream of the fan for both baseline and serrated fans is found to be quite smooth. The incoming flow is observed to be steady, thus reducing the interaction of the flow with the leading edge of the blades. This steady inflow results in an absence of tonal noise at the blade passing frequency in the acoustic spectra. Moreover, the maximum velocity amplitudes are concentrated at the blade tips. Downstream of the fan, the velocity field differs between the baseline and serrated TE-based fan models. Specifically, the velocity field of the baseline fan converges at nearly one fan diameter, expands again towards the fan tip, and then further downstream of the fan (Figure 9(a)).
Regarding serrated fans, the velocity field of Fan1 is relatively straight (Figure 10(a)), and modest areas of high velocity are observed towards the tip of the blades downstream of the fan. Except for Fan4 (Figure 13(a)), the remaining serrated TE-based fans display a similar pattern of flow as in Fan1, showing significantly greater tip flows than the baseline fan, which allows them to convect downstream faster and reduce fan noise. Most of the turbulence is generated near the tip of the fan blades, as indicated by the contours of turbulent kinetic energy in Figures 9(b)–15(b).
The baseline fan has the lowest level of turbulent kinetic energy, while the serrated fans have extremely high turbulent kinetic energy downstream of the fan at the tip of the blade. The turbulent structure surrounding the tip area of the baseline and serrated TE-based fan types is depicted in Figures 9(c)–15(c). The large turbulent structures that form near the trailing edge of the fan blades break up into small structures that convect downstream at a relatively fast rate, resulting in the attenuation of the total noise. The serrated TE may reduce noise by extending the mixing zone of the top and bottom blade surfaces. However, as compared to the baseline blade, where the top and bottom flow mixing occurs along the straight TE line, the mixing in the serration region of the serrated TE produces a weak flow.
Extended area serrated fan
The addition of serrations at the trailing edge of a fan blade reduces its surface area, which, in turn, results in the performance of serrated fans being inferior to that of baseline fans. To mitigate the performance reduction resulting from the trailing edge serrations, a simulation is conducted to assess the effects of extending the blade surface area for the serrated fan design that exhibits the most significant noise reduction. The blade surface area of Fan5 is augmented by 10% to achieve equivalent or improved performance compared to that of the baseline fan, leading to the creation of Fan5E. Fan5E has 5% more surface area than the baseline fan, as illustrated in Figure 16(a), which depicts an overlay of the baseline fan and the area-enhanced Fan5E. An overlay of baseline fan (red color) and Fan5E (green color), (a) static pressure rise, and (c) fan static efficiency for baseline fan, Fan5, and Fan5E as a function of volumetric flow rate.
Figure 16(b) shows a comparison of the static pressure rise across the fan as a function of volumetric flow rate for the baseline fan, Fan5, and Fan5E. Fan5E, which has a 28% higher flow rate than the baseline fan, also exhibits a 30% higher static pressure increase. Additionally, compared to Fan5, Fan5E shows a significant increase in flow rate and pressure. In terms of static efficiency, Figure 16(c) compares the baseline fan, Fan5, and Fan5E as a function of volumetric flow rate. Fan5E achieves a static efficiency that is 10% and 25% higher than that of the baseline fan and Fan5, respectively, with a peak efficiency of 6.0 m3/min compared to 5.0 m3/min for both the baseline and Fan5. It should be noted that the expansion of the fan blade area results in a higher power requirement, but the improvement in efficiency is not as significant as the increase in pressure rise. Figure 17 presents a comparison of the OASPL, normalized acoustic pressure as a function of time, and SPL spectrum for the baseline fan, Fan5, and Fan5E. As demonstrated in Figure 17(a), the OASPL of Fan5E is 5.0 dB louder than that of Fan5 but 5.0 dB quieter than that of the baseline fan. The increase in SPL of Fan5E shown in Figure 17(b) is attributed to higher fluctuating pressure than Fan5 but lower than the baseline fan. Figure 17(c) depicts the sound pressure level of the baseline fan, Fan5, and Fan5E at a probe location 1,0 m downstream of the fan. According to Figure 17(c), Fan5E has significantly greater acoustic energy at frequencies lower than 1.0 kHz than Fan5, but the energy level is similar to the baseline fan. It begins to decrease at 1.0 kHz compared to the baseline fan and is relatively higher than Fan5. The increased energy level at a lower frequency in Fan5E is expected to result in greater noise production. Comparison of (a) Overall sound pressure level at various microphone locations, (b) time history of acoustic pressure, and (c) spectrum of sound pressure level for baseline, Fan5, and Fan5E.
Similar to Figures 9–15, Figure 18 depicts the unsteady velocity field, ranging from 0 m/s (blue) to 10 m/s (red), and the instantaneous flow field, including a turbulent kinetic energy gradient, ranging from 0 m2/s2 (blue) to 100 m2/s2 (red). Additionally, the instantaneous Q-criterion for the serrated TE-based extended-area Fan5E model, colored by velocity magnitude, is shown in Figure 18. The velocity field upstream of the Fan5E model appears to be smooth and stable, while the blade tips exhibit the highest velocity amplitudes, as shown in Figure 18(a). The velocity flow downstream of the Fan5E is distinct from the baseline fan, as shown in Figure 9, with certain areas of high velocity detected around the blade tips and downstream of the fan. The velocity flow at the tip region in Fan5E is significantly stronger than that in the baseline fan, enabling it to convect downstream swiftly and potentially reducing fan noise. Contours of instantaneous (a) velocity magnitude, (b) turbulent kinetic energy, and (c) Q-criterion showing the turbulent structures for the Fan5E.
Turbulence is primarily created by the tips of the fan blades, as demonstrated by the contours of the turbulent kinetic energy gradient in Figure 18(b). The turbulent kinetic energy dissipation of Fan5E is similar to that of the baseline fan, and the Q-criterion illustrated in Figure 18(c) reveals the turbulent structure of Fan5E towards the tip region. The trailing edge serration of the fan blades leads to the splitting of large turbulent structures into smaller ones that undergo convection at a rate higher than the baseline fan but lower than Fan5, as depicted in Figure 14. Consequently, the overall sound pressure level is lower than that of the baseline fan but higher than Fan5.
Conclusions
The investigation on the aerodynamics and aeroacoustics of an automobile axial-flow cooling fan at the maximum designed rotational speed, using a hybrid computational approach, has provided valuable insights regarding the effects of different trailing edge serration profiles. The conclusions drawn from this study are as follows:
Firstly, the aerodynamic performance of the trailing edge serration fans remained comparable to the baseline fan, despite the addition of serrations at the trailing edge of the blade, which was due to the limited blade surface area affected by the addition of serrations.
Secondly, the study found that the serrations on the trailing edge of the fan blades significantly reduced the noise generated by the rotating fan blades. Notably, the triangle wave-based serration profile reduced the overall sound pressure level by 10 dB compared to the baseline fan.
Thirdly, enhancing the surface area of the triangle wave-based fan blade showed a significant improvement in its aerodynamic performance, compared to both its baseline and reduced area equivalent fans. Moreover, the investigation found that this enhancement resulted in a 5 dB reduction in noise compared to the baseline fan.
In summary, the investigation has emphasized the importance of trailing edge serration profiles in reducing fan noise and provided valuable insights for improving the design and performance of axial-flow cooling fans in the automobile industry.
Footnotes
Declaration of conflicting interests
The author(s) declared no potential conflicts of interest with respect to the research, authorship, and/or publication of this article.
Funding
The author(s) disclosed receipt of the following financial support for the research, authorship, and/or publication of this article: This work was supported by the National Research Foundation of Korea (NRF), funded by the Korean government (MSIT) under grant number NRF-2022R1F1A1061903.
