






Abstract
The continuous improvement of elevator speed has made the issue of aerodynamic noise in the hoistway more prominent. Previous research has usually focused on the characteristics of aerodynamic loads and related safety issues, and little attention has been paid to the problem of flow-induced noise. This paper established a three-dimensional geometric configuration of the ultra-high-speed elevator to study the flow behavior and aerodynamic acoustic characteristics in the hoistway using well-validated large eddy simulations. Firstly, we analyzed the unsteady flow behavior in the ring-gap flow field using large eddy simulations and captured the transient vortex structure in the flow field using the Q-criterion. We then predicted the far-field aerodynamic noise of the elevator car using the Lighthill-Curle aerodynamic acoustic equations. The results showed that the factors affecting the sound source intensity of the elevator car include the shedding position and intensity of the vortex structures. By adjusting the shedding position and reducing the intensity of the vortex structure, the sound source intensity of the elevator car wall could be effectively controlled. The change of the blocking ratio could not affect the attenuation of aerodynamic noise in the hoistway, but the increase of the blocking ratio could lead to an increase in the turbulent kinetic energy intensity and peak SPL in the hoistway. Therefore, the blocking ratio should be kept within 0.65 when designing the hoistway structure dimensions.
Keywords
Introduction
With the increase in elevator operating speed, vibration and noise have gradually become vital factors affecting the quality of elevator operation. Research has shown that aerodynamic noise is proportional to the 6-8th power of elevator operating speed. 1 When the elevator speed exceeds 6 m/s, aerodynamic noise will replace other noises as the primary sound source of the ultra-high-speed elevator.2,3 Noise exceeding the standard not only affects ride comfort but also affects the normal operation of the equipment. From this, the issue of aerodynamic noise has become a key technical problem that urgently needs to be solved in the development of the elevator towards ultra-high speeds.
When the elevator runs at ultra-high speed in the hoistway, the air around the car forms turbulent flow with a very complex flow state near its surface, causing pressure changes in the boundary layer of the car body, resulting in vortices, vortex shedding, and fragmentation, airflow separation, and reattachment. Complex boundary layer flow patterns, such as vortices of different scales, are further formed there and interact with turbulence to generate intense fluctuating pressure, eventually transforming into aerodynamic noise. 4 The elevator car is one of the main aerodynamic sound-generating components, the most crucial factor leading to rapid and severe deterioration of the acoustic environment in the hoistway. Therefore, studying the evolution behavior of vortex structures and aeroacoustic characteristics of the elevator car in unsteady flow fields is crucial. However, current research on the ultra-high-speed elevator mainly focuses on the aerodynamic characteristics caused by changes in hoistway fluid loads.
Toshiba has set a precedent for using aerodynamic methods to solve the aerodynamic problems of high-speed elevators, laying the foundation for studying complex aerodynamic problems in hoistways. Afterward, scholars conducted extensive exploration in this area. Bai et al. 5 verified through experiments that aerodynamic force is a significant obstacle affecting elevator operation. Qiu et al. 6 believed that two main factors caused horizontal vibration in high-speed elevator cars, namely rail excitation and aerodynamic characteristics of the car. Park et al. 7 actively changed the airflow speed by considering the position and speed of the elevator and obtained an empirical correlation between elevator motion and pressure difference. Jing et al. 8 used the multi-region dynamic stratification method to analyze the effects of different hoistway structures and ventilation hole parameters on aerodynamic force and wellbore pressure. It was found that the opening of ventilation holes significantly reduced aerodynamic force and wellbore pressure, but both showed a sudden increase or decrease in aerodynamic force and hoistway pressure. Qin et al. 9 used the Newmark-β method to analyze that the maximum change rate of the contact stiffness of the guide rail under aerodynamic load is 5.2%, which significantly impacts the elevator's horizontal vibration. Therefore, aerodynamic loads should be considered when studying the dynamic response of ultra-high-speed elevators. Kawamura et al. 10 studied the aerodynamic forces generated by the intersection of the car and counterweight in an ultra-high-speed elevator. They found that installing a fairing in the car of the ultra-high-speed elevator can reduce aerodynamic resistance by about 30%. Qiu et al. 11 proposed a segmented method for adjusting the air pressure curve of the high-speed elevator car, which helps promote further the air pressure compensation design of the high-speed elevator. Zhang et al. 12 studied the aerodynamic characteristics of a certain type of elevator toe guard using the Reynolds averaged N-S equation and SIMPLEC algorithm and found that reducing the vertical height of the toe guard is beneficial for reducing resistance and saving space in the elevator car. Chen et al. 13 used dynamic grids to conduct transient numerical simulations of the aerodynamic characteristics of five different types of elevator guide plates. They found that the impact of different guide plates on elevator aerodynamic performance varies greatly at different speeds. Zhang et al. 14 established a three-dimensional car-counterweight model and proposed a multi-region dynamic stratification method to calculate the changes in the aerodynamic flow field, aerodynamic resistance, and aerodynamic lateral force in the whole process of car motion. The results showed that when the car meets the counterweight in the hoistway, the interaction between the elevator car and the counterweight increases, and the car's drag coefficient and lateral force coefficient suddenly change and then return to the normal state after passing. It can be seen from the above research that scholars have conducted a lot of research on aerodynamic problems caused by unsteady aerodynamic changes during the dynamic operation of ultra-high-speed elevators by various means and methods and have achieved fruitful research results. Some of the research results have also been used in products.
However, scholars have paid little attention to the problem of flow-induced acoustics caused by transient airflow changes in the hoistway. Research in this area was not in-depth enough, mainly focuses on qualitative analysis of acoustics inside the hoistway. So et al. 15 investigated the effect of pressure variations in the hoistway's flow field on the elevator's aerodynamic noise through numerical simulations. Yangki Oh et al. 16 believed that in high-rise residential buildings, the acceleration of elevator operation speed could lead to problems such as changes in atmospheric pressure and increased noise. Torsten et al. 17 pointed out that the fluid's pressure loss and turbulent kinetic energy loss before and after passing through the car are positively correlated with the sound pressure level of aerodynamic noise in the hoistway. Matsukura et al. 18 deduced that when the elevator exceeds a certain speed, the aerodynamic noise caused by the violent changes in the high-speed airflow and its pressure field in the hoistway far exceeds the noise generated by mechanical vibrations. Qiao et al. 19 established a theoretical model of unsteady airflow of the ultra-high-speed elevator car to study the flow behavior of the hoistway. They concluded that the high-speed airflow generated during the operation of the ultra-high-speed elevator would produce significant aerodynamic noise. Mendizabal et al. 20 established a numerical model of the elevator mezzanine structure and briefly analyzed the noise heard by passengers due to different sound sources. Landaluze et al. 21 introduced the application of active noise control in elevators, which greatly reduces the noise level of the entire area. Watanab et al. 22 conducted CFD calculations and wind tunnel experiments on different types of streamline fairings and found that the aerodynamic noise was 7.2 dBA lower than that of the traditional car. It can be seen that scholars' research on the aerodynamic noise of the ultra-high-speed elevator is still in the theoretical and simulation stages. There is still a lack of accurate understanding of the ultra-high-speed elevator's noise source structure and sound generation mechanism. The research focuses on the relationship between aerodynamic noise and fluid pressure changes, with almost no quantitative analysis of the aerodynamic sound energy of the car, nor does it involve the relationship between vortex structures in the ring-gap flow field and the intensity of the aerodynamic sound source. Meanwhile, among the many factors affecting elevators' aerodynamic and acoustic characteristics, parameters such as blocking ratio in the hoistway are crucial. However, there is currently a lack of exploration of the aerodynamic and acoustic characteristics of the blocking ratio in the ring-gap flow field to guide the subsequent design of the hoistway structure size.
In summary, the innovations of this paper are as follows: Firstly, from the perspective of vortex structures and aerodynamic sound source intensity, the relationship between vortex structures and sound source intensity in the ring-gap flow field of the ultra-high-speed elevator is elucidated. The directionality, spectral characteristics, and acoustic similarity of noise in the ring-gap flow field at different velocities were studied, providing theoretical support for controlling sound source intensity on the wall of the ultra-high-speed elevator car in the future. Secondly, the longitudinal attenuation characteristics of aerodynamic noise under different blocking ratios are explored, which points out the direction for the design of the hoistway structure size. Therefore, the structure of the paper is as follows: In the section on the numerical computation model, we establish a numerical wind tunnel model for flow-induced noise in the ultra-high-speed elevator and conduct verification on it. In the section on the exploration of the relationship between vortex structures and aerodynamic noise source in ring-gap flow field, we use the Q criterion to identify the vortex structures in the ring-gap flow field, expound the evolution regularity of the vortex structures with time and space and the dependence of the vortex structure on the velocity and discusses the intensity distribution regularity of the aerodynamic noise on the elevator car surface and the relationship with the vortex structures. In the section study on the influence of different parameters on aerodynamic noise performance in ring-gap flow field, we quantitatively analyze the noise attenuation under different blocking ratios and the directivity and acoustic similarity of aerodynamic noise under different velocities. Finally, we provide a conclusion.
Numerical computation model
Geometric configuration of the ultra-high-speed elevator
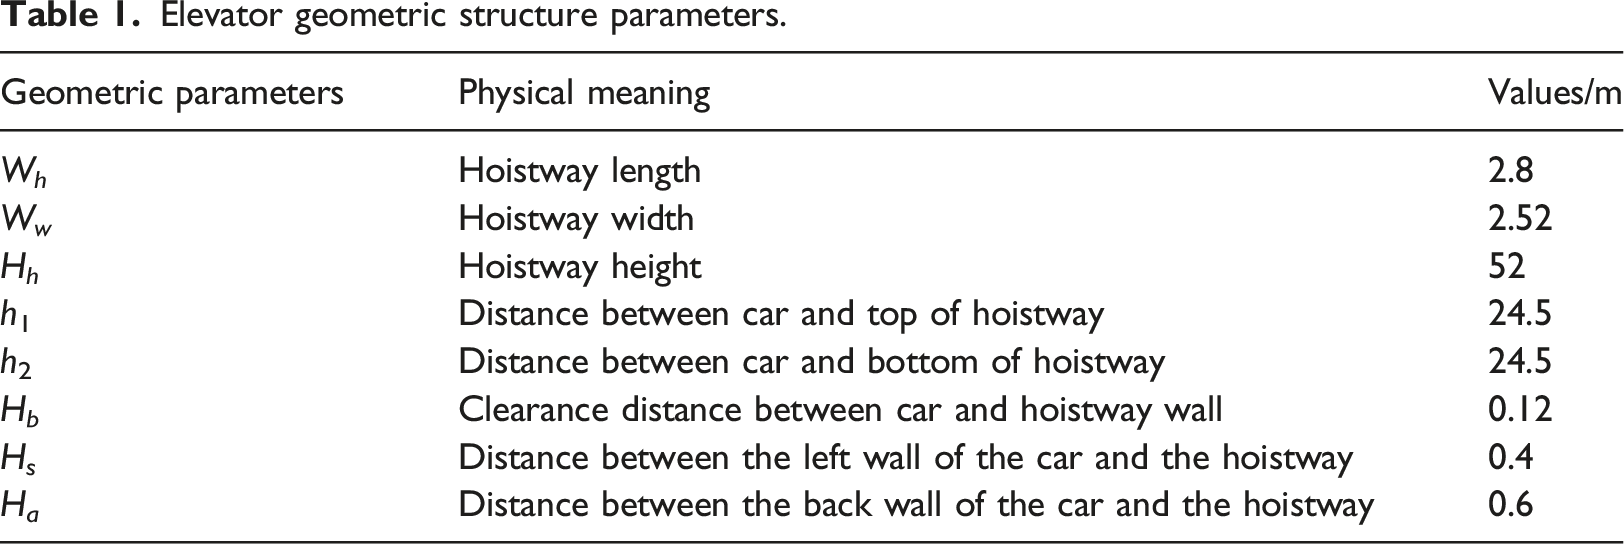
Selecting the ultra-high-speed elevator of the cooperating company as the research object simplified the components such as steel wire rope, safety gear, and car frame. The elevator car's dimensions remain unchanged, composed of six surfaces. The simplified geometric modeling is shown in the enlarged part of the light green circle in Figure 1(a). The length of the car is L = 2.0 m, the width is W = 1.8 m, and the height is H = 3.0 m. Aeroacoustic calculational domain.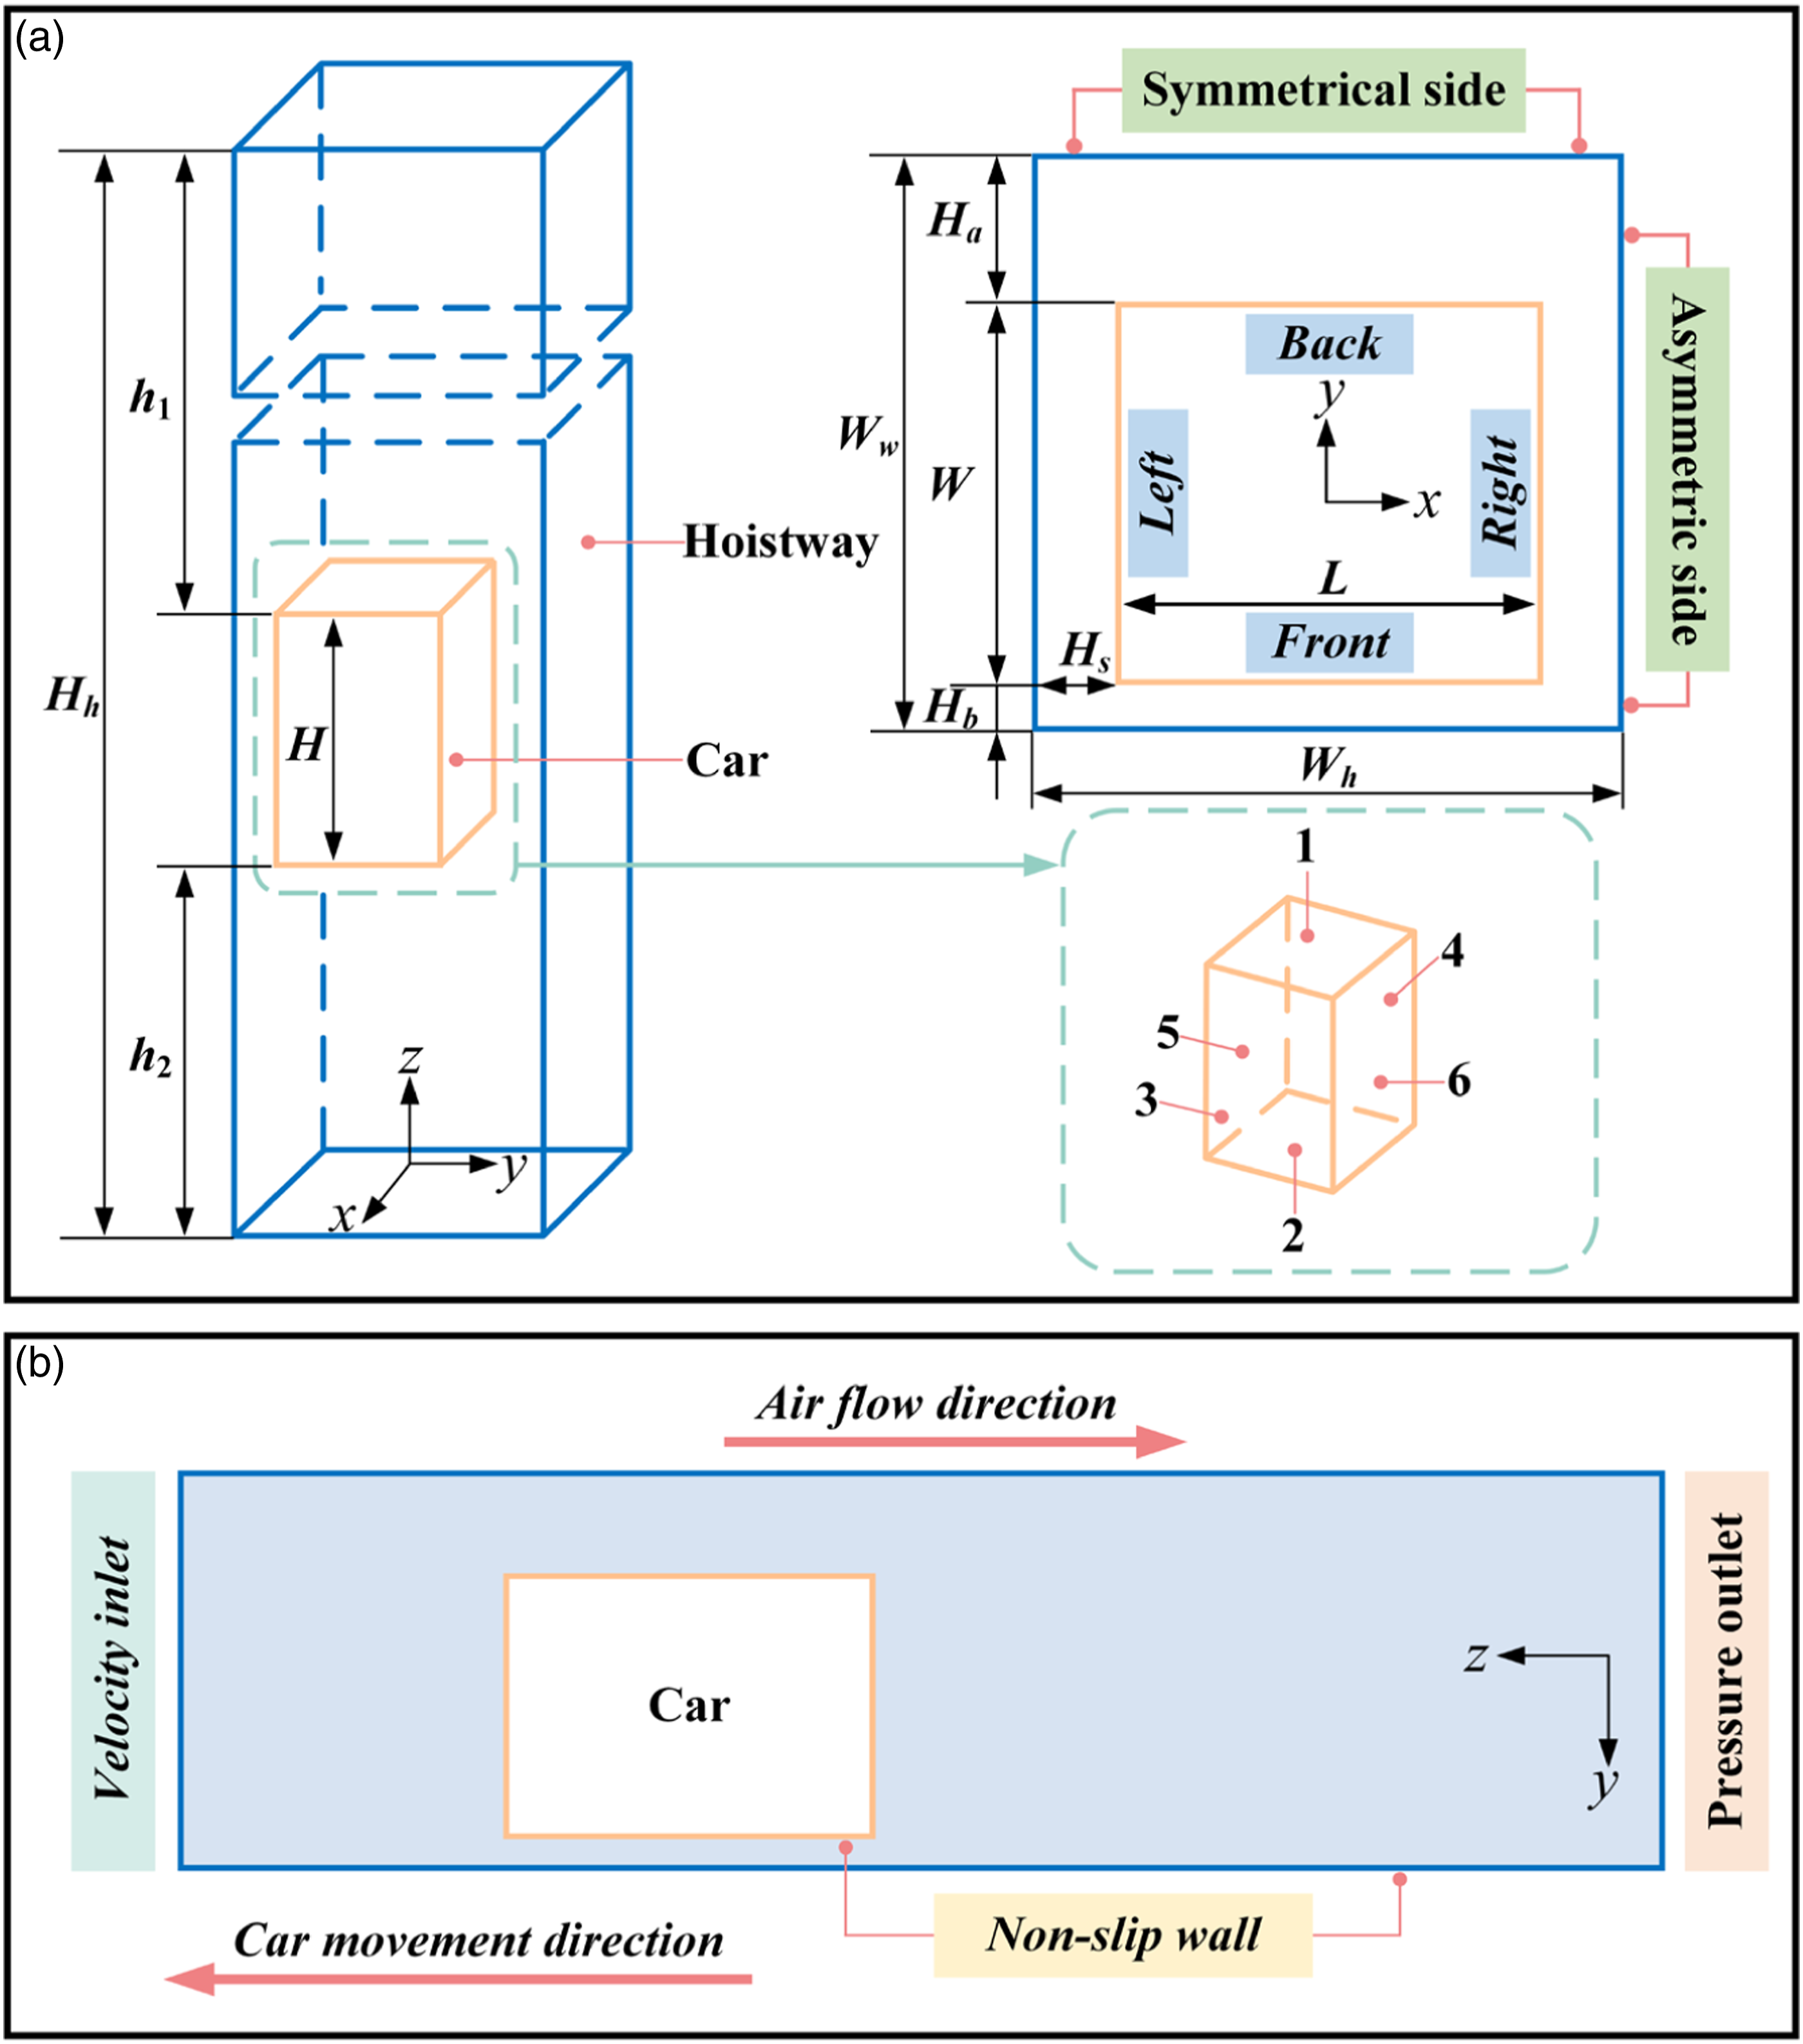
Calculational domain, boundary conditions, and solution settings
Elevator geometric structure parameters.
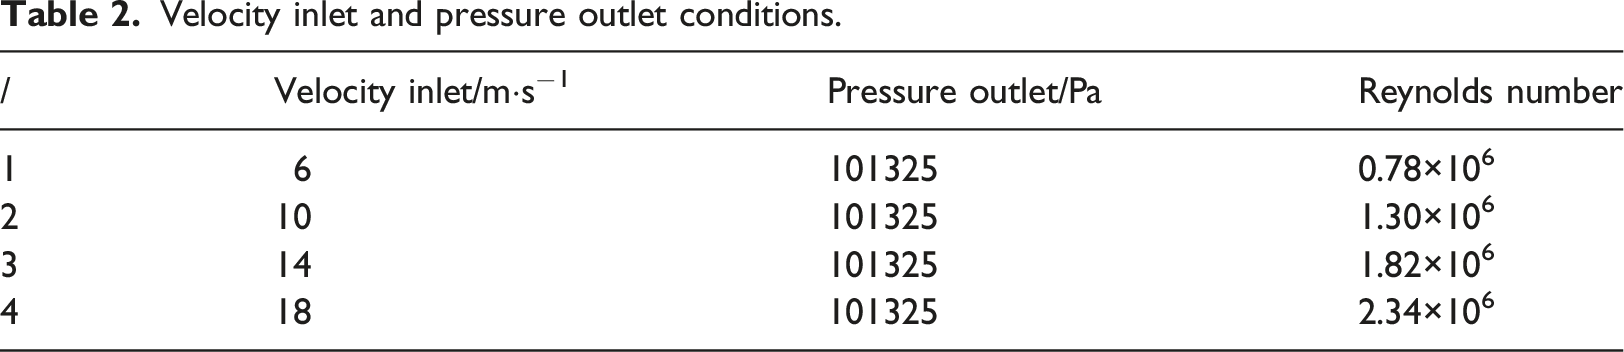
Velocity inlet and pressure outlet conditions.
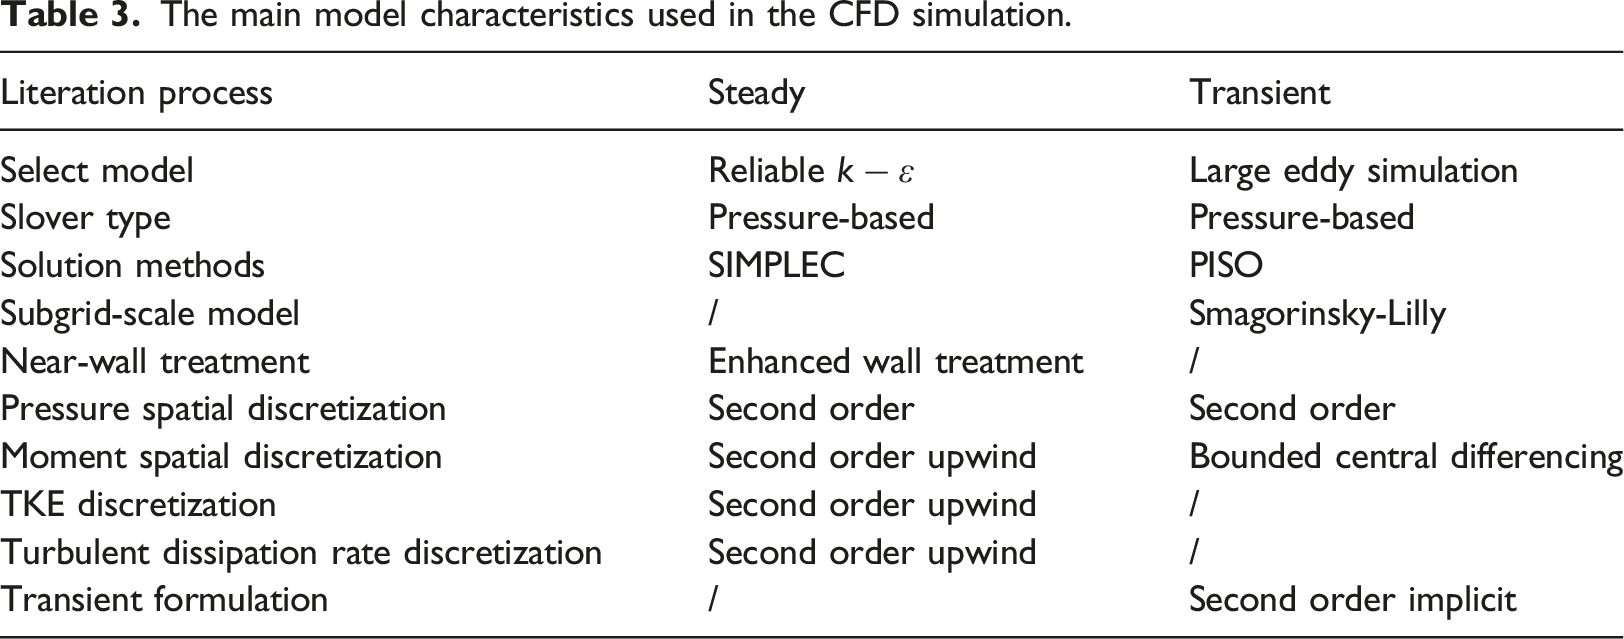
The main model characteristics used in the CFD simulation.
Grid independence verification
This paper used ICEM CFD software (Version 19.2) to perform structured grid partitioning on the model. The structured grid is used to divide the elevator car wall, the hoistway wall, and the flow field in the hoistway. The hoistway wall and elevator car wall are divided into quadrilateral grids, while the flow field in the hoistway is divided into hexahedral grids. The grid growth rate near the elevator car is 1.1, and the grid growth rate in the area far from the elevator car is 1.2-1.3. To ensure the accuracy of the calculation results, this paper divided three sets of grids to verify the independence of the grids: coarse, medium, and fine. The total number of three sets of grids is approximately 4.32 million, 6.89 million, and 9.58 million, respectively. Figure 2 shows the grid distribution around the elevator car in three grids. Grid distribution around the elevator car in three sets of grids. (a) Coarse grid distribution, (b) Medium grid distribution (c) Fine grid distribution.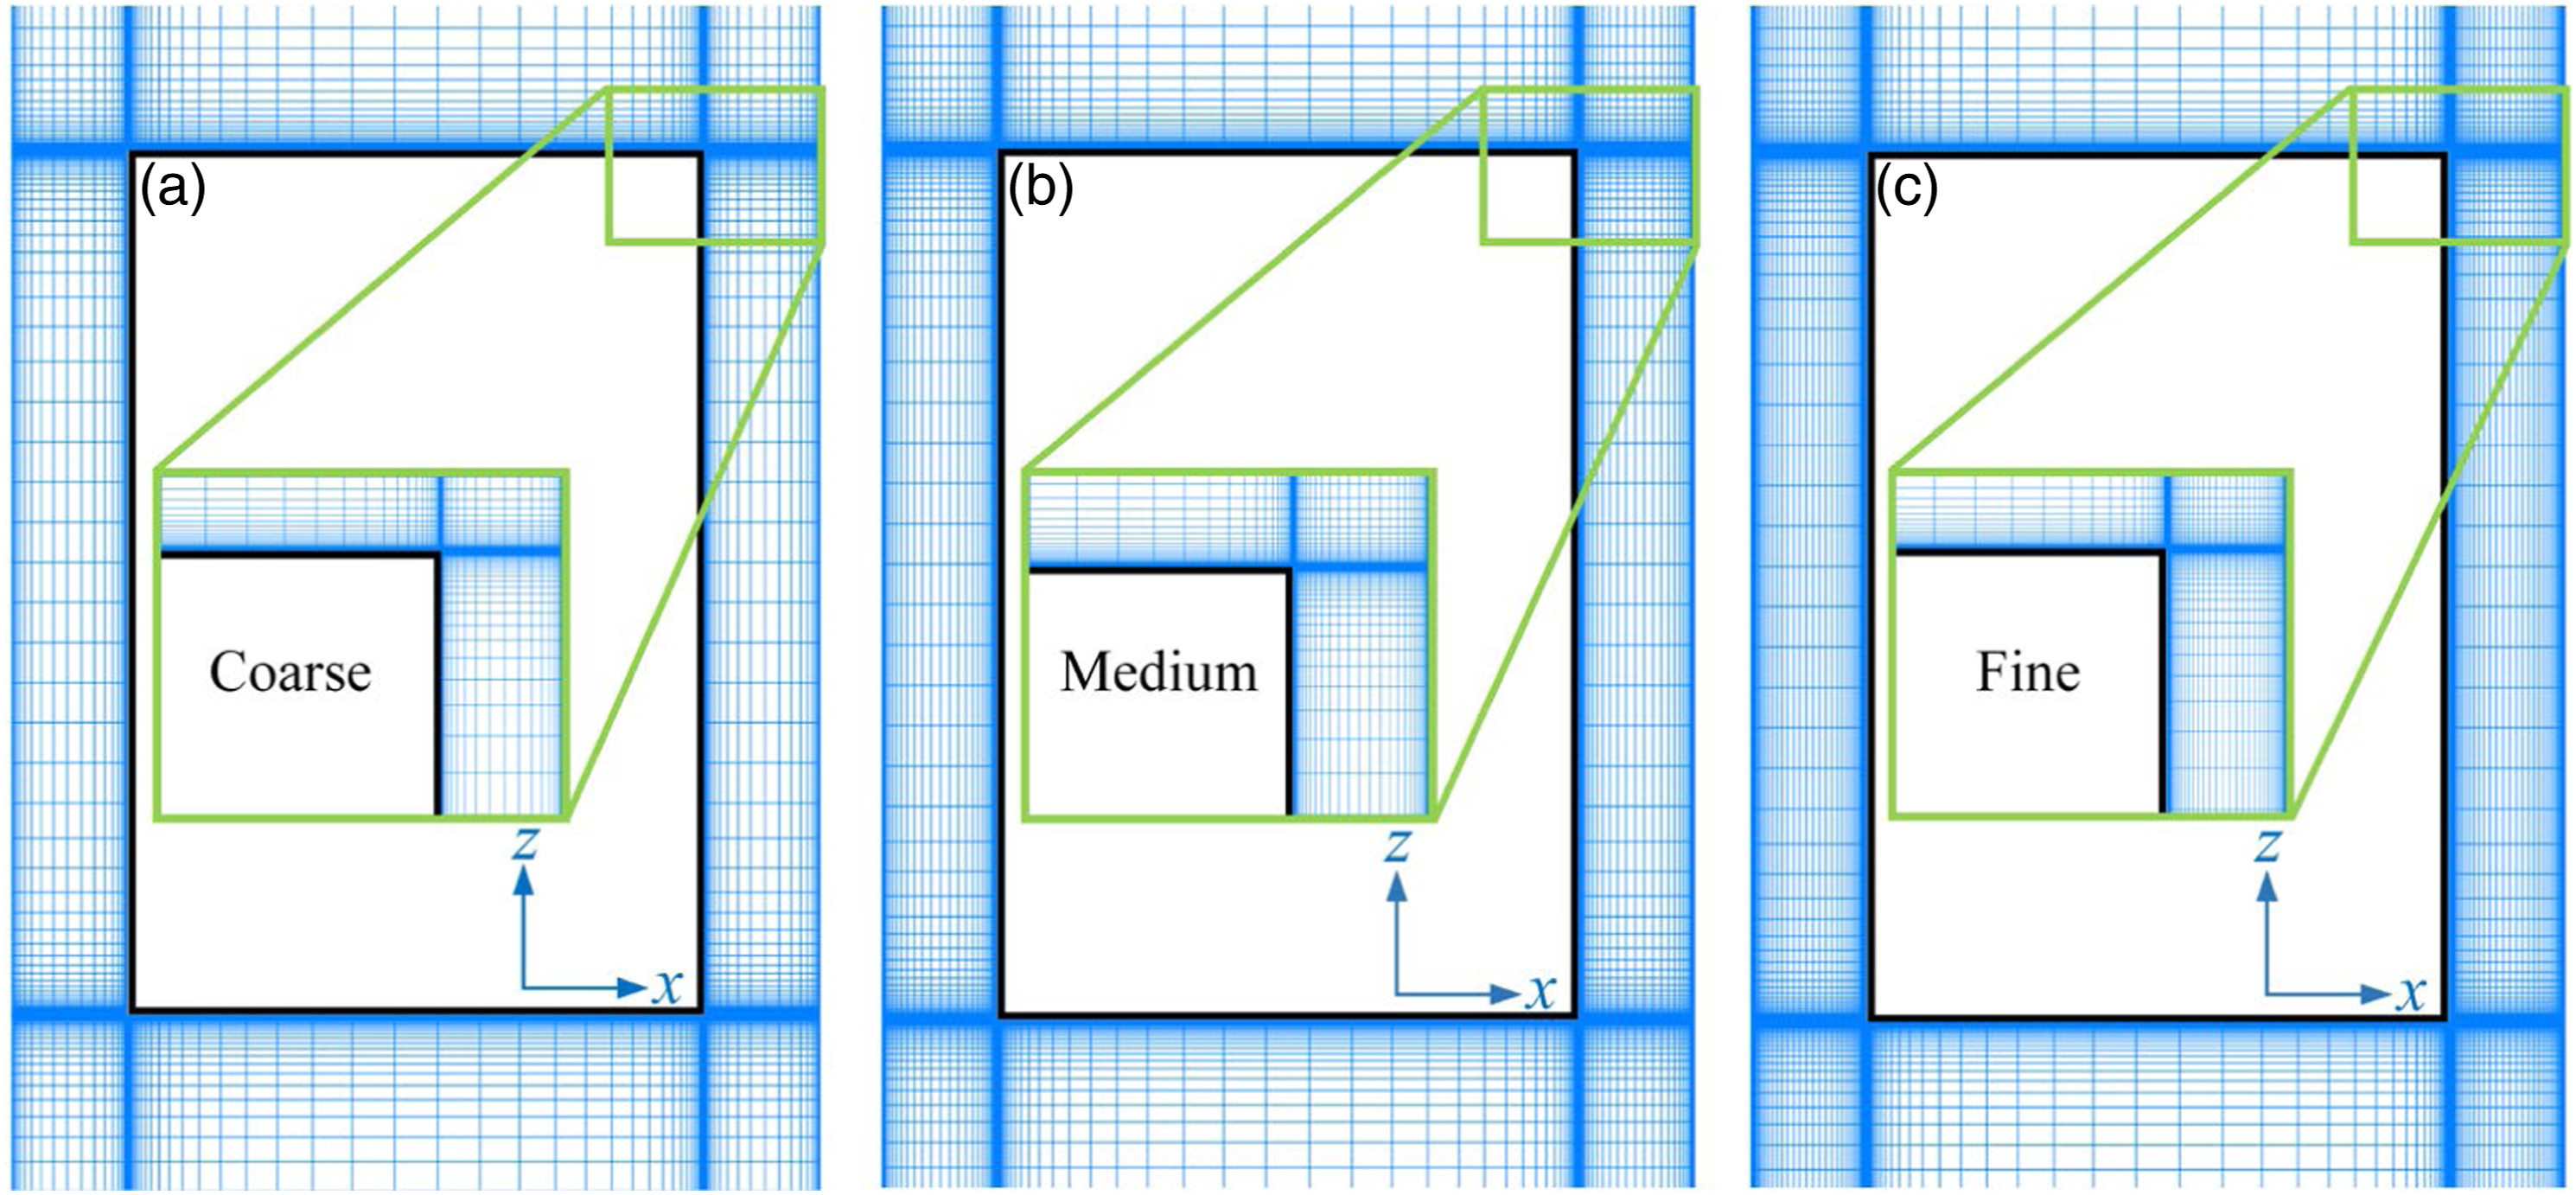
Firstly, at a distance of 1m from the bottom surface of the elevator car on the leeward side, the velocity monitoring point was set every 1 m along the z-axis, and a total of 24 monitoring points were assigned. Using the large eddy simulation to monitor the velocity amplitude of these points. Figure 3 shows the calculation results of the velocity amplitudes on the leeward side with three sets of grid distributions. As the distance from the car bottom increased, the velocity amplitude distribution curve rapidly increased and gradually decreased when it reached a certain value. The results showed that the difference between coarse and fine grids was the largest, while the difference between medium and fine calculation results was insignificant. Comparison of velocity amplitude results of three sets of grid distributions.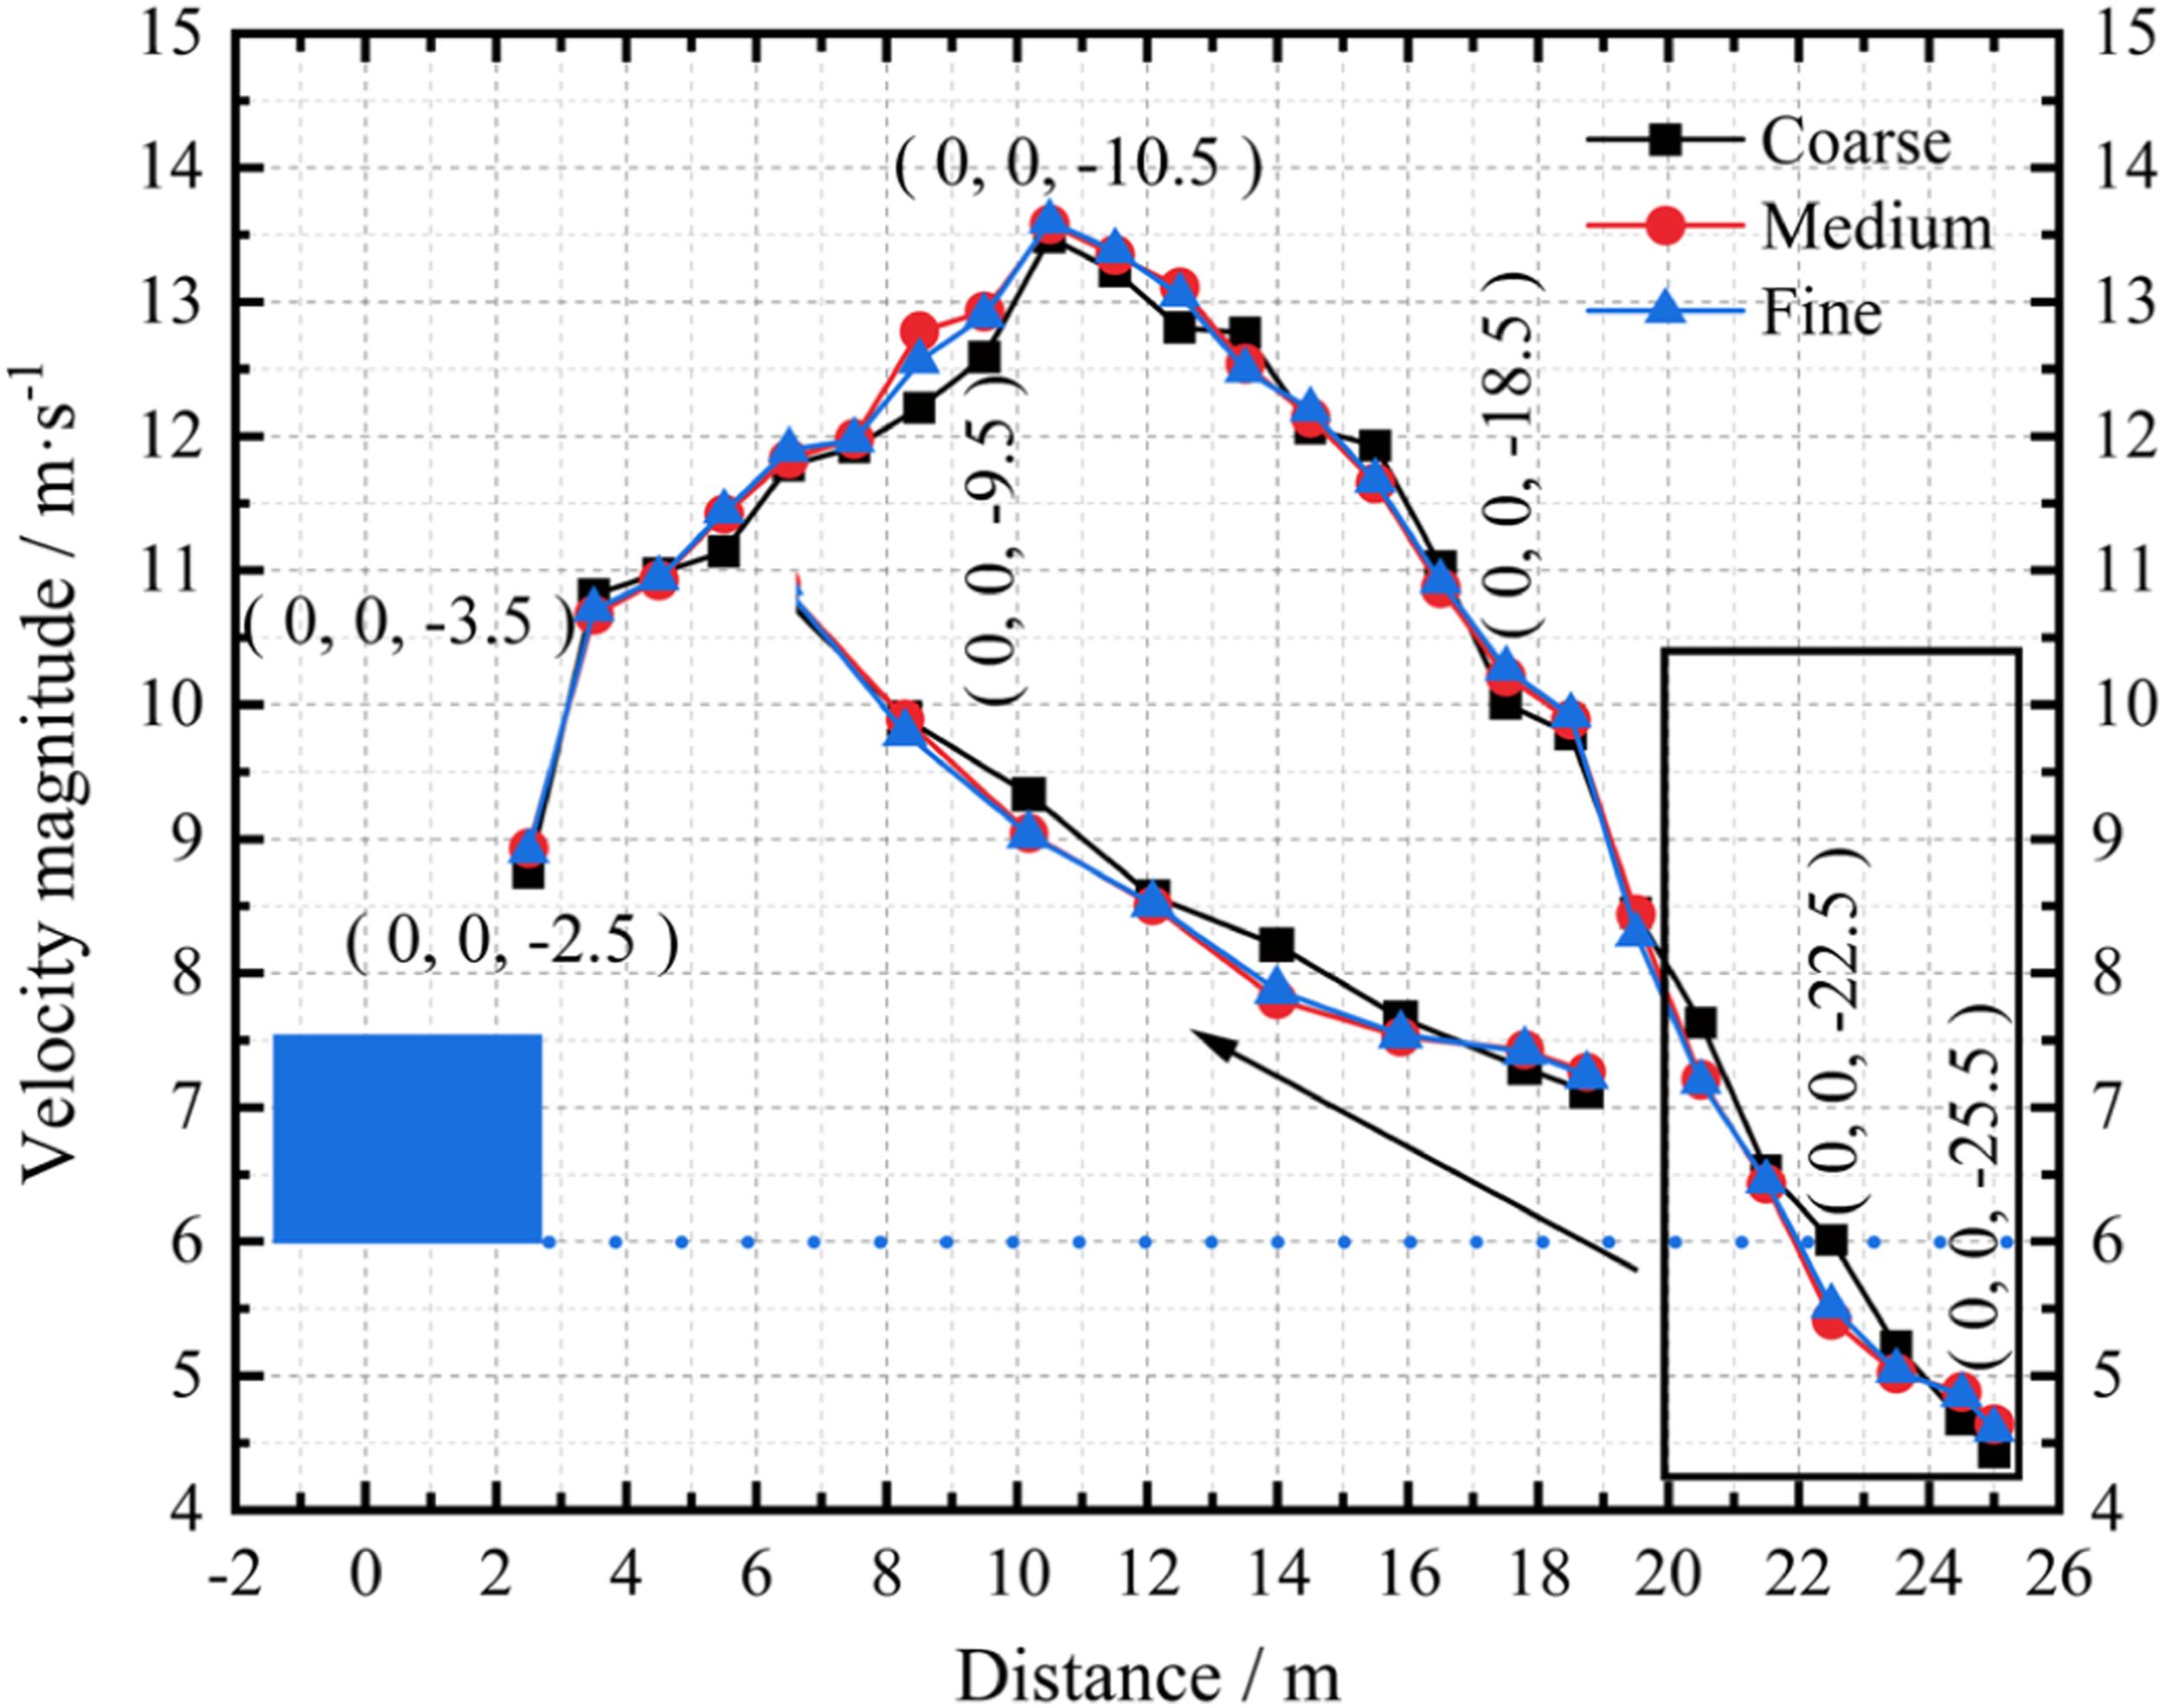
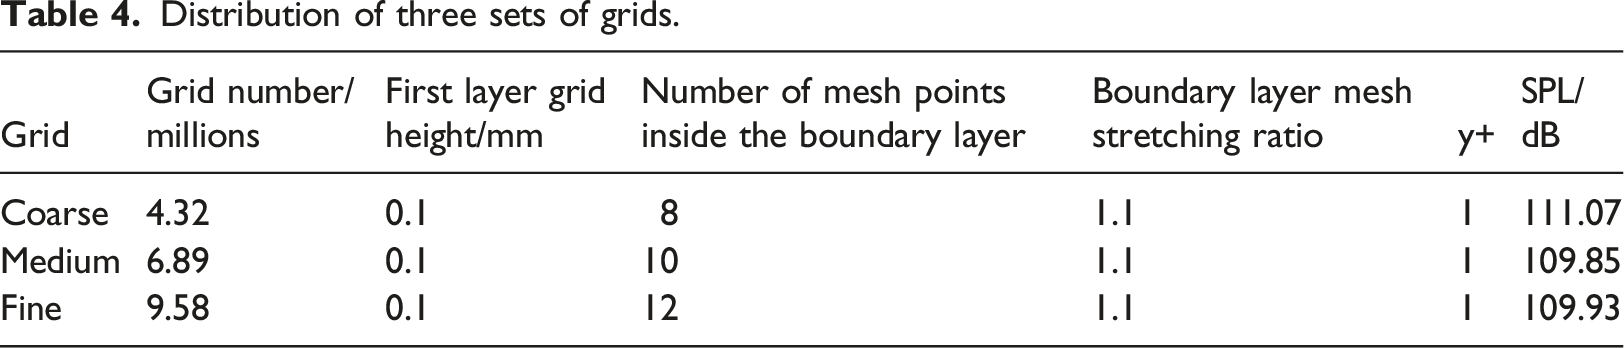
Secondly, the fluctuating pressure at the leeward aerodynamic noise receiver point (0,0,10.5) m of three grid distributions was measured, and the SPL value at that point was solved. Figure 4 shows the comparison of the noise spectrum at (0,0,10.5) in the ring-gap flow field under different grid distributions. It can be seen from Figure 4 that the numerical calculation results of the coarse grid and fine grid match well when the frequency is 200–1050 Hz, but the consistency is poor when the frequency is lower than 200 Hz or higher than 1000 Hz. Medium and fine grids have a high degree of consistency between 0 and 1600 Hz, possibly because the grid-cutoff frequency increases as the number of grids increases. In addition, As can be seen from Table 4, the SPL of coarse grids was 1.22 dB higher than that of medium grids and 1.14 dB higher than that of fine grids. However, with further refinement of the grid, the SPL of the medium and fine grids remained almost unchanged. Therefore, the medium grid satisfied the requirement for grid independence. At the same time, to save computational resources and improve computational efficiency, the medium grid model is selected for numerical calculation in this paper. Noise spectrum at (0, 0, 10.5) in the ring-gap flow field under different grid distributions. Distribution of three sets of grids.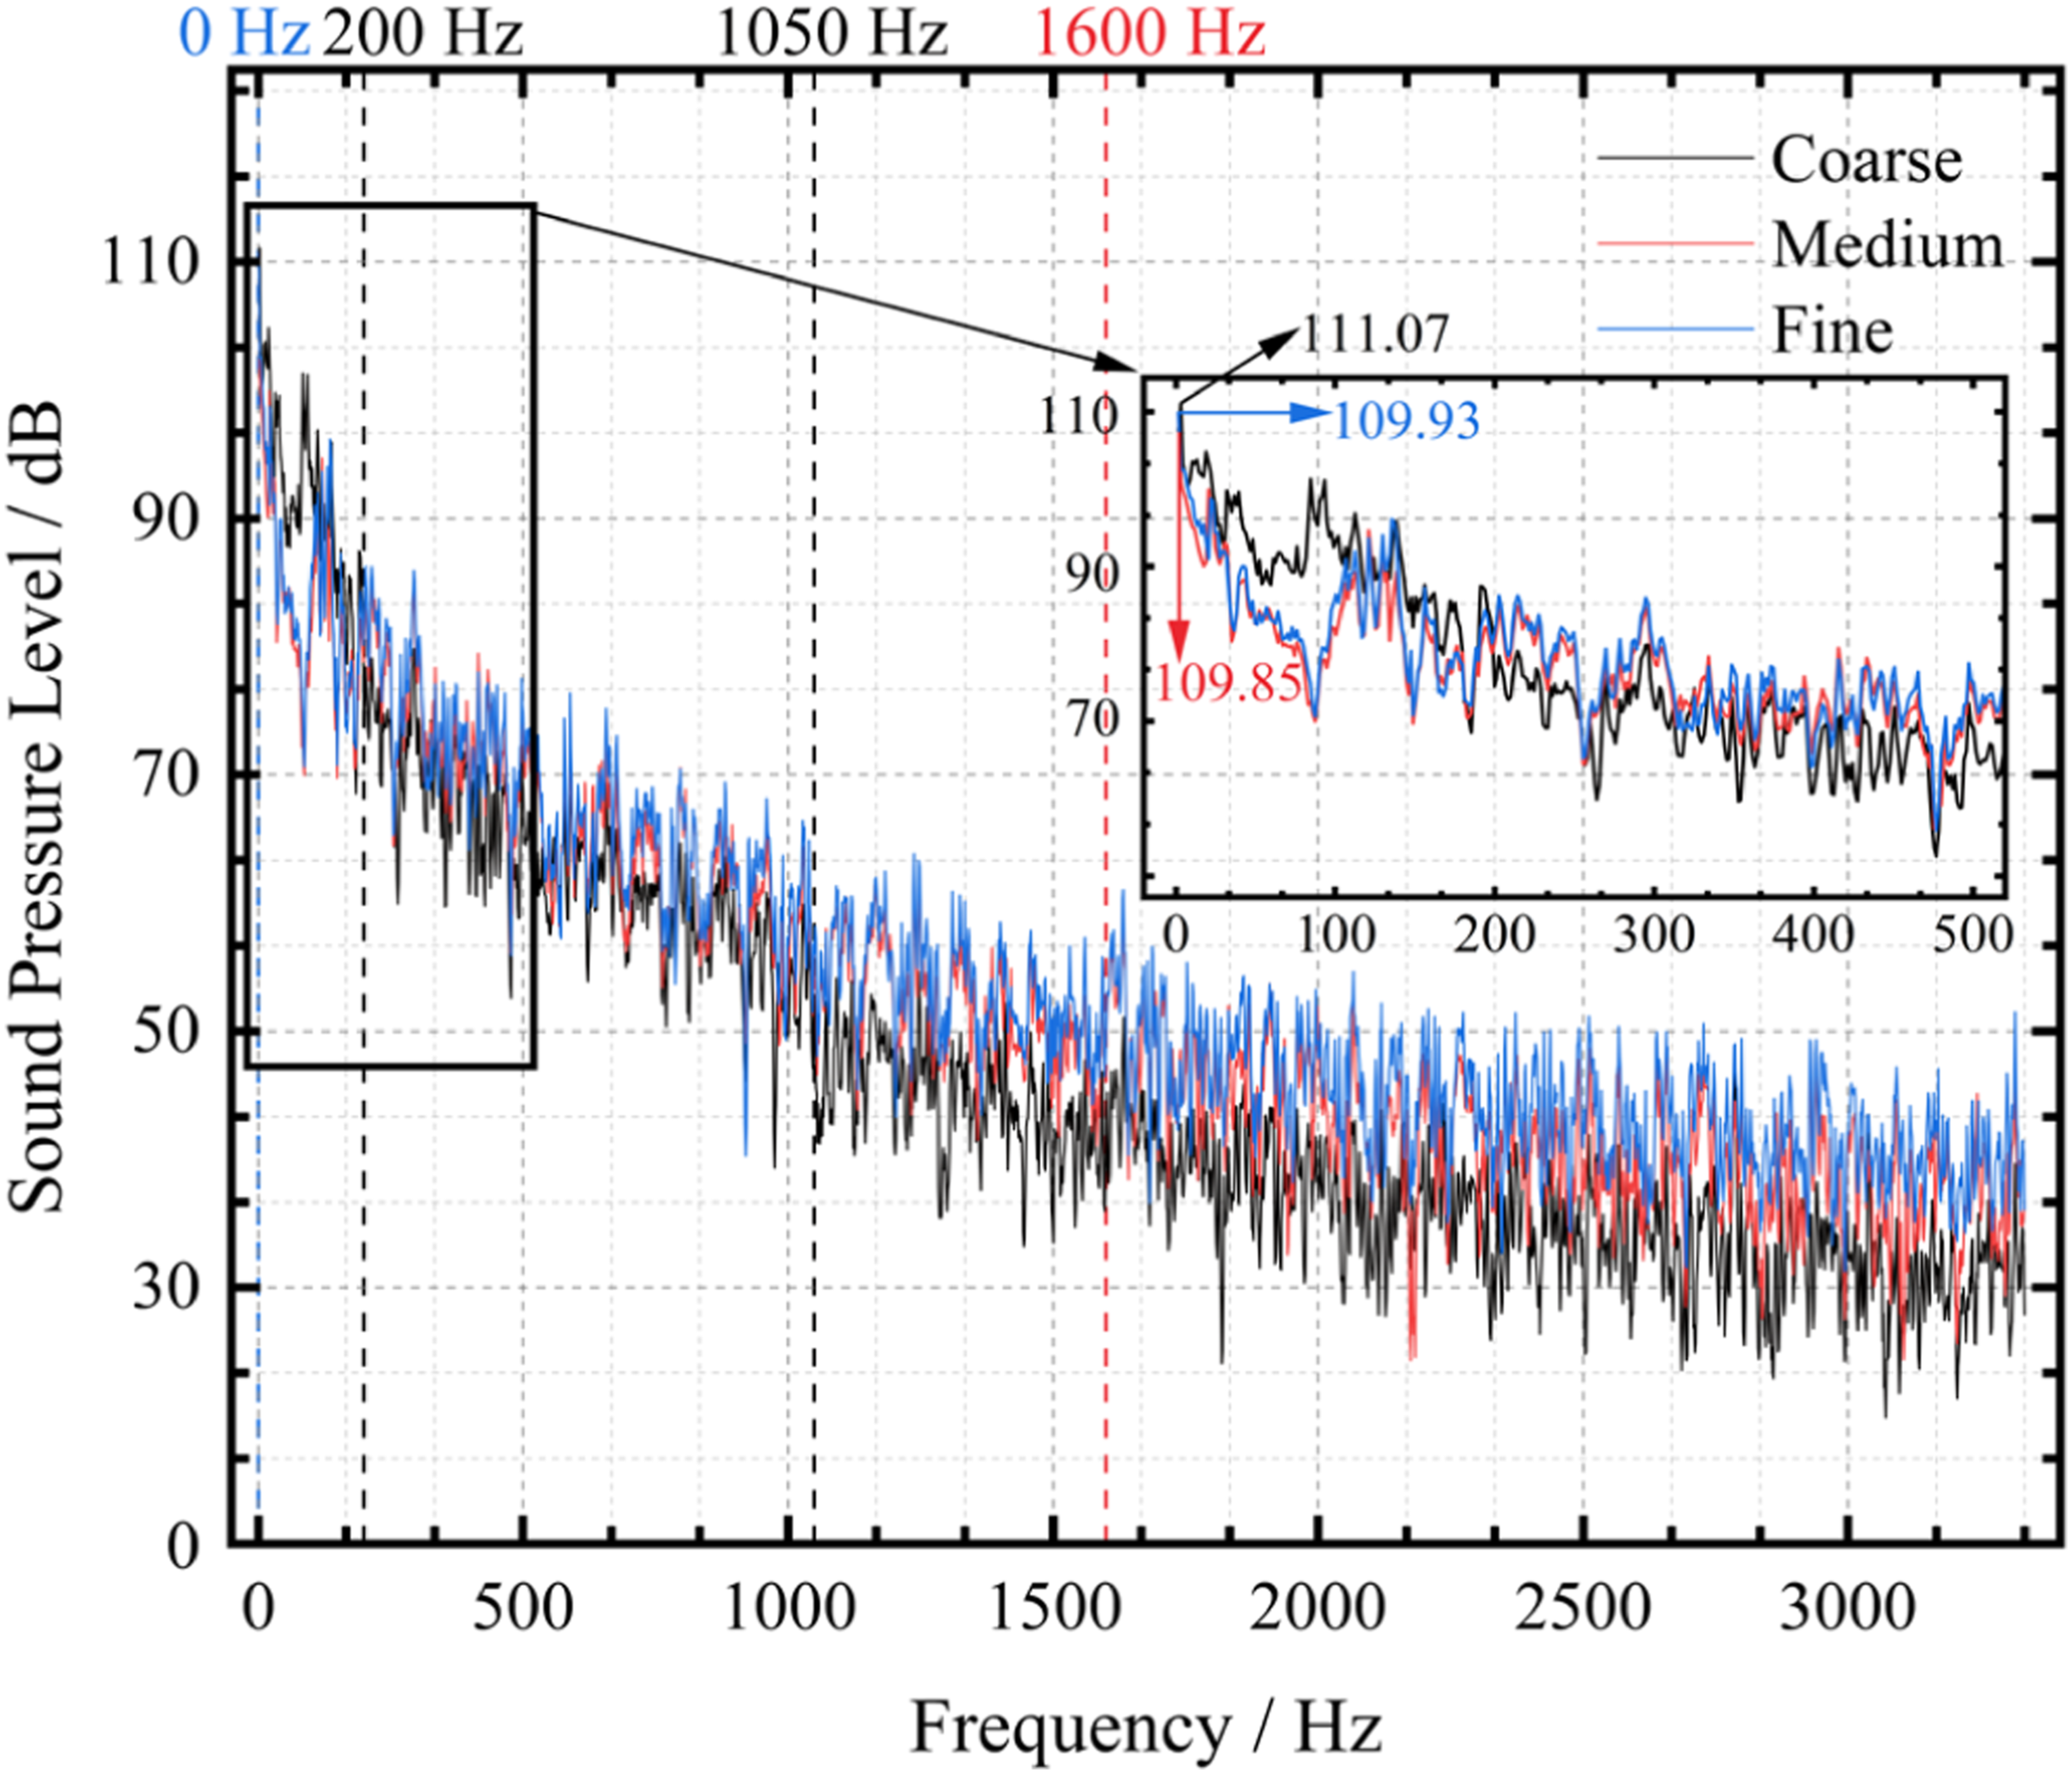
Exploration of the relationship between vortex structures and aerodynamic noise source in ring-gap flow field
The Large Eddy Simulation Model (LES) can obtain detailed transient flow field information required for the numerical simulation of aerodynamic noise. 23 It can also accurately simulate the interaction and transfer behavior between large-scale and small-scale vortices caused by fluid flow in the hoistway, better reflecting the actual flow situation in the ring-gap space. Therefore, we use LES to simulate the evolution behavior of vortex structures and flow-induced noise characteristics in the ring-gap flow field of the ultra-high-speed elevator.
Temporal and spatial evolution regularity of vortex structures
Accurately calculating the fluctuating pressure on the surface of the elevator car is a prerequisite for studying the dynamic behavior of the ring-gap flow field of the ultra-high-speed elevator, and accurately capturing the vortex structures of various scales in the flow field is a prerequisite for accurately calculating the surface pressure of the elevator car. The Q-criterion has the advantages of low computational complexity and high computational accuracy and can be used to accurately identify vortex structures in the flow field. Its expression is as follows:
Figure 5 shows the instantaneous vortex structures of the elevator car for different Q values at t = 0.3 s, colored by vorticity. The vorticity was measured in units of s−1. As can be seen from Figure 5, when the airflow flows through the elevator car, it separates, starts to fall off from the top of the elevator car along the wall, and gradually develops into worm-shaped large-scale vortices moving downstream along the car wall, which is called the worm vortex. At the same time, in the wake area of the elevator car, vortex structures of different scales are nested with each other, generating intense fluctuating pressure in this area. Vortex structures can be divided into two categories according to their spatial characteristics. The first type comes from the top area of the elevator car, and the second type comes from the wake area of the elevator car. As the Q value of the isosurface increases from 600 s−1 to 3000 s−1, the distribution range of vortices gradually decreases, and the scale of the vortex structures rapidly decreases, getting closer to the surface of the elevator car. There are a large number of small-scale vortices in the wake area of the elevator car. The results show that the size of the vortex structures falling off the top of the elevator car is larger, and the vorticity is smaller on a smaller time scale, while the wake area of the car is just opposite to the top of the car. Instantaneous iso-surface plot of Q-criteria, coloured by vorticity (Velocity = 10 m/s) (a) Q = 600; (b) Q = 3000.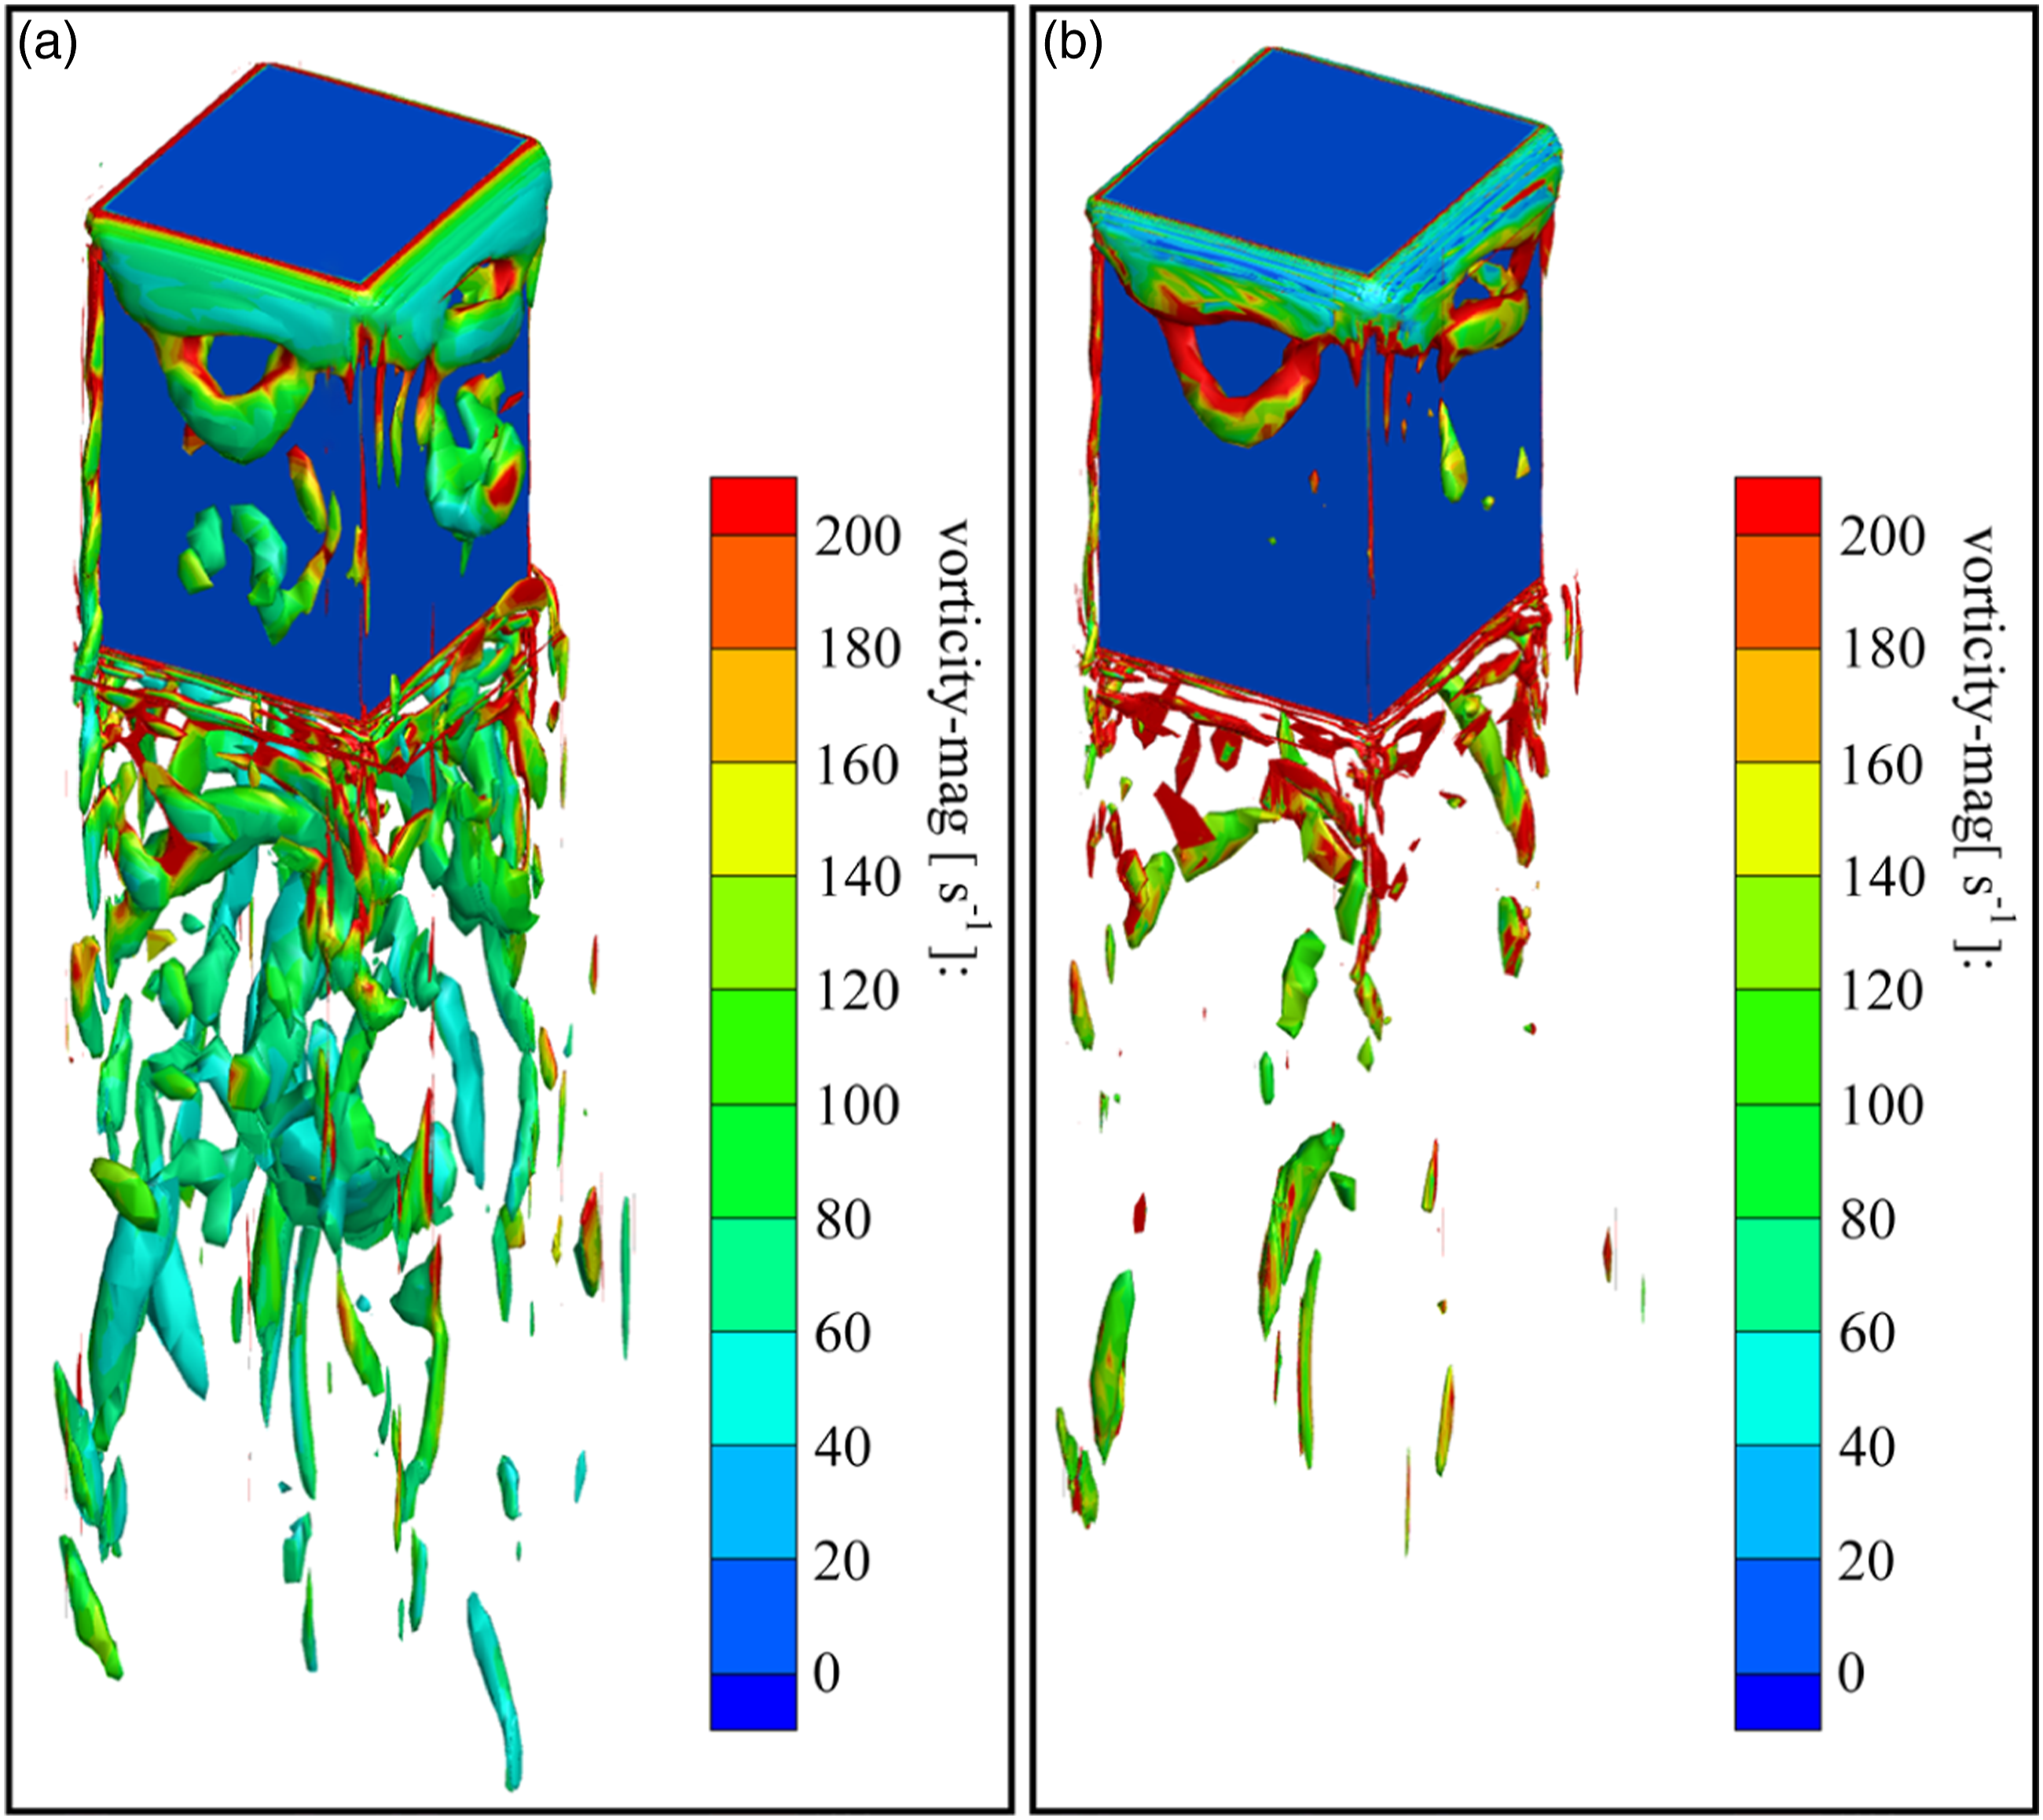
Figure 6 shows the development process of vortex structures over time in the ring-gap flow field. This paper only presents the vorticity contour lines at different times when the Q value is 600 at a speed of 6 m/s. In Figure 6, the evolution of the vortex structures over time is marked by red circles. The worm vortex structures that move downwards along the elevator car wall meet the lower vortex structure at the waking edge of the car and develop into long hairpin vortex structures together. Subsequently, the long hairpin vortex structures in the wake area of the elevator car are gradually broken into small-scale vortex structures in the process of developing downstream, and it has been circulating. The development process of vortex structures at different times is the same, indicating that the shedding of vortex structures on the elevator car surface has a certain periodicity. Time-based development process of vortex structures (Q = 600, Velocity = 6 m/s) (a) Time = 0.36 s; (b) Time = 0.42 s; (c) Time = 0.48 s.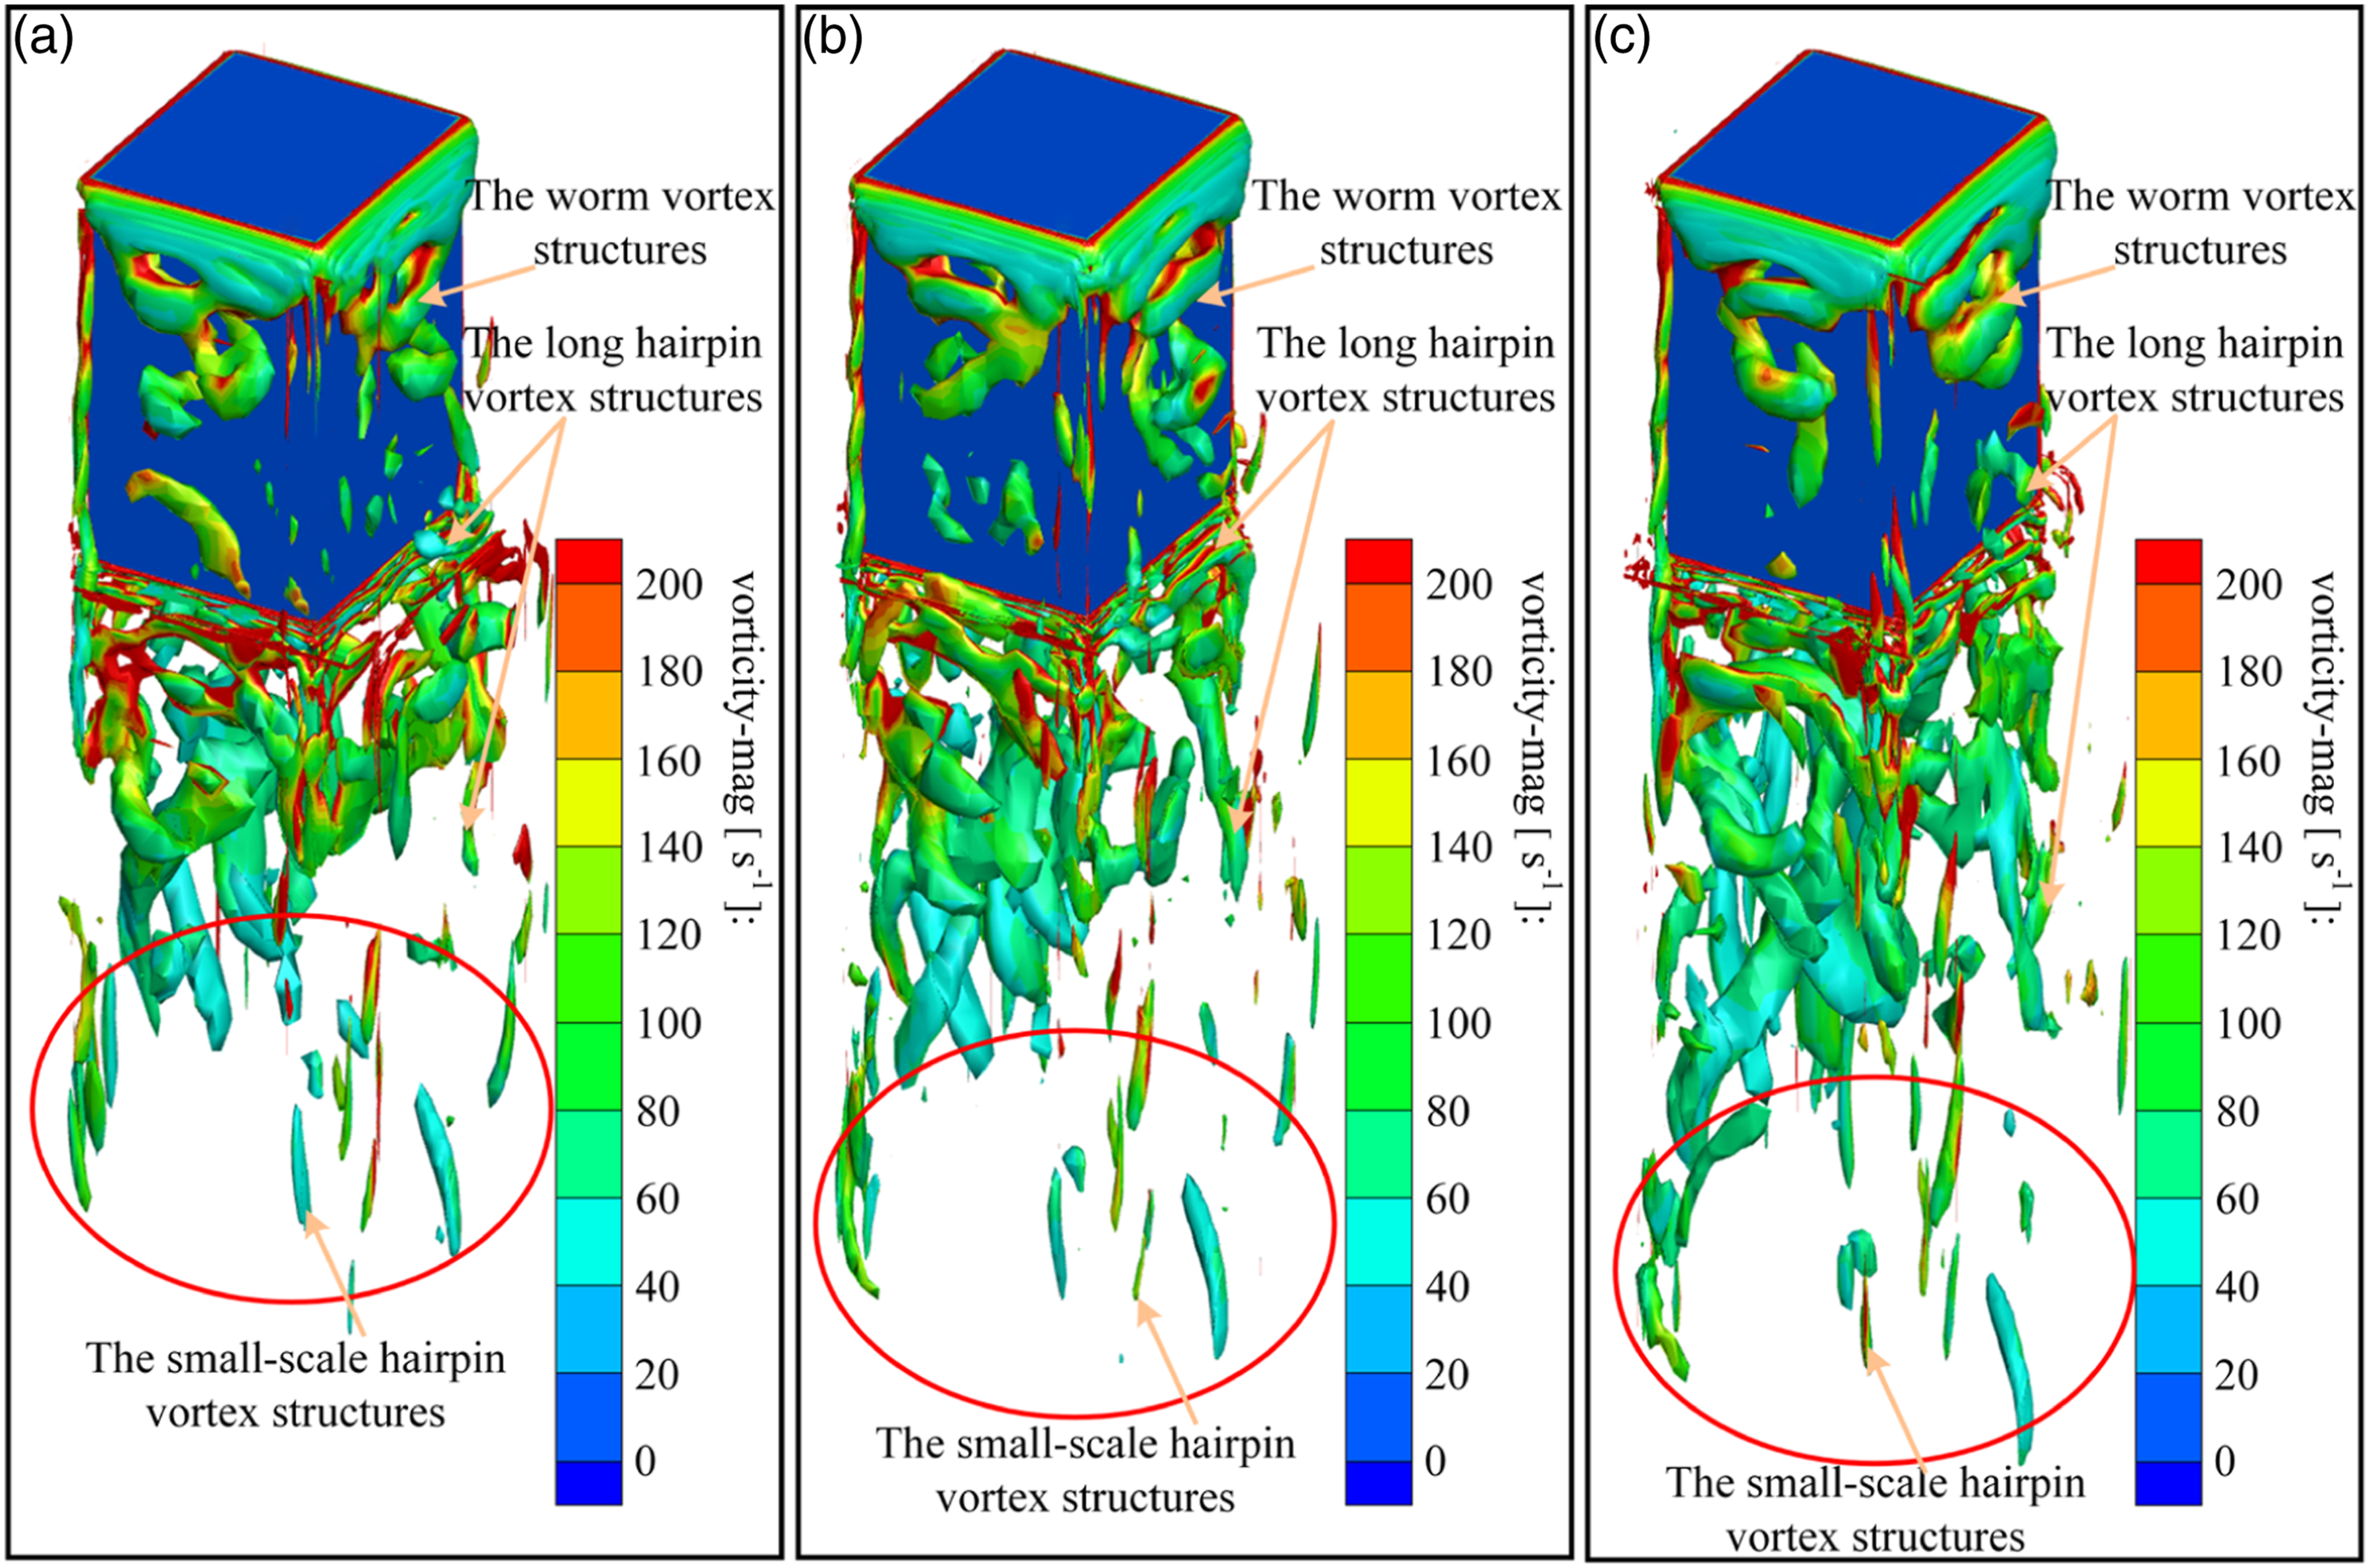
Figure 7 shows the development process of vortex structures in the ring-gap flow field of the ultra-high-speed elevator under inflow velocities of 6 m/s, 10 m/s, and 14 m/s, respectively, and is colored with vorticity. Figure 7 shows that the vortex structures and vorticity in the ring-gap flow field continuously increase with the velocity increase. Although the inflow velocity is different, the shape of the vortex structures is basically the same, developing from the large-scale worm vortex structures to the hairpin vortex with varying scales downstream. Development process of vortex structures under different inflow velocities (Q = 600) (a) Velocity = 6 m/s; (b) Velocity=10 m/s; (c) Velocity = 14 m/s.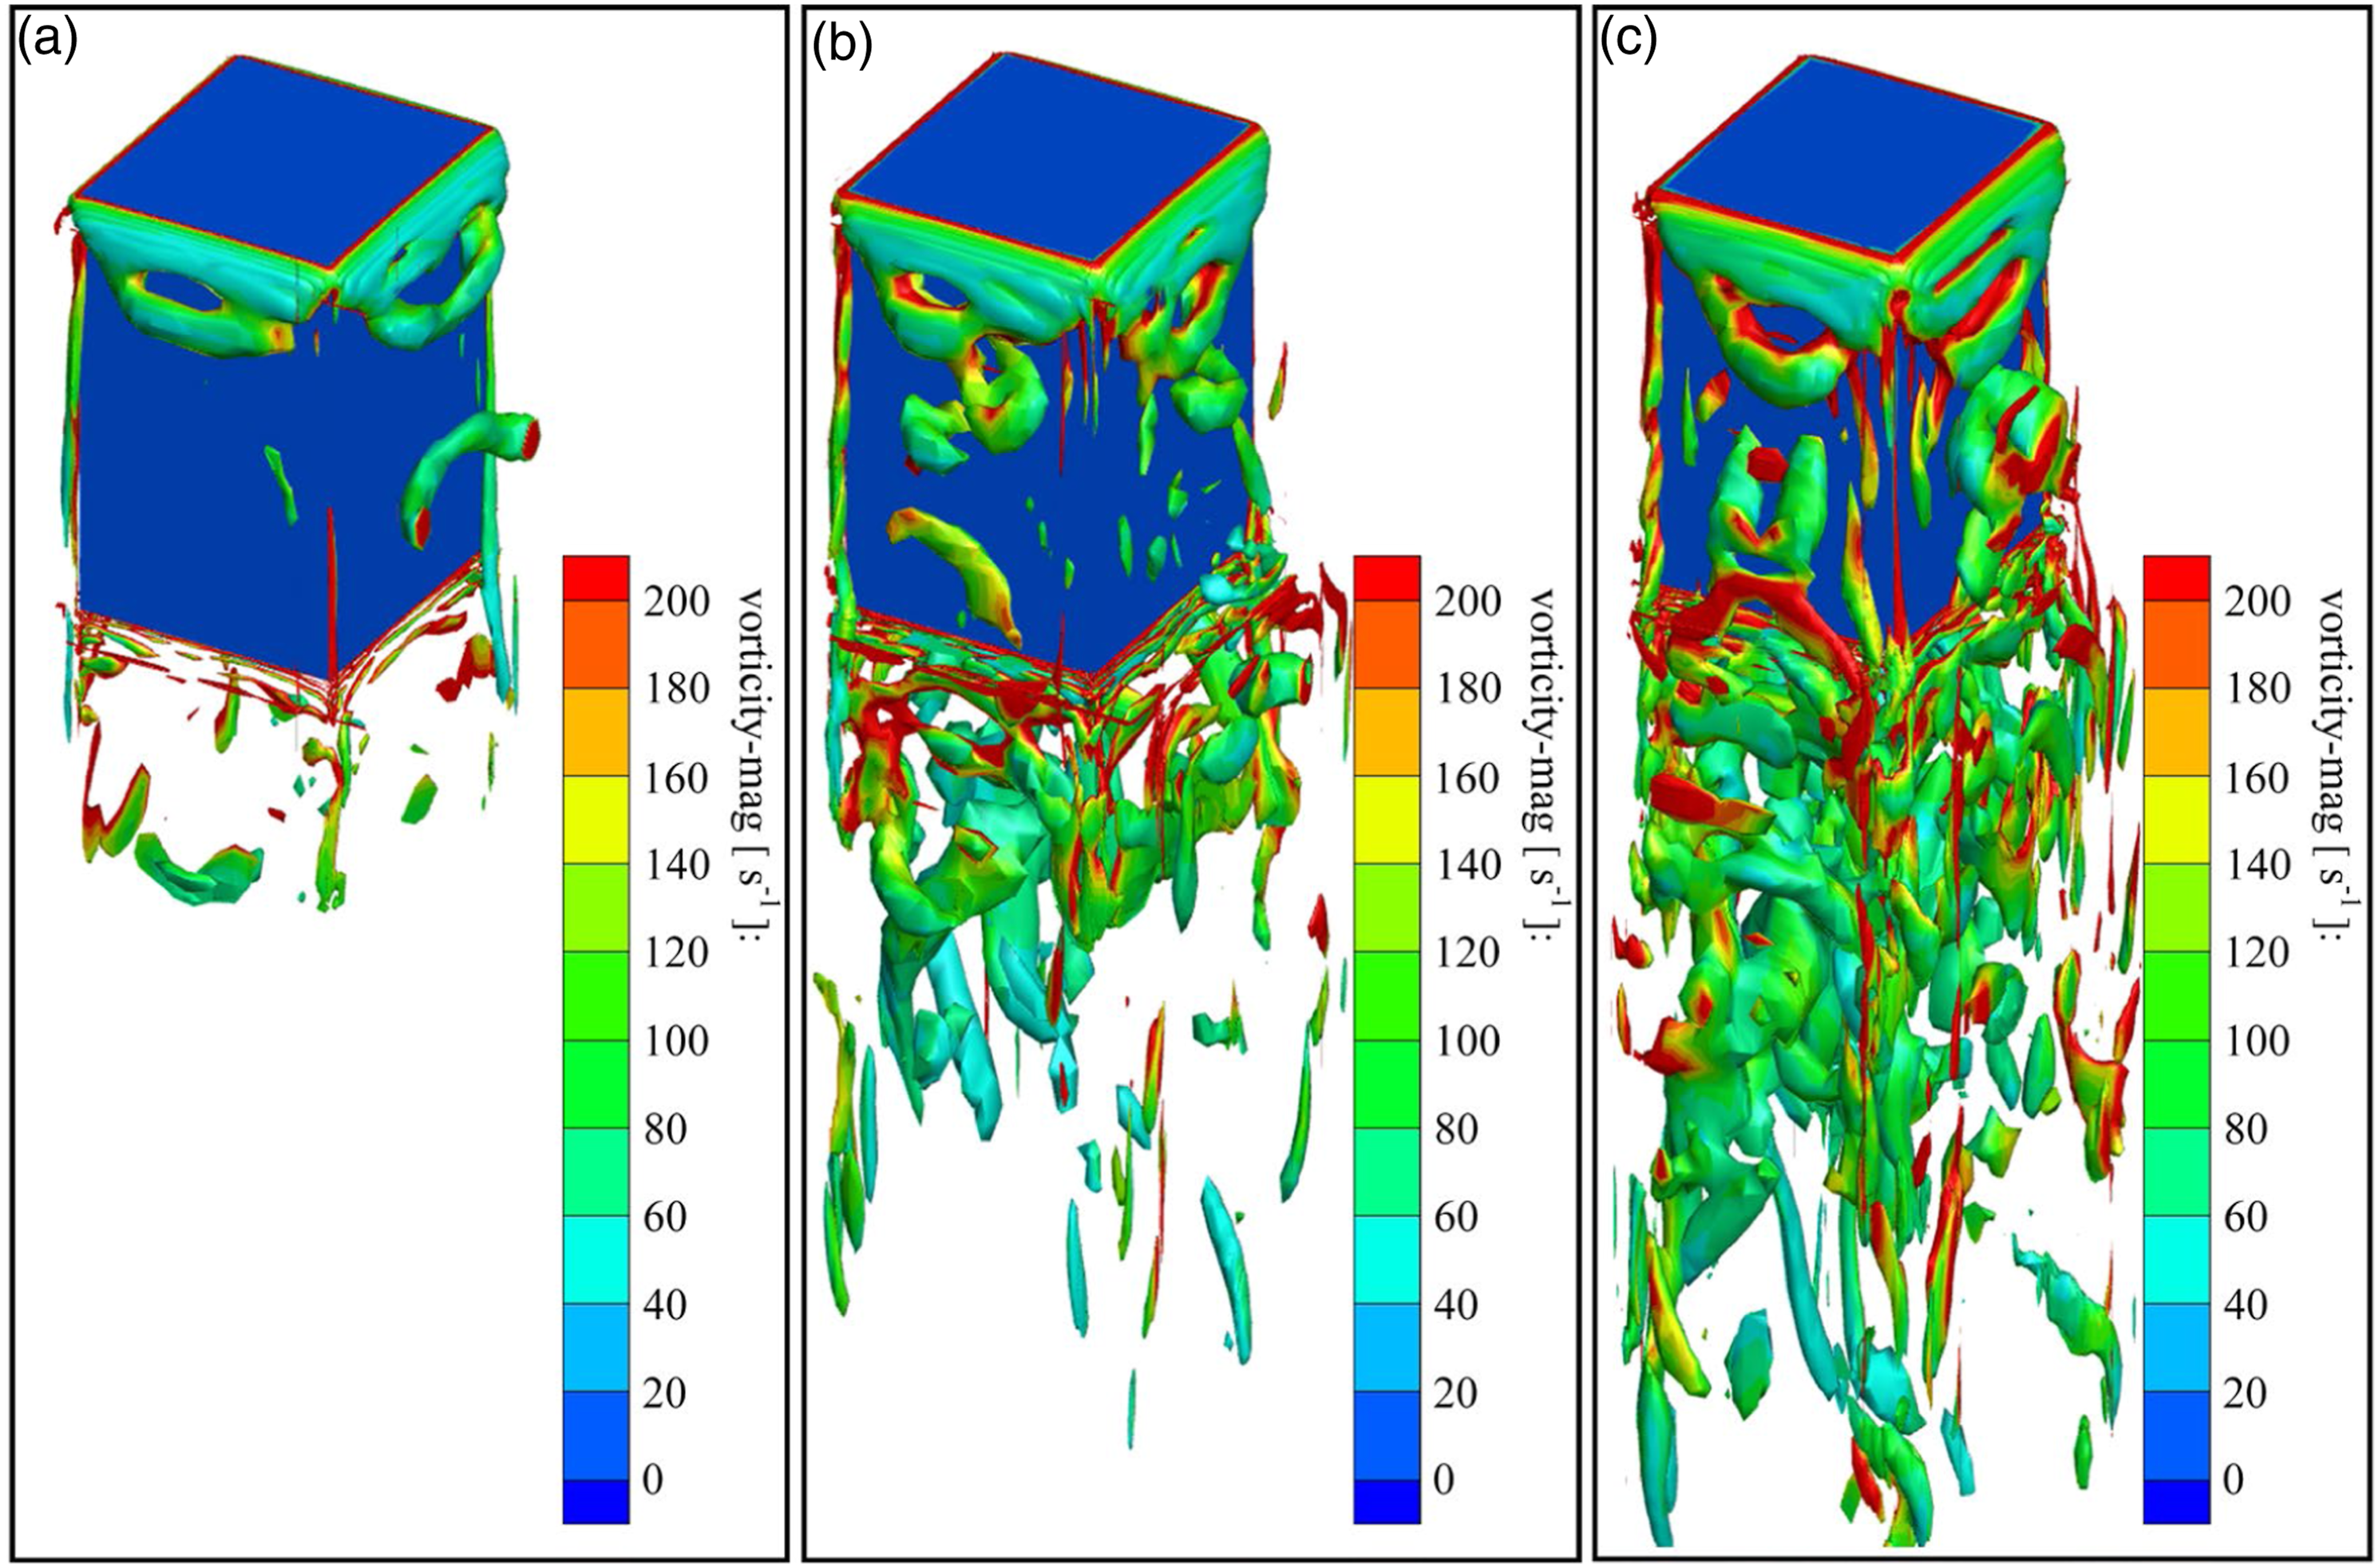
In summary, the vortex structures in the ring-gap flow field of the ultra-high-speed elevator can be divided into two types in space, and the vortex structures have a certain periodicity with time.
The relationship between vortex structures and aerodynamic noise source intensity
This section discusses the relationship between the elevator car boundary layer vortex shedding and the sound power distribution on the car surface, which provides theoretical support for controlling the sound source intensity on the car surface of the ultra-high-speed elevator.
The aerodynamic noise in the ring-gap flow field of the ultra-high-speed elevator is mainly composed of dipole noise, and its intensity is determined by the aerodynamic behavior of the fixed surface of the car.24,25 Therefore, the Lighthill-Curle aeroacoustic equation can solve the dipole noise on the elevator car surface.
26
The Lighthill-Curle equation expression is as follows:
The relationship between the acoustic energy density and sound pressure is as follows:
Considering the ultra-high-speed elevator as a point sound source and ignoring the delay time at low Mach numbers
As can be seen from the comparison of Figures 7 and 8, the speed of the elevator car results in a corresponding increase in the sound power on the car's surface. The sound power is calculated by equation (4). The sound power on the elevator car's surface is mainly distributed in the vortex shedding area, including the four sides of the car top, two side surfaces, and the edge and bottom of the car's behind surface. The vorticity of the vortex structures in these areas also increases with the increase in elevator car speed. It can be seen that among these surfaces, the sound source intensity on the behind surface of the elevator car is the highest, as shown in (d). When the speed is 18 m/s, the sound power level reaches 105 dB. Surface acoustics power level of the car under different inflow velocities (a) Velocity = 6 m/s; (b) Velocity = 10 m/s; (c) Velocity = 14 m/s; (d)Velocity = 18 m/s.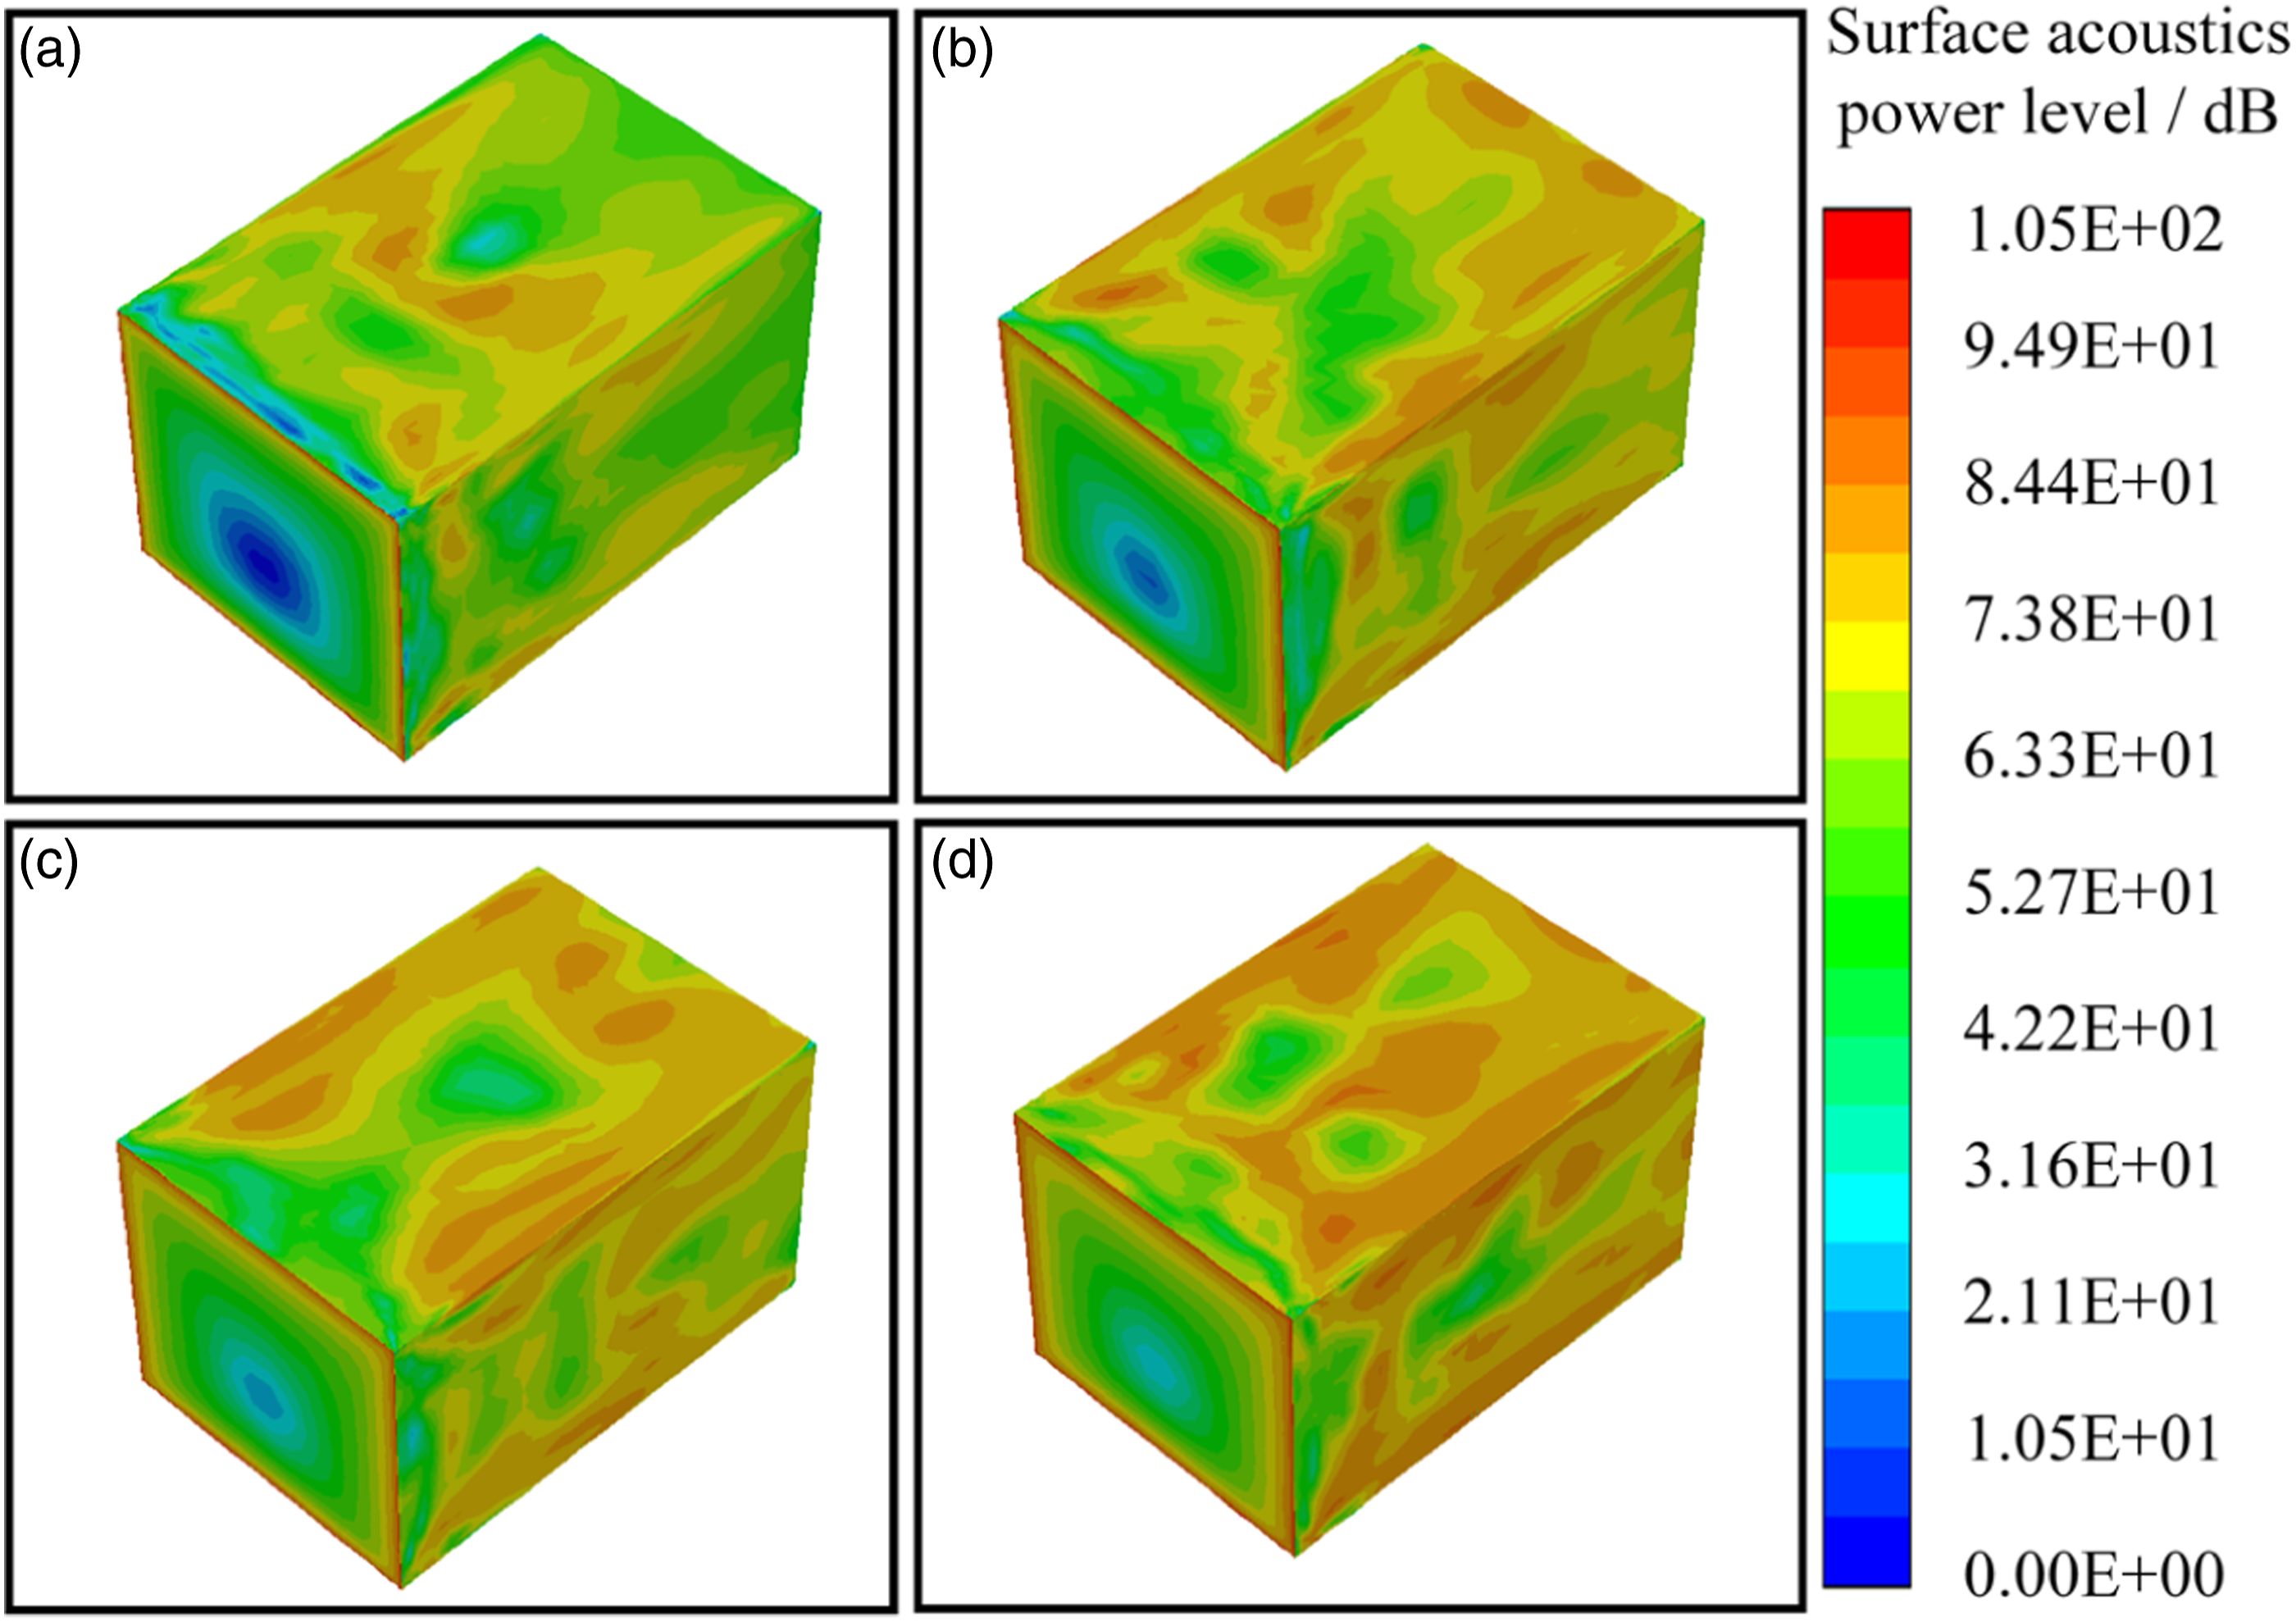
It can be seen from the above analysis that the sound power distribution on the surface of the ultra-high-speed elevator car is closely related to the location of the vortex shedding and the vorticity of the vortex structures.
Study on the influence of different parameters on aerodynamic noise performance in ring-gap flow field
Directivity of aerodynamic noise at different velocities
Figure 9 is a schematic diagram of the aerodynamic noise receiver point of the ultra-high-speed elevator. Due to the limitations of the hoistway space, a noise receiver point is set every 15° in the x-y plane (Directivity1), with a radius of 1.345 m, totaling 20 receiver points. Set one receiver point every 10° in the x-z plane (Directivity2), with a radius of 1.802 m, totaling 22 receiver points. Set one noise receiver point every 10° in the y-z plane (Directivity3), with a radius of 1.749 m, totaling 18 receiver points. Aerodynamic noise receiver points for the ultra-high-speed elevator.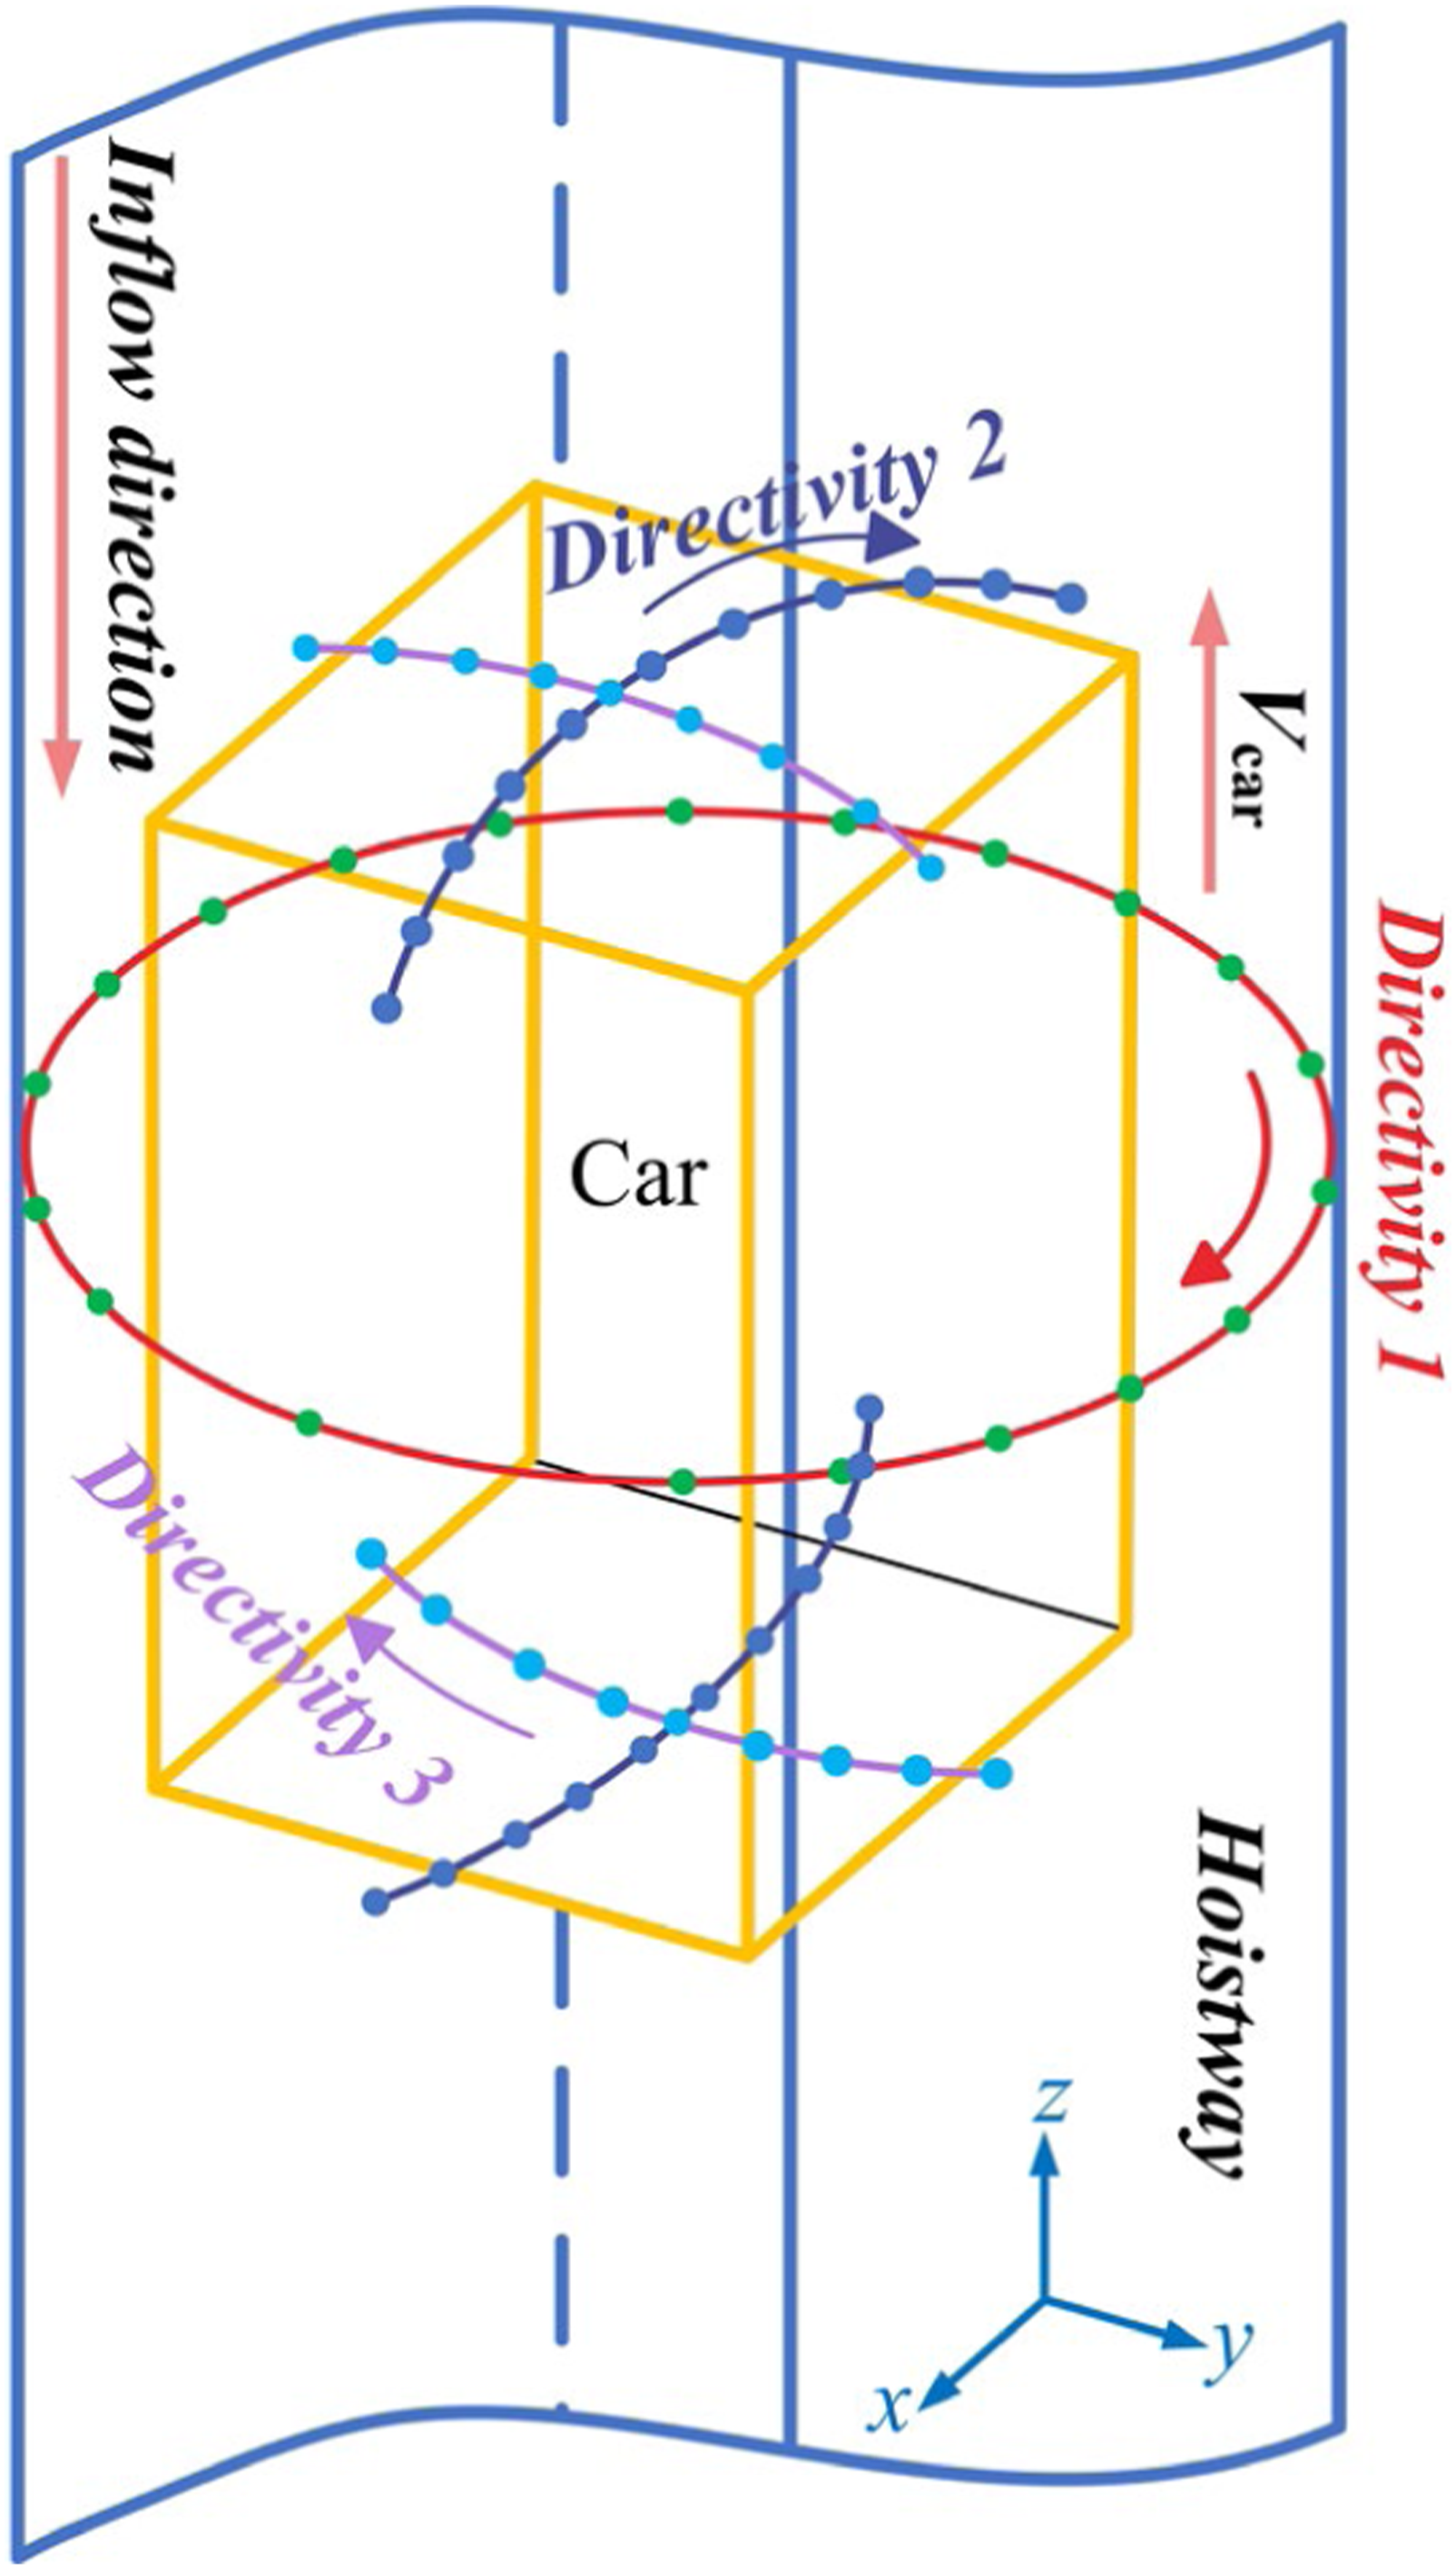
Figure 10 shows the directivity of aerodynamic noise of the ultra-high-speed elevator. The arrows in the diagram indicate the direction of airflow inflow. The curve in Figure 10(a) shows an “8” shape, reflecting the characteristics of a dipole sound source. The SPL of directivity one reaches its maximum value in the range from (75°–105°), that of directivity two reaches its maximum value in the range from (240°–260°), and that of directivity three reaches its maximum value in the range from (270°–290°). From the Figure 10, it can be seen that the SPL of the noise receiver points in three directions has significant asymmetry. The position of the car arrangement in the hoistway may cause the asymmetry of the SPL in directivity 1. The gap between the front wall of the car and the hoistway wall is much smaller than the distance between the back of the car and the hoistway wall, resulting in more turbulent development on the side with more prominent space, thus exhibiting asymmetry in directivity 1. The asymmetry in directions two and three is mainly caused by the gradual increase of airflow disturbance on the leeward side of the elevator car and exceeding that on the windward side. Meanwhile, as the speed increases, the peak SPL of noise in the three directions increases, but there is no significant change in directivity. Directivities of the noise of the ultra-high-speed elevator at different velocities (a) Directivity 1: x-y plane; (b) Directivity 2: x-z plane; (c) Directivity 3: y-z plane.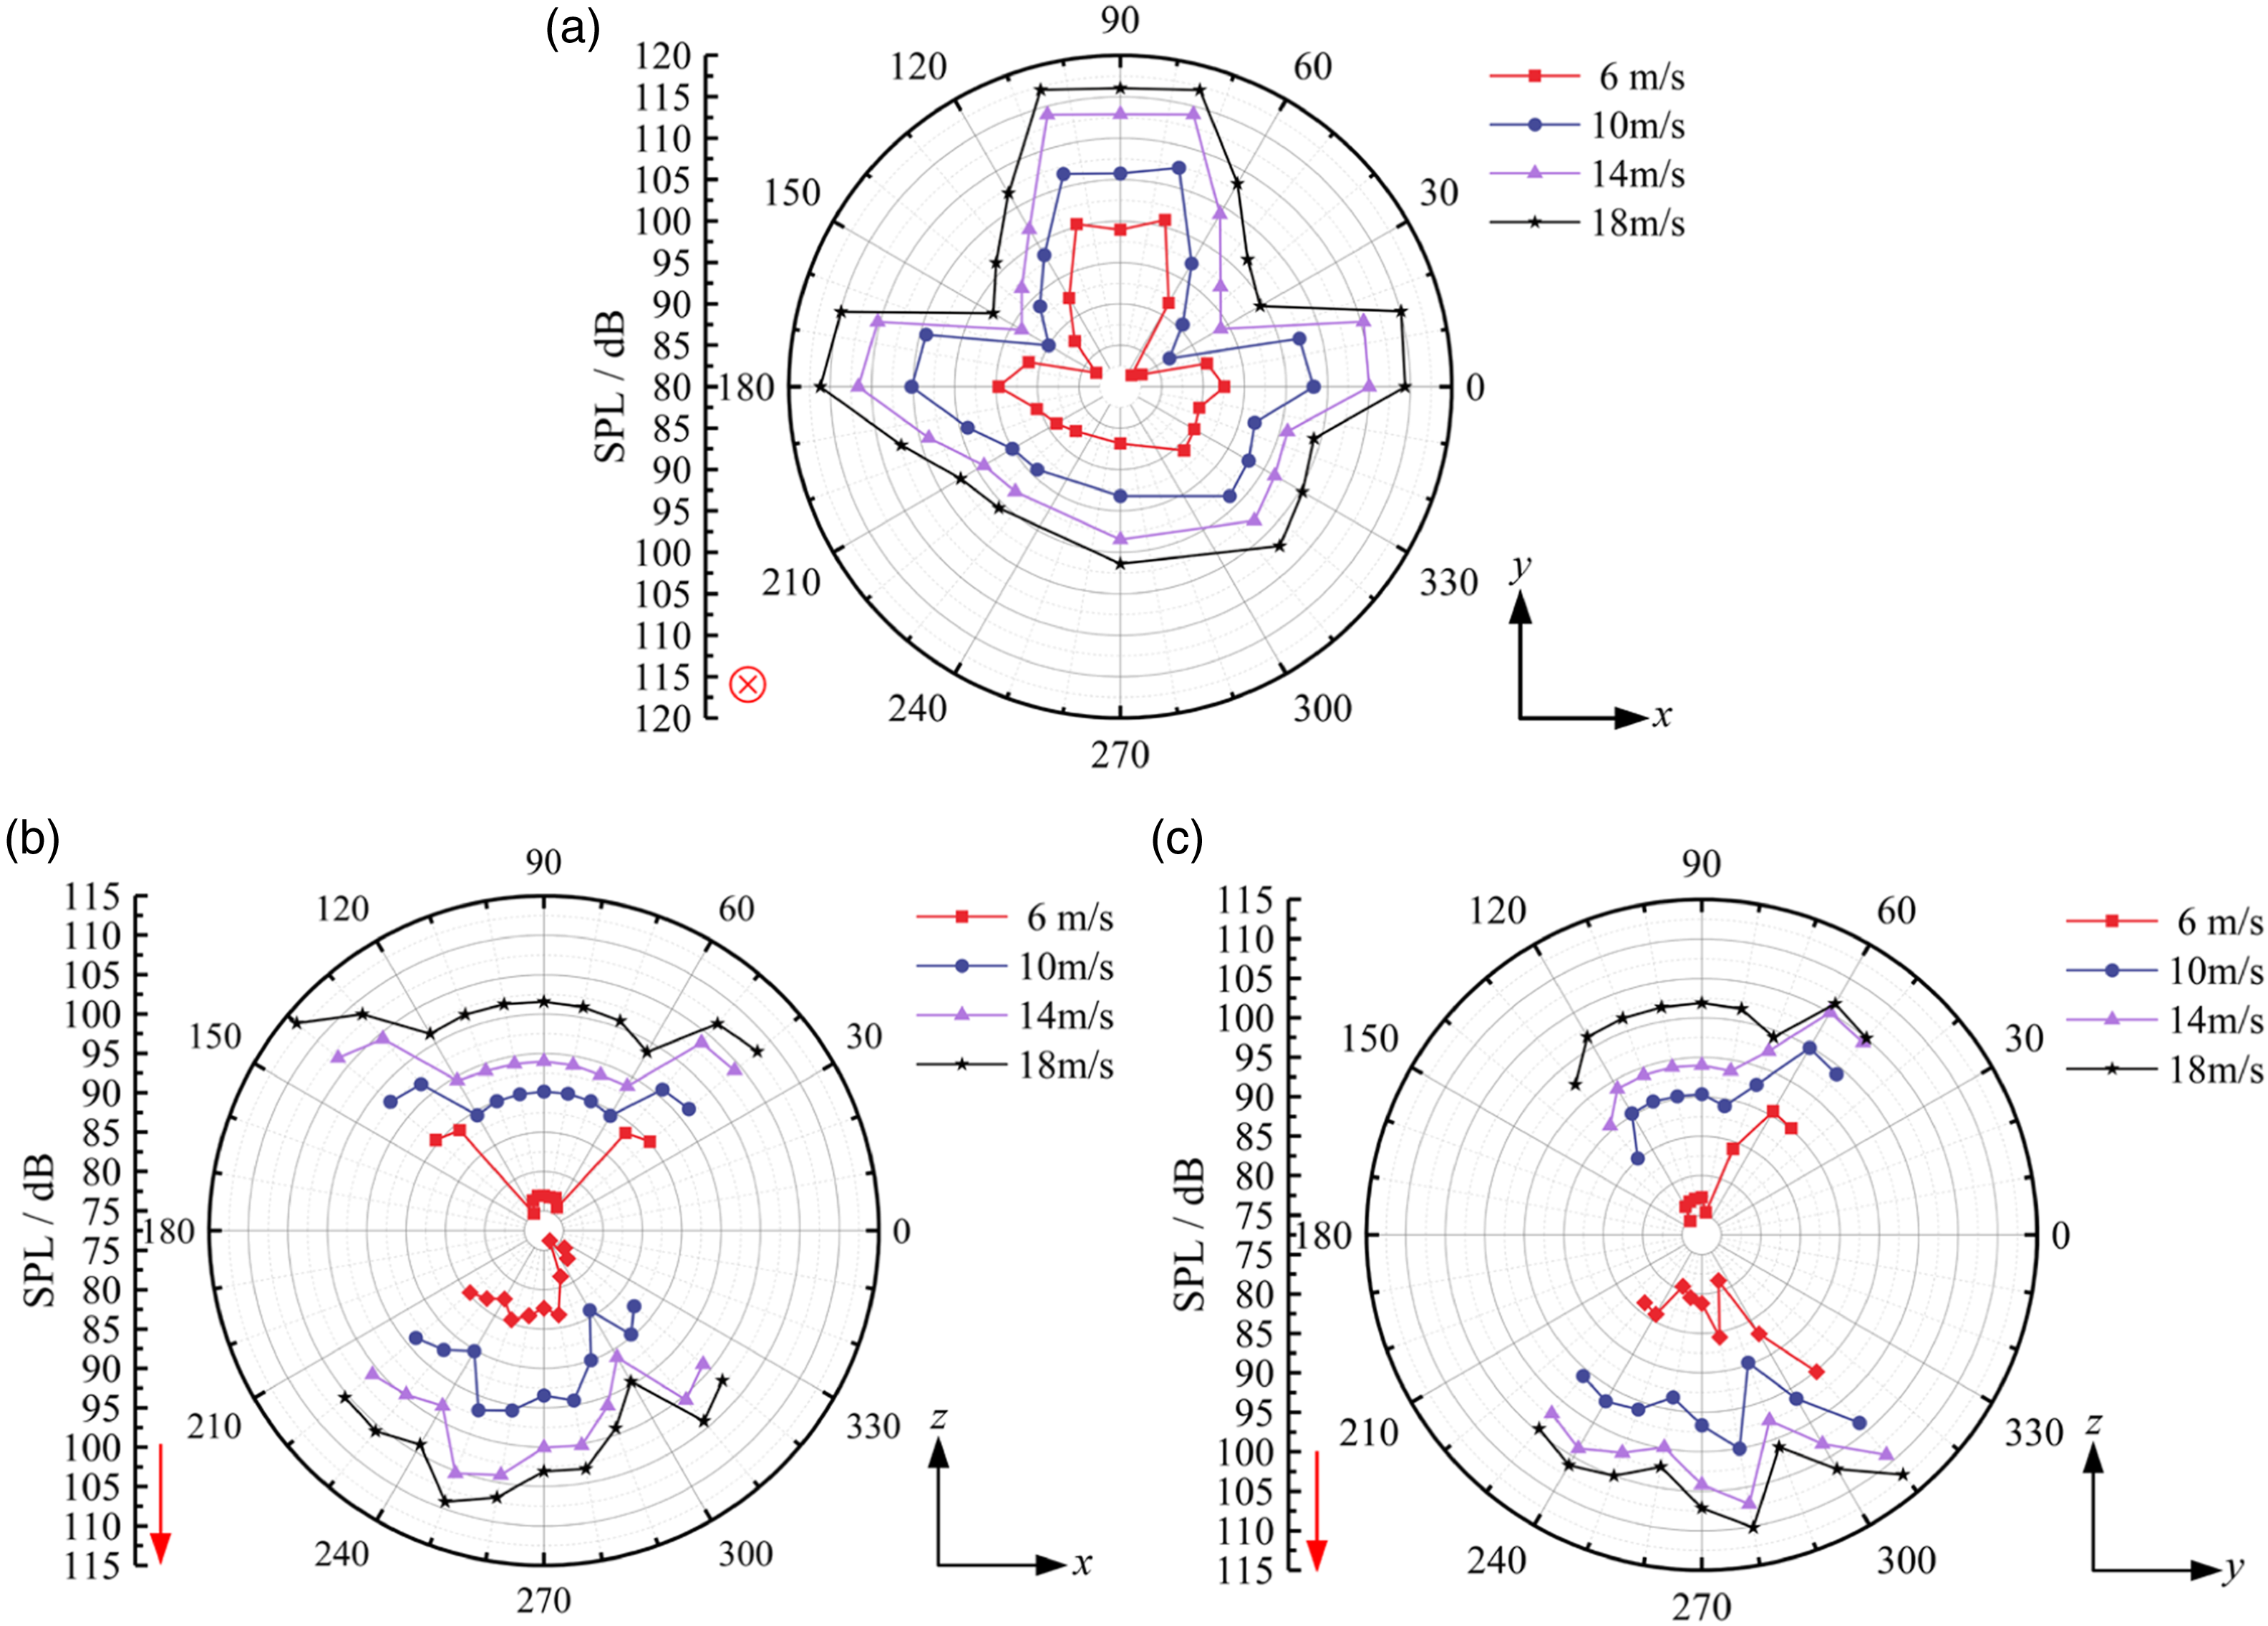
Longitudinal attenuation characteristics of aerodynamic noise under different blocking ratios
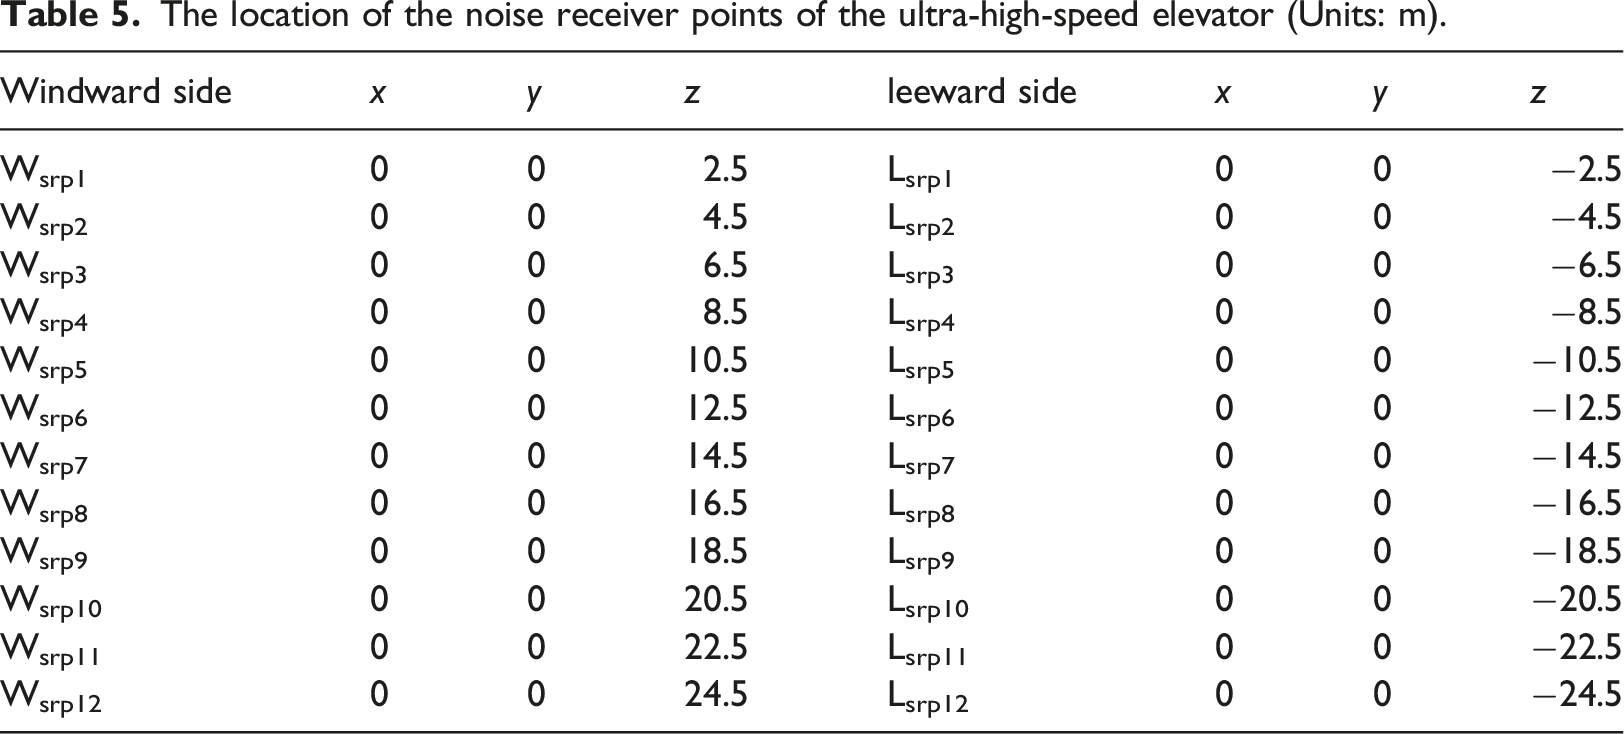
The location of the noise receiver points of the ultra-high-speed elevator (Units: m).
Maximum deviation of SPL from average on windward and leeward sides (Units: dB).


Attenuation of aerodynamic noise relative to longitudinal distance (a) Windward side; (b) Leeward side.
This paper only considers the airflow characteristics of elevator cars caused by dipole noise. The dipole noise is mainly determined by the fluctuating pressure on the elevator car surface, and the turbulent kinetic energy (TKE) can be used to evaluate the intensity of the dipole noise source on the car surface. At the same time, to observe the intensity and distribution of TKE in the hoistway with different blocking ratios, this paper investigates TKE under different blocking ratios. The TKE distribution of the ring-gap flow field around the elevator car under different blocking ratios is shown in Figure 12. The turbulent kinetic energy units is m2·s−2, and the turbulent kinetic energy is defined by equation (6). Turbulent kinetic energy distribution in ring-gap flow filed under different blocking ratios at t = 0.3 s (Velocity = 6 m/s) (a) β = 0.53; (b) β = 0.59; (c) β = 0.65.
In this paper, we only selected three typical blocking ratio turbulent kinetic energy contours. Figure 12 shows that high TKE is mainly distributed between the car and hoistway walls and extends downwards along the car wall. The reason is that the flow cross-section changes suddenly when the incoming flow flows through the car wall on the windward side, which in turn causes the incoming flow to be blocked, and the airflow quickly flows into the gap between the car wall and the hoistway wall, resulting in a strong fluctuating pressure there. In addition, it can be observed that there is a certain similarity in the distribution of the flow field around the elevator car under different blocking ratios, but there is a significant difference in the turbulence intensity of the flow field. The turbulence kinetic energy intensity and vortex shedding velocity on the elevator car surface increase with the increase of the blocking ratio.
As the blocking ratio increases, the wake size in the wake area significantly increases, and the turbulent kinetic energy on the leeward side substantially increases. Although increasing the blocking ratio can improve space occupancy, excessive blocking ratio can lead to unstable flow field pressure around the car and periodic or quasi-periodic shedding of largely separated vortices in the wake area of the car, rapidly enhancing turbulent kinetic energy in the hoistway and deteriorating the acoustic environment inside the hoistway, resulting in a significant increase in aerodynamic noise levels inside the hoistway, seriously affecting the comfort of passengers riding the elevator. Therefore, considering the distribution of sound pressure level and turbulent kinetic energy in the hoistway, it is more appropriate to control the blocking ratio within 0.6 when designing the size of the hoistway structures.
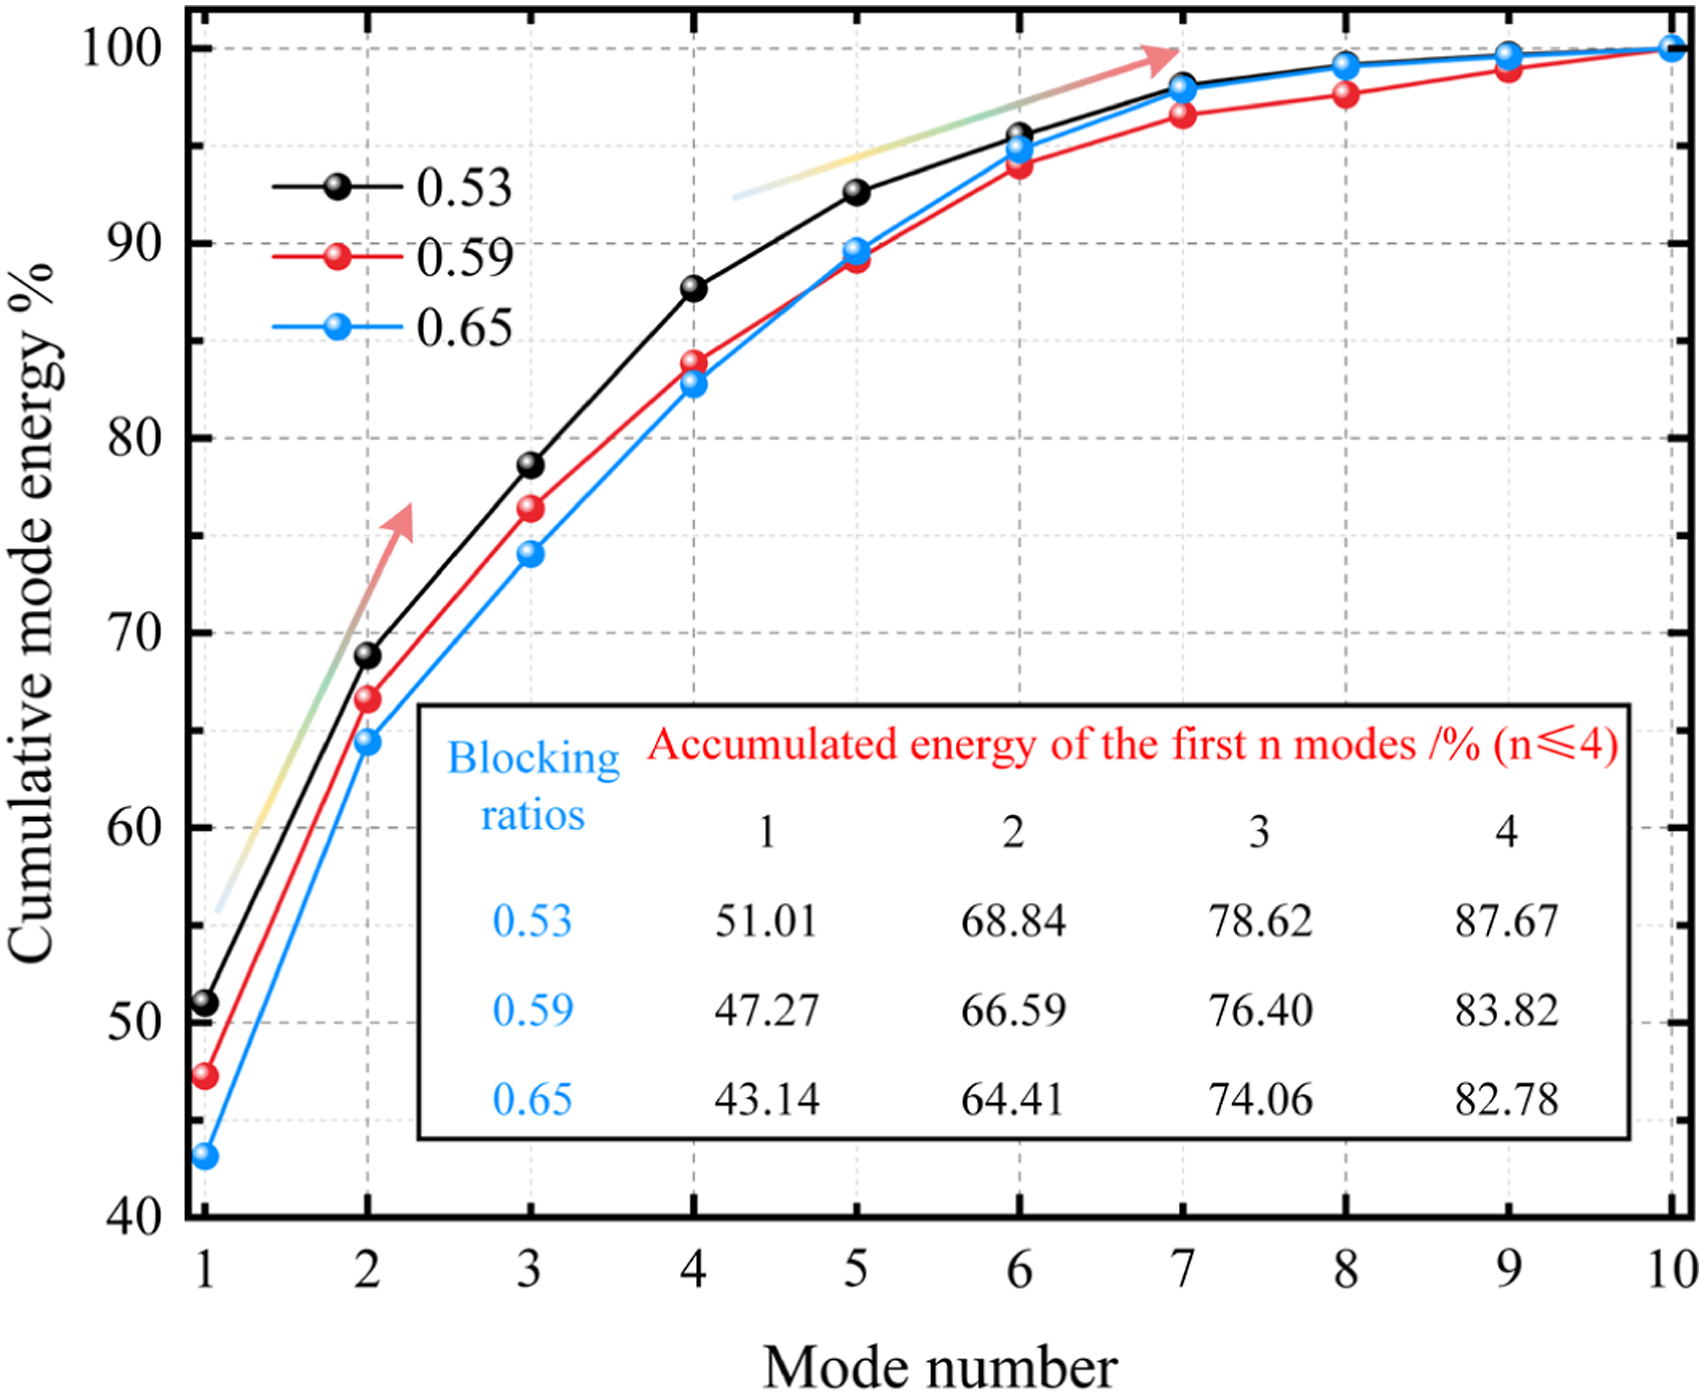
Meanwhile, we use Proper Orthogonal Decomposition (POD) to analyze the first four modes of the turbulent kinetic energy field under different blocking ratios to further observe the changes in the dominant mode of the flow field with different blocking ratios. Figure 13 shows the first four turbulent kinetic energy field modes under different blocking ratios. The development trend of the first four modes under different blocking ratios is basically the same. With the increase of mode order, the scale of the vortex structure also decreases, and the large-scale vortex structure gradually breaks down into a small-scale vortex structure with lower energy, which gradually appears in the higher-order mode (Mode 4) until all the vortex structures are dissipated in the flow field (higher-order mode). Figure 14 shows that when the blocking ratio is 0.53, 0.59, and 0.65, the energy accumulation of the first three modes reaches 78.62%, 76.40%, and 74.06%, respectively. Therefore, the first three modes occupy the majority of energy in the flow field under different blocking ratios. This indicates that the first three modes represent the main flow structure in the flow field, and the turbulent structure has a larger scale and plays a dominant role in convection. The first four POD modes under different blocking ratios (Velocity= 6 m/s). Cumulative mode energy of POD modes.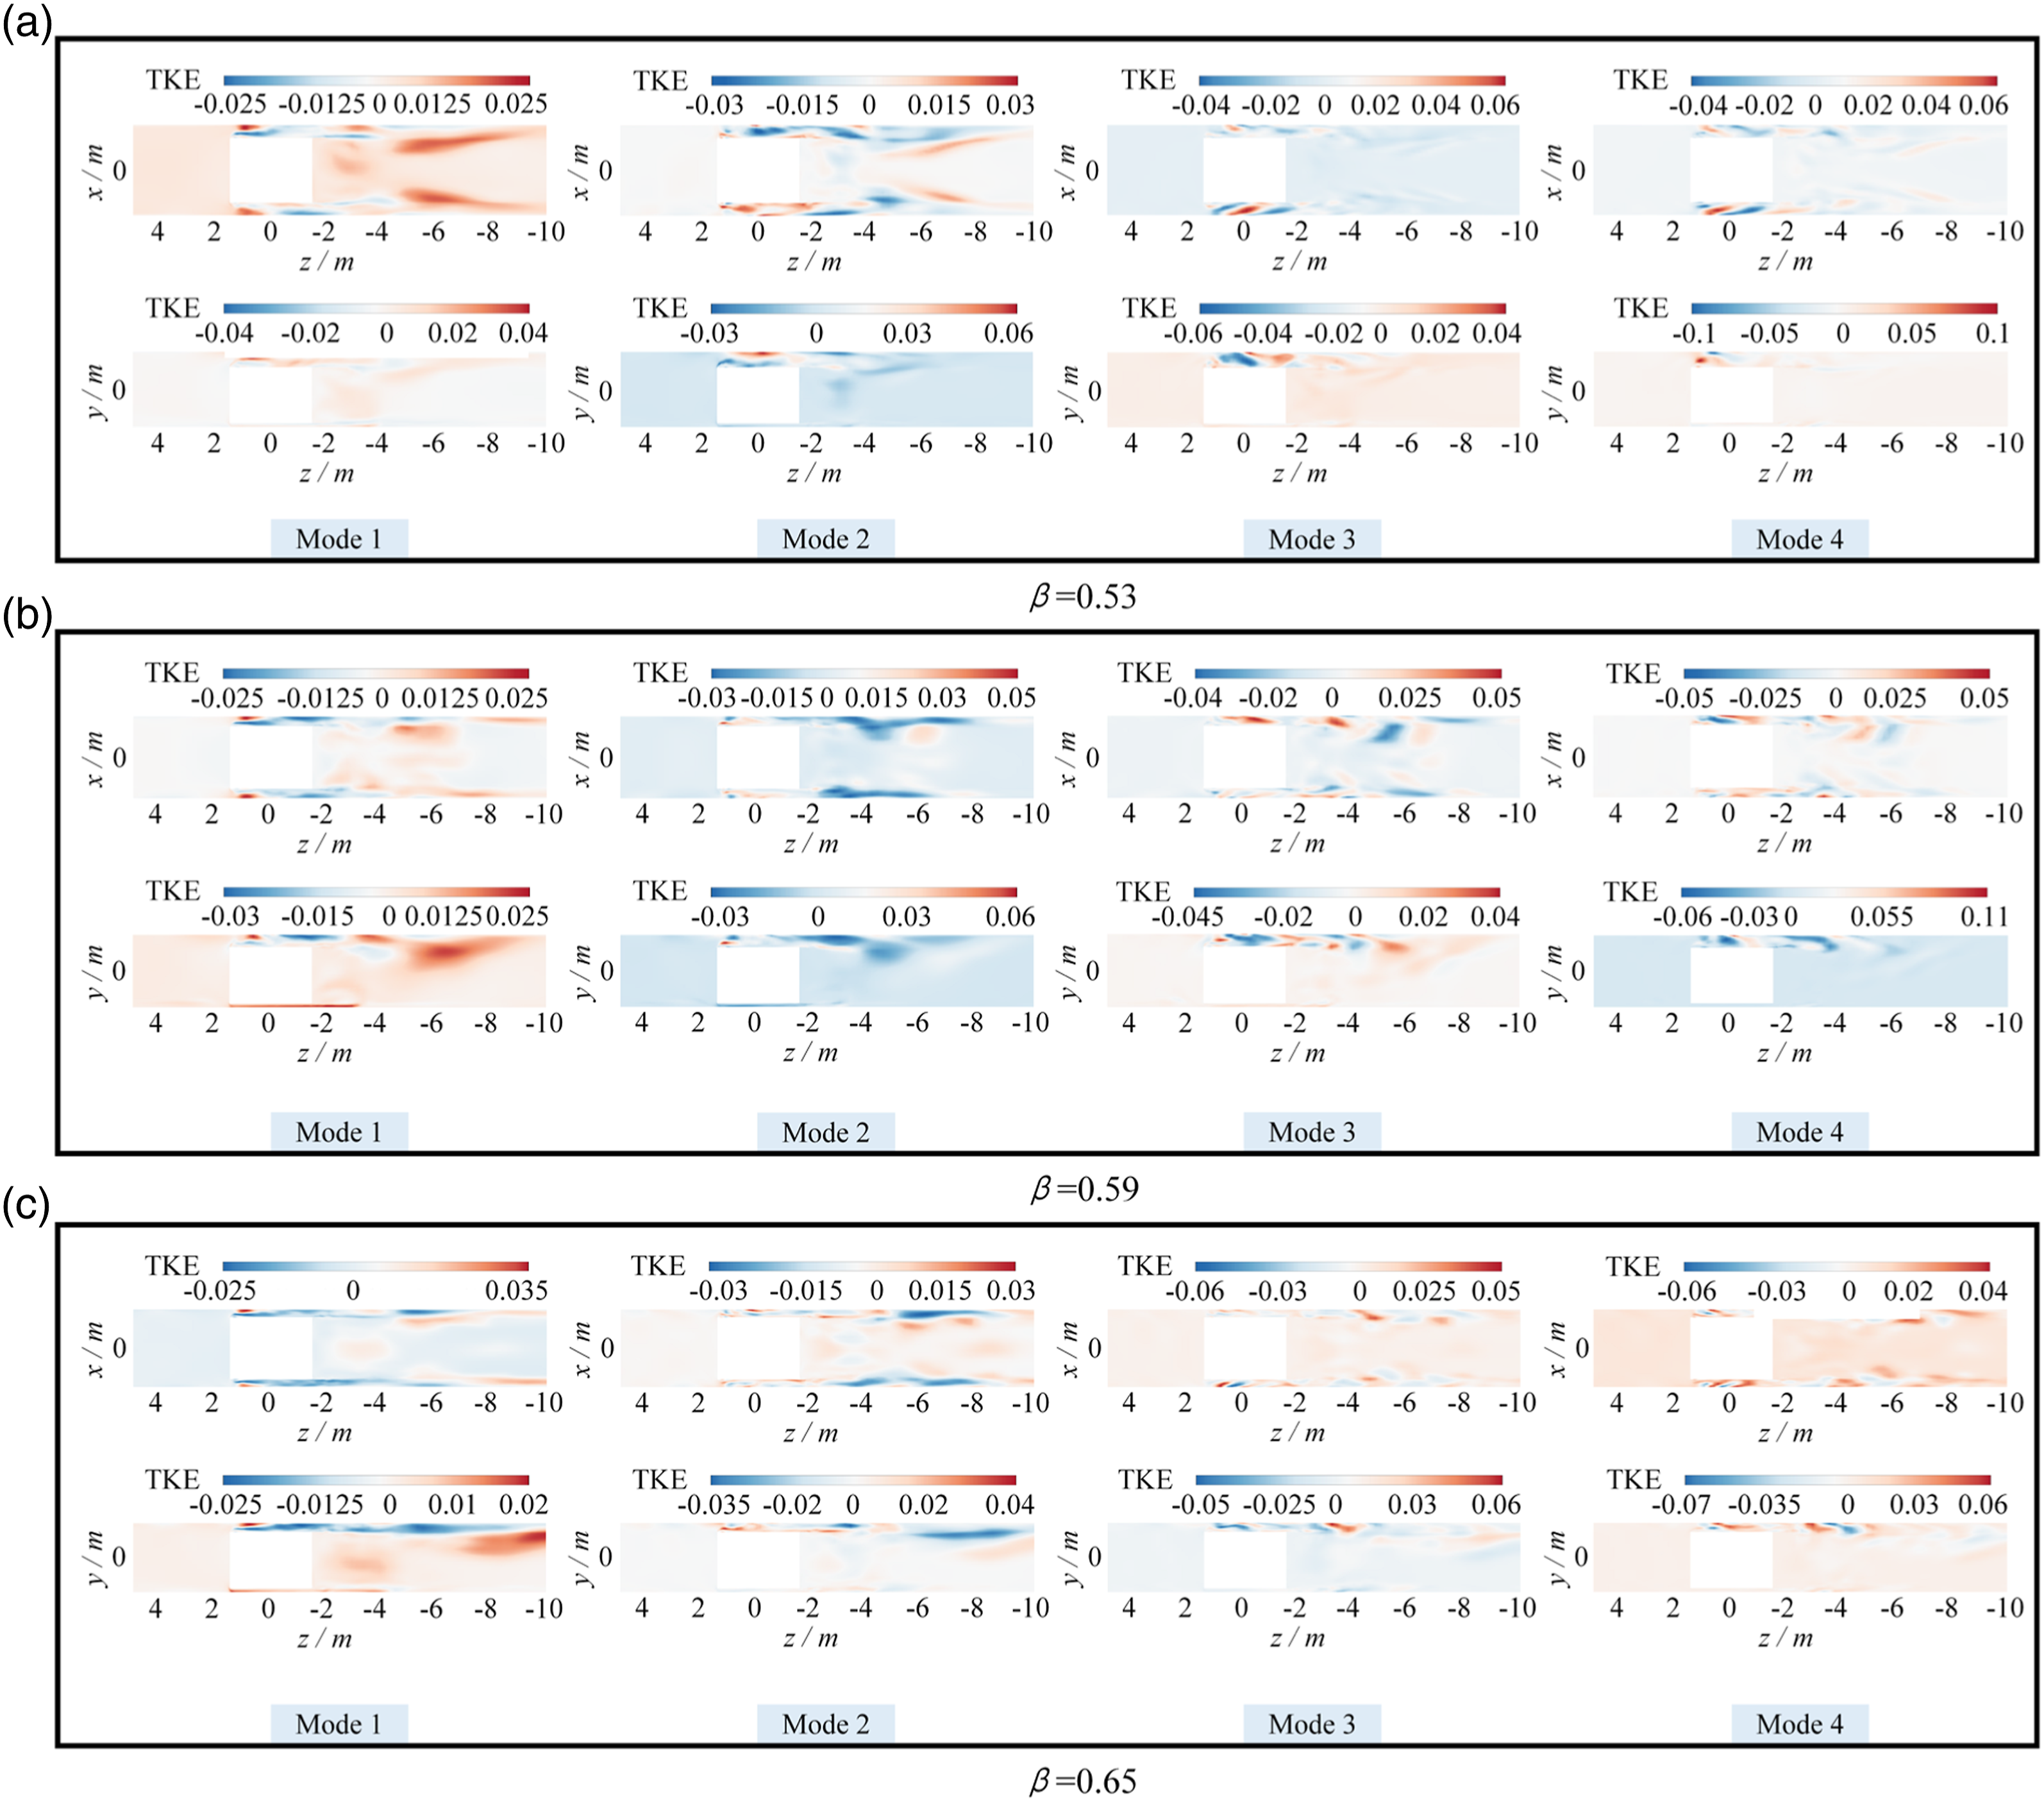
Spectral characteristics of aerodynamic noise at different velocities
To investigate the effects of blocking ratio and operating speed on the spectral characteristics of aerodynamic noise in the ultra-high-speed elevator hoistway, we conducted the spectral analysis of aerodynamic noise in the hoistway with different blocking ratios and velocities. When the elevator operates at a speed of 6 m/s, the flow-induced noise spectrum at the standard noise receiver point (0,0,10.5) m on the leeward side under different blocking ratios is shown in Figure 15 Aerodynamic noise spectrum under different blocking ratios (Velocity= 6 m/s).
The Strouhal number (St) represents the characteristic frequency of the rheological noise at each car wall to analyze the aerodynamic noise spectrum of the ultra-high-speed elevator at different velocities. Since the geometry of the ultra-high-speed elevator is not exactly similar to the cylinder, it remains to be determined whether the radiated noise spectrum shows the similarity of the Strauhal number. The Strouhal number is calculated as follows:
This paper uses the regularity of acoustic similarity to study the characteristic frequencies of each wall of the elevator car at different velocities. Therefore, the same geometric feature length can be applied, so the hydraulic diameter of the elevator car is selected as the characteristic length. Figure 16 shows the noise spectrum of each elevator car wall, with the serial numbers of each wall being the same as the enlarged green circle in Figure 1. The noise spectrum of each wall of the elevator car is calculated by FFT, and the FFT block length is 1024 samples. The spectrum analysis uses the Hanning window with a window overlap rate of 50% and a frequency resolution of 2.86 Hz. From the Figure 16, it can be seen that the noise spectrum of each elevator car surface shows a clear peak. At the same speed, the noise spectrum of each car surface shows a certain degree of acoustic similarity under the Strouhal number. In addition, the vortex shedding frequency St = 1.504 was calculated using the hydraulic diameter of the car. Under different inflow velocities, the peak Strouhal number of each elevator car surface is almost the same, which indicates that the noise of each surface of the elevator car shows a high degree of acoustic similarity at the Strouhal value. Noise Spectral curve of each wall of the car at different inflow velocities. (a) Velocity = 6 m/s; (b) Velocity = 10 m/s; (c) Velocity = 14 m/s.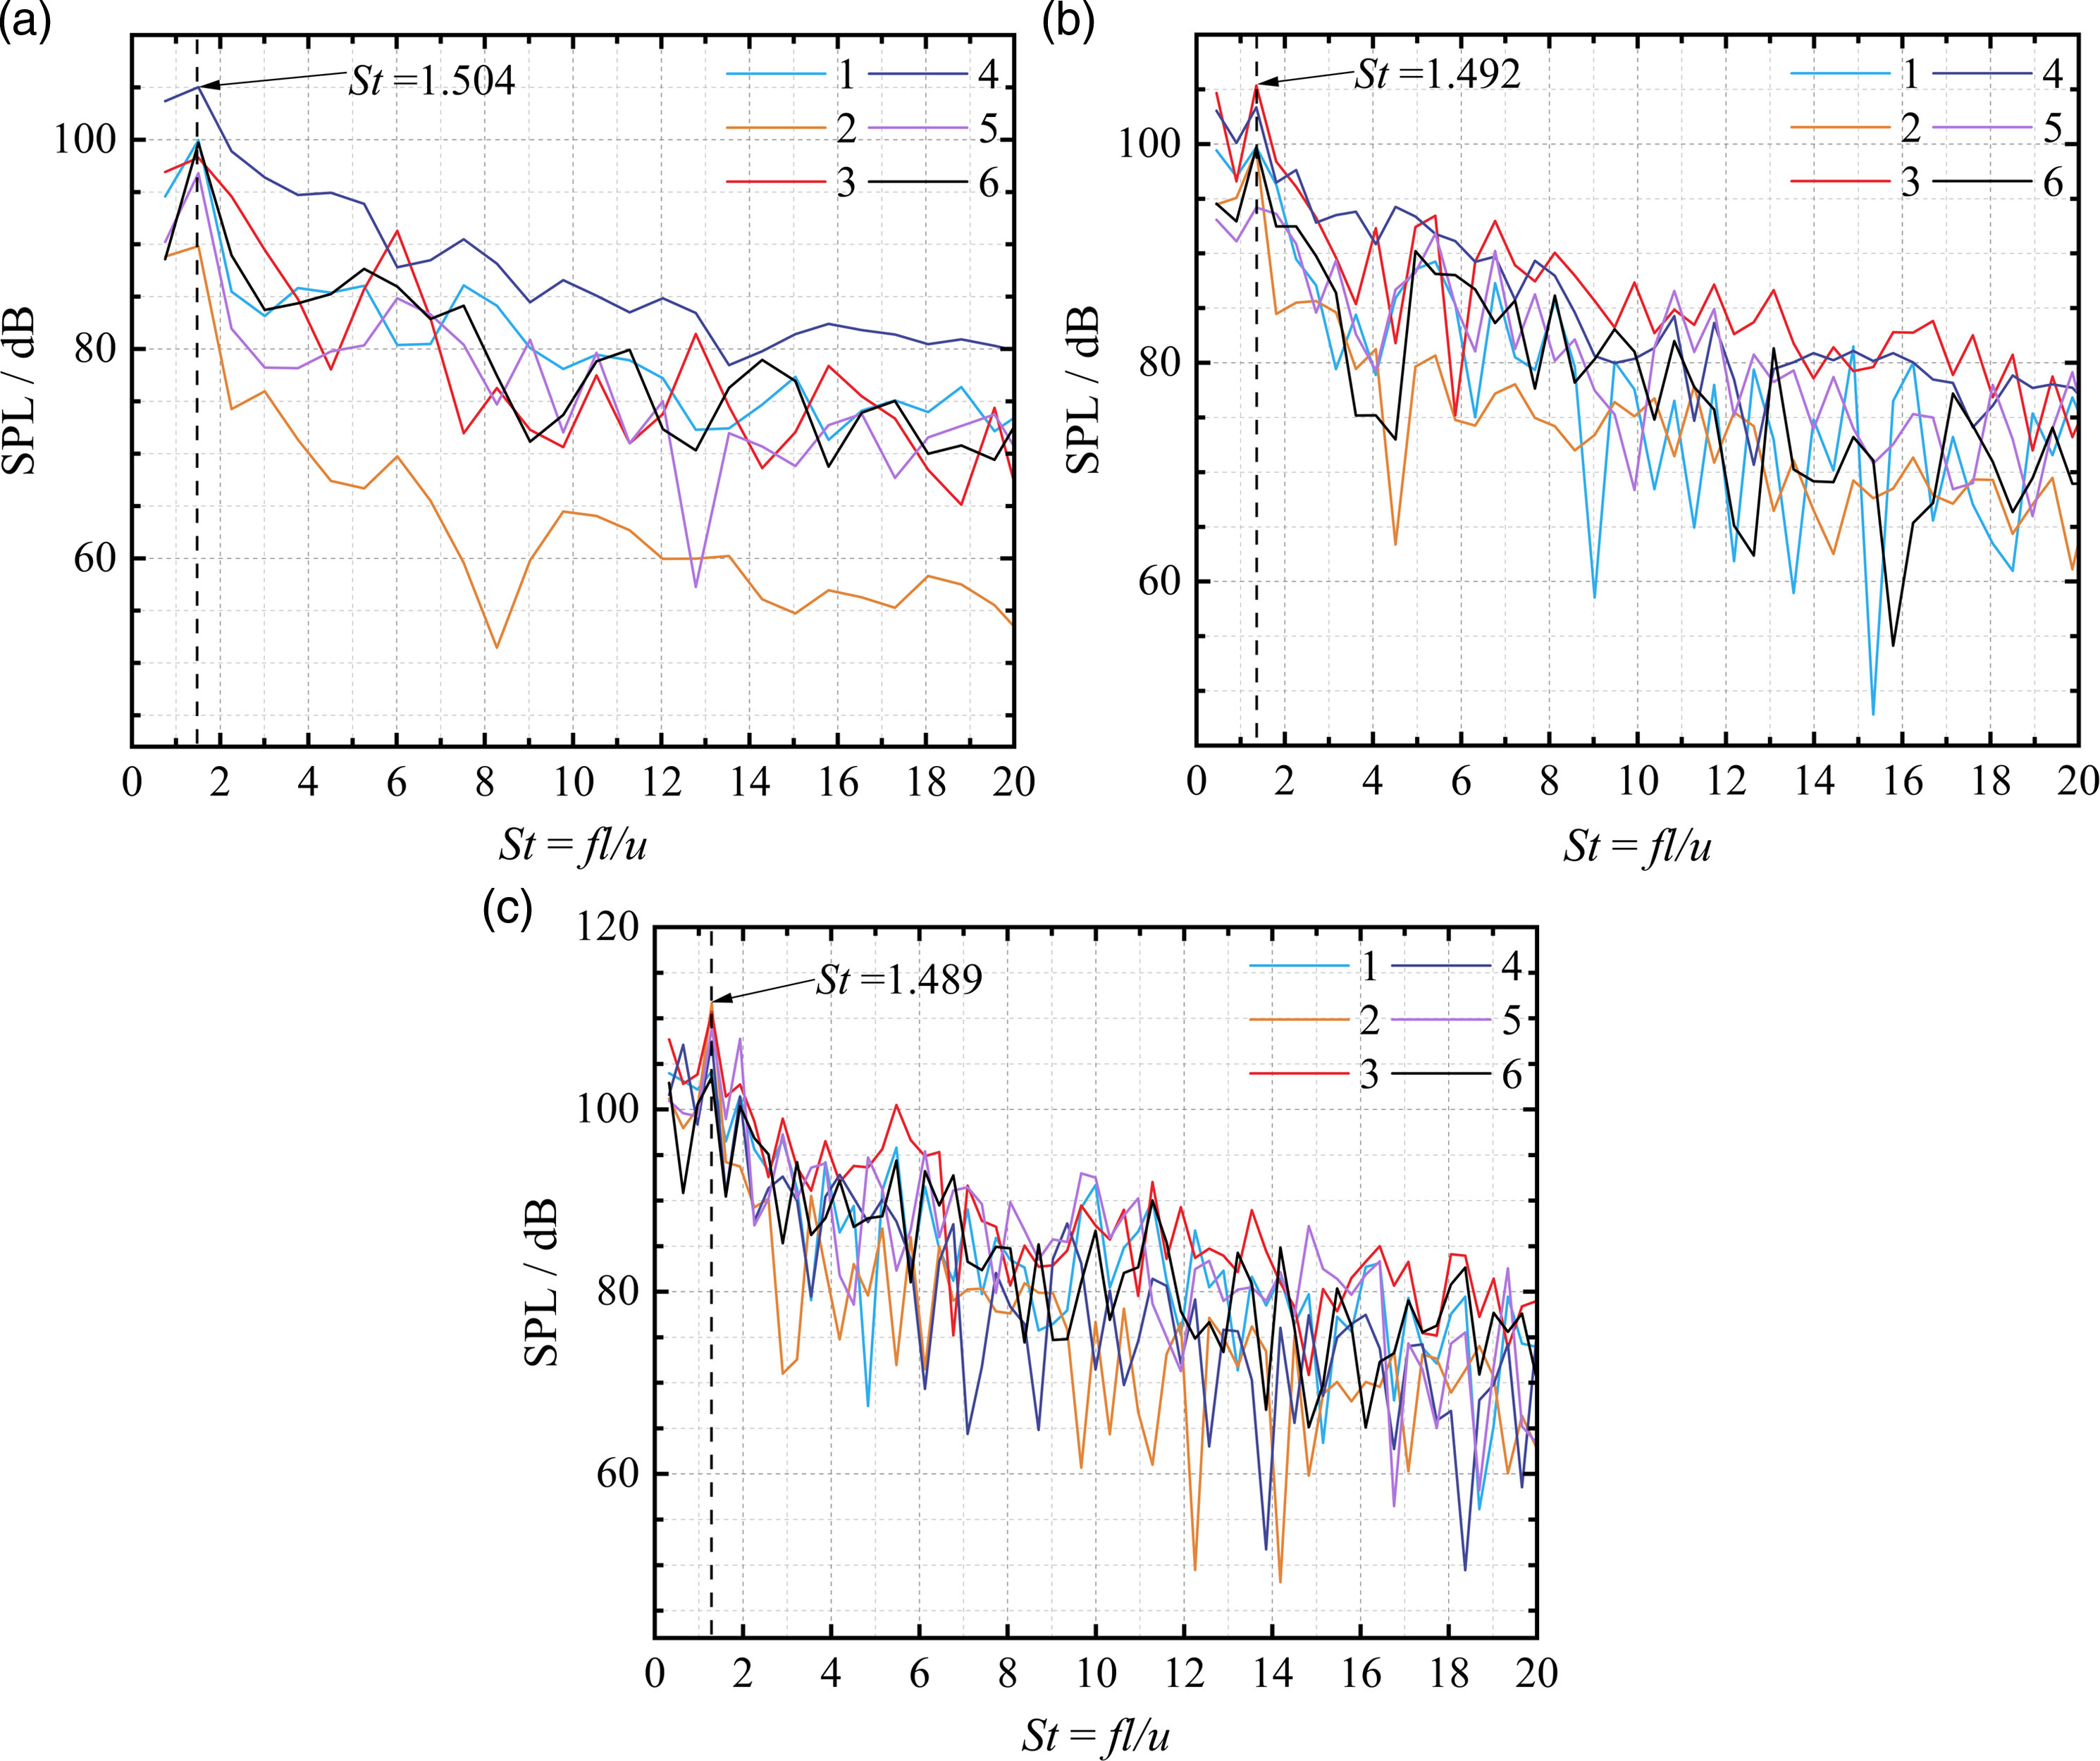
Conclusion
In this paper, we used LES and Lighthill-Curle aerodynamic acoustic equations to study the vortex structure and aeroacoustic behavior in the ring-gap flow field of the ultra-high-speed elevator and draw the following conclusions: (1) The spatial distribution of the vortex structures is divided into two layers: the top area of the elevator car and the wake area. Small scales and large vorticity characterize the worm vortex structures shedding from the elevator car walls. As one moves downstream, these vortex structures gradually develop into hairpin shapes of varying scales. The vortex structures show a certain periodicity over time, and these periodic vortices can induce low-frequency noise in the hoistway. The shape of the vortex structures on the elevator car wall is similar at different inflow velocities, changing from the worm shape to the hairpin shape with different scales. (2) The distribution of sound source intensity of the ultra-high-speed elevator car is closely related to the position of vortex shedding and the strength of vortex structure vorticity. By adjusting the position of vortex shedding, reducing the vorticity of the vortex structure, and adding sound-absorbing materials to the wall of the elevator car, the noise intensity of the car can be effectively controlled. (3) Under different blocking ratios, the asymmetric characteristics of the flow field distribution around the car were observed using TKE, and it can also be seen that the flow field distribution in the hoistway has a certain degree of similarity. The results of POD analysis show that the first three modes occupy most of the energy in the flow field of the ultra-high-speed elevator hoistway. Still, there are significant differences in the physical quantities of the flow field. As the blocking ratio increases, the turbulence kinetic energy intensity and vortex shedding velocity in the elevator car's surface and the surrounding ring-gap flow field will increase. (4) The blocking ratio does not change the longitudinal attenuation characteristics of aerodynamic noise in the hoistway. Still, as the blocking ratio increases, the sound pressure level inside the hoistway gradually increases. When the blocking ratio increases from 0.5 to 0.65, the peak sound pressure level on the windward side of the hoistway increases by 5.01 dB, and the peak sound pressure level on the leeward side increases by 4.30 dB. When designing the car’s and hoistway’s dimensions, the blocking ratio should be controlled within 0.6. (5) The directivity of aerodynamic noise in the hoistway shows apparent asymmetry in three directions. With the increase in speed, the sound level on the leeward side increases faster than the sound pressure level on the windward side. At the same time, the directivity of aerodynamic noise in the three directions has nothing to do with speed.
This paper lays the foundation for studying the relationship between vortex structures and aerodynamic sound source intensity in the hoistway. It provides certain theoretical support for the design of structural dimensions of the ultra-high-speed elevator hoistway and the control of wall sound source intensity.
Footnotes
Acknowledgments
The author sincerely thanks the editors and reviewers for their insightful insights and comments to improve the quality of this paper further.
Declaration of conflicting interests
The authors declared no potential conflicts of interest with respect to the research, authorship, and publication of this paper.
Funding
The author(s) disclosed receipt of the following financial support for the research, authorship, and/or publication of this article: This study was supported by the Natural Science Foundation of Shandong Province (GRANT NO.ZE2021ME245), the Natural Science Foundation of Shandong Province (GRANT NO.ZR2021ME210), and the Major Scientific and Technological Innovation Project of Dezhou “Key Technology and Application of the Ultra-high-speed Elevator Intelligent Lifting System.”
