
Abstract
Turbulent pressure fluctuations can compromise the accuracy of far-field acoustic measurements when microphone arrays are flush-mounted on surfaces exposed to fluid flow. To address this, recent advances in acoustic metamaterials have introduced novel approaches to enhance the signal-to-noise ratio of these measurements. In this paper, new techniques for coupling the sound and flow field to a meander metasurface are discovered through computational acoustics modeling and examined through wind tunnel testing in Virginia Tech’s Subsonic Modular Anechoic Research Tunnel (SMART). The results provide insight into the optimal shape for allowing sound waves into a metamaterial while attenuating turbulent boundary layer noise.
Introduction
Locating sound sources using an array of microphones was first introduced by Billingsley and Kins. 1 Their “acoustic telescope” unlocked the possibility of locating the sound sources of a full-sized jet engine. Shortly after, this technique was significantly improved upon, using the polar correlation technique to detect and measure the axially distributed sound sources of a jet engine.2–4 Glegg’s early contributions have had a foundational impact on phased microphone array technologies by establishing methods for determining the source location using the correlated response and its periodicity across distributed sensor positions. Around the same time, other measurement techniques were being developed for cases where the sound source of interest is immersed in wind. 5 The ability to locate sound within turbulent environments has since become increasingly important for various applications. In experimental aeroacoustics, microphone arrays are often flush-mounted in a closed jet wind tunnel to sense noise within a test section.6,7 Microphones can also be positioned on the surface of autonomous vehicles, which often rely heavily on external sensors, to detect and locate acoustic sources. In both cases, these microphones are subjected to the local, evanescent pressure fluctuations within the turbulent boundary layer (TBL). As a result, the signal can be drowned out by TBL noise, rendering the sensors useless.
Post-processing techniques have been developed to recover a signal that is shrouded by TBL noise. Some of these techniques, termed “signal extraction methods” (SEMs), like coherence-based and cross-spectrum-based methods, were found to recover signals 9 dB quieter than the surrounding TBL noise. 8 However, these methods rely on the signal of interest existing at a specific frequency. In the case where the signal is broadband, extraction becomes more difficult.
Kirby 9 demonstrated that changing the face area of a flush-mounted pressure transducer has a pronounced effect on the measurement of wall pressure fluctuations. Increasing the sensor’s face area, with the dimension perpendicular to the flow being most important, showed a significant reduction in the TBL noise measured. Recessing microphones behind a sound-transparent material in flow, a concept first introduced by Jaeger et al., 10 removes the microphones from the TBL’s pressure fluctuations while still allowing acoustic signals to pass through the material bounding the flow. These strategies improve the ability of arrays to detect sources through turbulence. More recent attempts to attenuate TBL noise involve coupling microphones to cavities that are covered with a sound-transparent material. This method separates the microphone membrane from TBL pressure fluctuations, as done by Jaeger et al., 10 and extends its face area to filter out turbulence scales smaller than the cavity area. Damani et al. 11 used this technique for filtering out convective pressure fluctuations in a TBL by employing a rectangular-shaped Kevlar-covered cavity. These sensors were then used to develop an array capable of measuring the low-wavenumber pressure fluctuations of a TBL. 12 VanDercreek et al. 13 studied the improvement of acoustic beamforming arrays using microphone cavities covered with a stainless-steel mesh. The results showed a significant reduction in the TBL noise measured and increased signal-to-noise ratios (SNR) experienced by the arrays.
Although these prior techniques for reducing the measured TBL noise are quite effective, there are many cases where the signal of interest is much quieter than the TBL pressure fluctuations. This makes it very difficult for any array to detect the acoustic source. To combat this, new efforts involving the use of acoustic metasurfaces have been developed.14–16 An acoustic metasurface is an acoustic metamaterial with sub-wavelength geometry that can control sound.
17
Acoustic waves near its interface can be uniquely manipulated for sensing strategies. Beadle et al.
18
characterized the propagation of acoustic waves within a metasurface composed of a snake-shaped meander channel, as depicted in Figure 1(a). Meander metasurface. (a) Meander metasurface’s snake shaped meander channel. (b) Directionally sensitive meander metasurface array.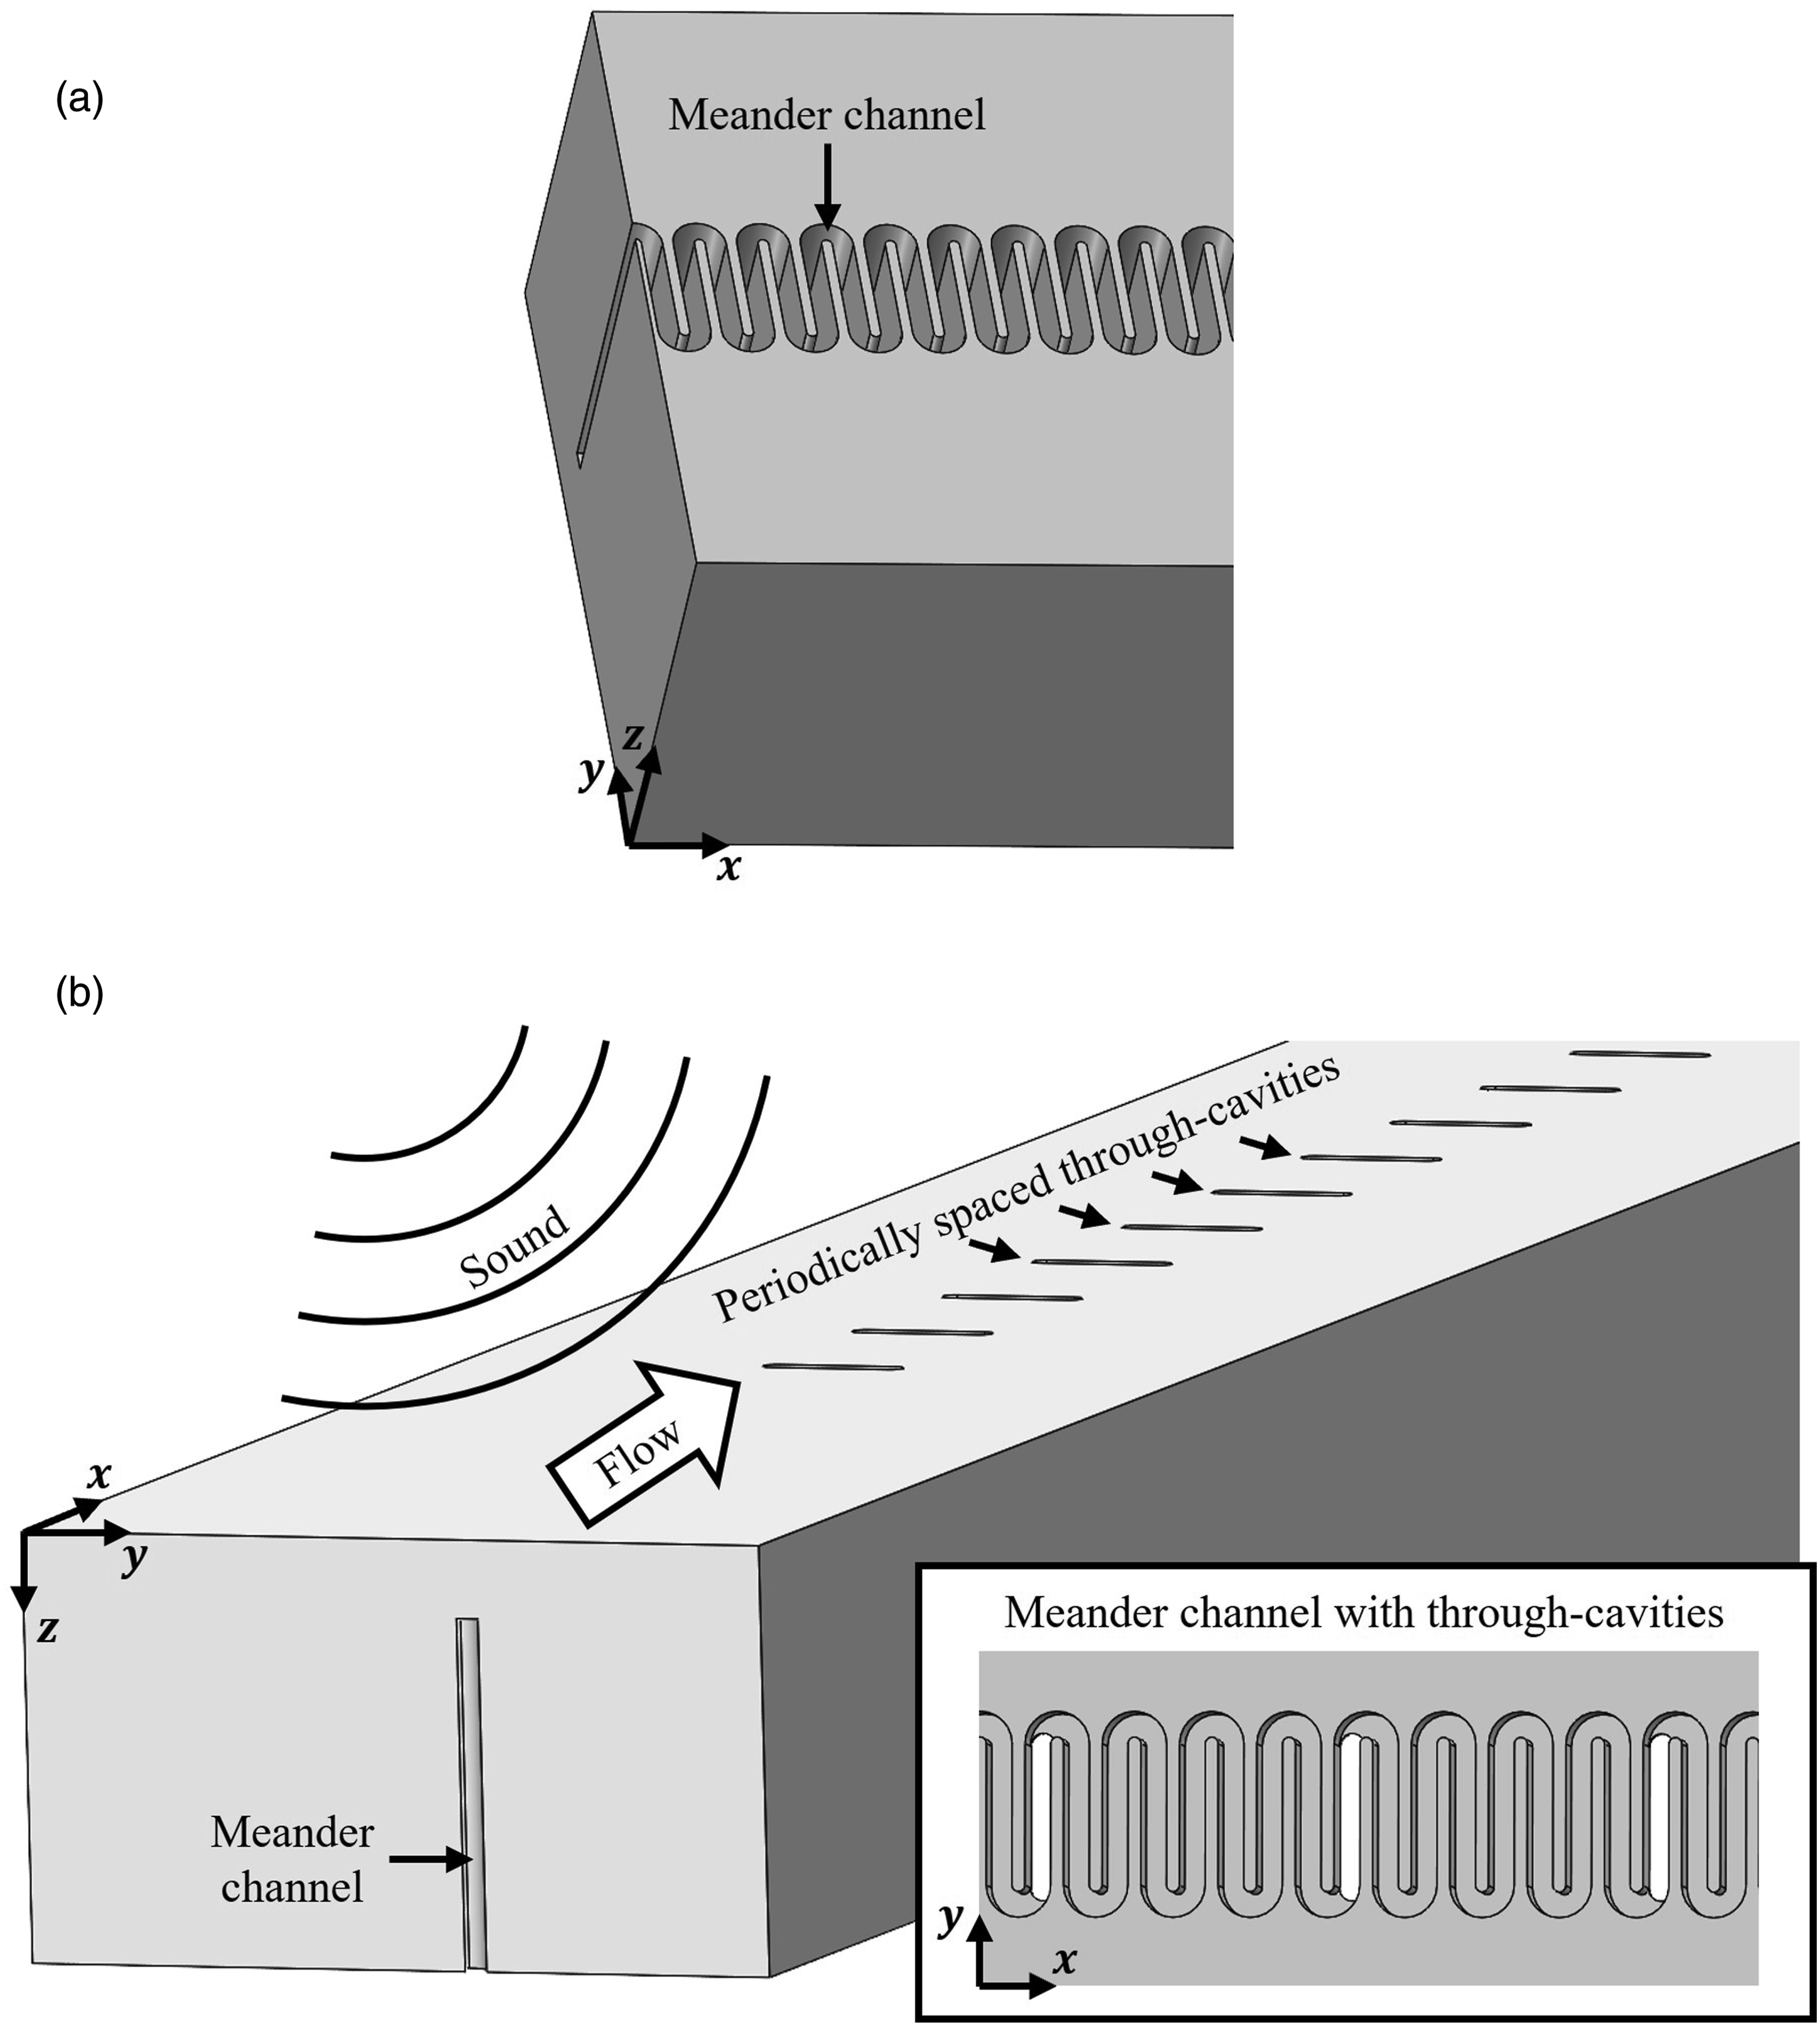
The meander metasurface array shown in Figure 1(b) takes advantage of directional reinforcement of ASWs
19
within a meander channel. This concept, demonstrated by Braaten et al.
15
and depicted in Figure 2, relies on phase matching between the sound waves above a metasurface and the ASWs in the meander channel, at the through-cavity locations. Diagram showing an array of periodically spaced through-cavities above a meander surface.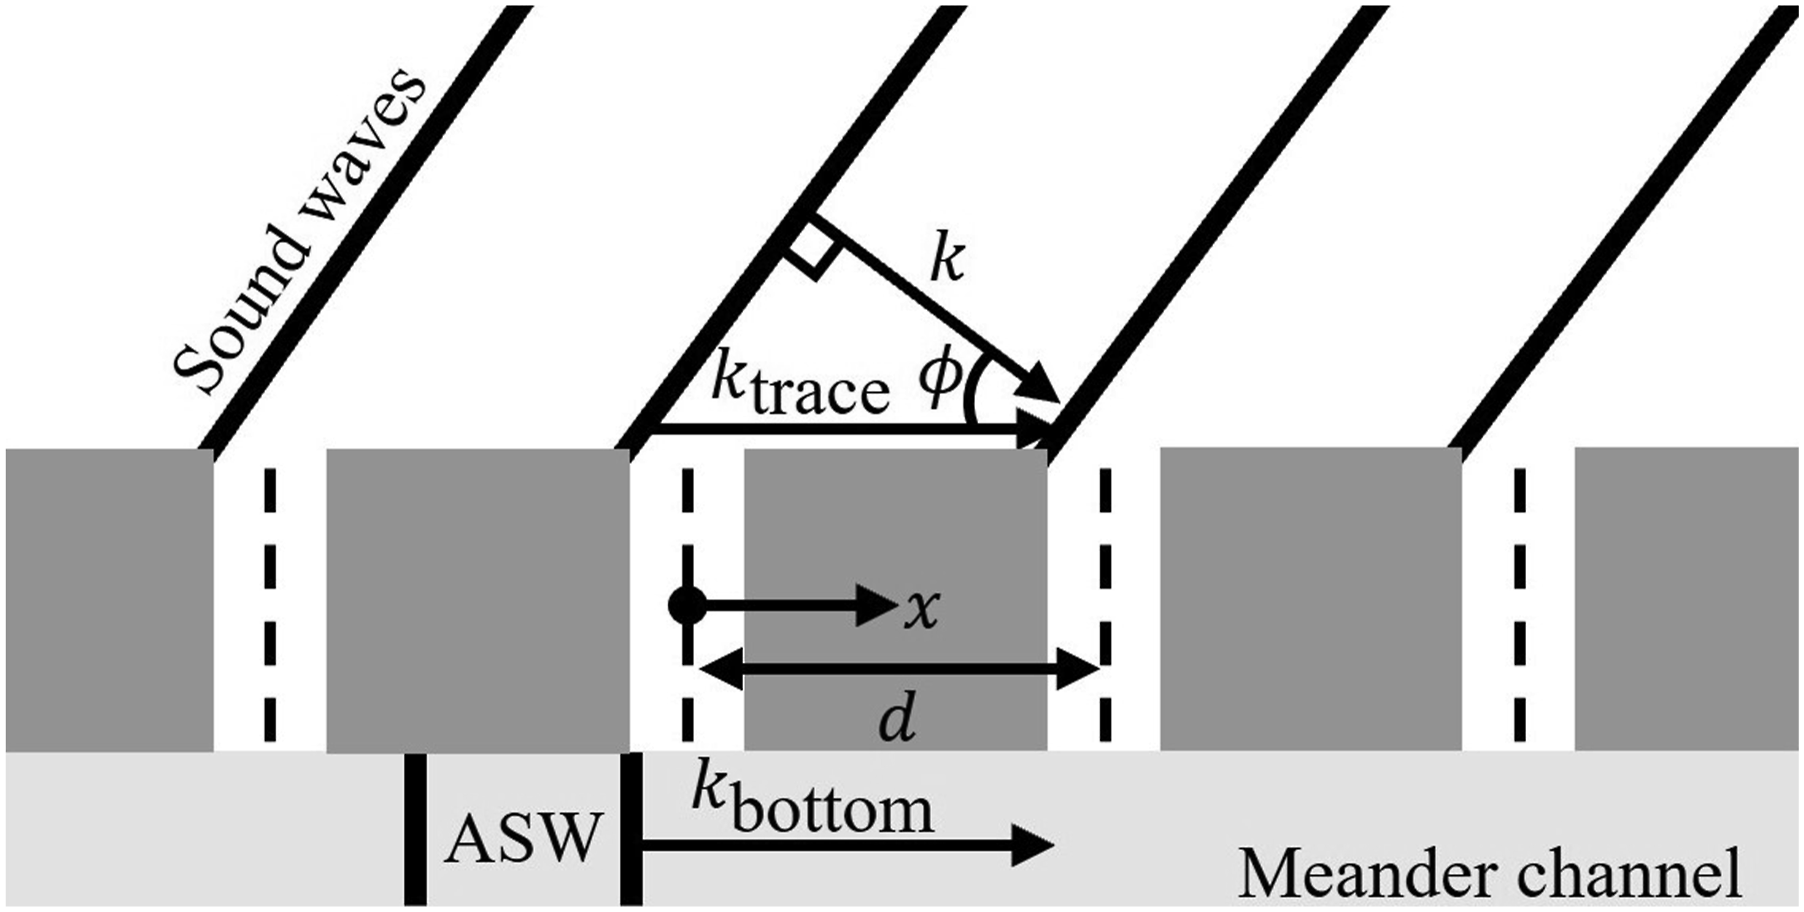


Equation (2) demonstrates that there is a dependence between the wavenumbers of ASWs within an acoustic metasurface and the direction of arrival of sound waves above the periodically spaced through-cavities. This unveiled the possibility of using an acoustic metasurface to locate sound sources. It is important to note that for this relationship to be noticed physically, the sound waves arriving at the periodically spaced through-cavities must be broadband. This allows for the directional reinforcement of ASWs, defined by equation (2), to exist at ASW modes of the metasurface, which will be further explained in the next section.
The meander metasurface presents a unique approach to locating sound through a TBL. To detect ASW reinforcement, only the waves within the meander channel must be sensed. Since the meander channel is not directly exposed to the flow, sensors can avoid exposure to turbulent pressure fluctuations. In addition, the turbulent pressure fluctuations at each through-cavity location are incoherent compared to the far-field acoustic signal of interest. Galluscio et al. 16 showed a 25 dB reduction in the TBL noise measured by the meander metasurface array compared to a flush-mounted pinhole microphone at the frequency of ASW reinforcement for a sound source positioned normal to the array in 33 m/s flow, while the reduction in the acoustic signal of interest was only 2 dB. Another array tested contained microphones coupled to rectangular-shaped Kevlar-covered cavities. These sensors, termed “subresonant sensors”, only demonstrated a 12 dB decrease in the TBL noise measured for the same array orientation as the metasurface. This result is especially impressive for the meander metasurface array, because the meander metasurface’s through-cavities were smaller in area on the flow surface (2 mm by 13 mm) than the subresonant sensor’s cavities (3 mm by 17 mm).
The meander metasurface array studied by Braaten et al. 15 and Galluscio et al. 16 showed promise in its ability to attenuate TBL noise while locating broadband sound sources, but some areas for improvement were recognized. It was previously determined that issues with the array’s ability to locate sound sources stemmed from the metasurface’s through-cavities. 16 The through-cavities created a local impedance mismatch that disrupted propagation of ASWs with the meander channel. Additionally, the results pointed toward the possibility of decreasing the length of the metasurface’s sensing aperture by up to 93% without significant loss of performance.
The purpose of the current work is to examine the issues with prior methods of coupling an acoustic metasurface to a sound and flow field and improve these coupling methods. This is accomplished by first using finite element method (FEM) acoustics modeling to determine the optimally shaped cavity for allowing sound into a meander metasurface. Then, wind tunnel experimentation is performed using a metasurface array with newly designed coupling methods based on the FEM results. The coupling designs were created to mimic the TBL noise filtering effects demonstrated by Damani et al. 11 and VanDercreek et al. 13 This resulted in an improvement in the meander metasurface’s ability to attenuate TBL noise while transmitting the far-field acoustic signal of interest.
The contents of this paper are structured as follows: The “Numerical simulations” section describes the computational acoustics modeling used to aid in designing the new meander metasurface array coupling methods. The “Experimental methods” section explains the coupling designs and the setup for testing these couplings. The “Results and discussion” section presents and discusses the results from the experiments, and the “Conclusions” section concludes the findings from this work.
Numerical simulations
Previous studies of the meander metasurface array pointed toward shortcomings in its ability to locate acoustic sources. 16 These shortcomings stemmed from inadequate coupling between the sound/flow field and the meander channel. Simulations were performed using COMSOL’s Acoustics Module to better understand the propagation of ASWs in the meander channel and to further optimize the array.
Unit cell analysis
The meander channel in Figure 1(a) can be broken down into a repeating unit cell. A simplified version of this symmetric meander channel unit cell, seen in Figure 3, was modeled in 3D. Simplified meander unit cell modeled in COMSOL. Eigenmodes of the meander channel.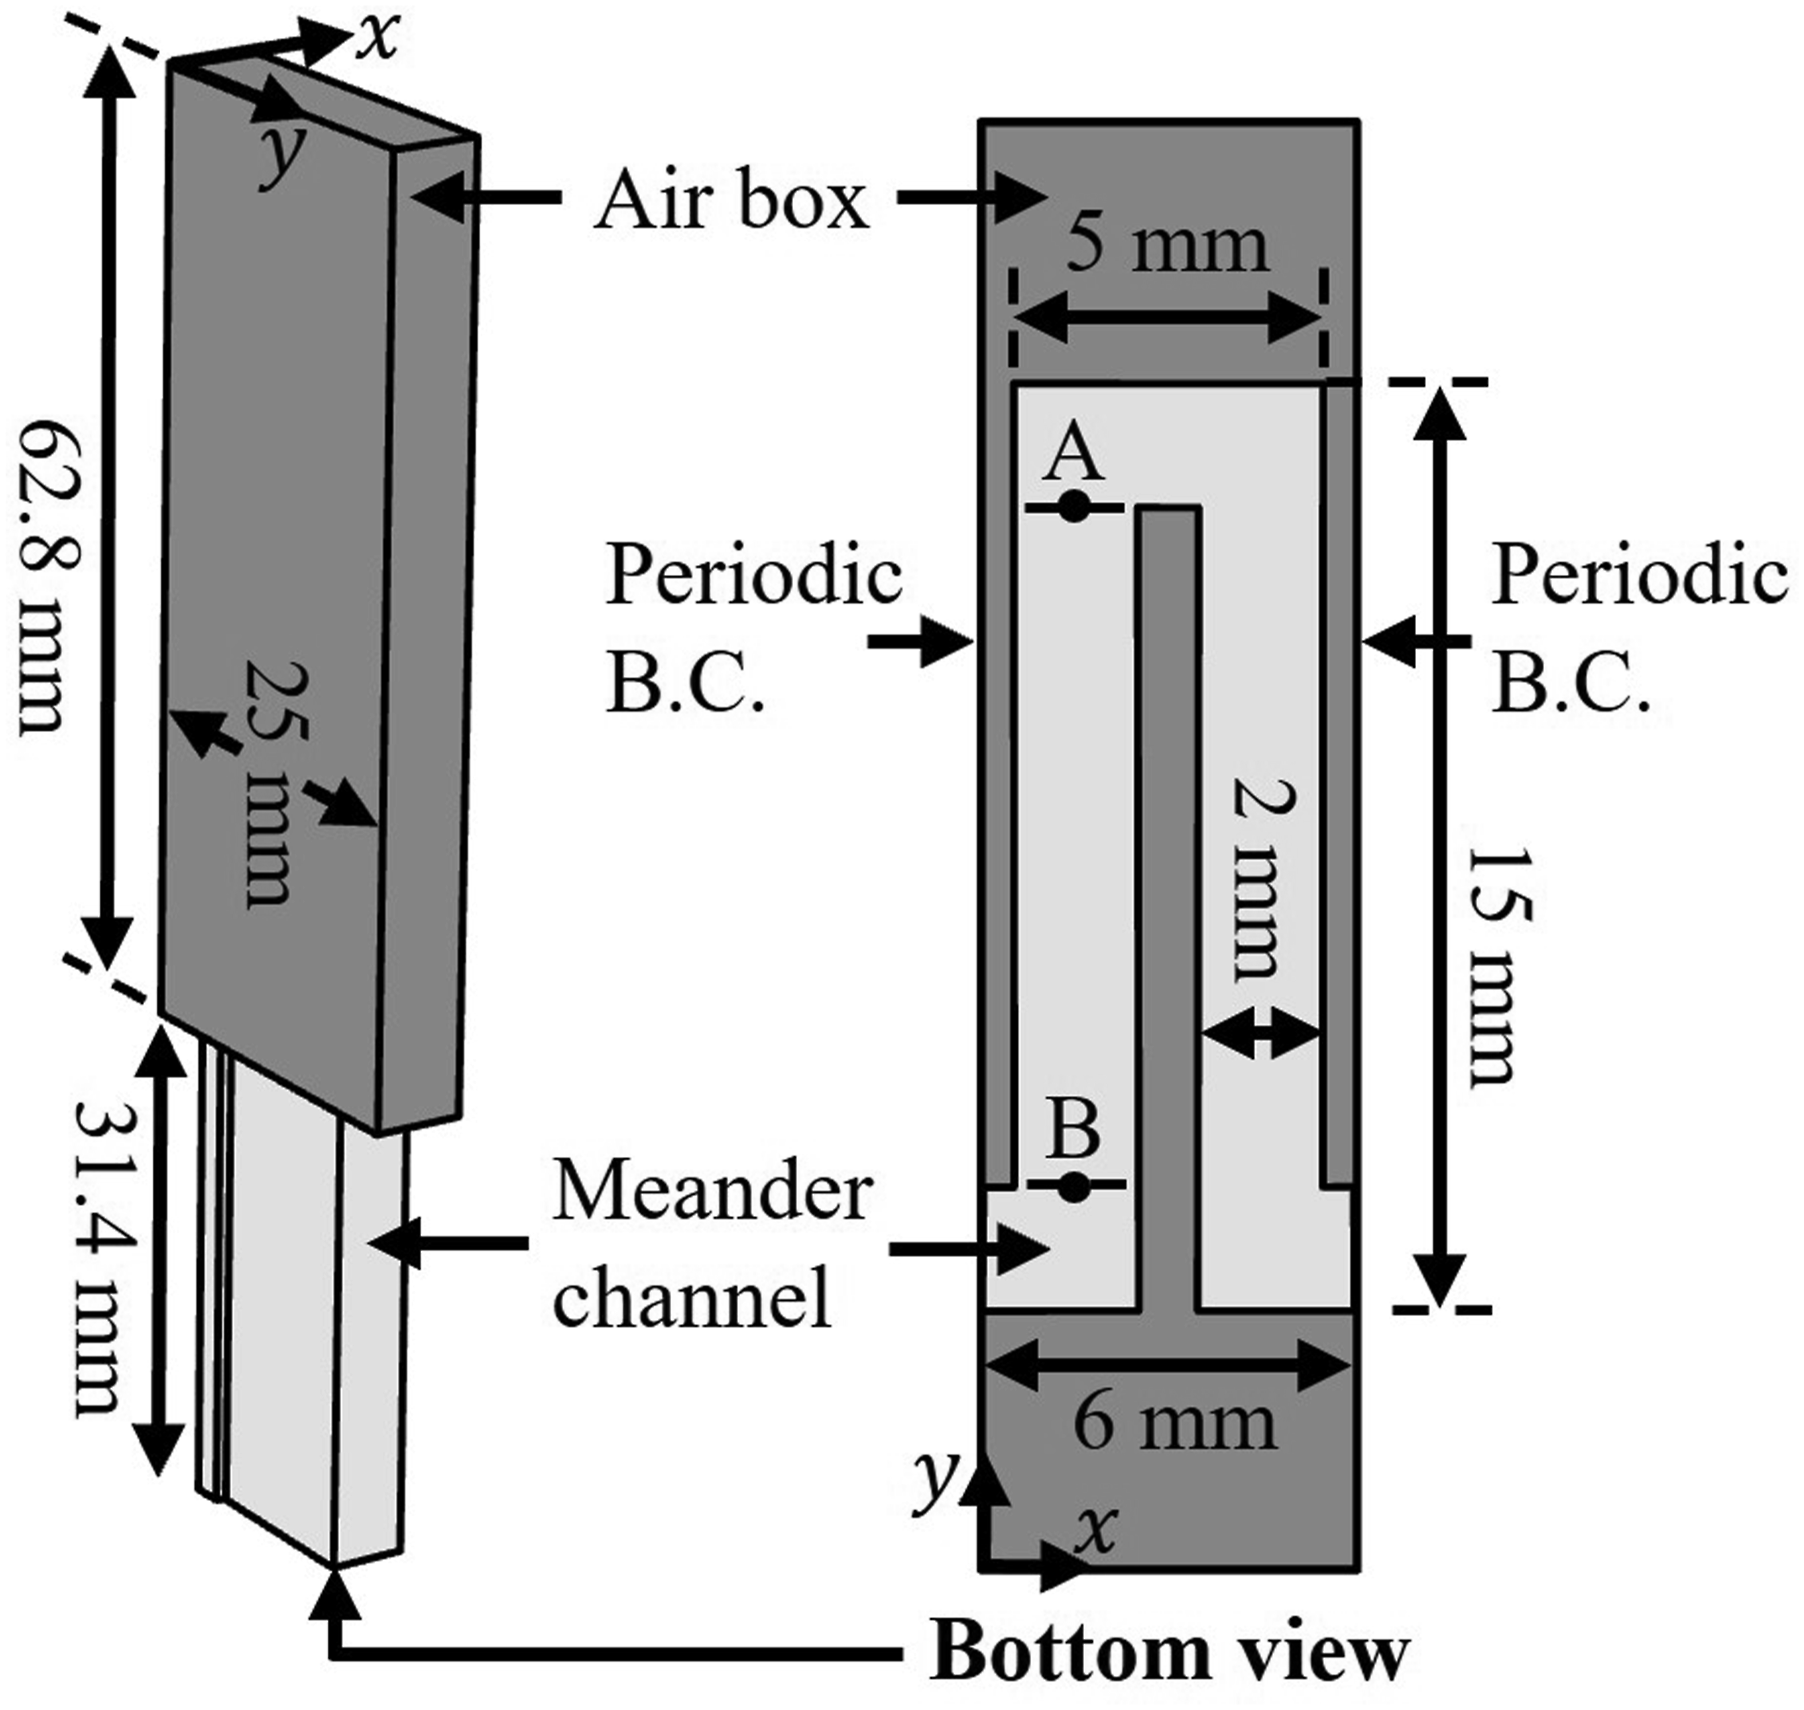
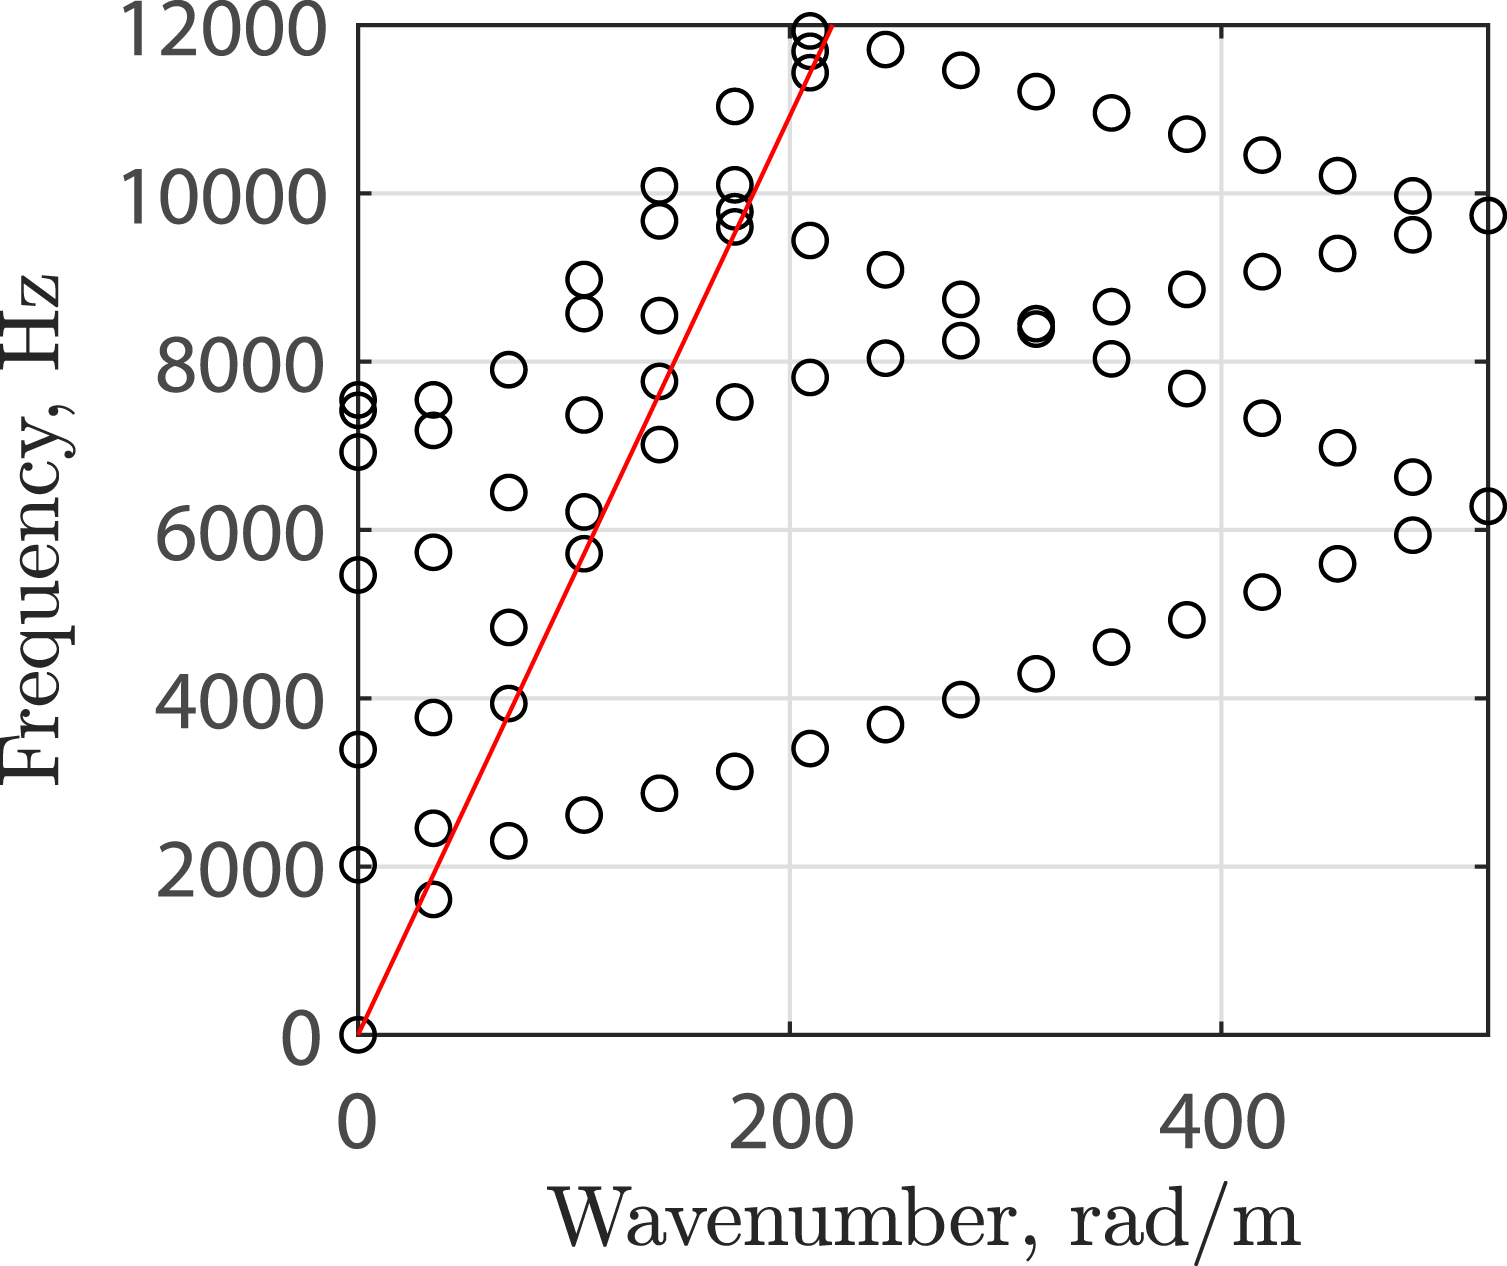
The plot in Figure 4 shows the eigenfrequencies that correspond to waves propagating with various wavenumbers in the meander channel. The red, solid line is the sound line, defined by
Two points were selected along the straight section of the meander unit cell, denoted A and B in Figure 3, and the phase difference corresponding to each eigenfrequency was plotted in Figure 5. Phase difference from point A to point B in the meander channel.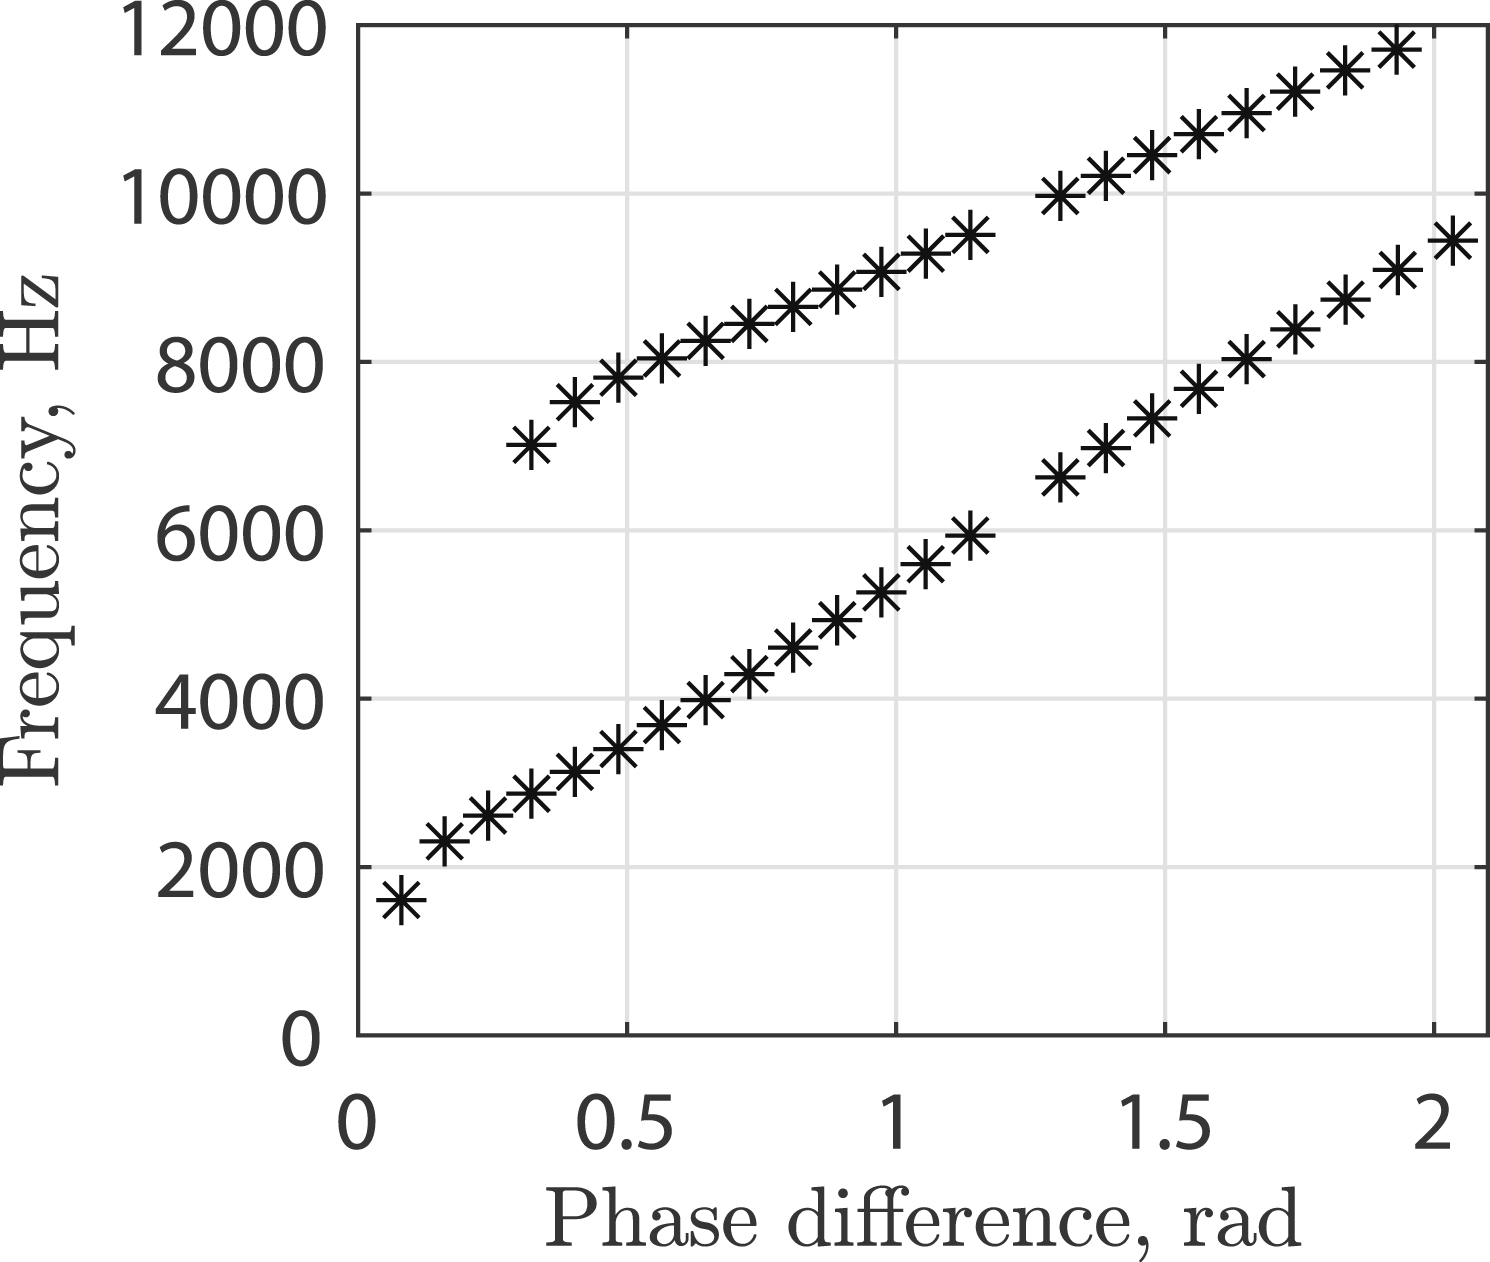
Meander channel analysis
The meander unit cell was repeated 30 times in the x-direction to create a finite meander channel for frequency domain acoustic simulations, as seen in Figure 6. Finite meander metasurface array model.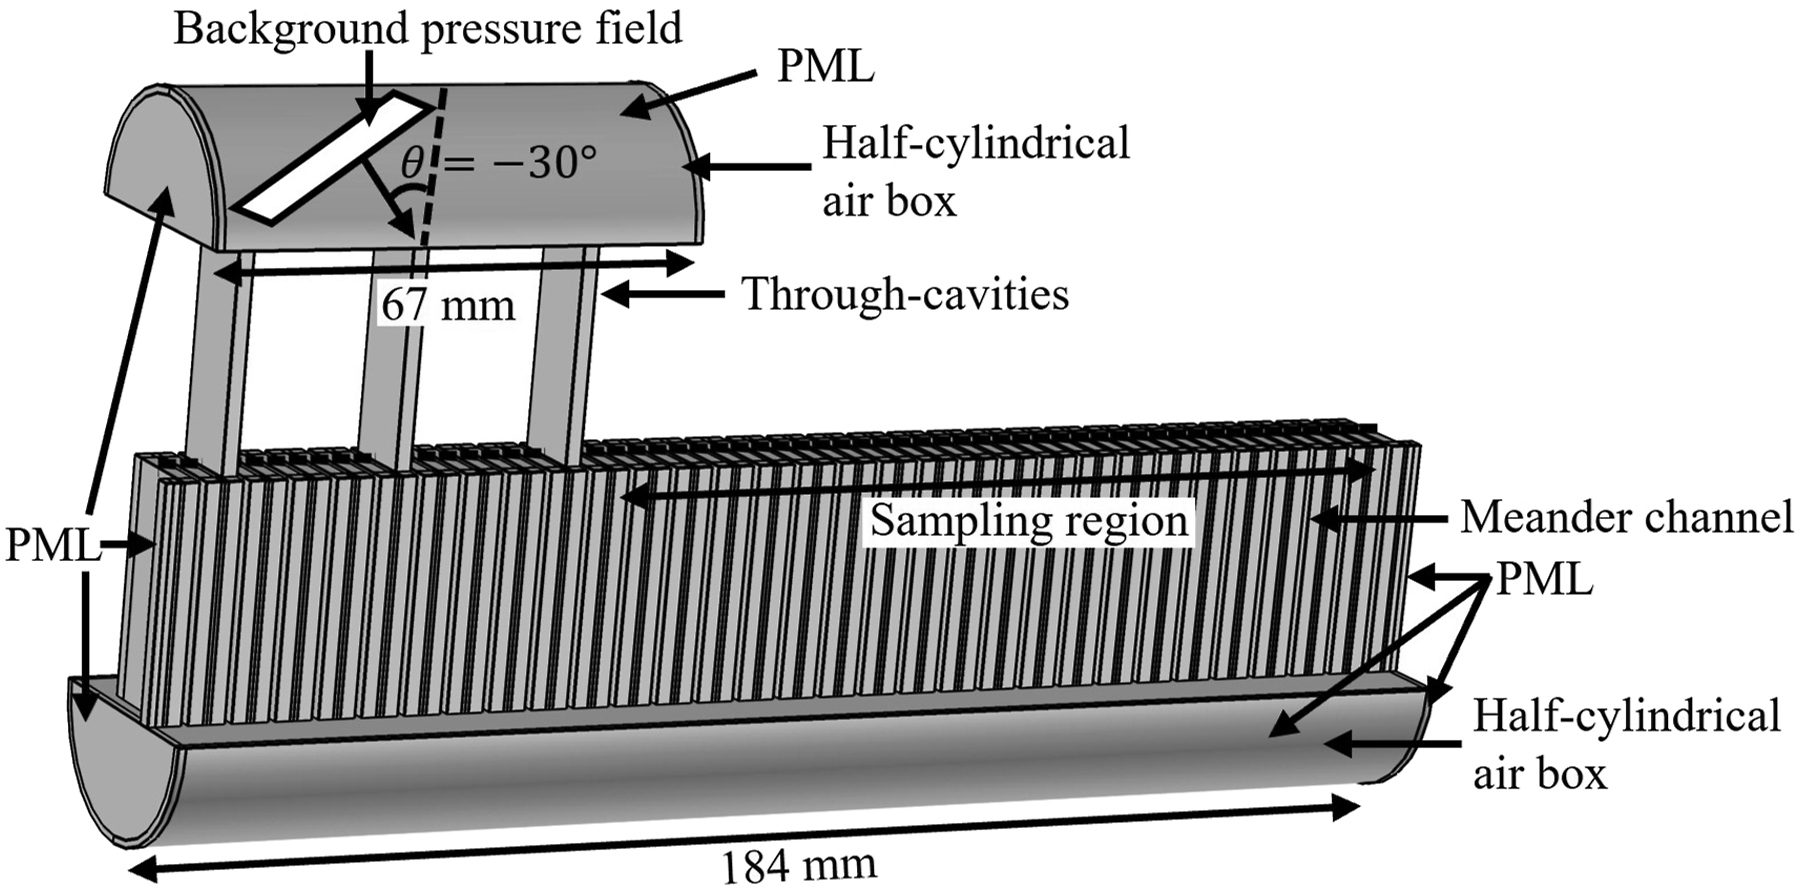
To mimic the meander metasurface array’s directional sensitivity from Braaten et al.
15
and Galluscio et al.,
16
three through-cavities were positioned in the depth of the meander channel to couple the metasurface to another half-cylindrical airbox, as seen in Figure 6. The through-cavity spacing (a) Slot-shaped and (b) hole-shaped through-cavity geometries.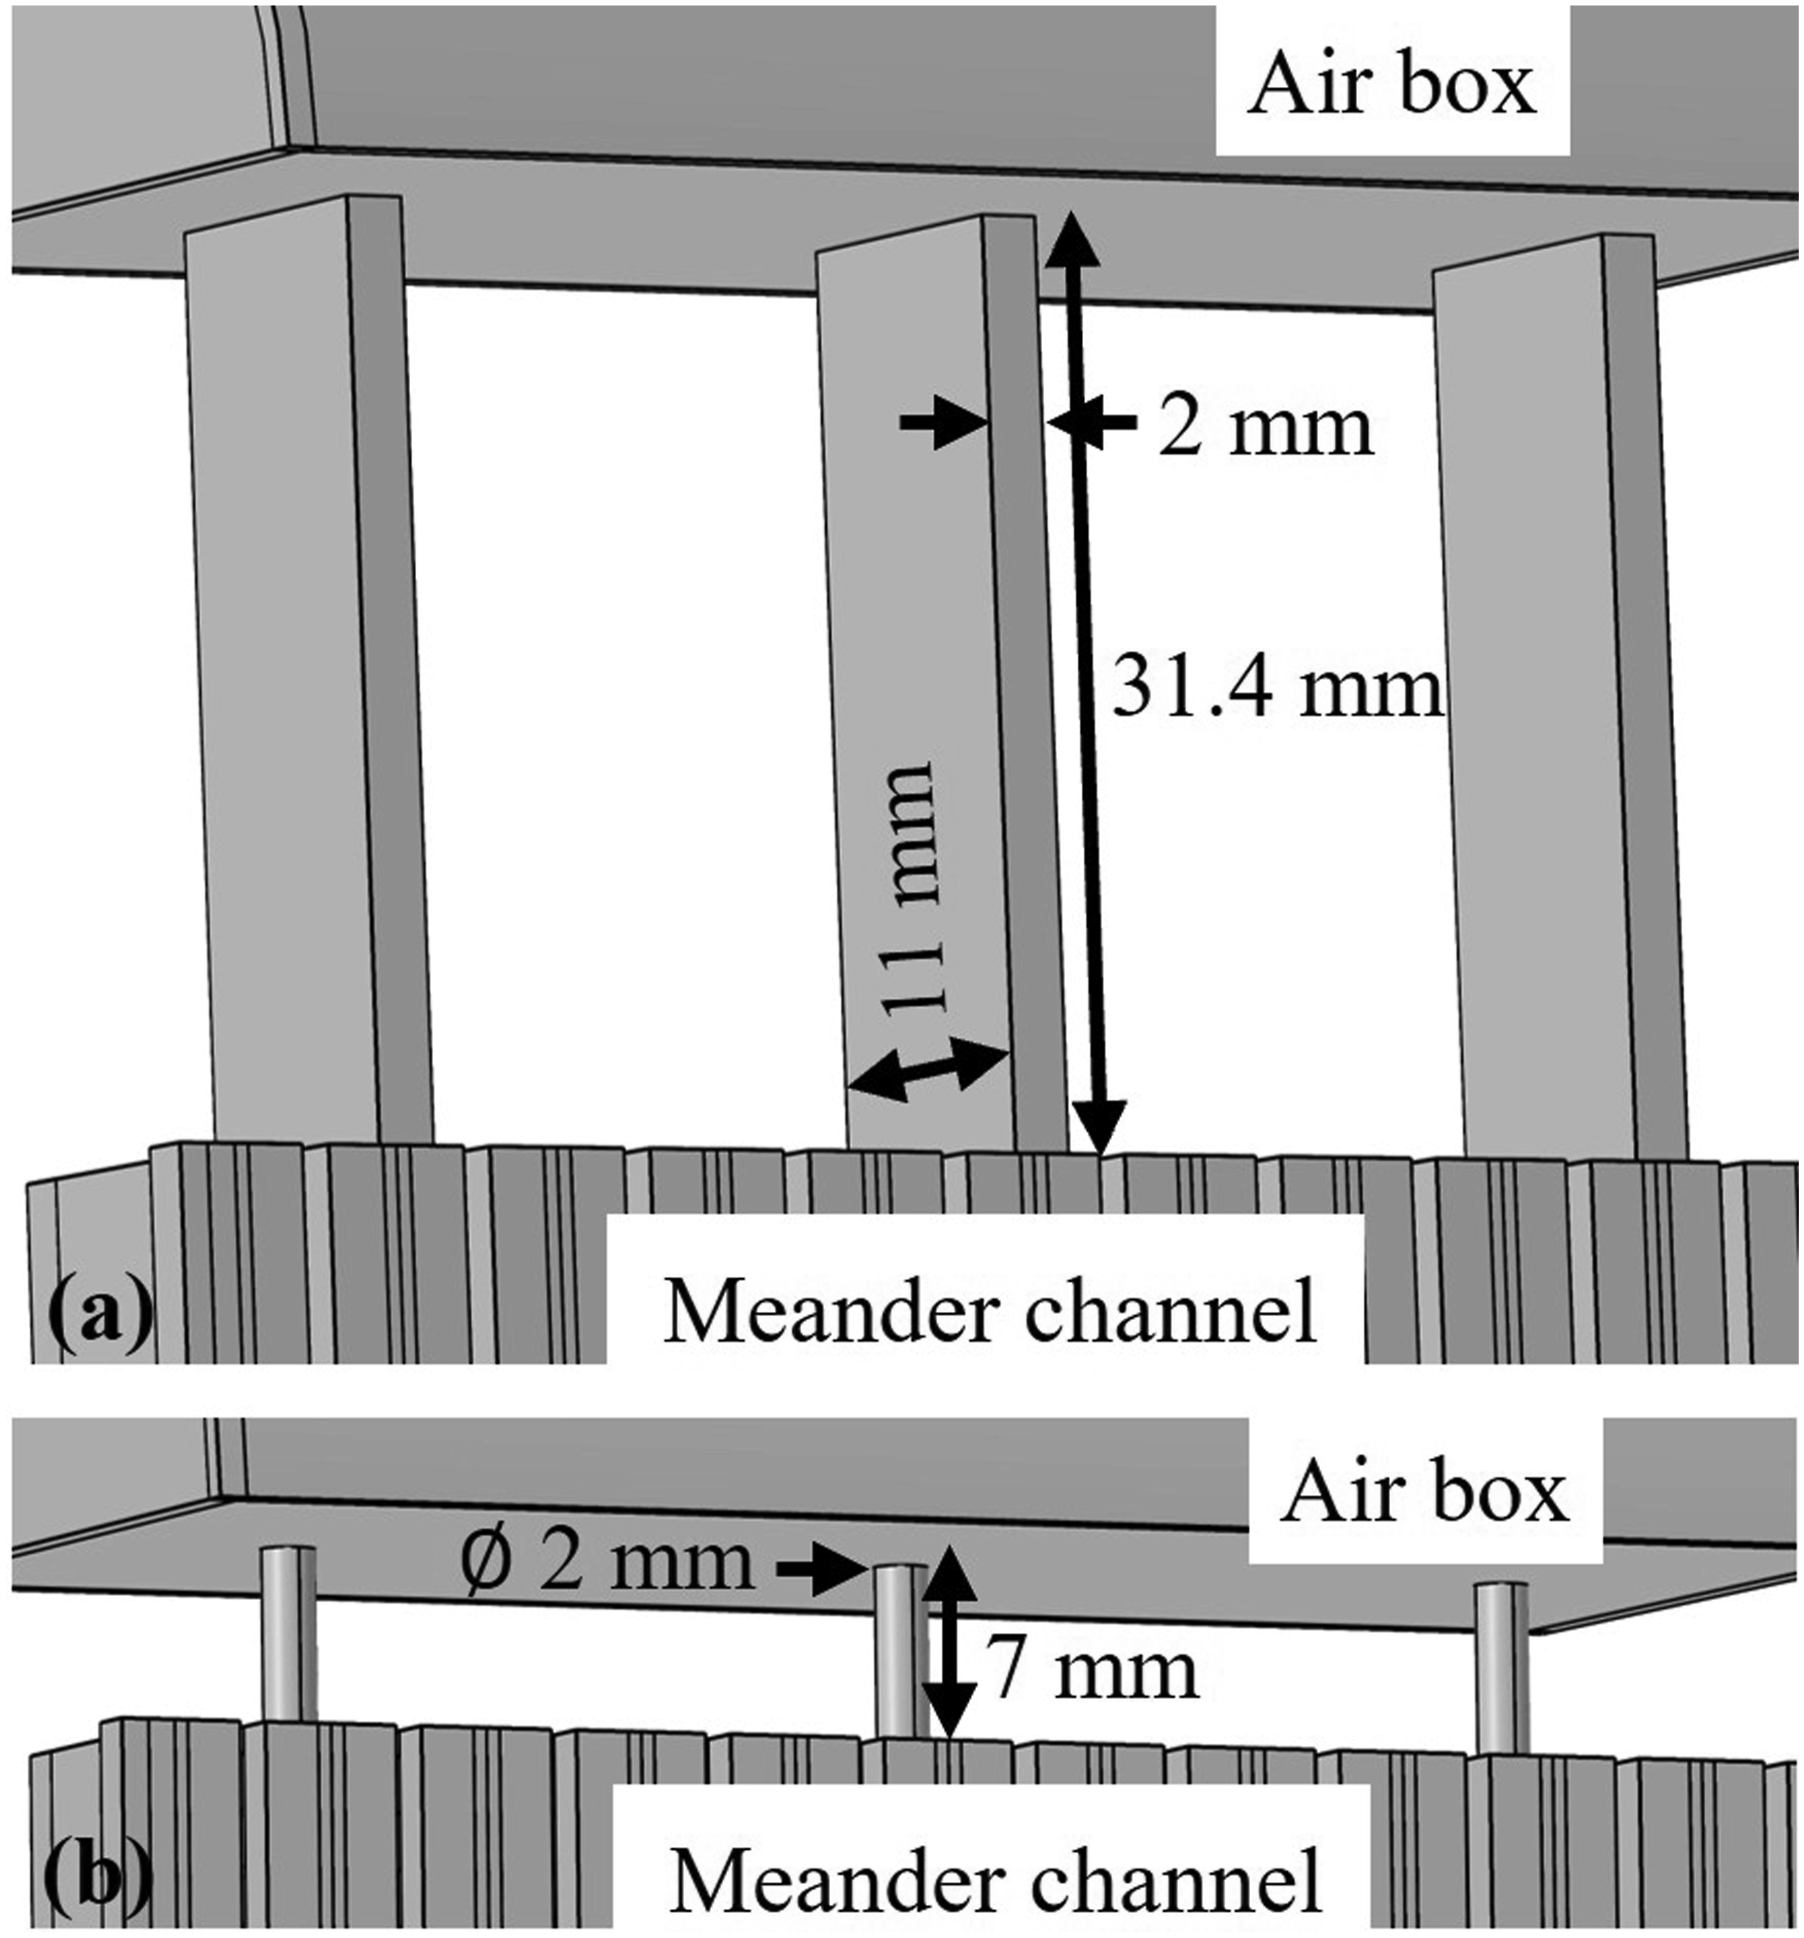
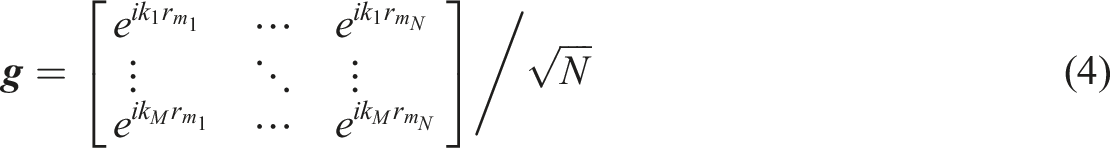
Both through-cavity geometries were simulated as air with sound-hard boundaries, such that the air-filled meander channel was connected to the air box. The same free tetrahedral meshing was performed on the array models in COMSOL, with a maximum element size of 1.5 mm in the meander channel and through-cavities, and 3 mm in the airboxes. Structured meshing was used on the PMLs with 8 elements across the PML thickness. COMSOL Pressure Acoustics, Frequency Domain simulations were run for frequencies ranging from 1,400 Hz to 12,000 Hz, in 200 Hz increments. The resulting complex acoustic pressure spectra were taken at locations 0.1 mm offset from the depth of the meander channel, at the center of each of the meander’s 15 mm long straight sections, in the region labeled “Sampling region” in Figure 6 (41 data points). A Tukey window was applied to the data before wavenumber transforming to obtain the wavenumber-frequency spectrum.
Figure 8 shows a comparison of the wavenumber-frequency spectra computed for the slot-shaped through-cavity and the hole-shaped through-cavity for Wavenumber-Frequency spectra for 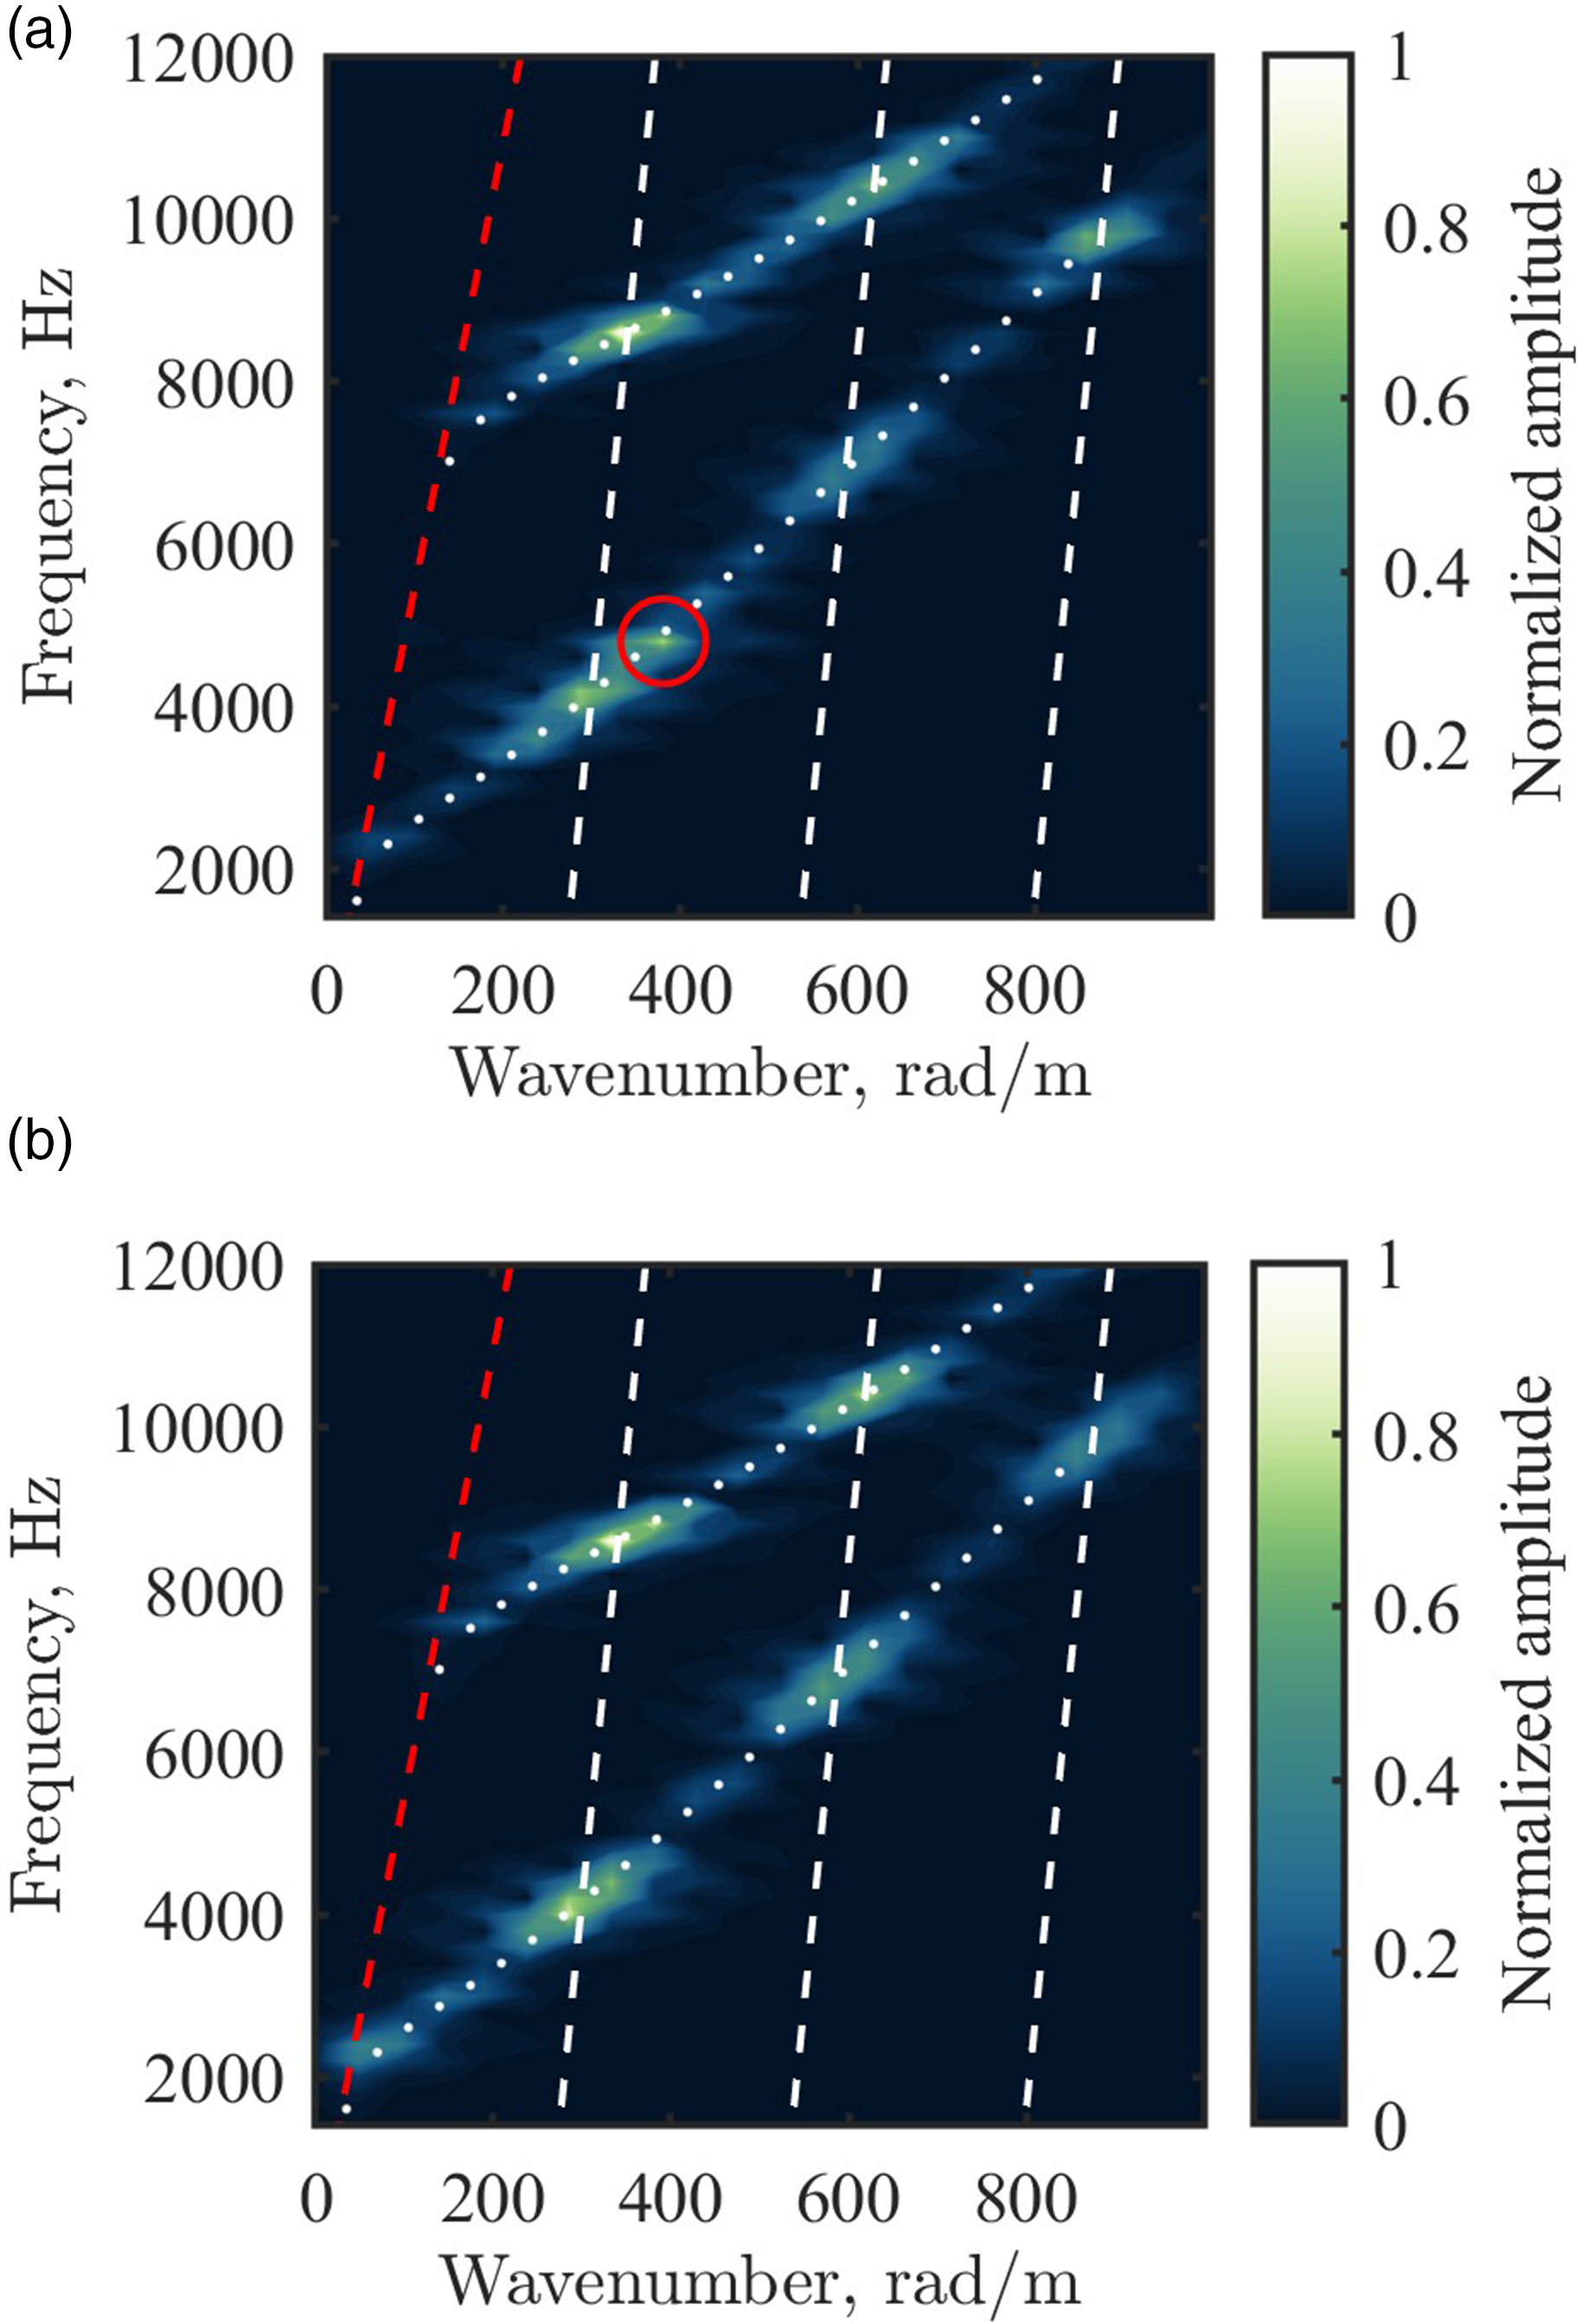
While designing the previous meander metasurface array, care was taken to avoid the through-cavity depth resonance. 15 The assumption made was that the depth resonance would occur between the opening of the through-cavity and the opening of the meander channel, a distance of 62.8 mm. In reality, the through-cavity resonance occurs between the opening of the through-cavity to free space and the opening to the meander channel, causing the resonance to exist at a higher frequency and interfere with the meander’s dispersion. The simulation results here confirm and resolve the issues present in the meander metasurface array’s prior experimental data 16 by suggesting that a smaller through-cavity, in both opening size and depth, is optimal for promoting directional sensitivity within the array.
Experimental methods
The meander metasurfaces of Braaten et al. 15 and Galluscio et al. 16 formed the design baseline for the optimized array studied here. The array was designed to sense far-field broadband source locations, with frequencies between 2 kHz and 10 kHz through TBLs with thicknesses of up to 80 mm. The method for coupling the array to the sound/flow field was modified based on the results presented in the “Numerical simulations” section. The numerical simulations showed that the optimal shape for coupling a sound field to the metasurface is a smaller tube-shaped hole. However, for the more complex task of determining how the size and shape of the hole on the flow surface affects the excitation of ASWs by TBL pressure fluctuations, wind tunnel experimentation was used. Inspiration was taken from previously studied cavity arrays12,13 to create couplings that connect larger sensing areas to the hole-shaped coupling. This array was tested in quiescent conditions and in 20 m/s flow. This section contains information about the meander metasurface with its improved coupling mechanisms, the wind tunnel facility, and the data acquisition used to evaluate the metasurface coupling mechanisms.
Meander metasurface with interchangeable coupling mechanisms
A meander metasurface array was designed with the ability to interchange the coupling mechanisms, as seen in Figure 9. The meander metasurface array designed for testing improved coupling mechanisms. Meander metasurface’s meander channel. (a) Meander channel with fiber fill stuffing at the end. (b) Meander unit cell geometry, h = 11 mm, w = 2 mm, r = 1.5 mm, and 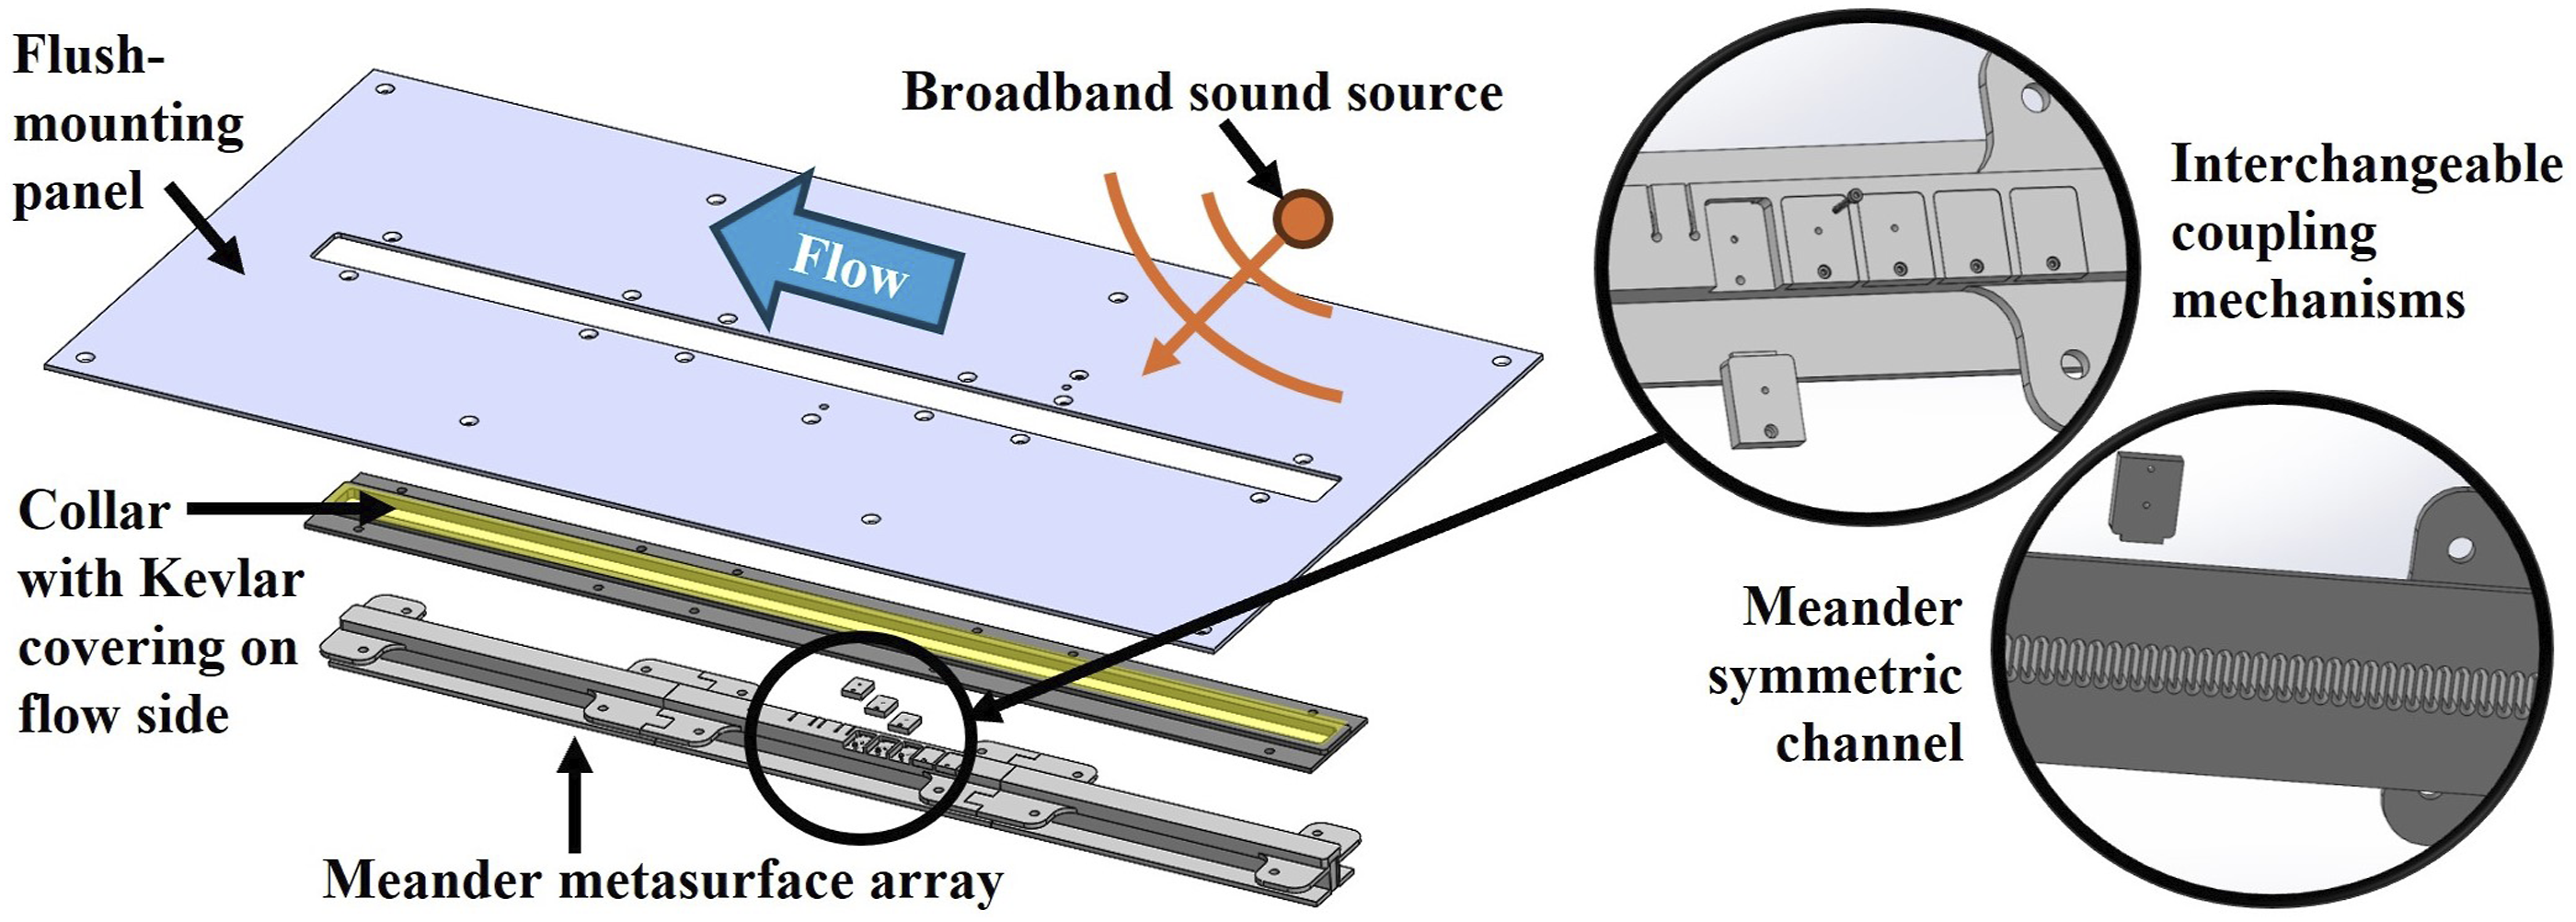
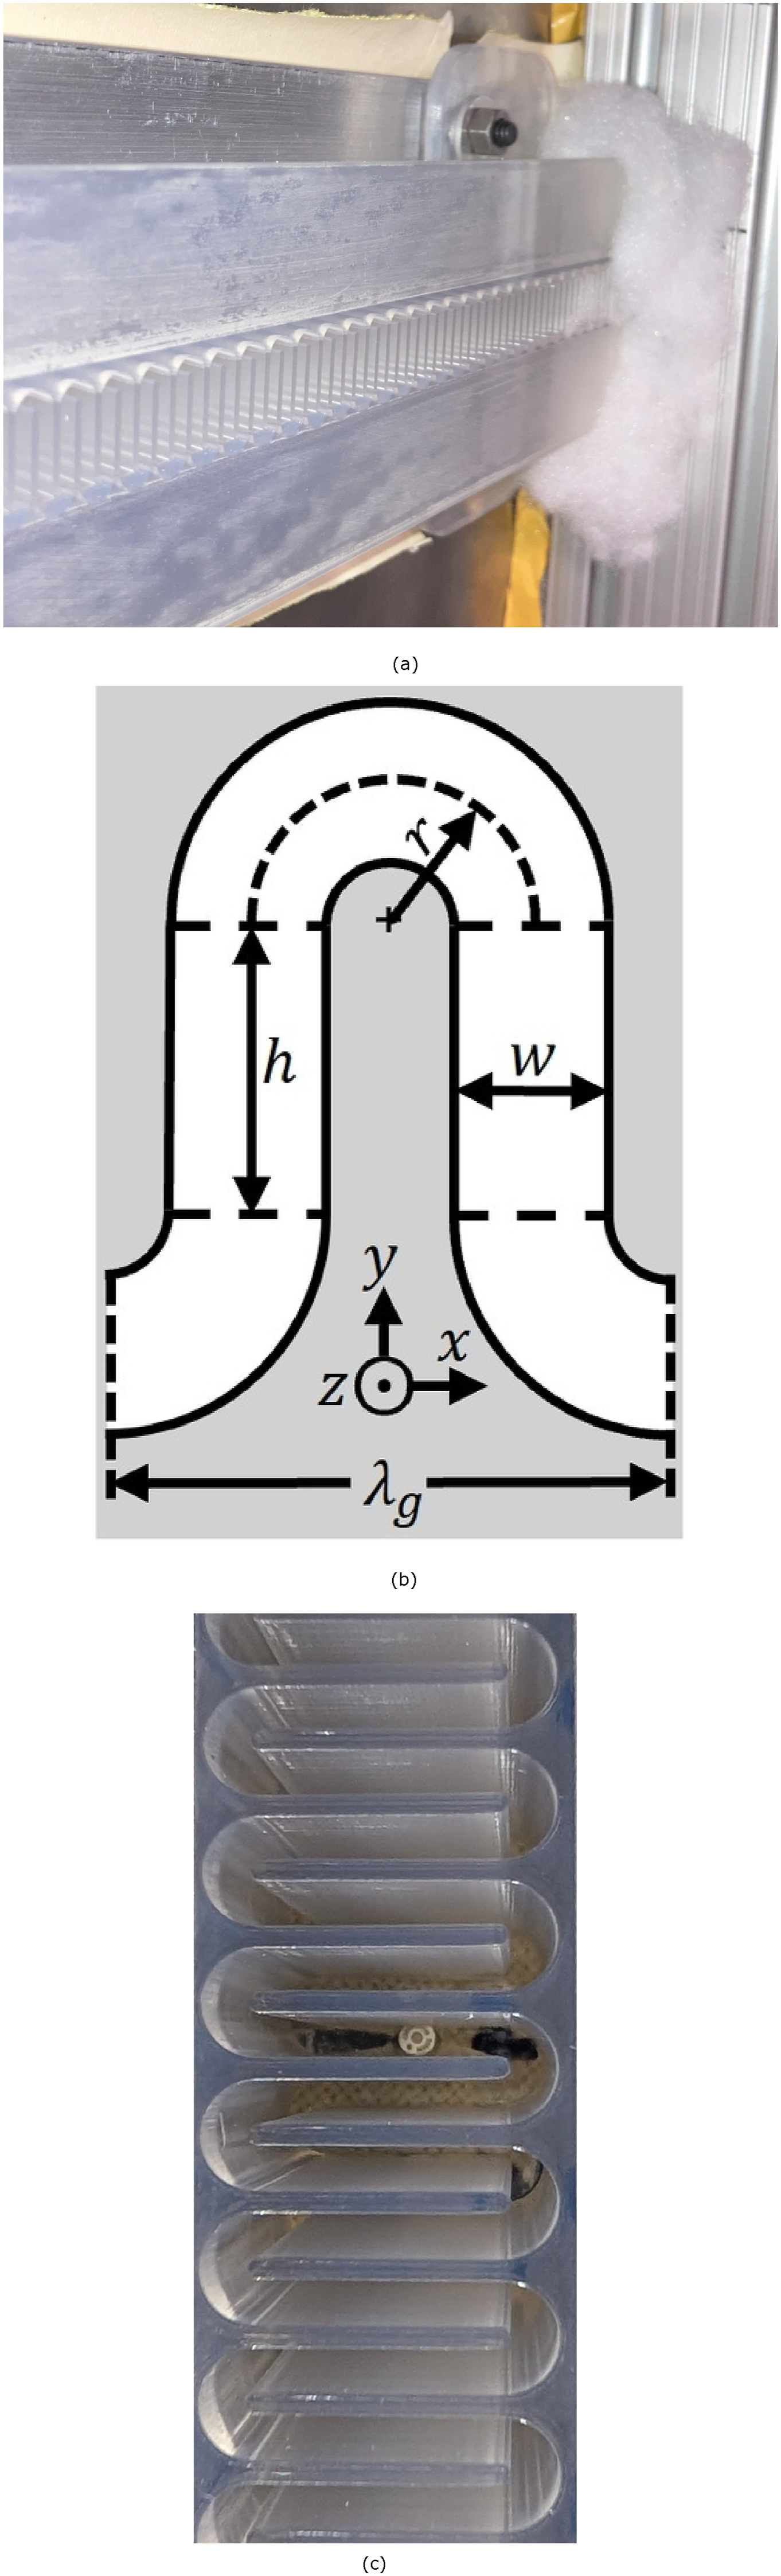
The last 30 mm of each end of the meander channel were stuffed with polyester fiber fill with increasing density towards the end of the channel. A bundle of fiberfill was placed on the outside ends of the meander channel, as seen in Figure 10(a). This was done to attenuate ASWs within the meander channel and reduce reflections due to the abrupt impedance change at the channel ends, like the PMLs in the COMSOL simulations (Figure 6).
The meander channel shown in Figure 10(a) had six Knowles Electronics FG-23329-P07 microphones mounted flush in its depth, as depicted in Figure 10(c). These microphones served to sense the ASWs propagating within the meander channel and were selected because of their flat frequency response up to 10 kHz. They were positioned along the meander centerline at locations of
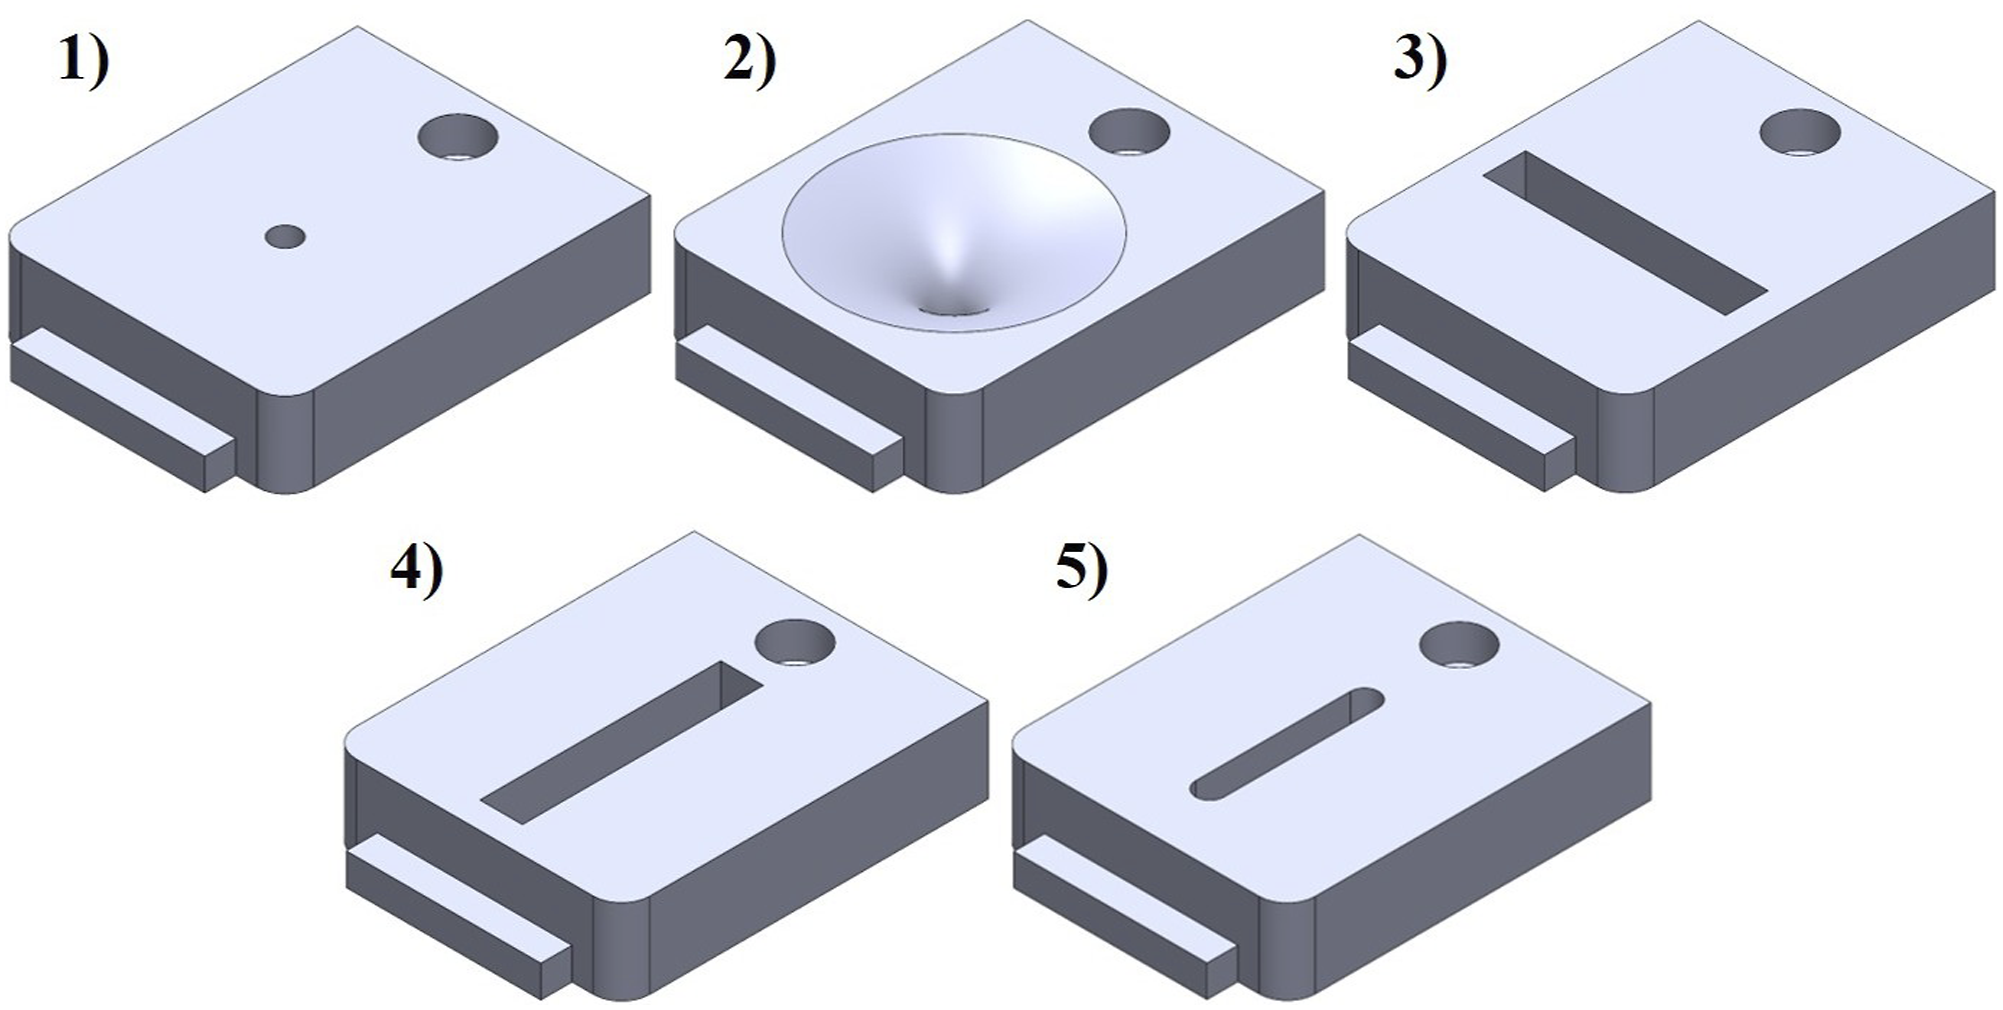
The meander metasurface array has five seats, shown in the circle labeled “Interchangeable coupling mechanisms” in Figure 9. Each seat allows for a coupling plug to be inserted and secured with a bolt and nut. The seats each have a 2 mm diameter and a 1 mm deep hole in the center that connects to the meander channel. The 6 mm thick coupling plugs have various cavity shapes that connect to the 2 mm hole in the seat and couple them to the meander channel. This creates a 7 mm deep hole from the flow/sound source side into the meander channel. Five different coupling mechanisms were designed to vary the profile of the 7 mm deep coupling hole. They were then 3D printed using the same Accura® 60 clear plastic material as the metasurface. These coupling plugs, seen in Figure 11, are summarized as follows: 1) Pinhole: A 2 mm diameter and 6 mm deep cylindrical hole. This connects to the 2 mm diameter hole in the metasurface, making the entire coupling mechanism a 7 mm deep cylindrical hole from the flow/sound source side into the meander channel. 2) Horn: A parabolic-shaped horn with a radius of 8.5 mm on the flow/sound source side, transitioning down to a 1 mm radius at the bottom. The equation defining this horn shape is, 3) Streamwise slot: A 17 mm by 3 mm rectangular slotted cavity with a depth of 5 mm. At the bottom of this cavity is a 2 mm diameter and 1 mm deep hole which connects to the 2 mm hole in the metasurface. This cavity is oriented so that its long side is parallel to the length of the metasurface. 4) Spanwise slot: This is the same coupling shape as in (3), but the cavity is oriented such that its long side is perpendicular to the length of the metasurface. Both couplings (3) and (4) were designed to match the individual sensor aperture of the subresonant sensor array, studied by Galluscio et al.
16
5) Rounded slot: A 13 mm long by 2 mm wide slot with a depth of 5 mm. The ends of the slot form 2 mm diameter semi-circles. At the bottom of this cavity is a 2 mm diameter and 1 mm deep hole that connects to the 2 mm hole in the metasurface. This coupling was designed to match the shape of the through-cavities in the meander metasurface previously studied by Galluscio et al.,
16
but with a shallower depth. Meander metasurface coupling mechanisms.
The center of each coupling on the metasurface was located 396.5 mm, 420.5 mm, 444.5 mm, 468.5 mm, and 492.5 mm from the upstream edge of the meander channel. When configuring the metasurface with coupling mechanisms, petroleum jelly was applied to the surface between each plug and the metasurface to create a seal with no air gaps except the 2 mm hole at the center. This configuration allowed us to test various methods for attenuating TBL noise while allowing the signal of interest to transmit into the meander. Also, note that this array has 12 fewer coupling locations than the previously studied meander metasurfaces15,16 and thus a 70% shorter sensing aperture.
Anechoic open jet wind tunnel test setup
The meander metasurface with various coupling configurations was tested in Virginia Tech’s Subsonic Modular Anechoic Research Tunnel (SMART). The SMART is an anechoic open jet wind tunnel with a 0.76 m by 0.76 m inlet that exhausts into an anechoic chamber with a 1.27 m by 1.27 m outlet directly downstream of the inlet. The interior of the anechoic chamber, seen in Figure 12, is 4.2 m long in the Test setup in VT’s SMART.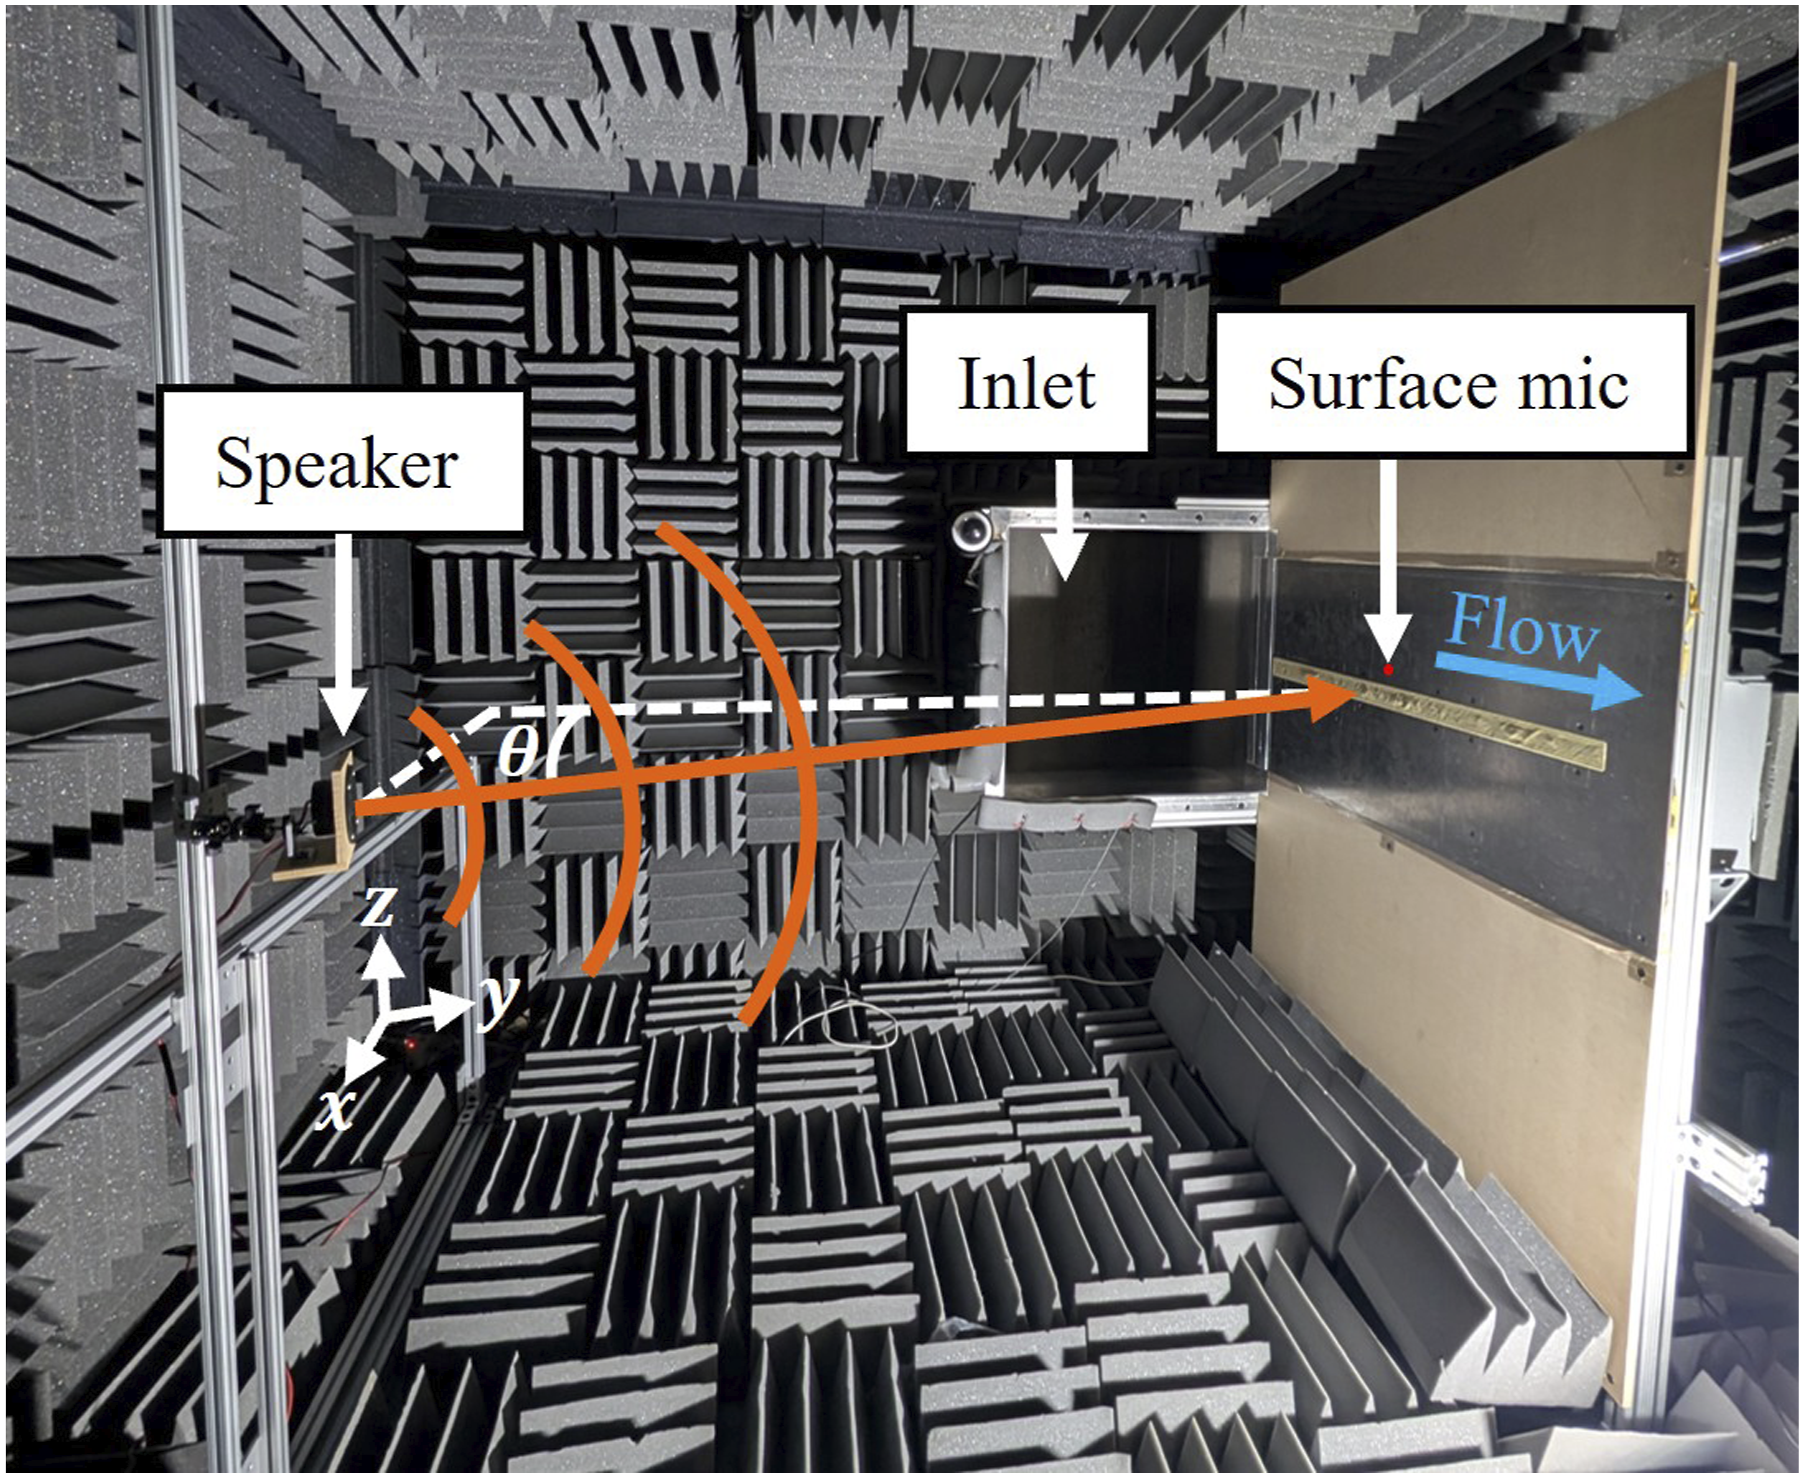
An Abaca Audio AAT414 speaker on a horizontal and vertical slider was positioned on the opposite side of the inlet to the array, outside of the flow, as shown in Figure 12. This speaker was moved to various positions and directed toward the array reference point using a laser pointer. The reference point was selected as the point halfway between the two most downstream coupling holes. The plane that the speaker resides on is located at a normal distance of 2 m from the test plate. The speaker was powered by a Crown Audio XTi 4000 amplifier and emitted a white noise signal generated by an NTI MRS Minirator signal generator. The speaker positions were defined by a horizontal angle component,
The metasurface was tested in quiescent conditions and in 20 m/s flow conditions for Turbulent pressure fluctuations and acoustic signals measured by the surface microphone.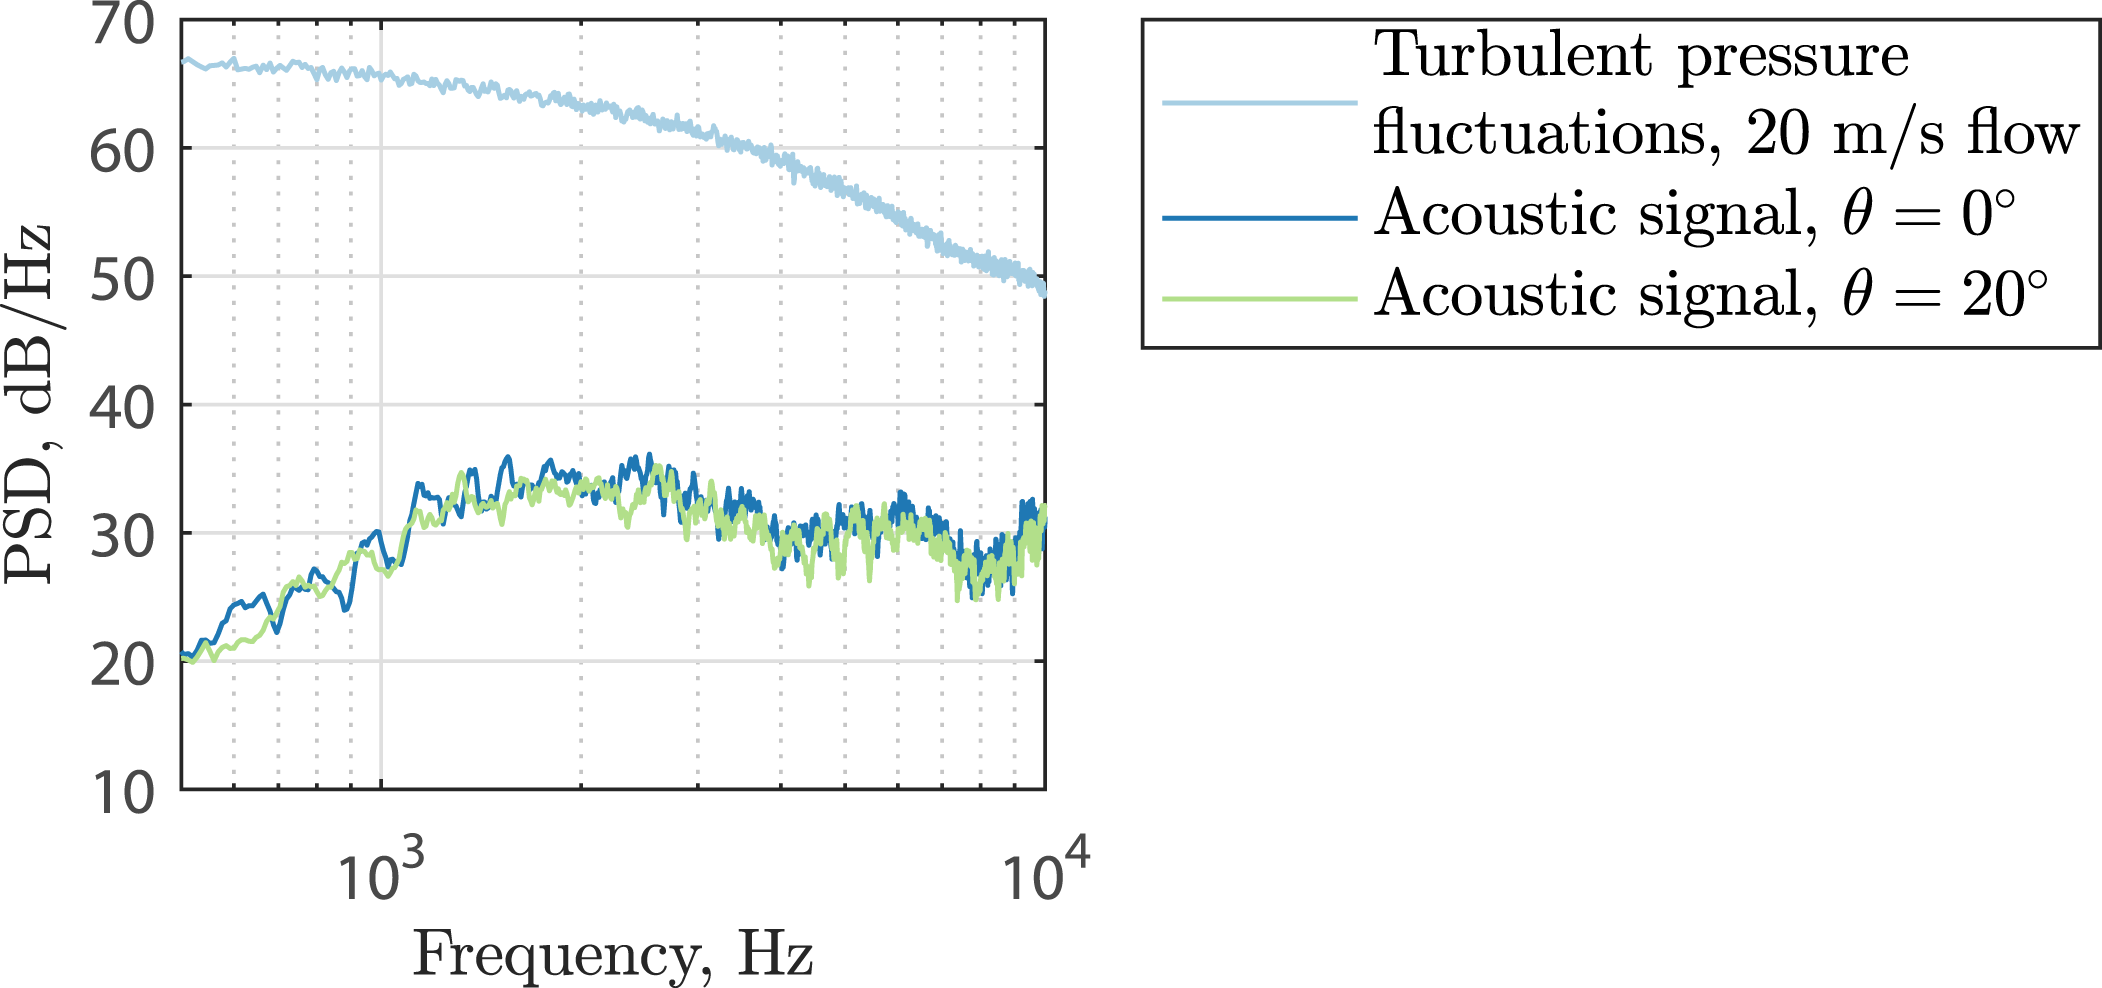
Data acquisition
All six of the embedded Knowles microphone signals, the surface microphone signal, and the white noise signal were sampled simultaneously by three B&K Type 3050-A-060 DAQs, connected through an Ethernet switch. These data were sampled using the B&K Connect software at a sampling rate of 65,536 Hz, for 12 s per test case. All microphone data were analyzed in the frequency domain. Each data set was blocked into records of 8192 samples. These records were overlapped by 50% and a Hanning window was applied to each. A fast-Fourier-transform (FFT) was performed on each block. The resulting complex pressure spectra for each signal could then be turned into auto and cross-spectral densities by multiplying by the complex conjugates of the signals to form a cross-spectral matrix (CSM). The results were averaged over the total number of records, resulting in statistical uncertainties in the auto and cross-spectral density estimates of approximately 0.3 dB.
Results and discussion
The following section first demonstrates the independence of TBL pressure fluctuations and acoustic pressure fluctuations as experienced by the surface microphone and the meander metasurface array. Then, the effect of the various coupling mechanisms on the metasurface array’s SNR is studied before examining how these coupling mechanisms affect the array’s ability to locate a sound source.
Independence of TBL and acoustic measurements
It is of interest to examine and compare the magnitudes of the pressure fluctuations from the TBL and target acoustic source separately to establish the linearity of the combined response and to define an SNR. We will refer to the pressure fluctuations from the TBL as the noise, and those from the speaker as the signal. Test cases were run for each coupling with signal only, noise only, and both signal and noise. These measurements can be used to verify the independence of the signal and noise by summing the PSD of each (in Simultaneous signal and noise measurements compared to the sum of independent measurements.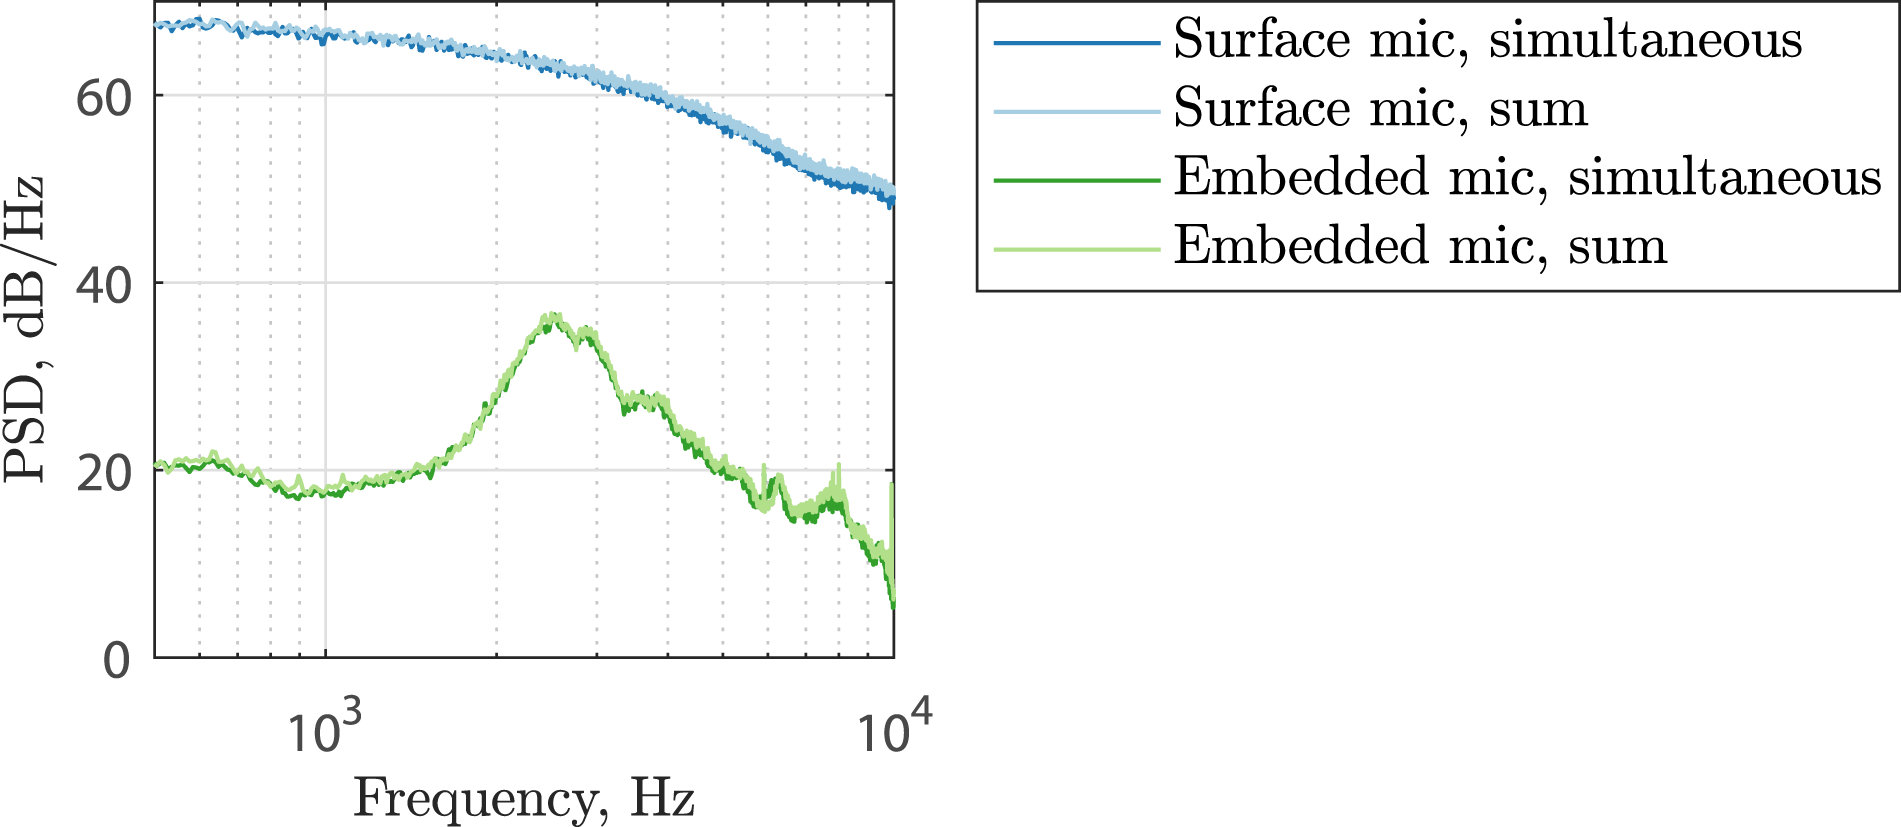
Signal-to-noise ratio comparison
The signal and noise measurements for each coupling were compared to demonstrate how the couplings enhance the signal and suppress the noise measured. Figure 15 shows the signal measurements made by the first embedded microphone, closest to the coupling holes, for each coupling type under quiescent conditions. Signal measured by the microphone embedded in the meander channel. (a) 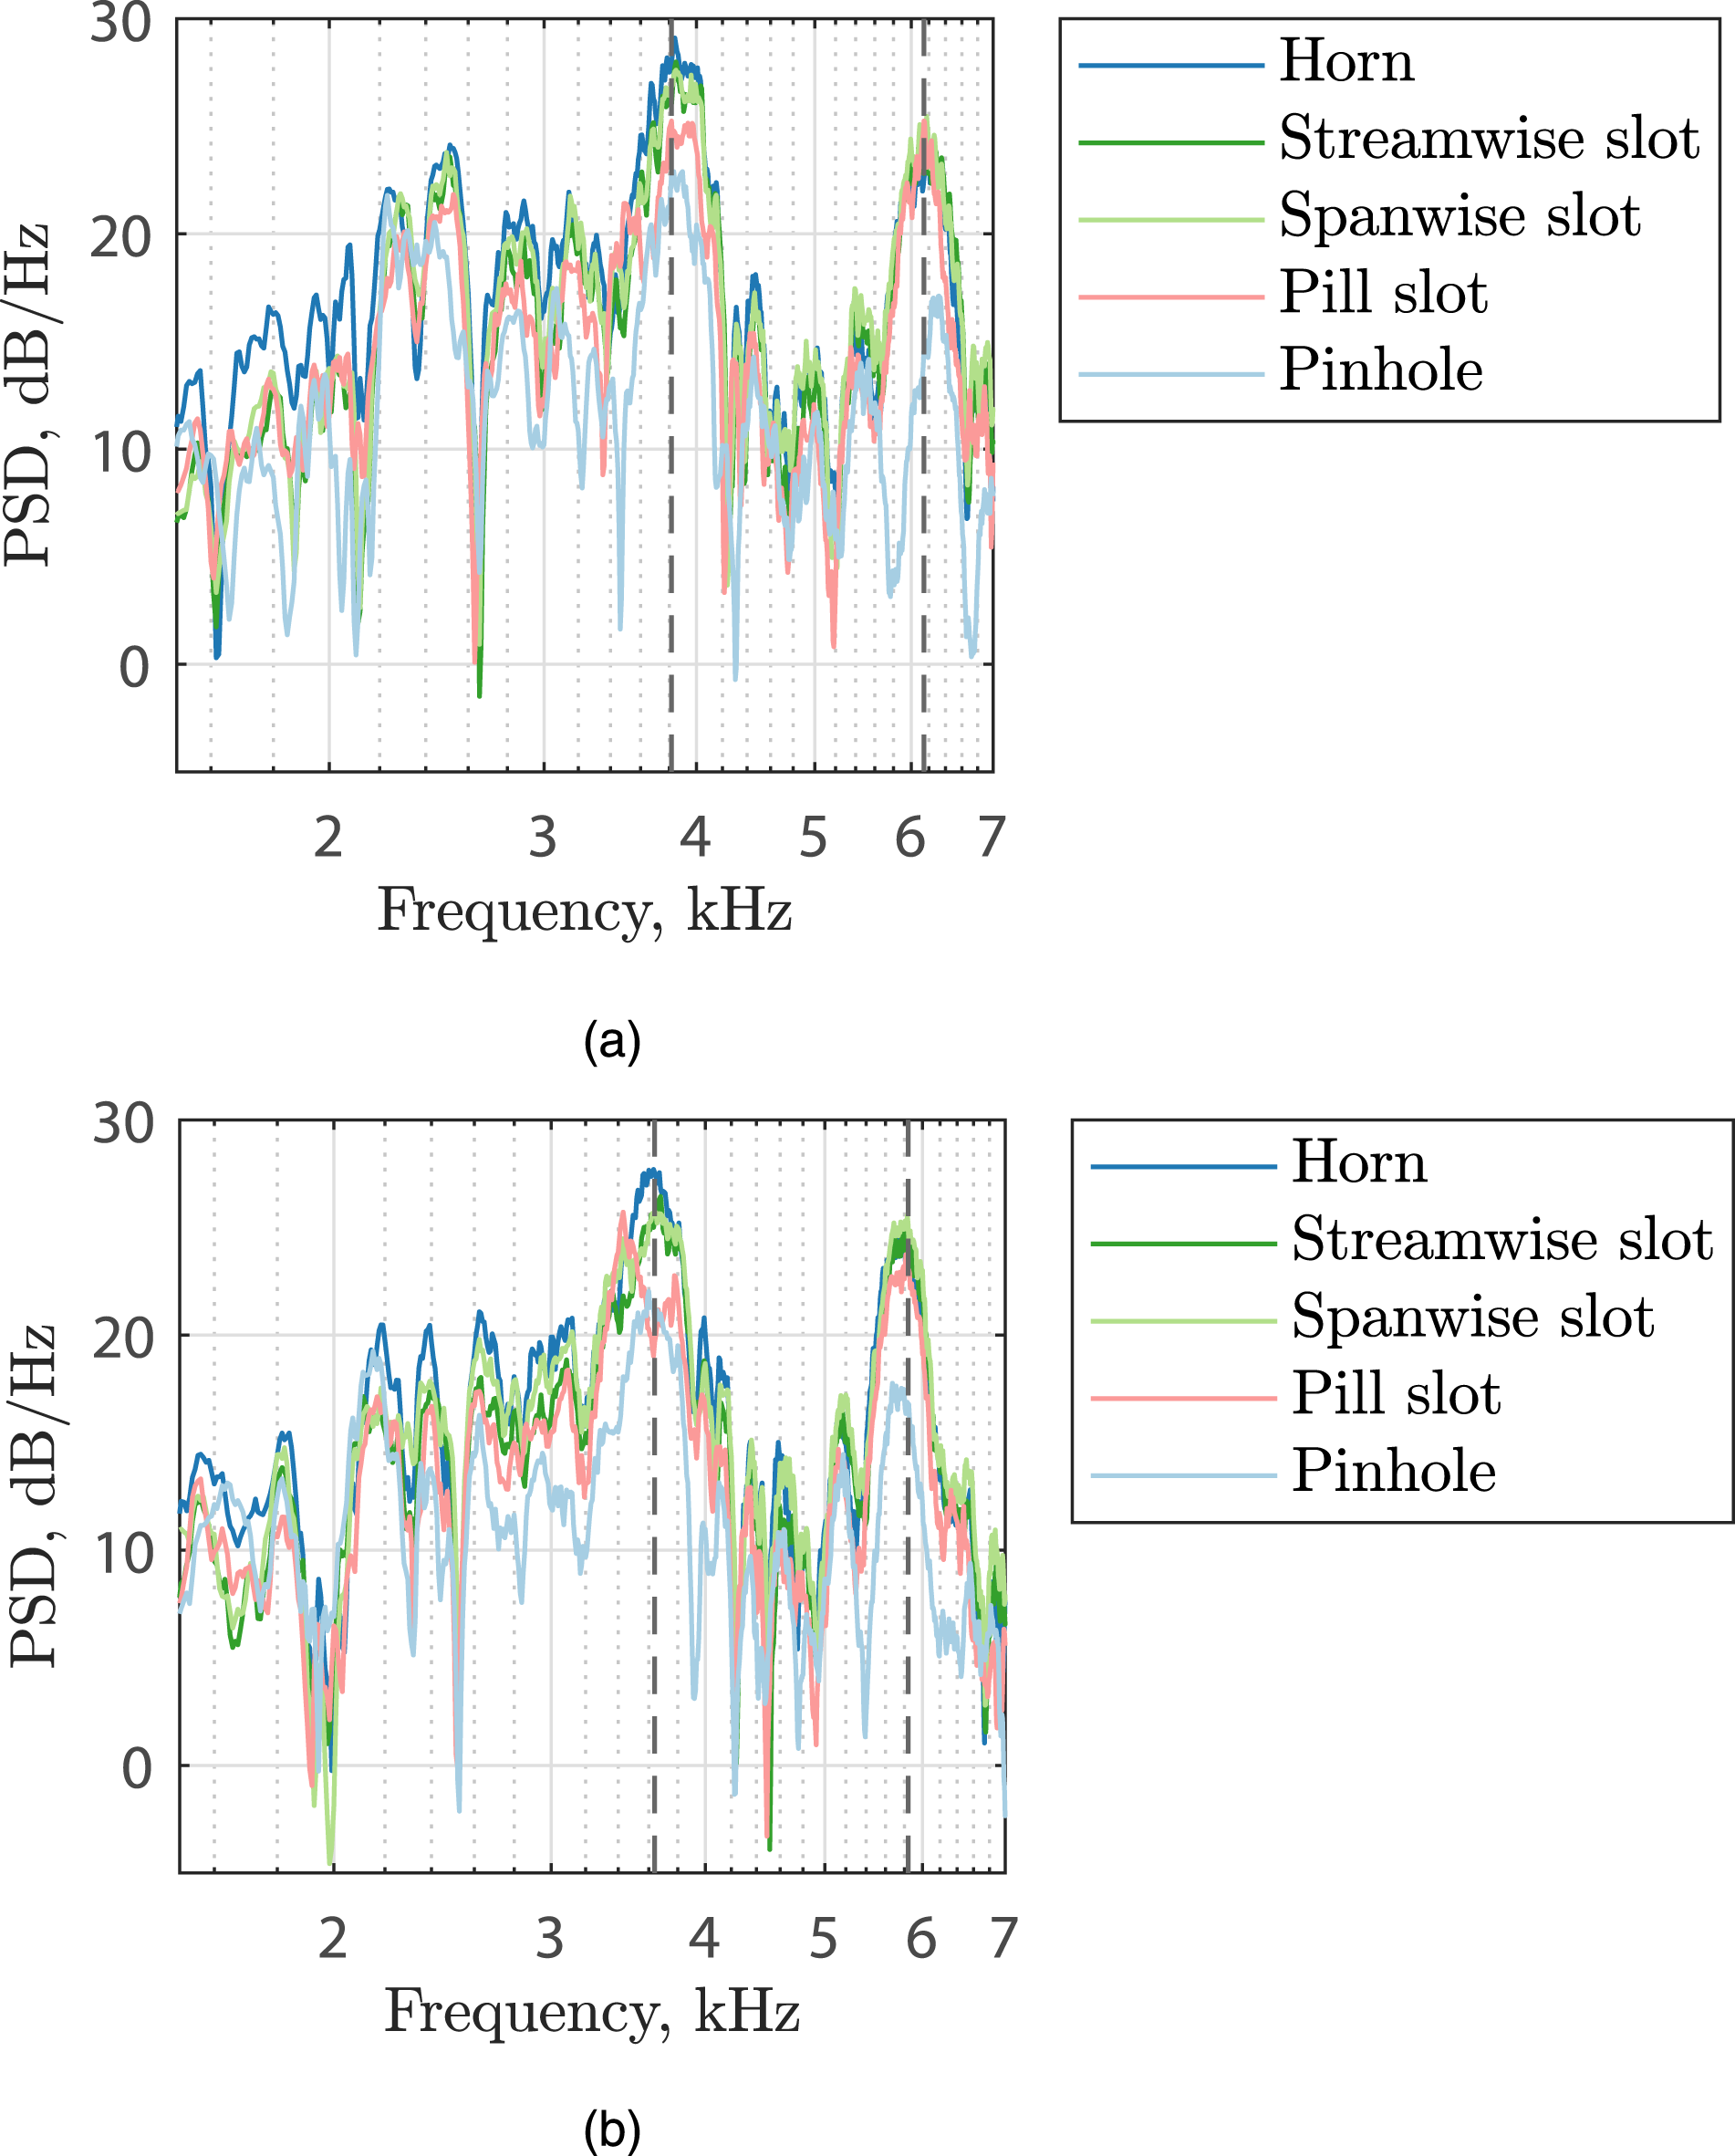
It is important to note that the peak amplitudes in Figure 14 correspond to the ASWs that are excited within the meander channel and not the amplitude of the free-space propagating sound wave. These ASWs resonate at specific frequencies based on the sound source direction of arrival. A calibration procedure is not currently done to match the amplitudes of these ASWs to the amplitude of the free-space sound waves, because this would only recover the source amplitude at the frequency of ASW reinforcement. The array is currently designed to only provide the sound source direction of arrival, and the current study is aimed at enhancing measurement of ASWs within the meander channel.
Figure 16 shows the TBL noise measured within the meander channel through each of these couplings. Noise measured by the microphone embedded in the meander channel.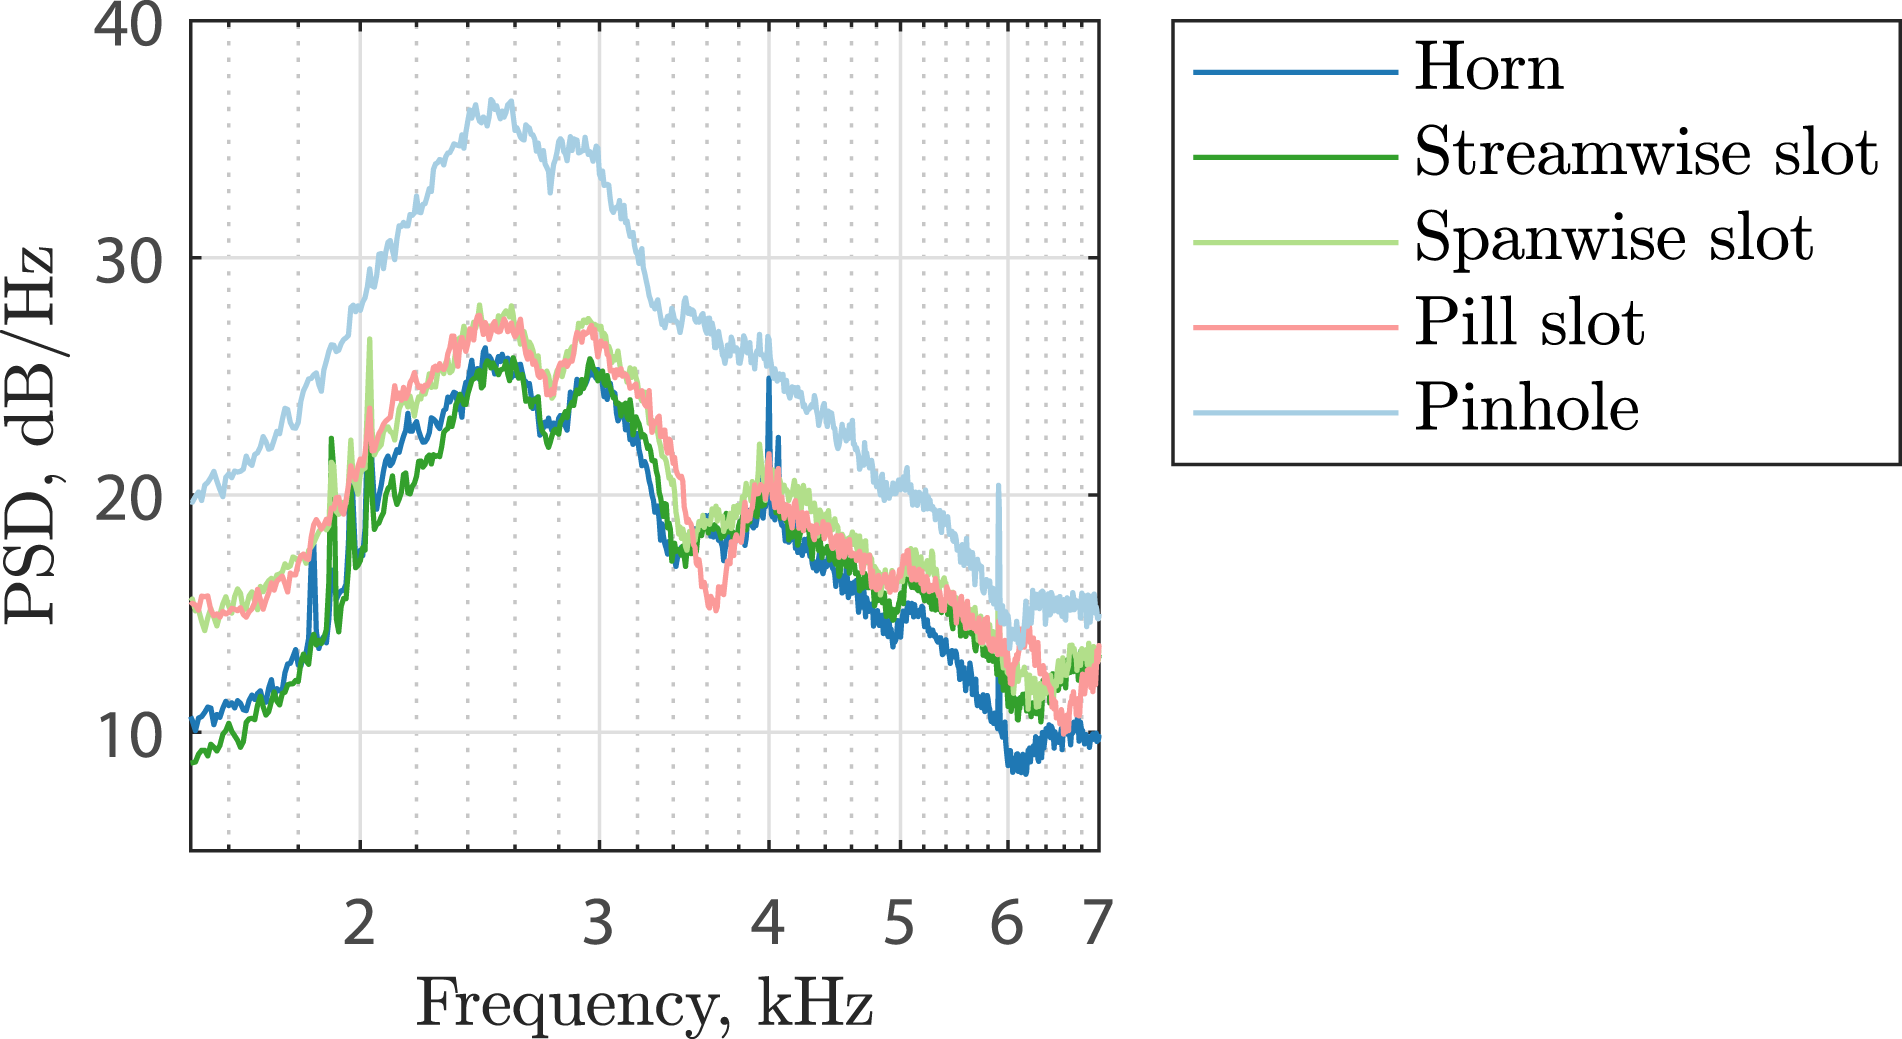
Figure 17 shows the calculated SNR that is experienced by the first embedded microphone for the various coupling shapes in 20 m/s flow. SNR measured by the microphone embedded in the meander channel. (a) 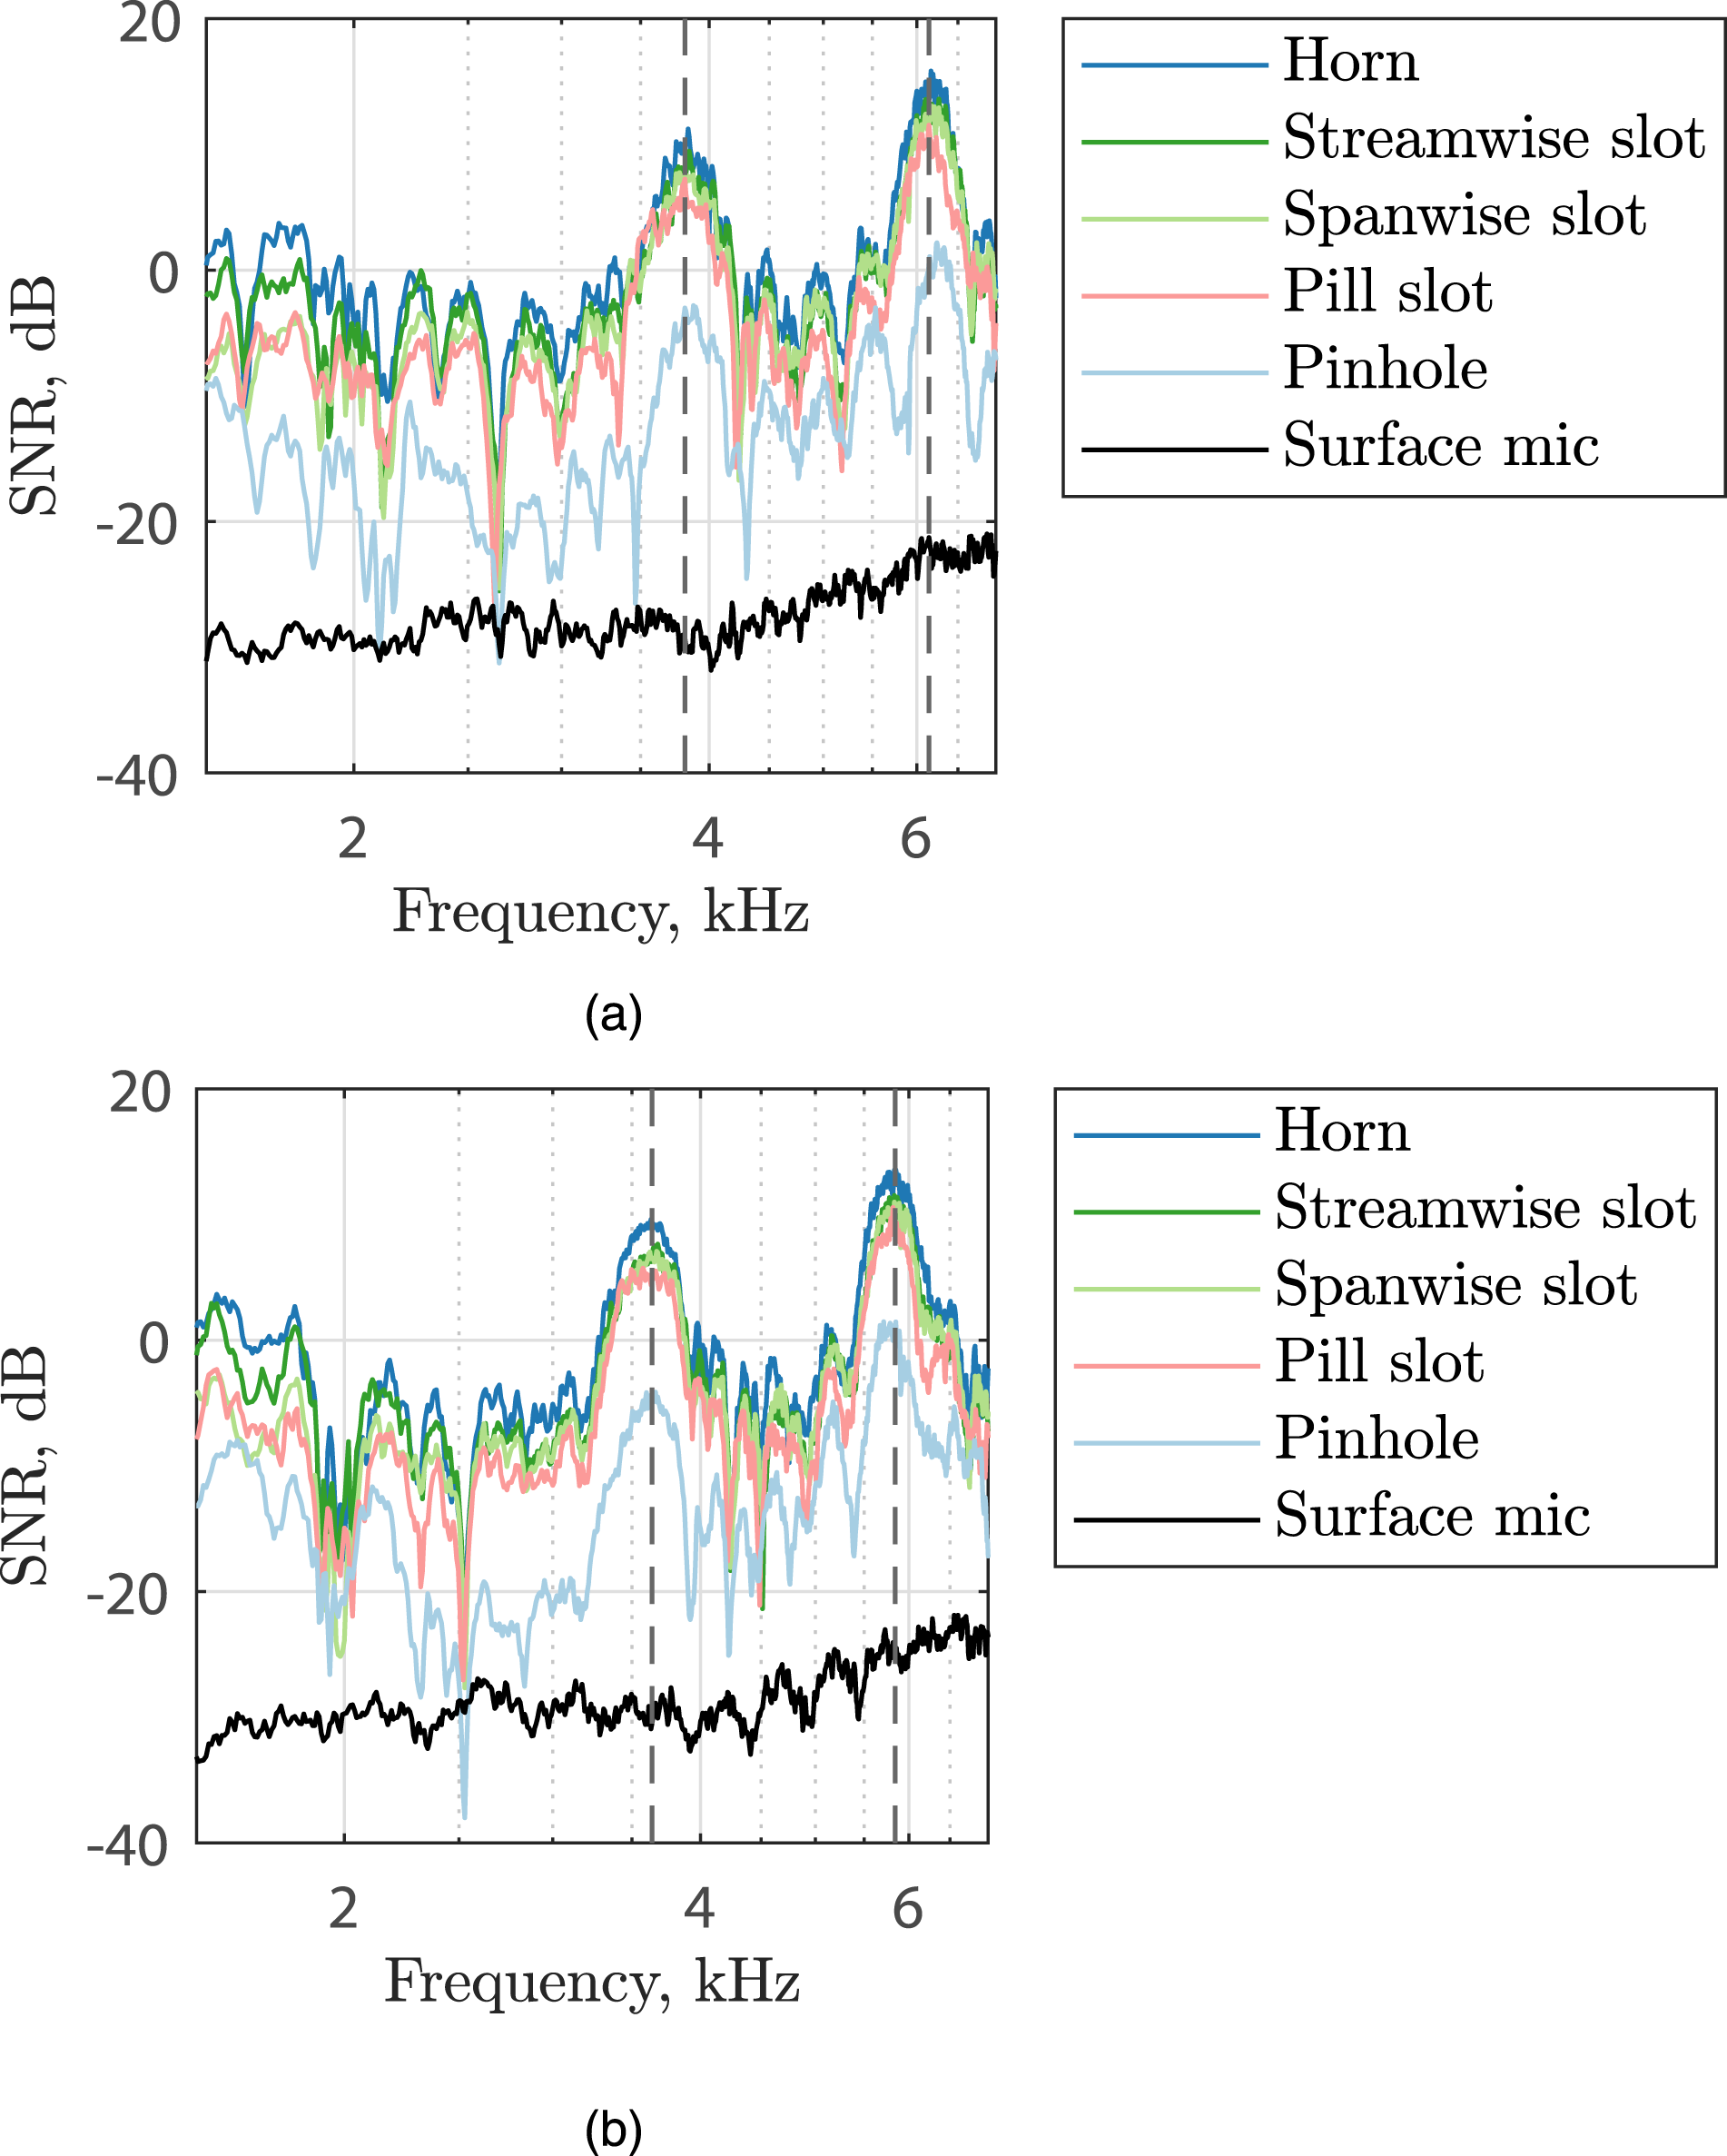
Wavenumber-frequency domain analysis
Although the SNR improvement by the metasurface for an individual sensor measurement is extremely promising, locating the direction of arrival of a sound source through an acoustic metasurface requires observing ASWs in the wavenumber-frequency domain, as done in the “Meander channel analysis” subsection of the “Numerical simulations” section. This can be accomplished by traversing a microphone in space over the meander channel and wavenumber transforming the complex pressure spectra,14,15,18,19 or by using a delay-and-sum beamforming algorithm.15,16 The benefit of using beamforming is that multiple microphones can be positioned in the meander channel and sampled simultaneously. This greatly reduces the measurement time in comparison to traversing a microphone over a section of the meander. For these experiments, a beamforming algorithm was applied to the six embedded microphone signals to estimate the wavenumber-frequency spectrum. This algorithm employed functional beamforming as presented by Dougherty.
20
The beamforming output,

The beamforming result can be plotted as a contour that displays the acoustic power measured for various combinations of wavenumber and frequency, as seen in Figure 18. Beamformed wavenumber-frequency spectrum from the meander metasurface array configured with horn-shaped plugs in quiescent conditions with the speaker positioned at 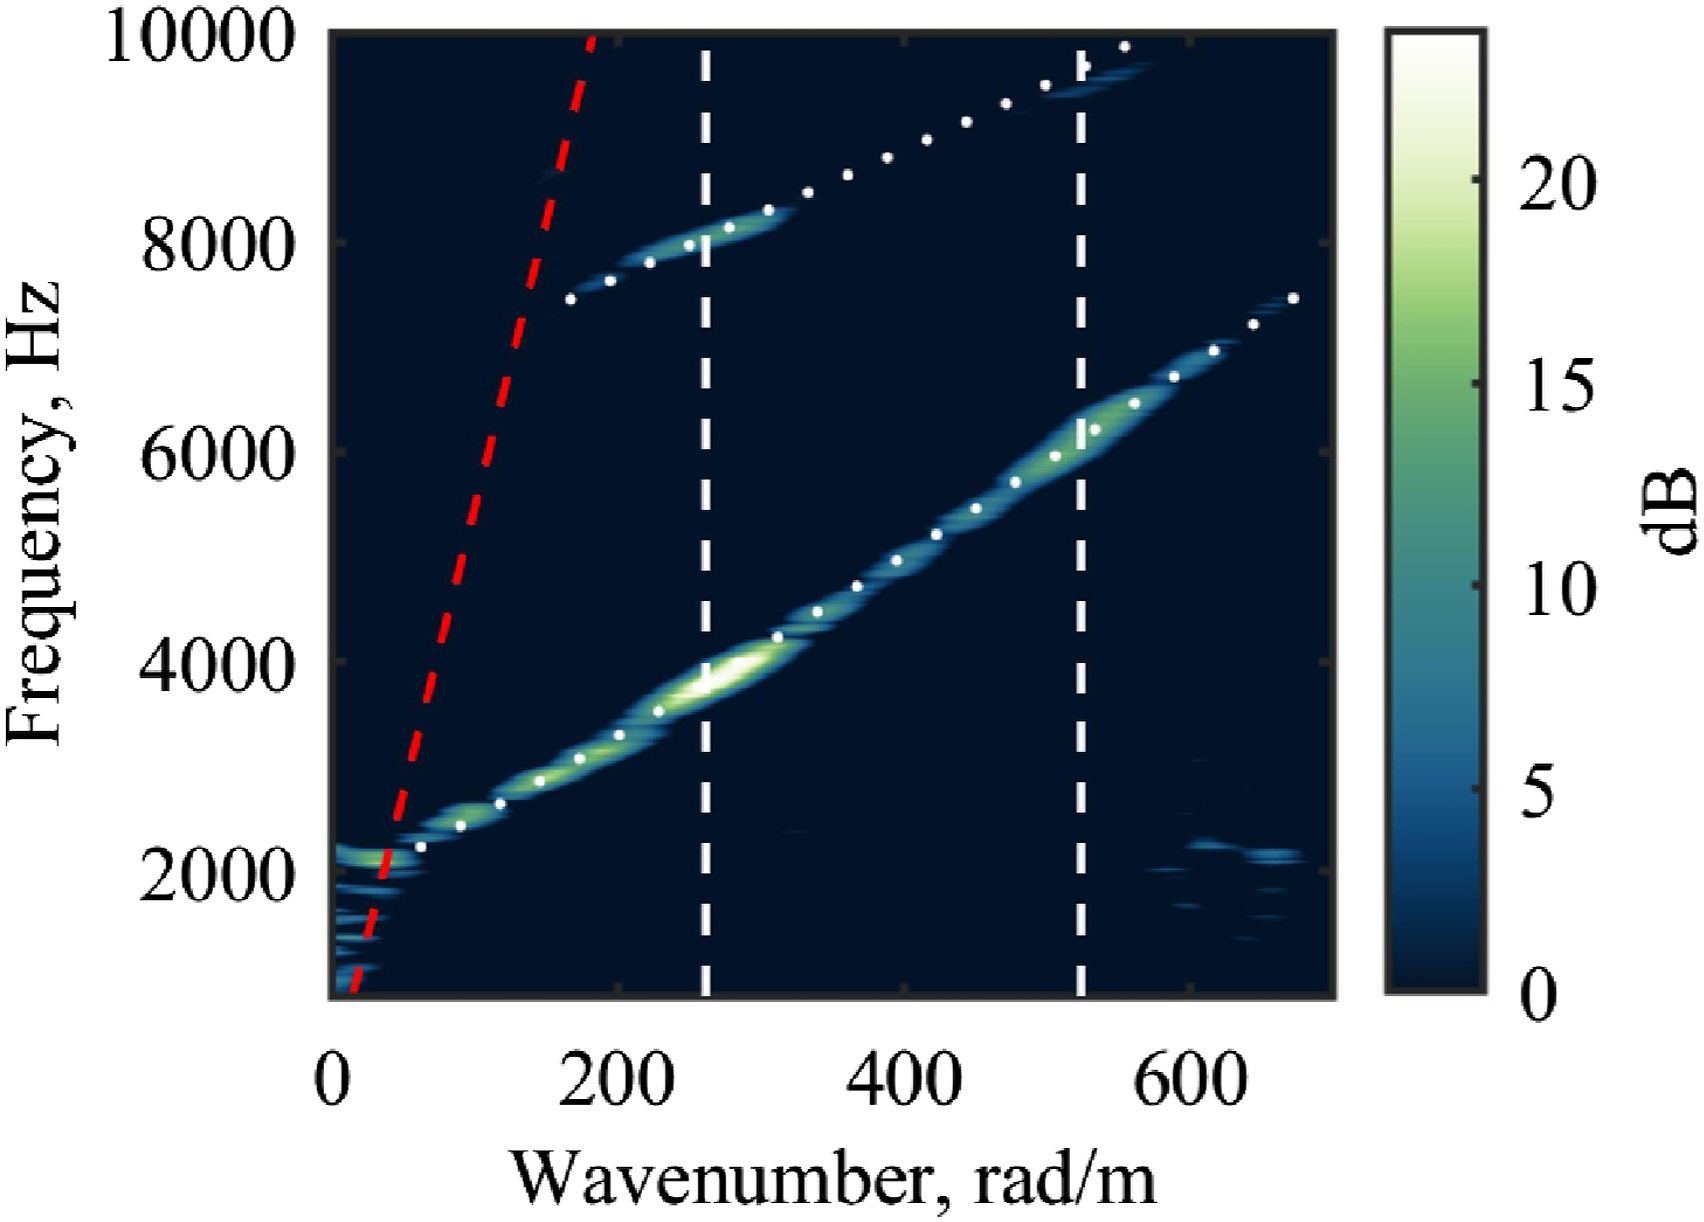
Source location comparison
The information contained in the beamformed wavenumber-frequency spectrum (Figure 18) can be used to identify the direction of arrival of the sound source, as demonstrated by Braaten et al.
15
and Galluscio et al.
16
The effect of the coupling configurations on this ability to locate the source was studied. This was done by examining the array’s beamformed wavenumber-frequency spectra for cases where both signal from the speaker and noise from the flow were observed by the array. It was shown in the “Independence of TBL and acoustic measurements” subsection that the TBL noise and acoustic signal are independent and combine linearly to form the simultaneous measurement of each. This means that the noise due to the TBL pressure fluctuations can be removed by subtracting the beamformed wavenumber-frequency spectra obtained from the corresponding flow-only measurements. Additionally, data above the sound line ( Beamformed wavenumber-frequency spectra measured with the horn coupling, 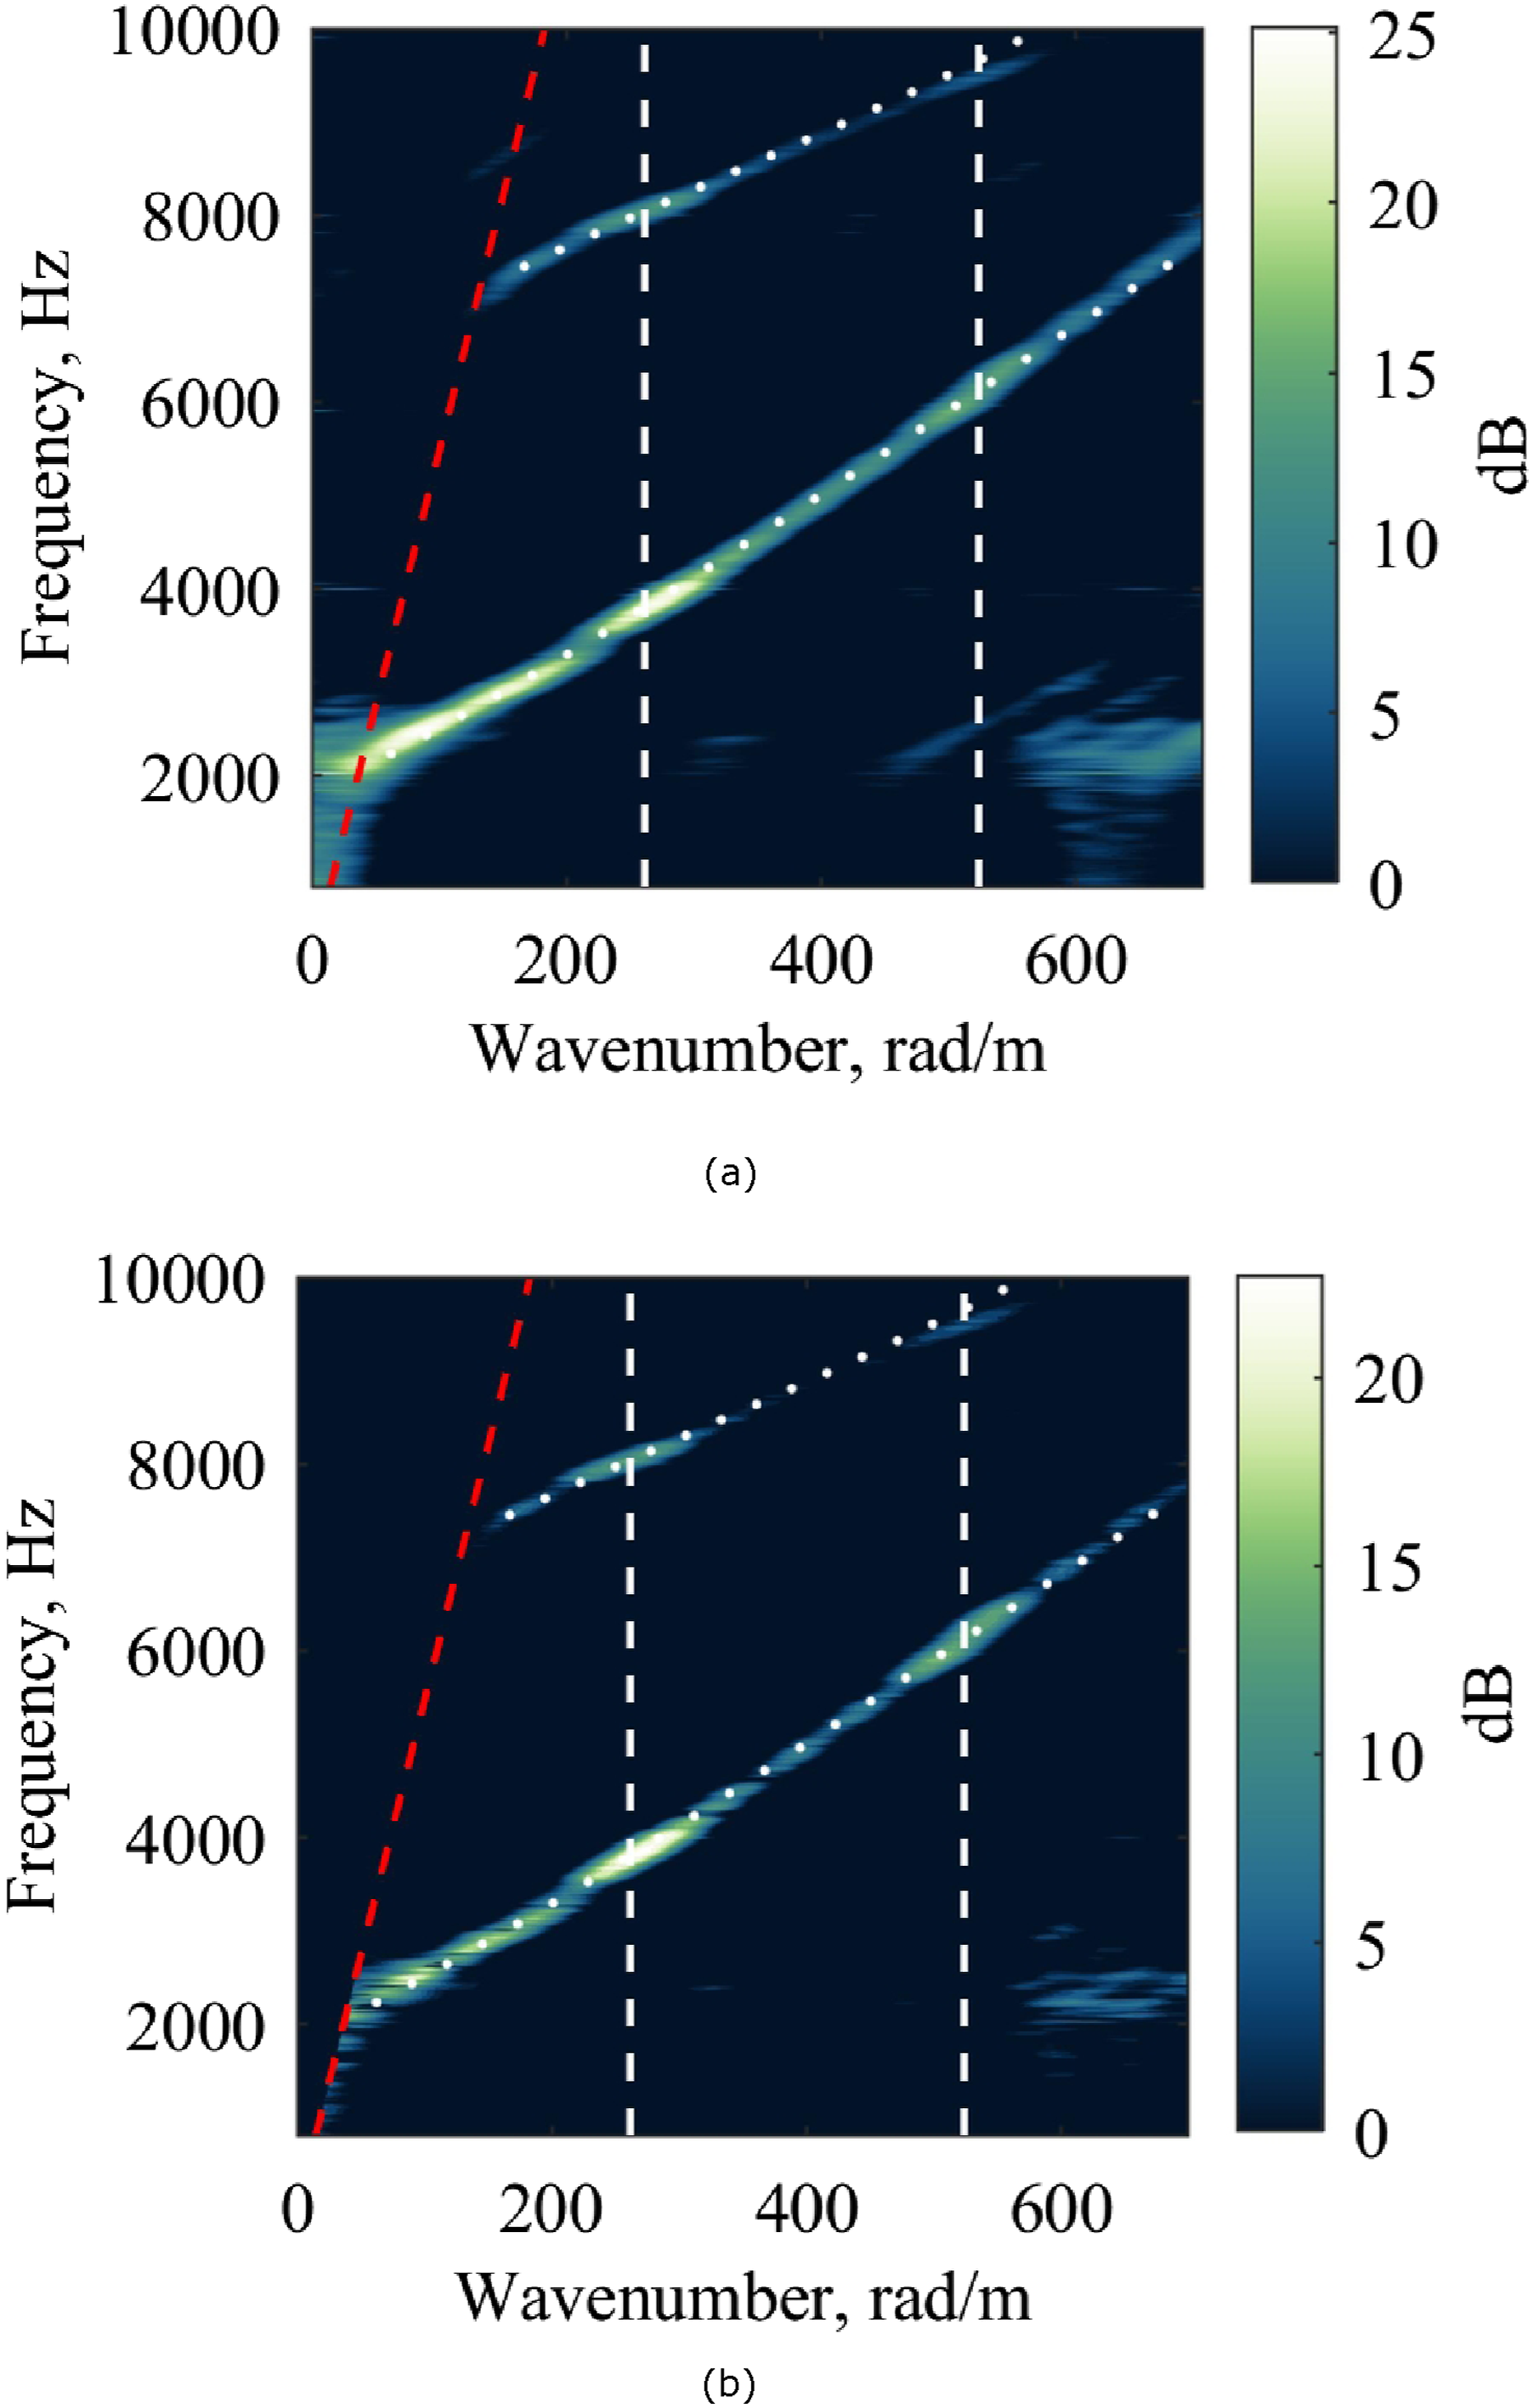
After removing the flow noise, the wavenumber-frequency spectrum in Figure 19(b) closely resembles that of the acoustic signal with no flow in Figure 18. This allows the ASW reinforcement to be examined with minimal distraction from ASWs excited by flow. The wavenumber-frequency spectrum was then integrated along the lines defined by equation (2) for Integrated sound power along reinforcement lines for each coupling in 20 m/s flow. (a) 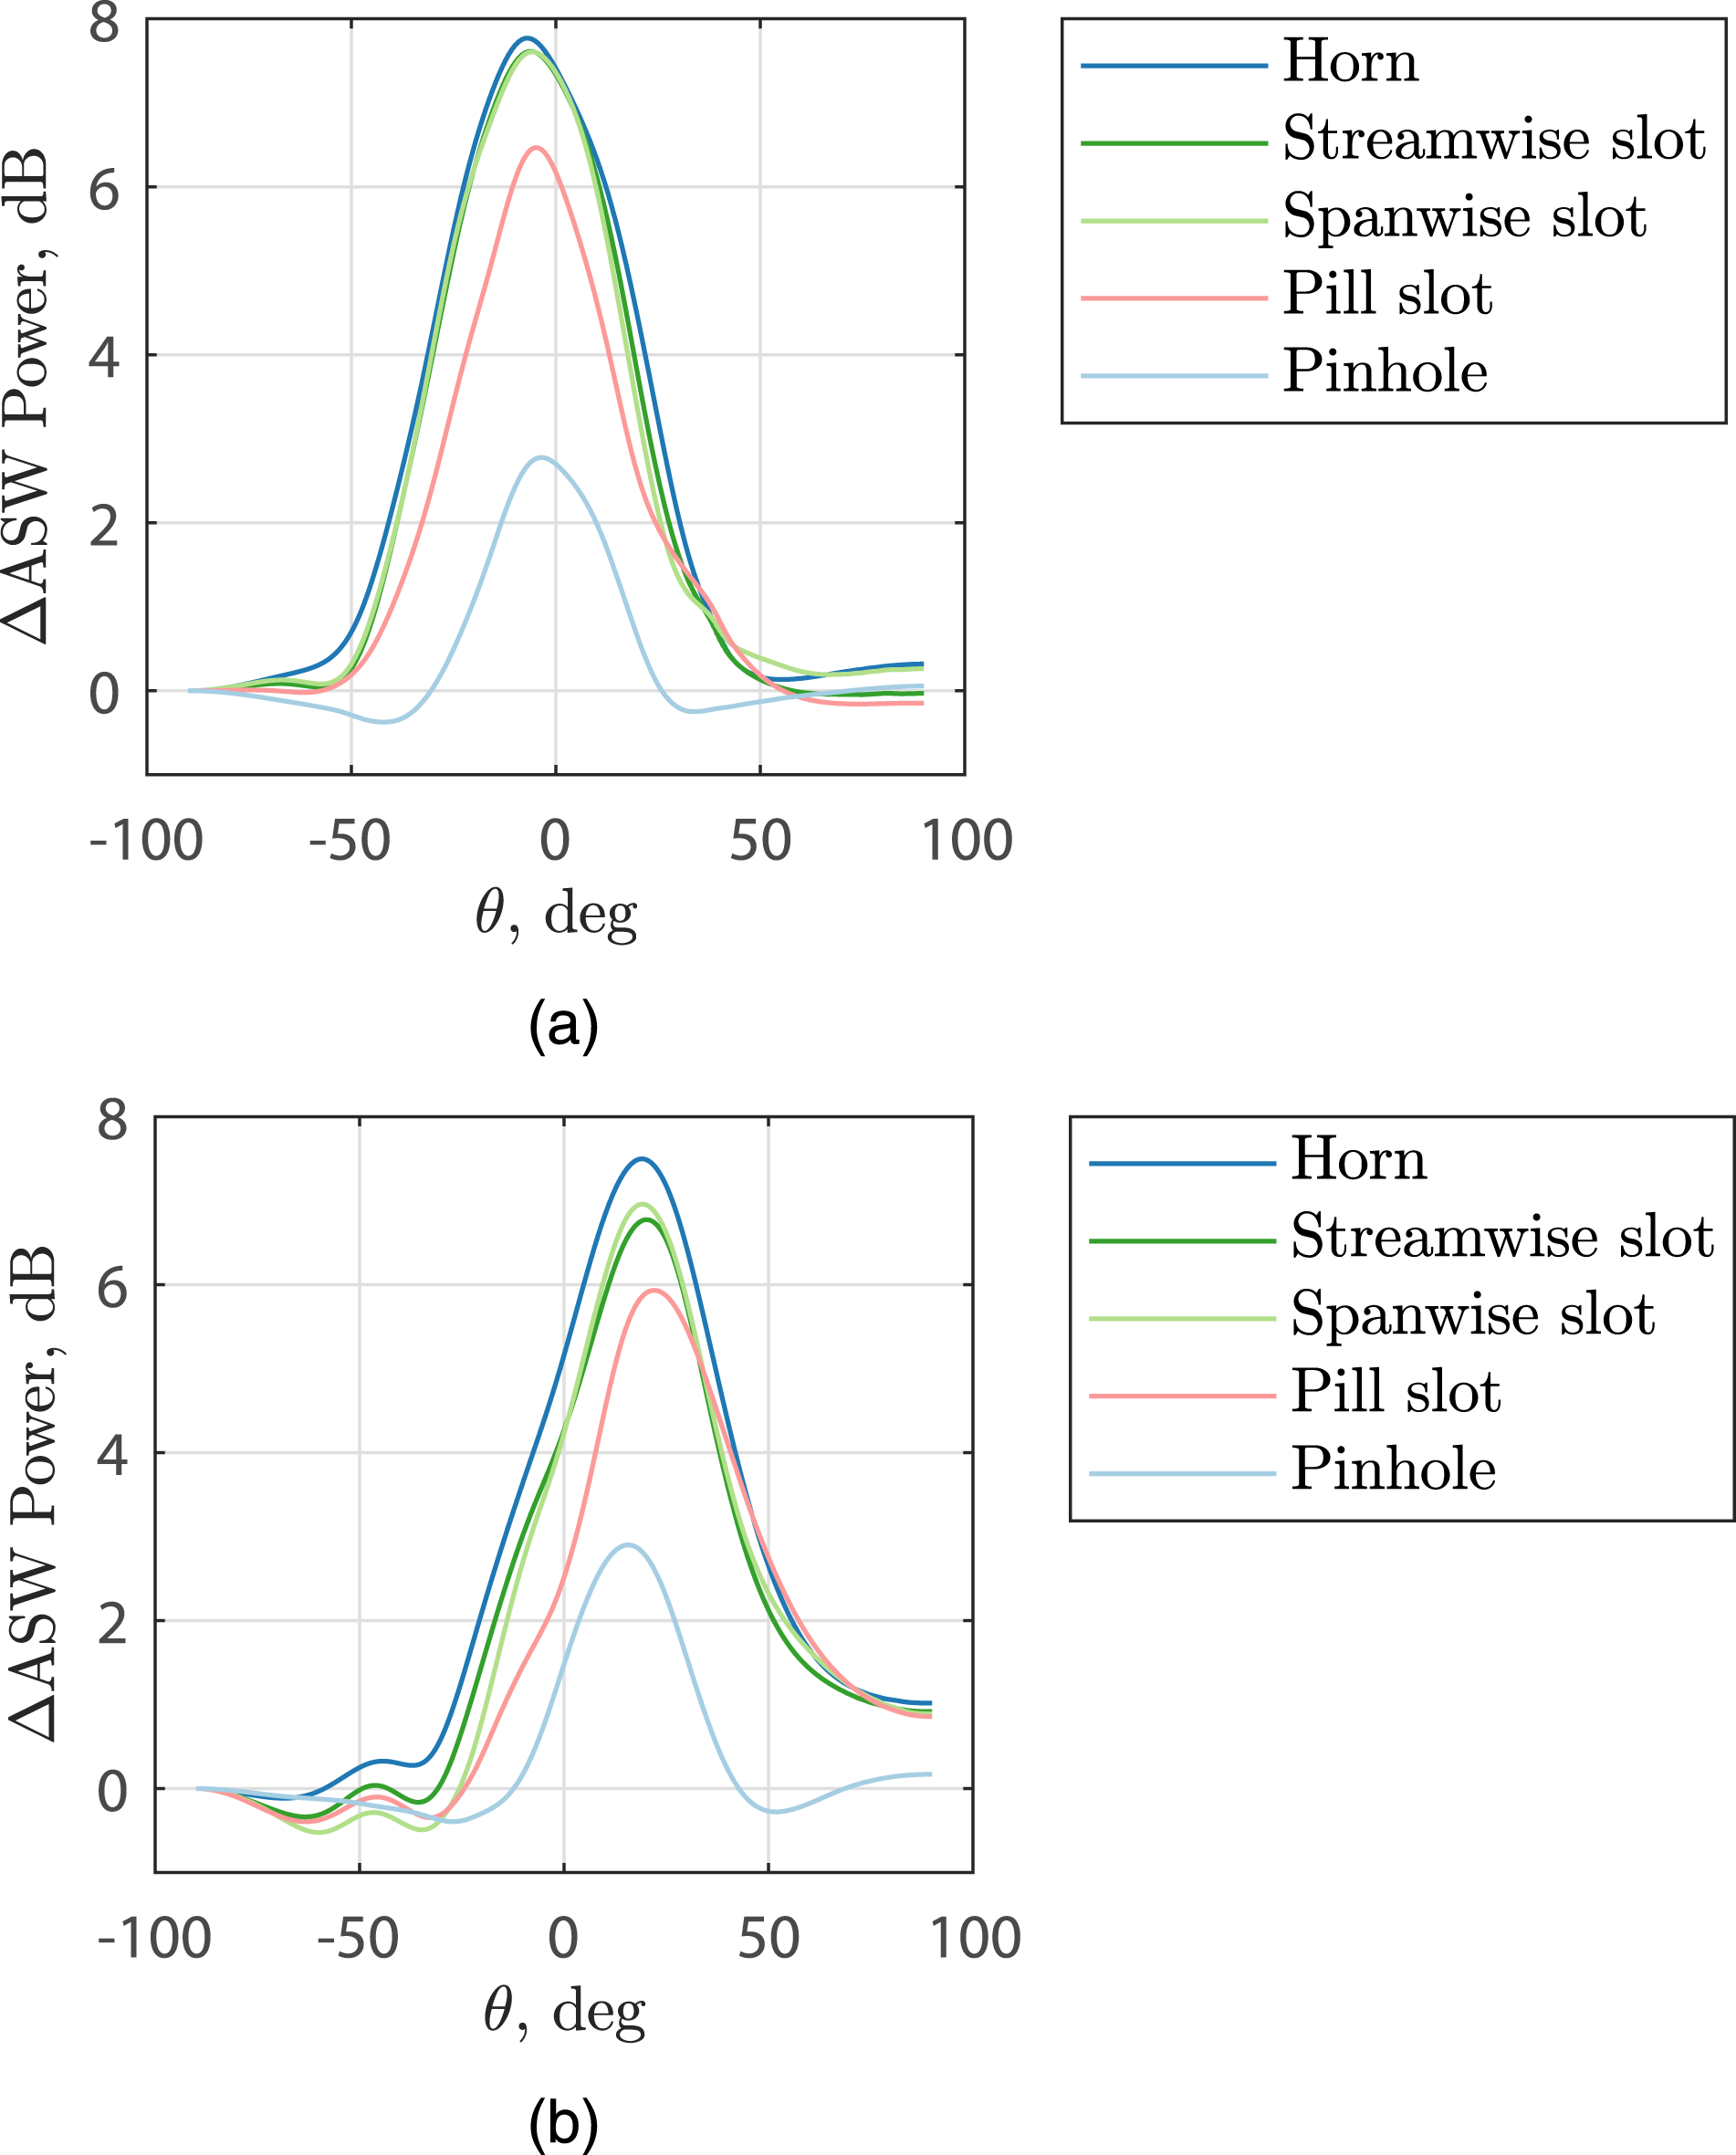
The trends for each sound source angle mimic the results from the “Signal-to-noise ratio comparison” subsection, where the SNR improved as the coupling surface area increased, with the dimension in the flow direction being most important for reducing TBL noise.
9
The spanwise slot slightly outperformed the streamwise slot in Figure 20(b), but this can be explained by the uncertainty present in these measurements. The peak values in both plots of Figure 20 do not exactly correspond to the expected angles of
Overall, these results show that by optimizing the method used for coupling sound to an acoustic metasurface, a significant gain in ASW power can be achieved. In this case, the horn-shaped coupling demonstrated a 5 dB improvement in ASW reinforcement over the pinhole couplings. This is equivalent to a 300% increase in the sound power of the measured ASW. Additionally, this metasurface array successfully detected acoustic sources with only five through-cavities as opposed to the previously studied meander array’s 17 through-cavities,15,16 demonstrating that a 70% reduction in the length of the sensing aperture did not deteriorate the array’s performance.
Conclusions
Significant improvements have been made to the coupling of an acoustic metamaterial, operating under a TBL, to an external sound field. Numerical acoustics modeling was used to identify optimal coupling designs for a meander metasurface array. This array was then prototyped with interchangeable coupling mechanisms and tested in VT’s SMART wind tunnel. The results showed that increasing the coupling area on the flow surface allows more sound into the meander channel, creating stronger ASW excitation by the signal of interest. Increasing the coupling length in the flow direction promotes better attenuation of turbulent pressure fluctuations. This mimics the effect of transducer shape on TBL pressure fluctuation measurements. 9 As a result, the metasurface experiences less excitation due to these fluctuations, thus reducing the flow noise that interferes with ASW measurement and improving the SNR. Using the meander metasurface array to locate sound through turbulence with a horn-shaped coupling demonstrated a 300% increase in the power of the measured ASW compared to a pinhole-shaped coupling. The microphones embedded in the meander for this case showed a 40 dB improvement in SNR at the frequencies of ASW reinforcement over the SNR of a microphone flush-mounted on the flow surface, near the array’s sensing aperture. Overall, these results demonstrate significant improvements in acoustic sensing that can be gained from a metamaterial array with optimized coupling methods.
Footnotes
Author note
A previous version of this paper was presented as Paper 2025-3362 at the AIAA Aviation Forum, Las Vegas, Nevada, USA, July 21-25, 2025. DOI: 10.2514/6.2025-3362.
Author contributions
All authors contributed to the conception, design, analysis, and writing of this work and approved the final manuscript.
Funding
The authors disclosed receipt of the following financial support for the research, authorship, and/or publication of this article: The authors acknowledge support from the Office of Naval Research (Grant N00014-21-1-2500) and the Defence Science and Technology Laboratory (Dstl) (Grant DSTLXR1000154754).
Declaration of conflicting interests
The authors declared no potential conflicts of interest with respect to the research, authorship, and/or publication of this article.