
Abstract
The aeroacoustic impact of ground proximity on an eVTOL propeller in hover and edgewise flight is examined using a multi-fidelity framework. Delayed-Detached Eddy Simulations (DDES) in OpenFOAM, coupled with PSU-WOPWOP, for high-fidelity acoustic predictions, and CDI-CHARM, a free-vortex panel-method code, as a lower fidelity approach. Extensive validation of the numerical simulations against experiments was performed. Performance metrics and flow-field analyses were examined prior to conducting the acoustic analysis. In-ground-effect (IGE) conditions, here defined as rotor operation within a few radii of a rigid ground plane, modify wake dynamics and alter tonal and overall sound levels, producing around
Keywords
Introduction
Urban Air Mobility (UAM) facilitates a new era of transportation that alleviates urban congestion and reduces travel times by integrating low-altitude flight into city infrastructure. Central to this vision are electric Vertical Takeoff and Landing (eVTOL) aircraft, advanced vehicles designed for safe, efficient operation in dense urban environments. Powered by electric propulsion, typically via Distributed Electric Propulsion (DEP) systems, eVTOLs offer vertical lift, quiet operation, and zero in-flight emissions. They are intended for diverse missions, including passenger transport, cargo delivery, and emergency response, enabling point-to-point connectivity through strategically located vertiports, such as rooftops of parking lots.
UAM operations occur within the atmospheric boundary layer, where environmental factors such as turbulence, gusts, and ground-wake interactions introduce complex aerodynamic challenges. 1 These non-uniform flow conditions, intensified by dense urban settings, lead to unsteady aerodynamic loading on propeller blades, contributing significantly to noise generation. By addressing these challenges, UAM has the potential to significantly enhance urban mobility, improve quality of life, and reduce the environmental footprint of transportation systems. 2
Ground-effect
When operating very close to the ground, rotors experience significant aerodynamic interactions known as “ground-effects”. 3 The presence of ground-effect directly affects flight stability and increases the risk of accidents on low-altitude maneuvers, such as takeoff and landing procedures. 4 Noise levels are also amplified by these aerodynamic pertubations and the ground reflections. Therefore, aeroacoustics analysis in take-off and landing situations is crucial.
The aerodynamic impact of ground effect for single-rotor helicopters has been extensively studied, and analytical and empirical models have been developed to obtain quick estimates.5–7 In 1937, Betz provided a theoretical estimate of the influence of the ground on the power of a propeller operating at constant thrust. 8 Later, a methodology considered vortex theory and the method of images to predict rotor thrust under ground-effect condition. 9 Finally, in 1955, Cheeseman and Bennett sought to simplify the complex vortex interaction with a ground plane using momentum theory and the method of images. 10 Although valid for a distance greater than half radius and limited by not considering viscosity or boundary layer effects, their results fitted well to helicopter flight test data. 10 Other authors have provided empirical expressions for the rotor thrust increment in ground-effect for large 11 and small UAV helicopters. 12
The ground has a strong influence on the induced wake, and on the performance of every type of rotor. This influence has been discussed in several works, from full-scale aircraft, 13 to small-scale isolated rotors.7,14 While the main focus of these studies is on generalizing results for full-size rotors, small propellers have been observed to behave fundamentally differently. 15 This motivates us to conduct numerical simulations on drone-sized propellers under ground-effect condition.
The primary parameter through which ground-effect impacts rotorcraft is rotor thrust, typically measured by the ratio of rotor thrust in and out of ground-effect condition. Extensive research has been conducted on the single-rotor ground-effect, including modeling, 10 computational fluid dynamics simulations,14,16 and experimental flow visualization, 7 which have validated the reliability of thrust ratio models. However, these studies do not cover aeroacoustics predictions of rotorcraft during takeoff, landing, and low-altitude flight.
The fountain effect generally refers to the phenomenon where airflow from the rotor collides with the ground, forming a stagnation region where the airflow has nowhere to go, except to rise back to the rotor. A large amount of turbulence is generated by the redirection of the flow after it hits the ground. Simulations and experiments17–19 using different propeller blades, airfoil shapes, and pitch angles have demonstrated the existence of fountain flow.
When rotors operate in ground-effect, their thrust coefficient is higher with respect to the baseline for a fixed amount of power. In contrast, the power coefficient decreases for a given thrust coefficient. Also, the ground has an effect on the wake of the lifting rotor, modifying its natural development. The wake direction changes from vertical (downwash) to horizontal (outwash) due to the ground-effect, and the resulting flow field has time-averaged characteristics similar to those of a wall-impinging jet. 20 In addition, a computational study found that the tip vortices expand along the ground plane radially as the propeller moves further within ground-effect conditions, resulting in aperiodic behaviour and instabilities. 16
Aerodynamic noise prediction tools
Accurately modeling rotor/wake/fuselage interactions remains a critical challenge in rotorcraft design due to their significant influence on performance, vibration, and handling. As rotorcraft configurations evolve, understanding these complex aerodynamics, such as rotor inflow distortion from the fuselage, unsteady fuselage pressures, and wake effects on other lifting surfaces, is essential. Designers increasingly depend on comprehensive computational tools such as CAMRAD, 21 RCAS, 22 and CHARM 23 to predict these interactional effects under various flight conditions using blade element theory, lifting-line aerodynamics, and structural dynamics.
Among these, CHARM stands out for its advanced simulation capabilities. It combines fast vortex and panel methods to model complex interactional aerodynamics with high fidelity and efficiency. The free vortex method captures detailed rotor wake dynamics, while fast multipole techniques reduce the computational burden of N-body vortex interactions through hierarchical clustering. Simultaneously, the panel method simulates fuselage and lifting surface flows by solving boundary conditions with surface singularities. This integration allows CHARM to efficiently model wake distortion, inflow changes, and fuselage pressure effects, crucial for optimizing performance and informing real-time operational assessments in modern rotorcraft designs. 24
A previous work utilized CHARM to obtain blade element parameters to predict broadband noise from a full-scale Joby Aviation propeller using self-noise models. 25 These results were validated against experimental data obtained at the NASA NFAC 40 × 80 ft wind tunnel. 26
Joby Aviation also used NASA OVERFLOW to perform Delayed Detached Eddy Simulations (DDES), capturing near-field unsteadiness with high fidelity. Full-scale flight test data from the Joby S4 were analyzed using DDES and Vold-Kalman filtering to isolate overlapping rotor acoustic signatures.27–29
Subsequent computational aeroacoustic studies compared predictions with experimental data from NASA NFAC 40 × 80 ft wind tunnel,26,30 revealing accurate tonal noise and performance estimates but challenges in predicting high-frequency broadband noise. 31 Cadence Design Systems, in collaboration with Joby Aviation, performed GPU-accelerated Large Eddy Simulations (LES), confirming the importance of accurately resolving laminar-to-turbulent transition regions. 32 These simulations localized noise sources to transition points and trailing edges, linking them to turbulent boundary layer trailing edge noise. In edgewise flight, azimuthal variation in wall shear stress resulted in laminar detached flow on the retreating blade, and transition flow on the advancing side. These contributed to elevated broadband noise. Blade pitch increases further amplified broadband noise above 1 kHz, a trend well captured by LES.
Once, the flow field has been resolved, an acoustic solver is utilized to calculate pressure signal at the far-field observer through a method such as the Ffowcs Williams Hawkings (FW-H). The acoustic solver PSU-WOPWOP implements Farassat 1A Formulation,33,34 decomposing pressure fluctuations into thickness and loading noise. It relies on two file types: patch files for surface geometry and normals, and functional files containing flow variables. PSU-WOPWOP can handle periodic, aperiodic, or constant surface data.
A Python-based converter was developed to link OpenFOAM-generated VTK surface files with required input format for PSU-WOPWOP. This converter supports both stationary permeable and rotating impermeable surfaces and decouples the acoustic post-processing from the CFD simulations. Unlike earlier OpenFOAM-based FW-H implementations that demanded excessive memory and real-time calculations, this tool allows reusable CFD data and noise predictions at arbitrary observer locations.
Surface selection for acoustic integration remains a debated issue. Quadrupole contributions are often negligible, and permeable surface predictions are sensitive to surface placement. While larger surfaces capture more noise sources, they rely on coarser mesh resolution and suffer from inaccuracies in pressure gradients. A review from the early 2000s examined the trade-offs in acoustic surface formulations stemming from Lighthill’s analogy. 35
Recent studies using OpenFOAM,36–38 PowerFLOW,39,40 and NASA OVERFLOW 41 highlight the advantages of permeable surfaces for capturing wake-induced noise, while noting the need for proper end-cap treatment or quadrupole-term correction. Others, however, demonstrate that for specific Reynolds numbers and configurations, impermeable surfaces yield predictions in good agreement with experiments, reducing implementation complexity. 42 The issues associated with the permeable surface, particularly as vortices cross it, have been noted in the literature, although the study employed a relatively short surface. 41
Ground-effect noise modeling
Despite these advancements, noise prediction near the ground remains particularly challenging due to unsteady flow interactions, recirculating vortices, and proximity to reflective surfaces typical of urban environments.
Accurately predicting propeller noise in In-Ground Effect (IGE) remains one of the most complex problems in rotorcraft aeroacoustics due to the interplay between unsteady aerodynamics, ground proximity, and recirculating flow structures. These challenges are present in urban environments, where the propeller may operate near reflective surfaces, such as building walls and corners, or rooftops.
One of the primary difficulties in modeling IGE noise is the formation of recirculation zones beneath and around the rotor disk, particularly for distributed electric propulsion (DEP) configurations in eVTOL aircraft. Experiments conducted in static anechoic chambers have demonstrated that as the recirculated flow develops, both thrust and tonal noise levels increase significantly. 43 The ingestion of recirculating wake structures leads to blade loading fluctuation, which impacts performance and loading noise by adding higher harmonics components.
Numerical simulations that account for the wind-tunnel walls, such as those performed with PowerFLOW, have shown better agreement with experimental noise spectra in IGE conditions. 44 This study revealed that the leading-edge interaction with recirculated vorticies is a dominant noise generation mechanism in hover, when operating under confined environments. However, the comparison between numerical and experimental results showed a discrepancy of around 5 dBa/Hz for broadband noise, suggesting that further improvements in turbulence modeling and boundary treatment is necessary.
The acoustic behavior of a hovering two-rotor system operating in close proximity to the ground at one and half-diameter clearance has been investigated. 45 Aerodynamic loads accounting for rotor-rotor and rotor-ground interactions were obtained from AcuSolve CFD simulations, while non-interacting loads were generated using the Rensselaer Multicopter Analysis Code (RMAC) for comparison. The rotor surface was utilized as an impermeable acoustic surface and the Method of Images (MOI) was utilized to model the ground-reflections from the ground.
The study found that aerodynamic interactions substantially increased high-frequency noise, particularly at half-diameter clearance, where noise levels rose by over 40 dB compared to the non-interaction case. Ground reflections further elevated noise levels and enhanced high-frequency content, though their contribution remained smaller than that of aerodynamic interactions.
A recent study applied the Mercury CFD framework to simulate the aerodynamic performance of a rotor in both out-of-ground effect (OGE) and in-ground effect (IGE) conditions. 46 The simulations encompass both isolated and installed configurations using the HVAB rotor and the NASA ROBIN-Mod7 fuselage. The results demonstrate good agreement with prior experimental and Helios simulation data, particularly in thrust and torque coefficients. When operating near the ground, the rotor showed a clear increase in thrust in the inboard regions and a minor reduction at the tips. This resulted in a more uniform (flattened) thrust distribution along the blade span, explaining the observed ground-effect thrust gain. Importantly, the study also contrasts the effects of using viscous versus inviscid boundary conditions on the ground plane. When the ground was modeled as inviscid, hover-induced velocities near the surface were significantly higher, up to 50% more at certain radial positions, compared to the viscous case. These differences are critical for applications involving acoustics, as they influence the strength and directivity of ground-reflected waves.
Another recent study examined the effects of ground proximity on performance and aeroacoustics of NASA’s side-by-side UAM reference vehicle in hover.47,48 The MOI was also utilized with the impermeable acoustic surface to predict the ground reflections. Results indicate that overlapping rotors could reduce noise by 3 to 4 dBA, however, overlap configuration poses greater safety concerns close to the ground, due to elevated hazardousness factor.
This research investigates the acoustic impact of eVTOL propellers operating in ground effect using a multi-fidelity computational framework. High-fidelity Detached Eddy Simulations (DDES) are conducted in OpenFOAM 49 and coupled with Ffowcs-Williams and Hawkings (FW-H) acoustics via PSU-WOPWOP.33,34 Mid-fidelity predictions are performed using the CDI-CHARM toolset.23,24,50 The study evaluates noise characteristics in both hover and edgewise flight across varying ground proximities, relating flow-field modifications to far-field Sound Pressure Level (SPL) directivity, Pressure Spectral Density (PSD) comparisons, and Overall Sound Pressure Level (OASPL) analysis. The objectives are to provide guidance on optimal placement of permeable FW-H surfaces for accurate ground-effect modeling, to implement and validate the Method of Images (MOI) approach for estimating ground reflections not accounted for by the acoustic integral surface, and to assess the aerodynamic and acoustic impacts of ground proximity during hover and edgewise flight conditions.
Experimental setup
A set of experiments investigated different flight conditions, such as hover, edgewise, and tilted flight, at a fixed blade pitch (twist angle at 75% span) of
The 1/5th scaled version of the five-blade propeller designed by Joby Aviation prototype from 2017, as depicted in Figure 1, is manufactured and tested by Virginia Tech researchers. This scaled eVTOL propeller version has been made available for academic research purposes, and is designed for wind-tunnel experiments and has a diameter measuring 1/5 scale Joby aviation propeller.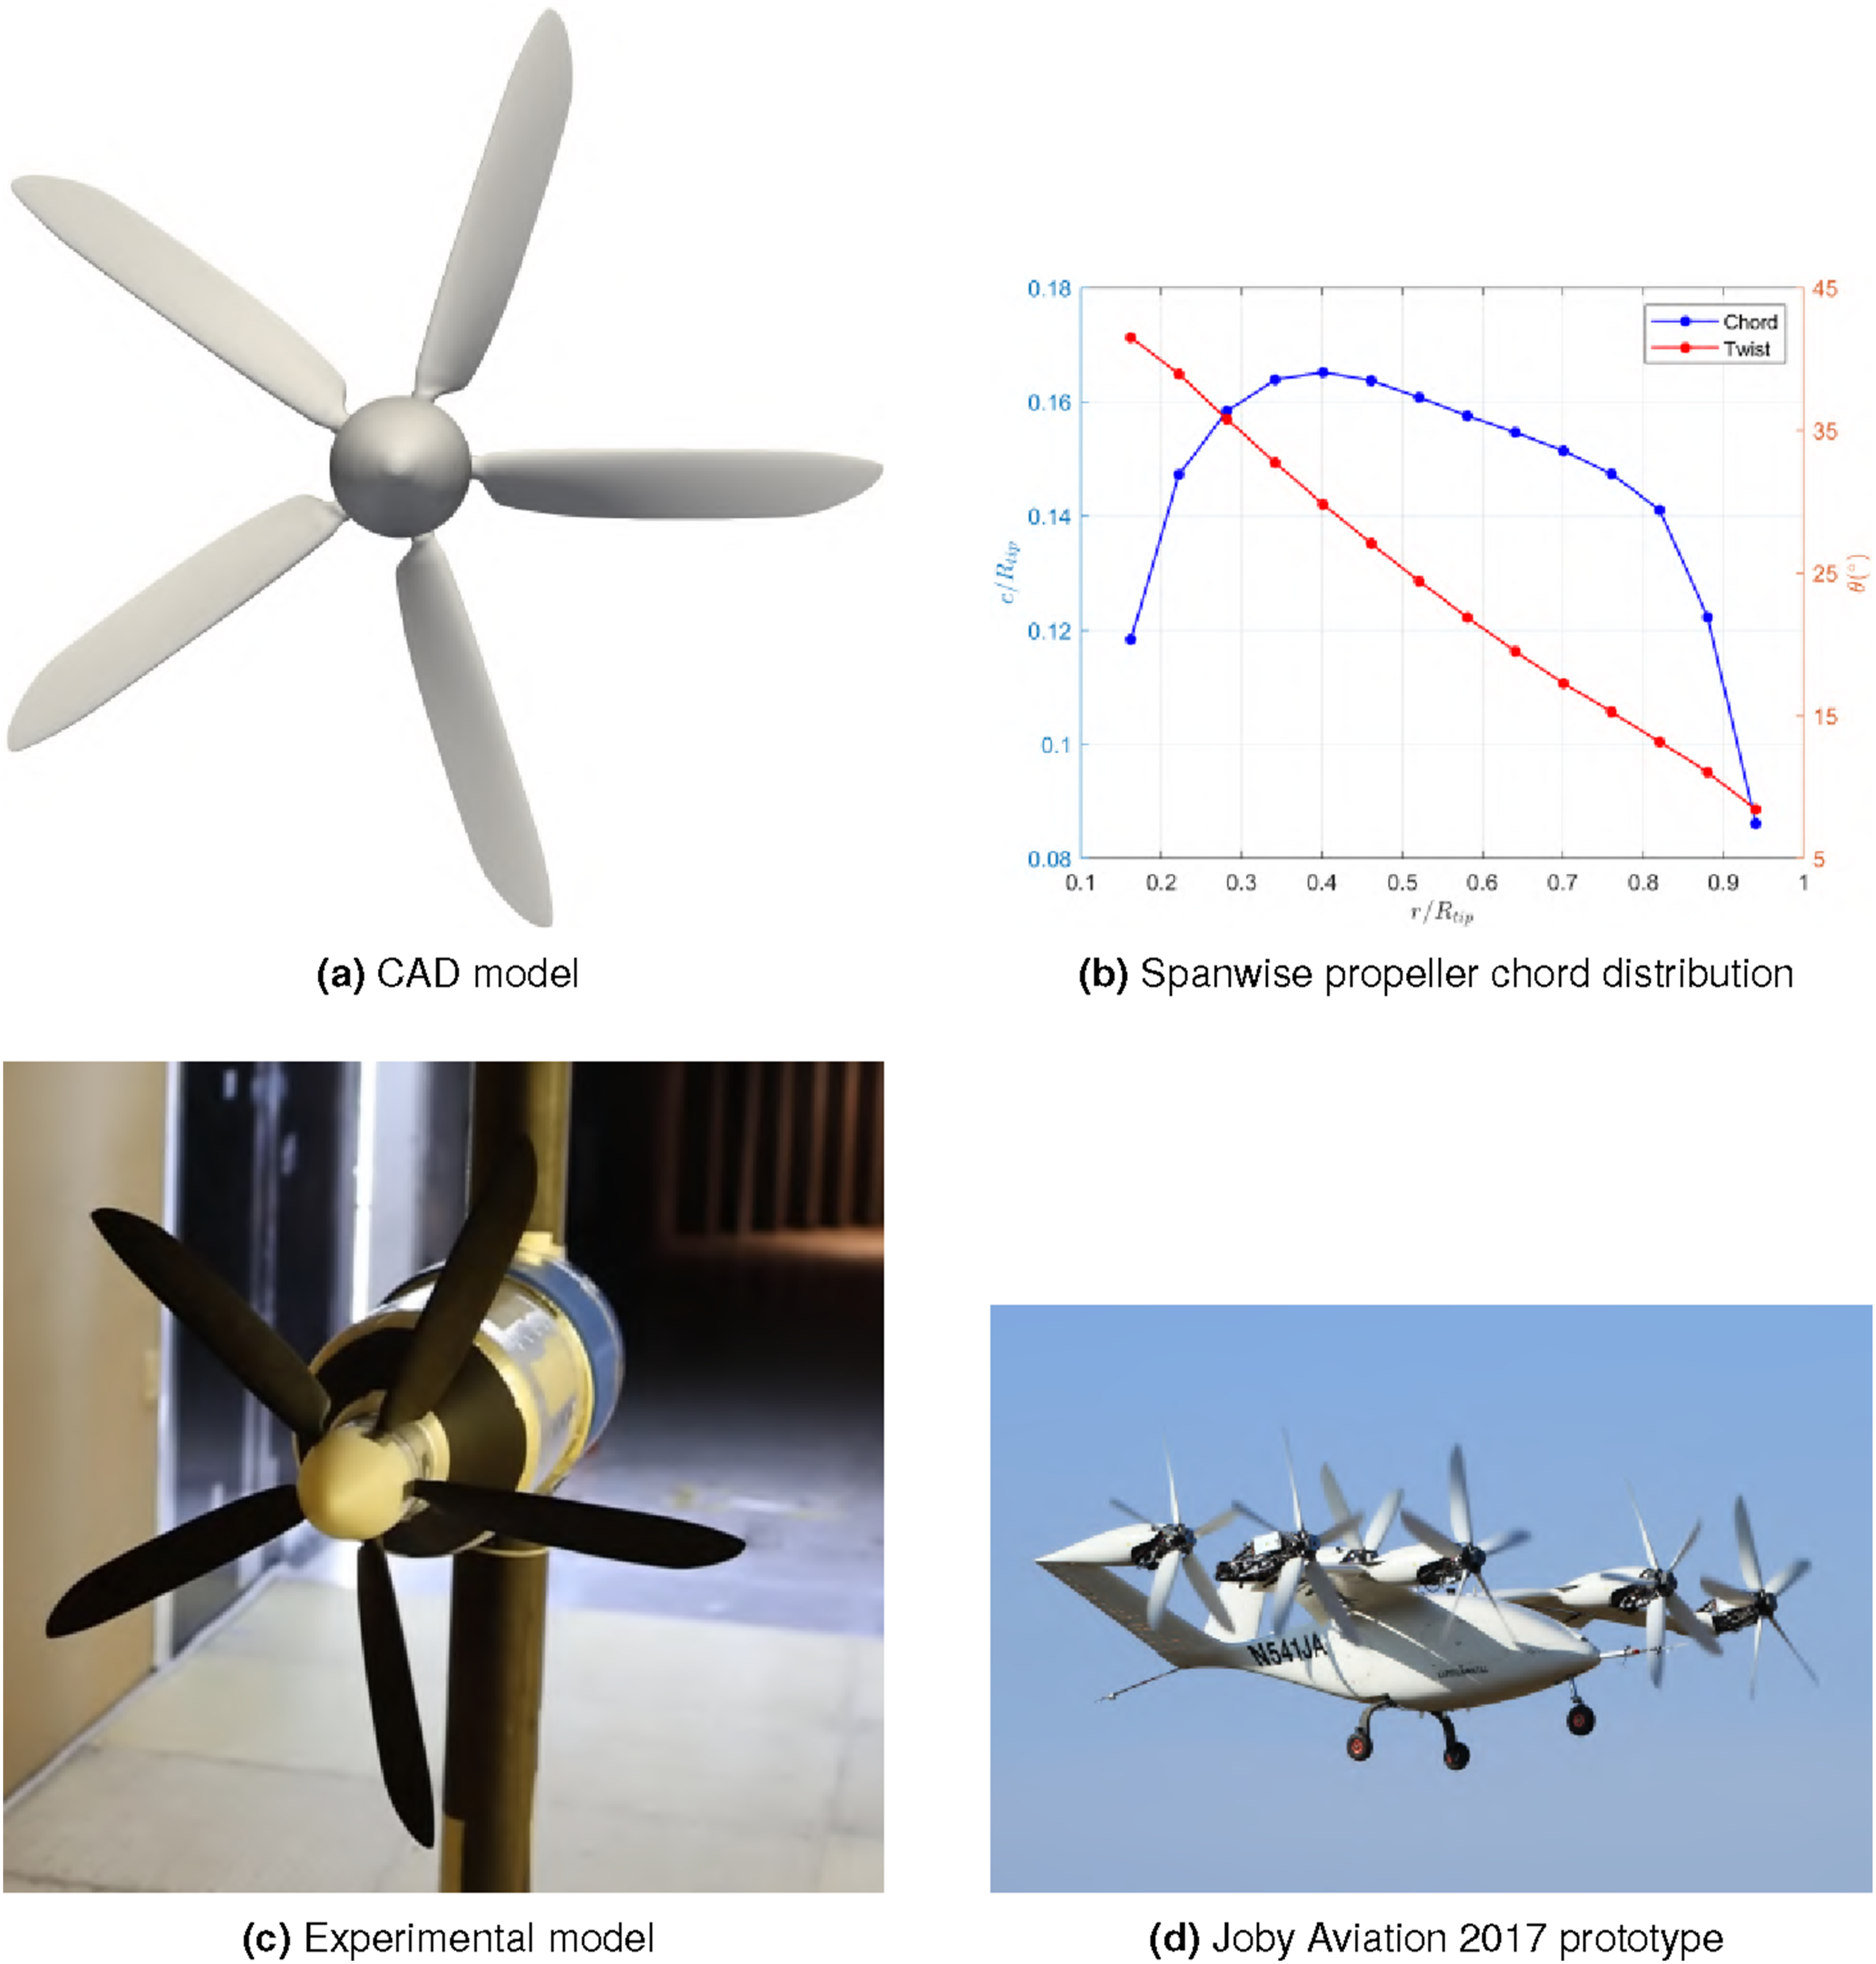
The numerical methods utilized here were previously validated 51 against experimental measurements conducted by NASA-ULI research partners at Virginia Tech University, where thrust and torque were measured using JR3, a 6-component load cell, and acoustics were measured using a 251-channel G.R.A.S. 40PH-S5 custom free-field microphone array, further details on the experimental setup are provided in Reference 52.
Numerical setup
Simulations were conducted using high-fidelity CFD, such as unsteady RANS and DES through OpenFOAM, an open-source CFD code, and the mid-fidelity free vortex/panel method code CDI CHARM. Far-field acoustics are obtained using Farassat 1A formulation of the FW-H equation through PSU-WOPWOP.
Two distinct configurations are considered. First, an isolated propeller case consists of the propeller placed around non-reflecting boundaries with a wake refinement zone below. This serves as a baseline for the hover and edgewise simulations. Furthermore, the ground is added to the simulation as a wall boundary placed below the propeller. The height of the ground with respect to the propeller is another variable to be analyzed.
The mid-fidelity simulations, which run much faster, were used to efficiently examine a broader range of RPMs and heights. The configuration with the propeller positioned 2R above the ground minimizes aerodynamic interference, making it well-suited for isolating ground reflection effects. At this height, rotor loads remain similar to those in hover, implying a limited influence of aerodynamic ground effects. This ensures that the primary propeller–ground interaction arises from acoustic wave reflection rather than aerodynamics, which is essential for a noise analysis comparing in- and out-of-ground-effect cases. Therefore, a height of 2R was chosen for the high-fidelity studies.
This setup matches that of the scaled Joby 2017 prototype during takeoff and landing, where propellers were positioned about two radii above the ground, and has been previously employed to investigate the influence of ground reflections. 53
Mid-fidelity approach
Mid-fidelity simulations are performed using CHARM, an efficient code that couples Blade Element Momentum Theory (BEMT) with a potential-flow panel method, which is then linked to a free-vortex wake model that ages the vortices and develops the flow in a rotating frame of reference. The BEMT formulation relies on sectional lift, drag, and pitching moment coefficients from airfoil tables, which can be obtained either from low-order airfoil solvers such as XFOIL or from two-dimensional RANS airfoil simulations.
CHARM is expected to provide reliable performance predictions for rotors operating at subsonic tip Mach numbers, and it can capture aspects of blade-wake interaction in full-vehicle simulations. For an isolated rotor, a fair comparison of global performance metrics is therefore anticipated. From an acoustic standpoint, the code employs an actuator-line approach: each blade is represented by a line with one node per spanwise element, at which the unsteady pressure is defined. This pressure distribution generates the loading noise, and may contain both steady and unsteady components if the pressure varies in time due to flow interactions. Thickness noise, which depends solely on the actual rotor geometry and rotational speed, is computed separately. These modeling assumptions limit the range of acoustic phenomena that CHARM can model; in particular, it cannot be expected to resolve all noise sources that a high-fidelity DDES simulation can. Nevertheless, CHARM can account for blade-wake interactions in the acoustic analysis at a significantly lower computational cost than high-fidelity CFD.
CHARM will be employed to analyze the propeller operating at different distances from the ground. Acoustic predictions are generated using the impermeable surface formulation in PSU-WOPWOP. To account for ground reflections, the Method of Images (MOI) is employed.45,47 This involves placing a mirrored propeller below the ground. The acoustic pressure for a given observer is the sum of the result for that propeller and the result for the mirrored propeller, see Figure 2(c). The experimental microphone setup is considered, excluding microphones positioned below the ground. For the remaining microphones, the reflected position is also accounted for, as illustrated in Figure 2. Microphone array and reflected mics (red dots) due to ground (black line indicates the propeller position).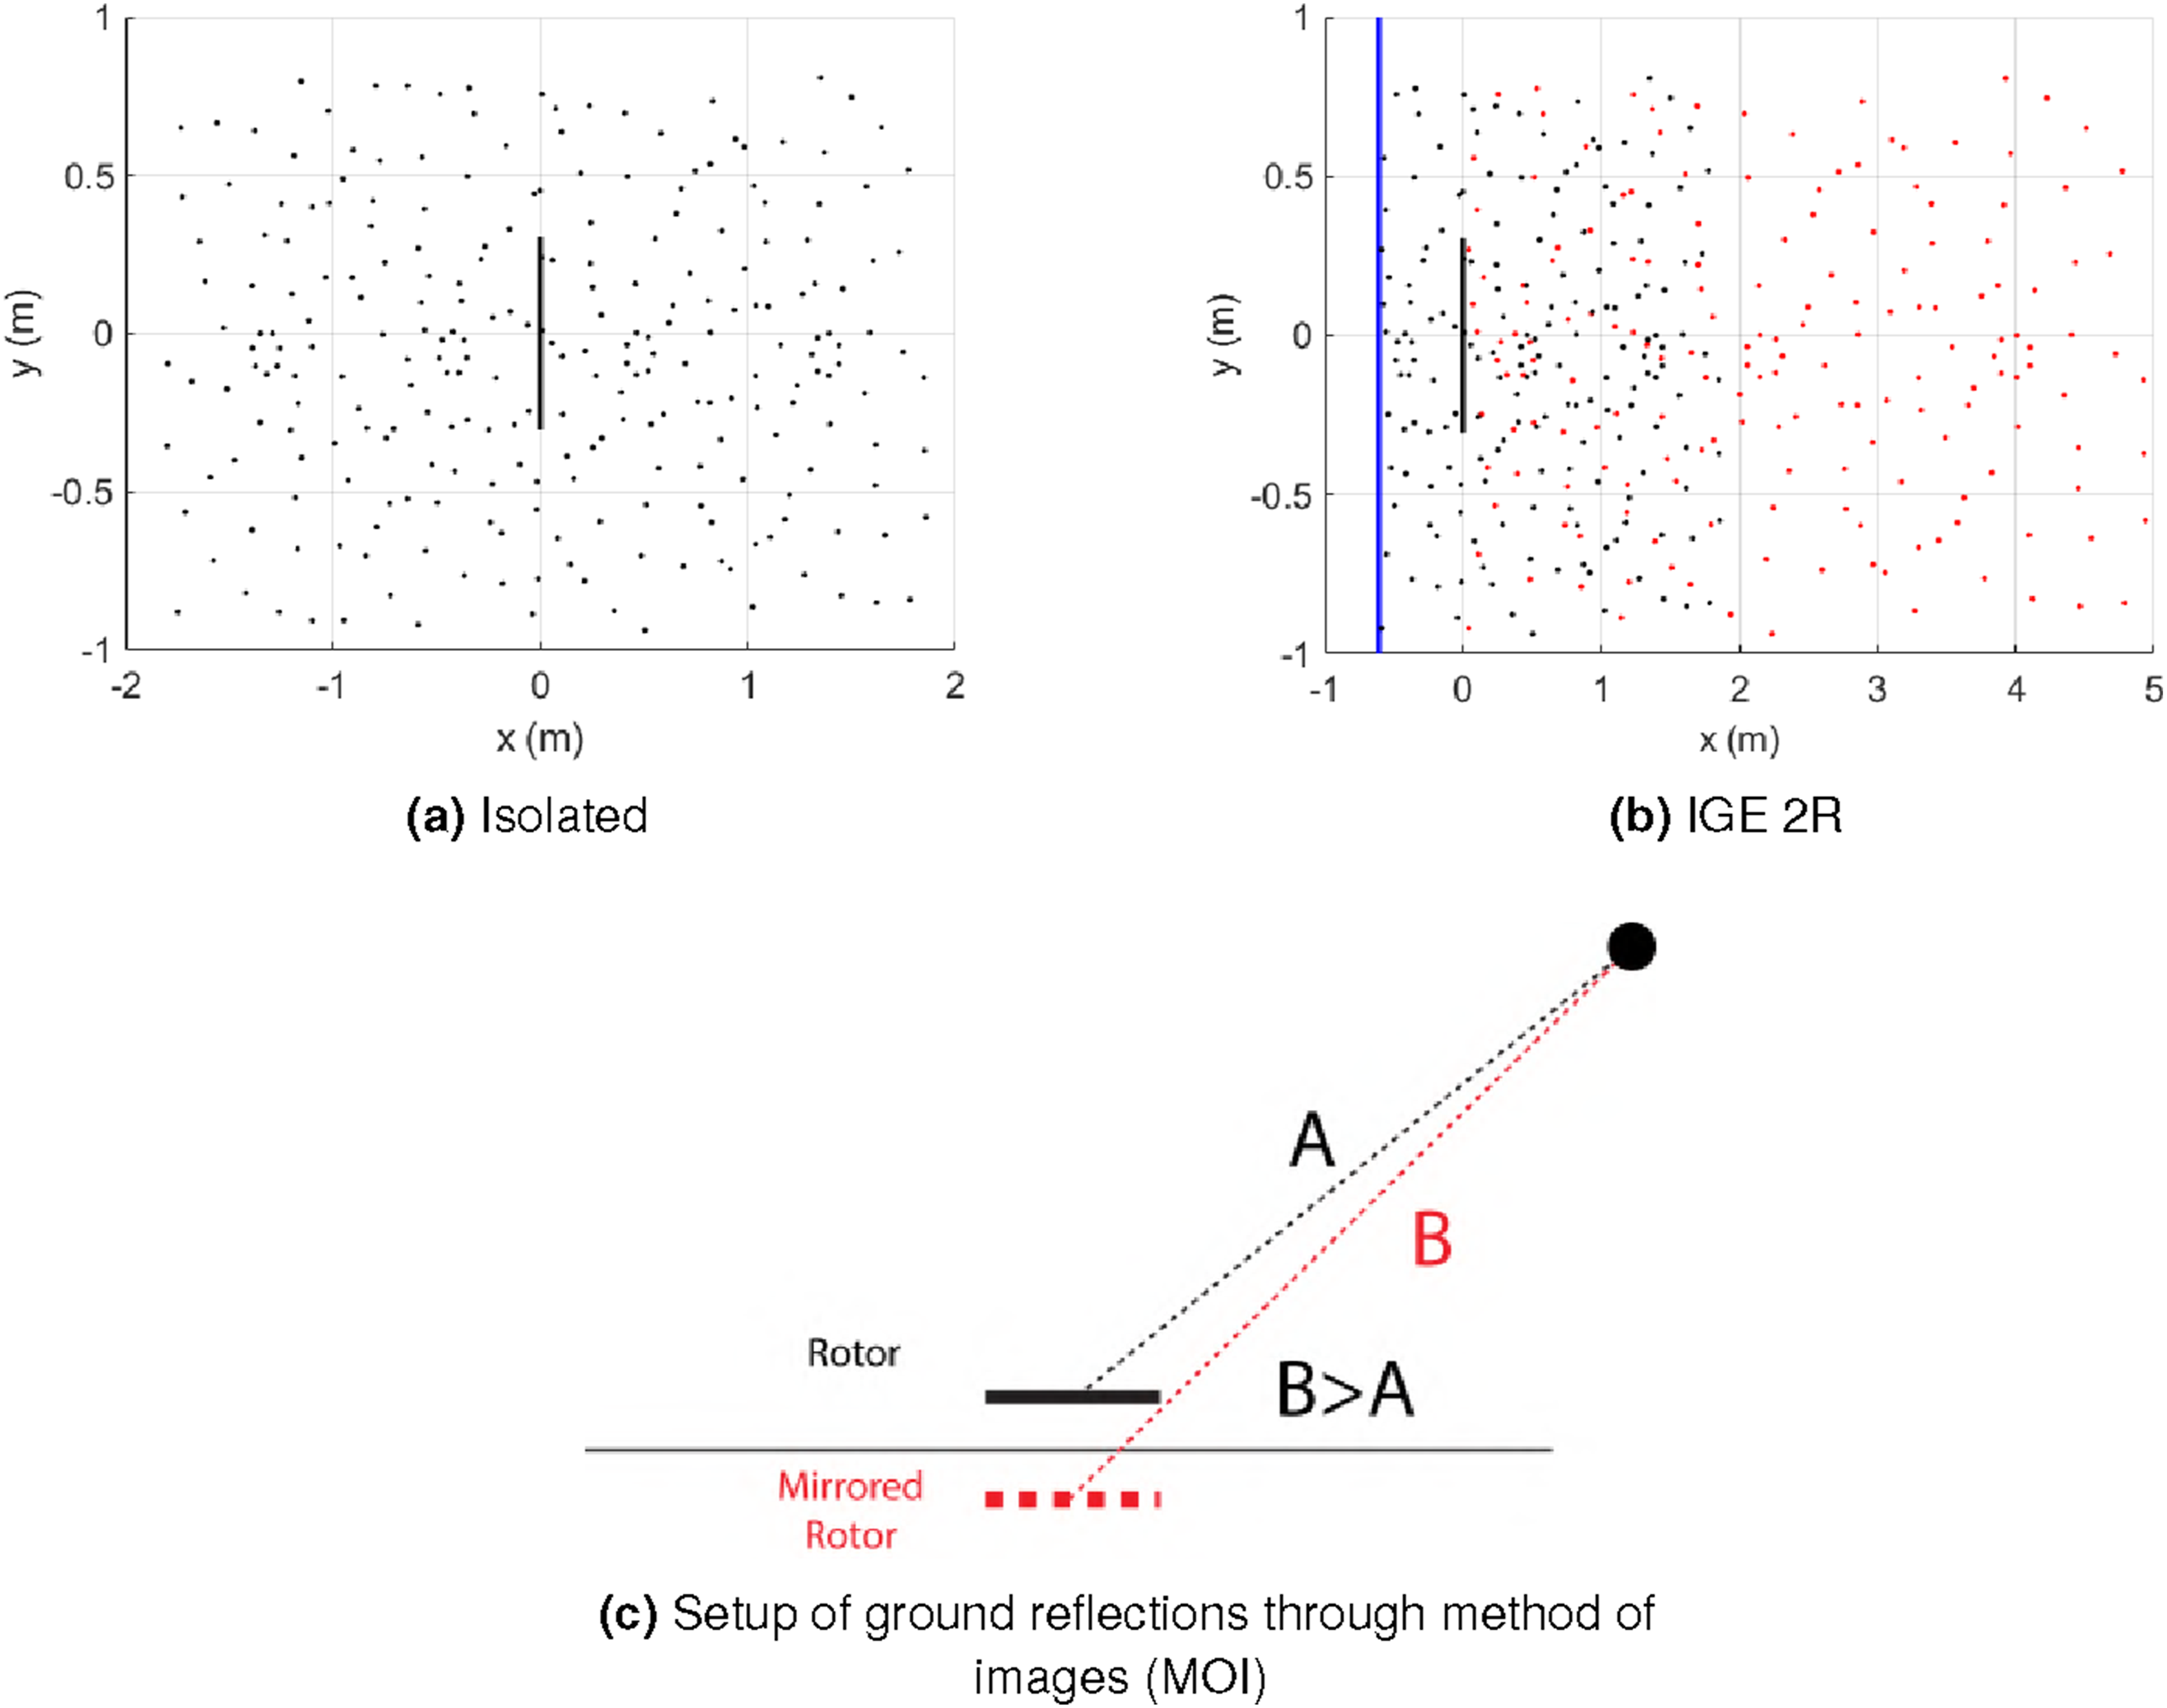
High-fidelity approach
This research group was initially successful in utilizing native OpenFOAM to conduct aeroacoustic studies for drone propellers, as demonstrated in earlier work. 38 The original simulation setup was later revisited and further developed in subsequent studies, 53 and was eventually applied to the same propeller examined here. 54 However, this CFD framework has been further refined in the current study. One of the main objectives is to consolidate this experience and establish a robust framework, incorporating the various modifications, successes, and failures encountered in grid generation, case setup, and acoustic post-processing.
The grid generation is carried out using OpenFOAM’s native meshing tool snappyHexMesh, combined with prism-layer blocks generated in Pointwise, a commercial grid generation software. The two meshes are coupled via an Arbitrary Mesh Interface (AMI) formulation, which enables a high-quality grid both on the blade region and in the background region around the rotor. The use of Pointwise for the prism layers allows a substantially coarser surface mesh (less points than snappyHexMesh only) that conforms more closely to the blade geometry, following methodologies similar to those employed in high-accuracy codes such as OVERFLOW. In addition, multiple points can now be placed along the trailing edge, improving performance prediction and reducing spurious pressure fluctuations that contaminate the acoustic solution, as observed in our previous work. 54
A consequence of this meshing strategy is that the present simulations are currently limited to modeling only the blades, without the fairing or hub, since including these components would significantly increase the complexity of the prism-layer topology. We intentionally opted for this simpler configuration to ensure a high-quality grid and avoid numerical issues associated with poor mesh resolution. However, some discrepancies with the experimental data are expected, particularly for quantities influenced by the hub and any support hardware needed for the wind tunnel tests.
The eVTOL propeller geometry, shown in Figure 1, is used, without incorporating any hub or fairing. The lack of the fairing on these numerical simulations is expected to affect the results, as the inflow profile could be modified by the fairing placed below the blades. The generation of additional vorticies of the downwash flow shearing with the fairing could be impactful for performance and acoustics. However, it is worth noting that hover and edgewise flight configurations would get different impact from the presence of the fairing.
The simulation domain assumes a cubic shape of edge length measuring Lateral and upwards views of eVTOL propeller mesh at different operating conditions.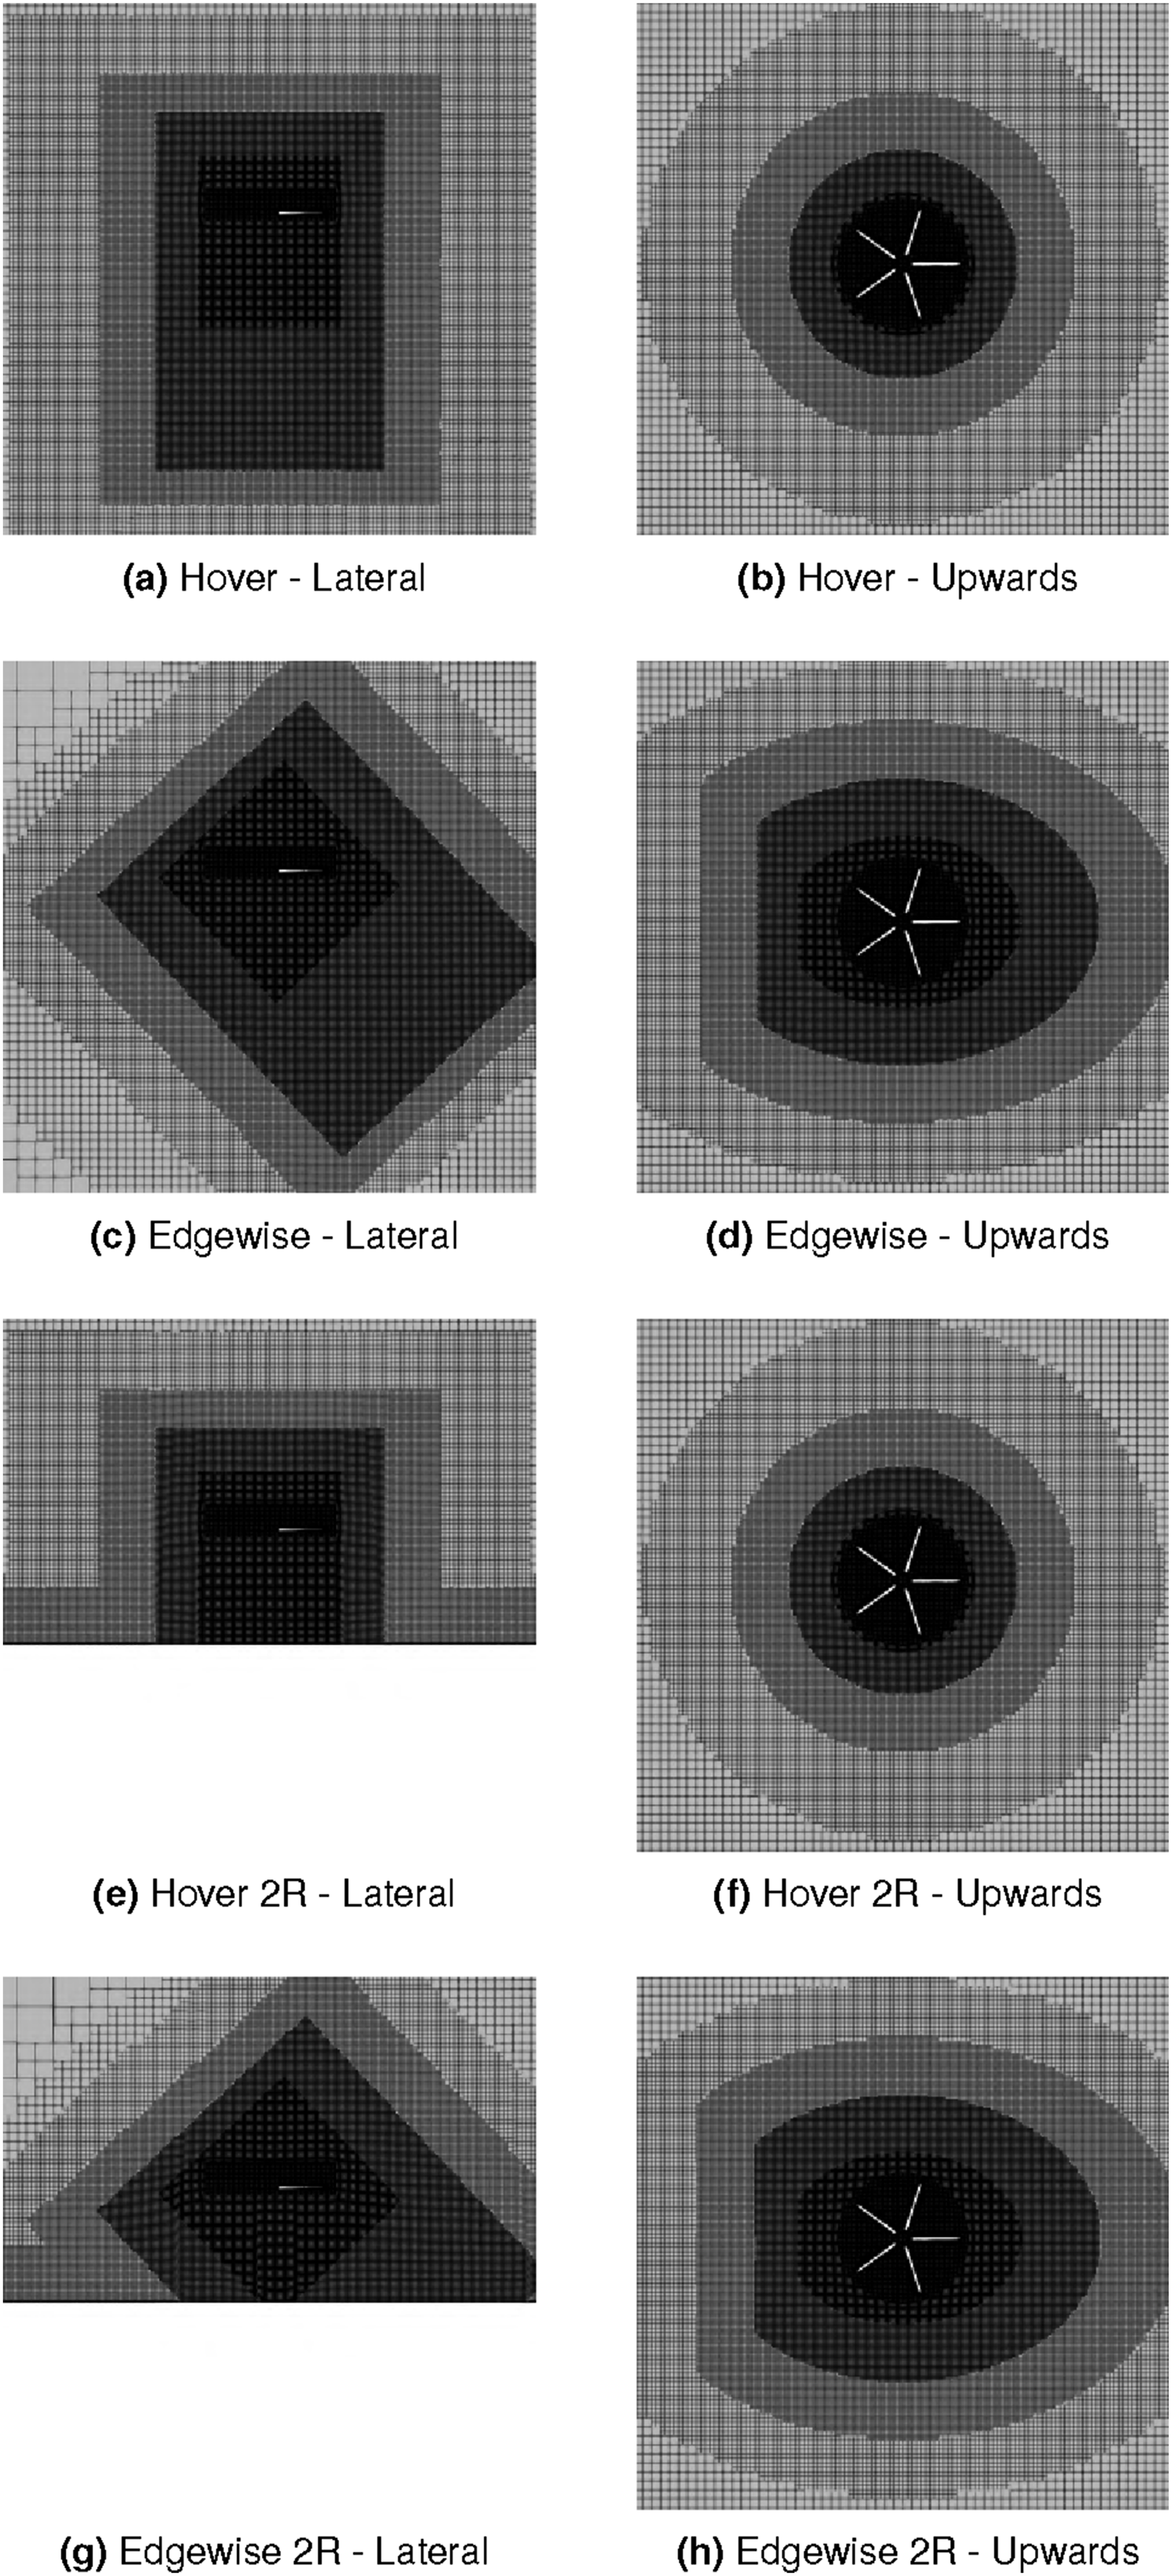
A cylindrical region near the blades is refined to a cell size of Mesh details near the eVTOL propeller.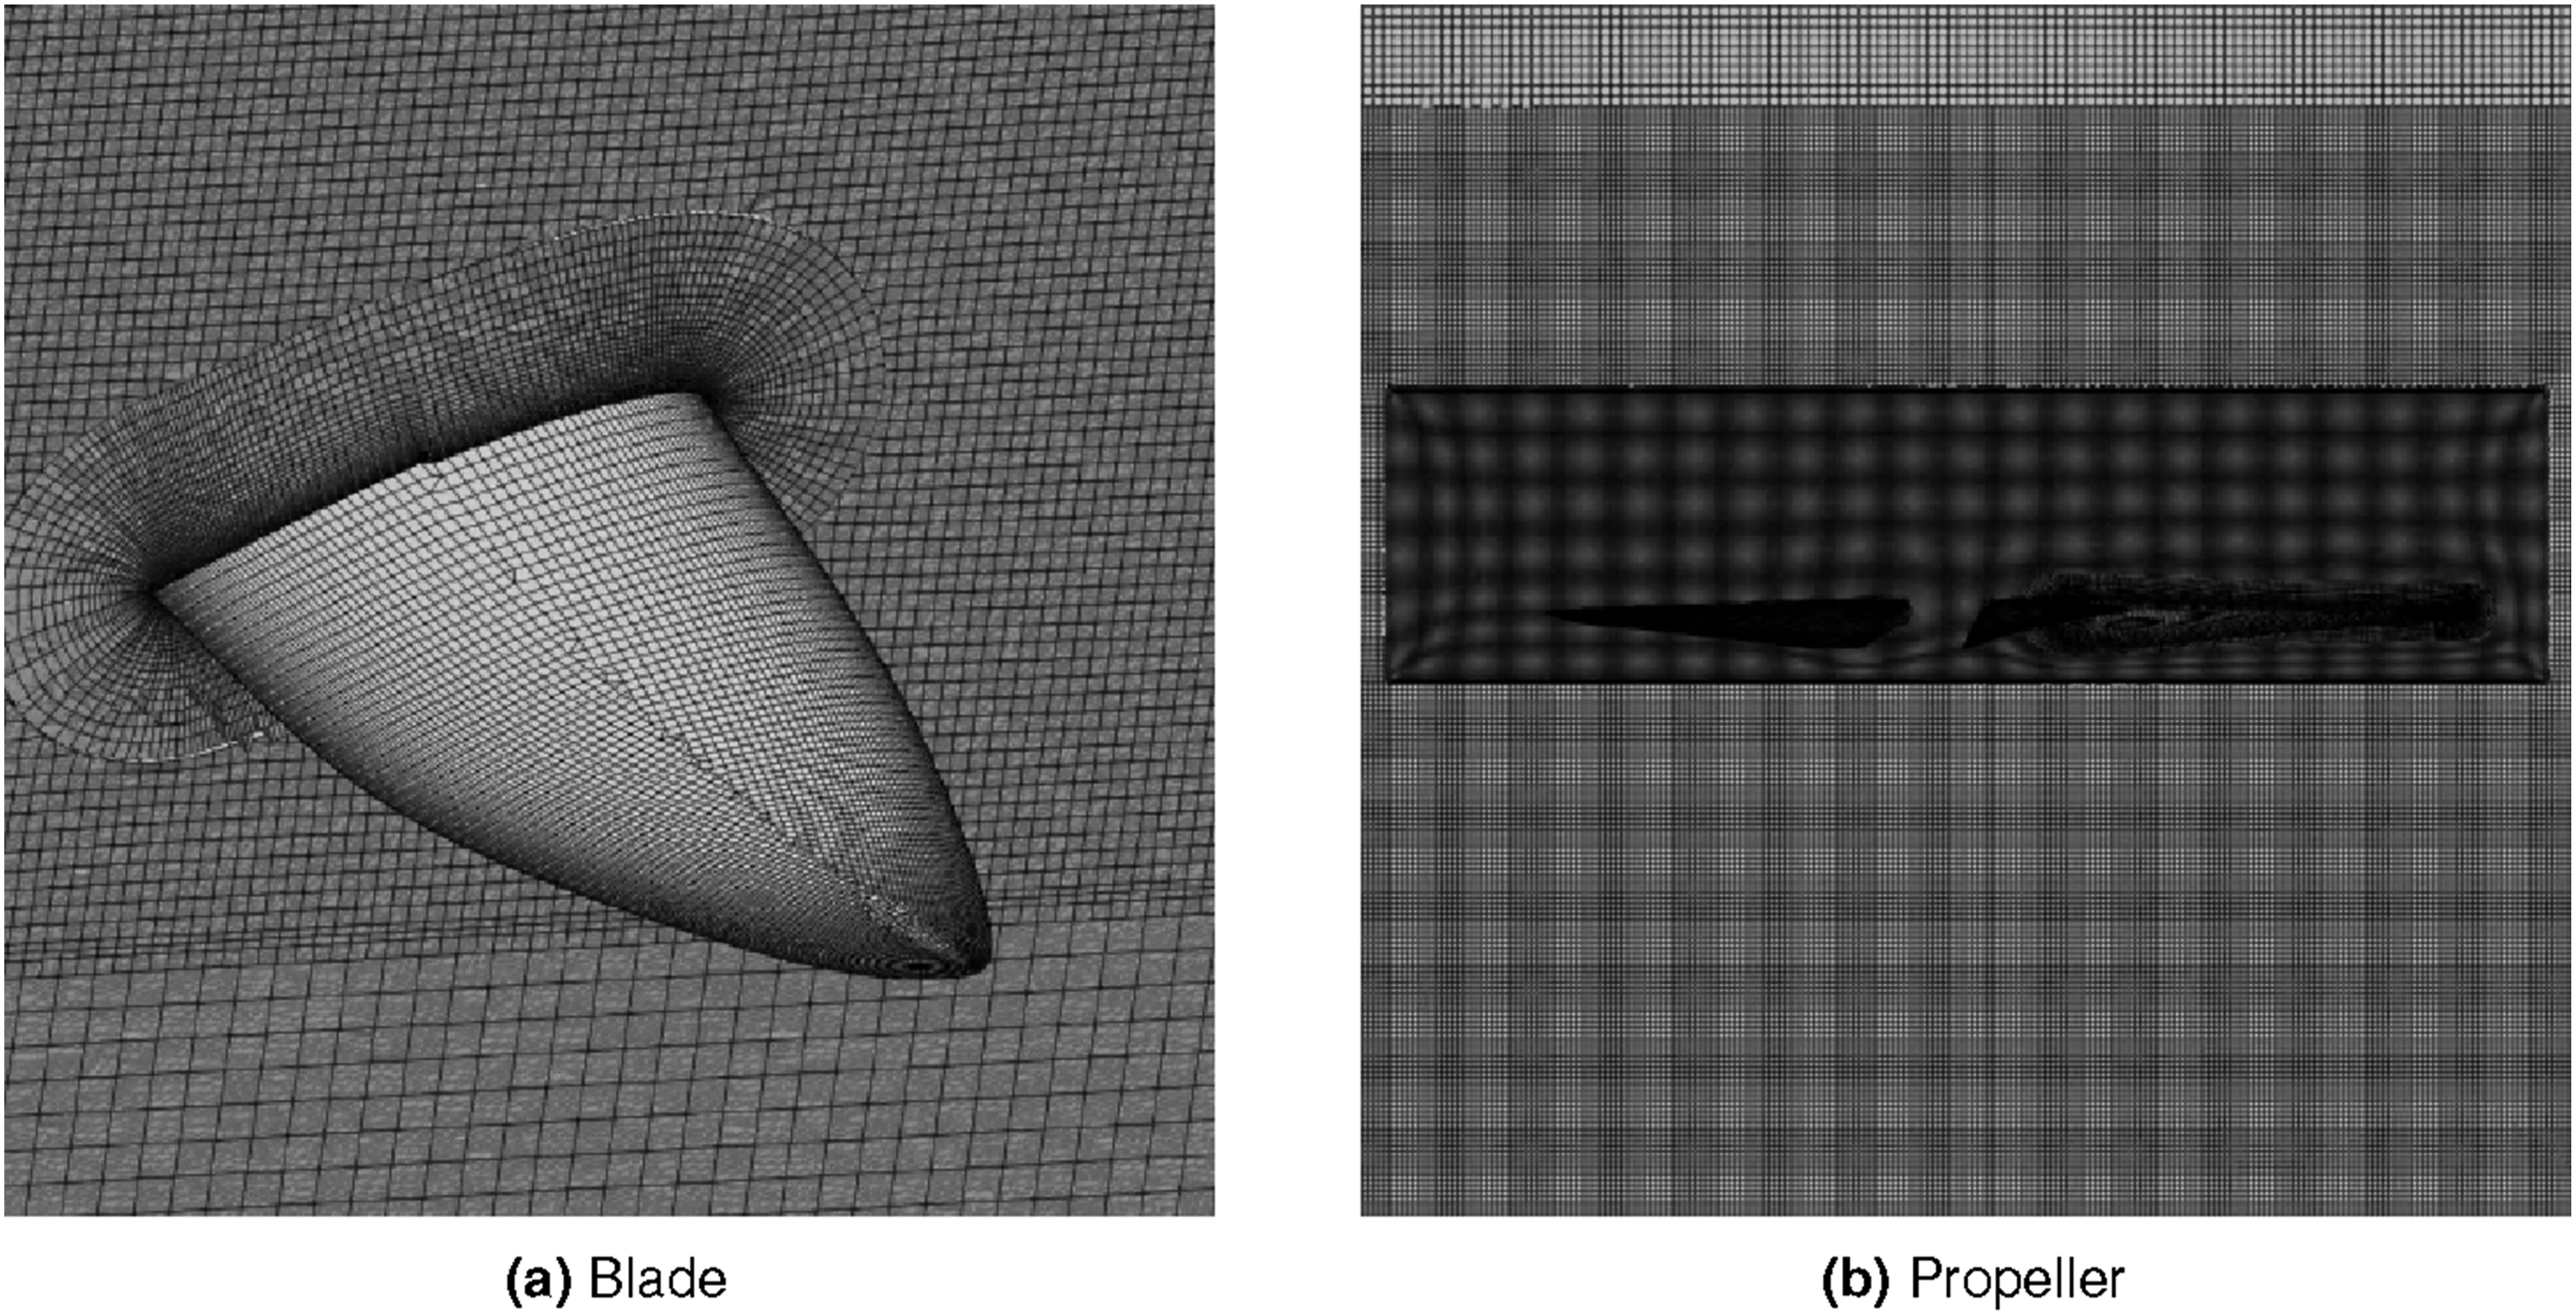
For the edgewise case, the refinement regions were rotated to align with the predicted wake direction given by the analytical skew-angle expression. The advance ratio is defined as
Figure 3 shows midspan slices for both lateral and upward views of these meshes. Additionally, Figure 5 illustrates the layer generation on the airfoil sections located at 70% and 50% span. These layers are responsible for enabling a smooth velocity profile transition from near-wall values of Airfoil layer mesh at the propeller surface.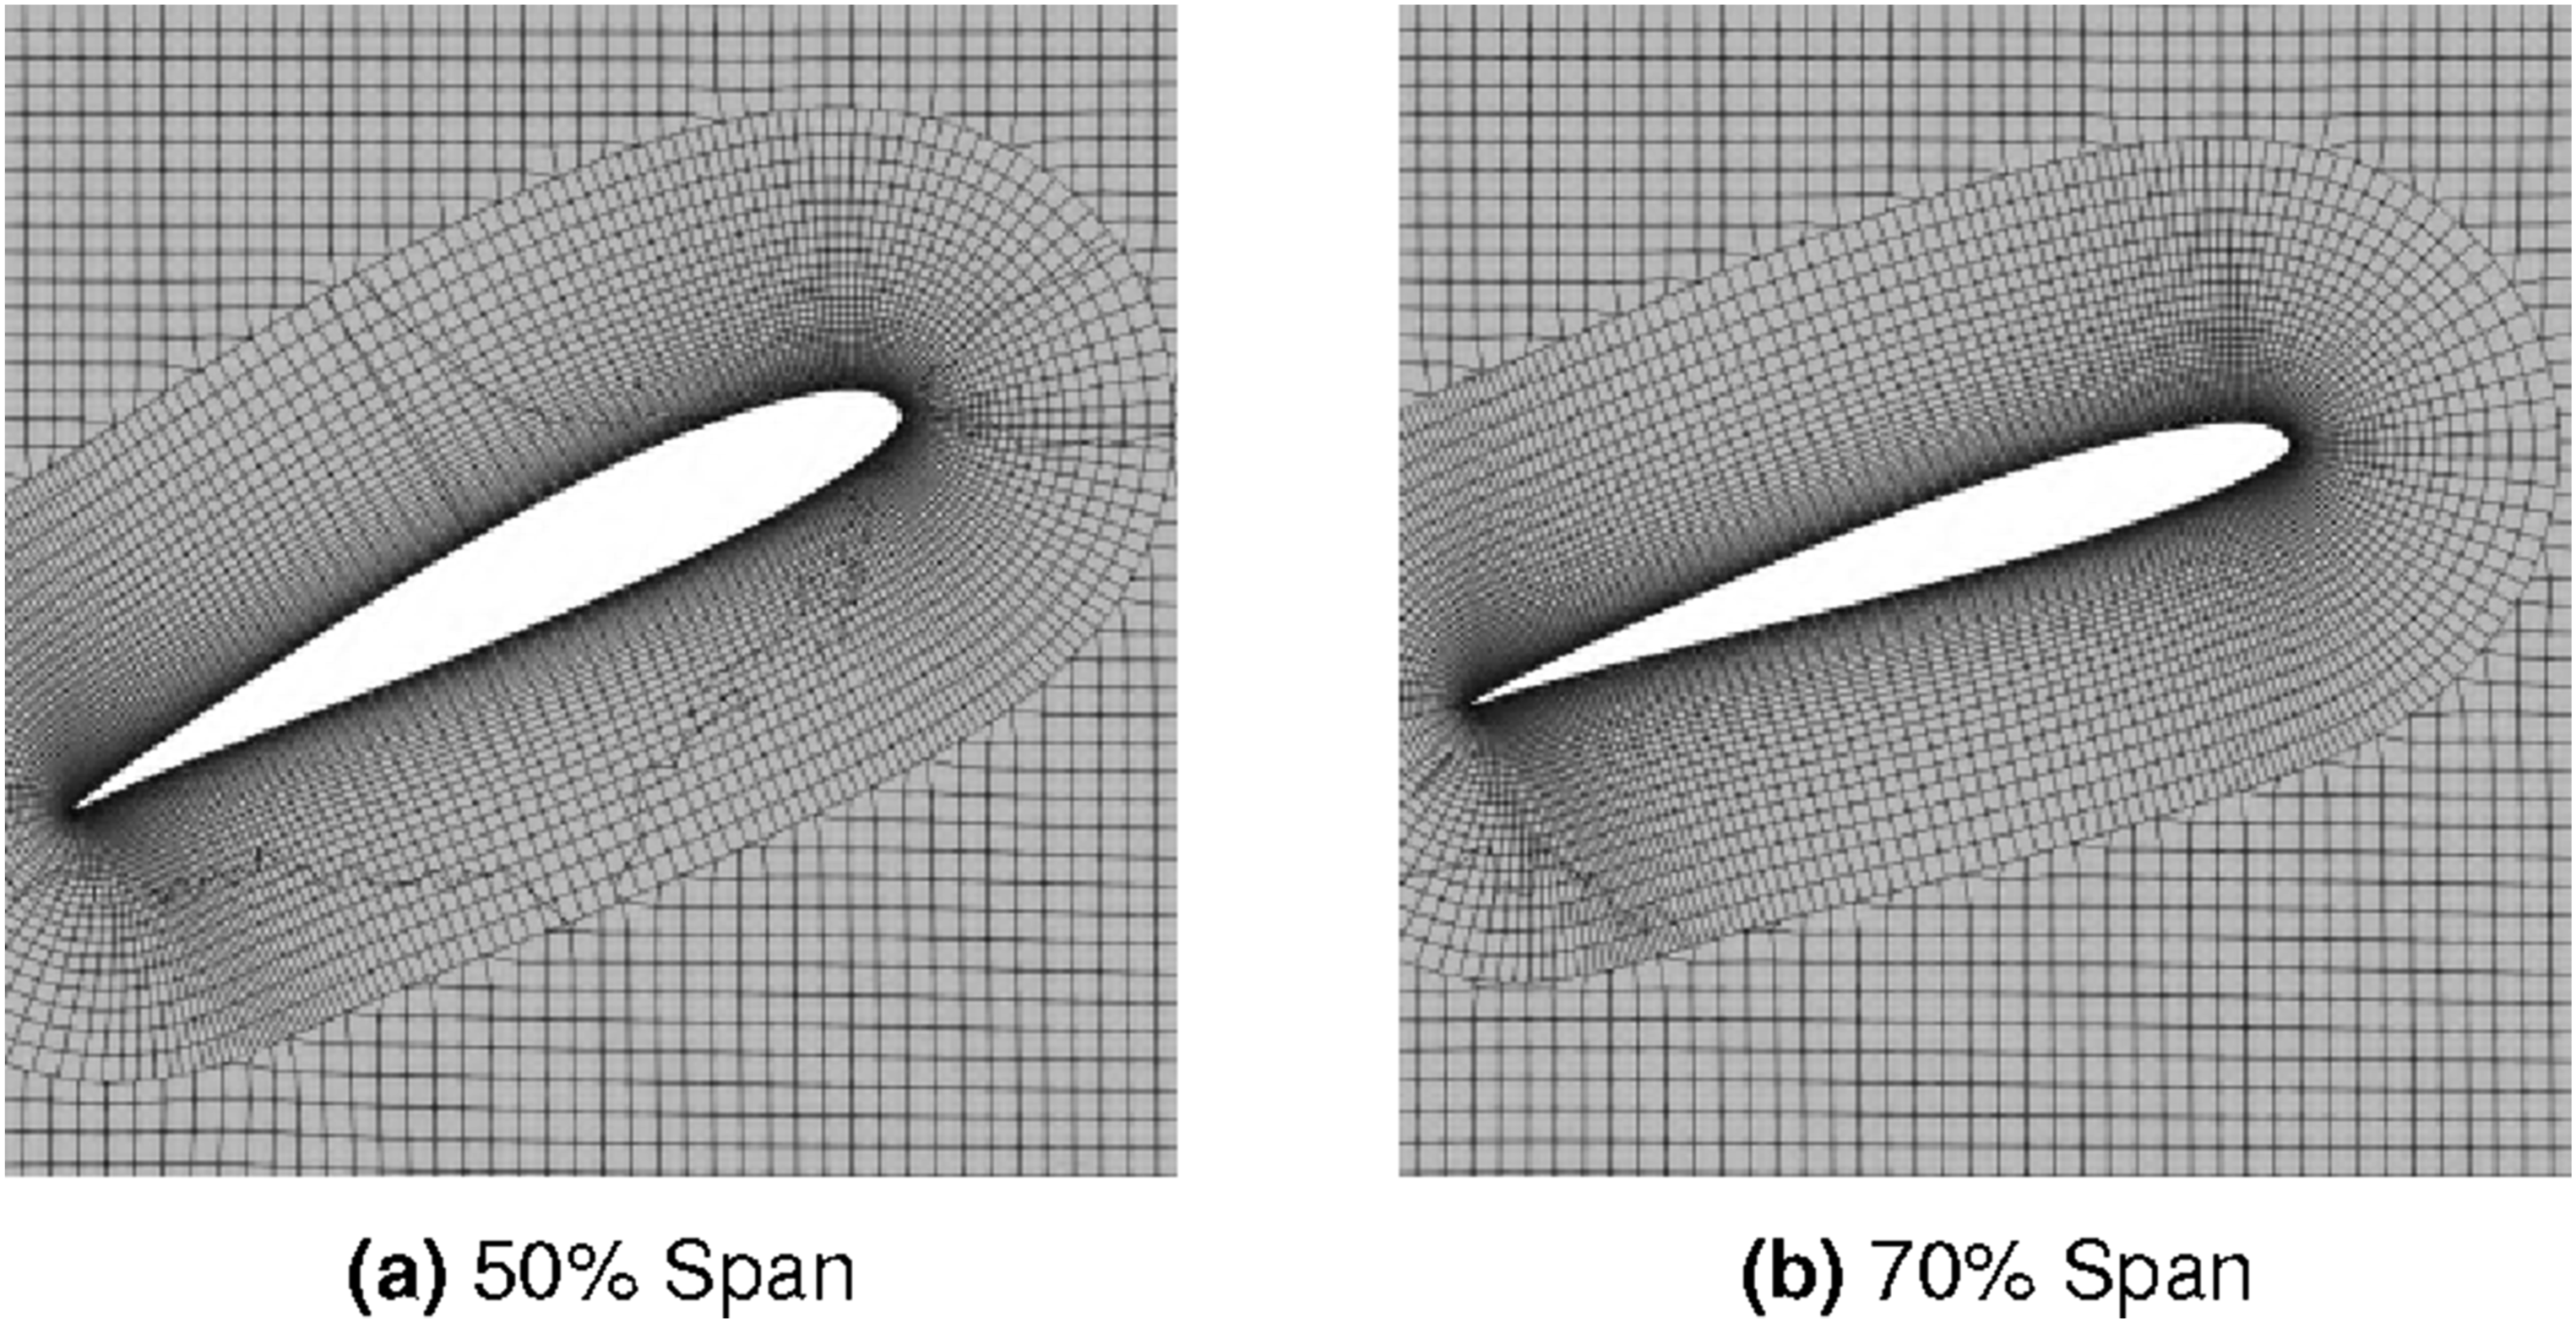
An unsteady compressible PIMPLE solver “rhoPimpleFoam” of OpenFOAM v2412 is employed. 49 The Spalart-Allmaras (SA) turbulence model with Low-Reynolds correction 55 is adopted in the current computational study to conduct a hybrid LES-URANS simulation known as Delayed Detached Eddy Simulation (DDES). The characteristic length scale for the turbulence filter on the LES region is calculated using the “maxDeltaxyz” function with a coefficient of 0.8.
Also, to prevent premature activation of LES within attached boundary layers, a shielding function is employed. However, the standard shielding formulation can fail on fine grids, leading to grid-induced separation, due to reduced wall shear stress predicted. To address this, the improved shielding function originally developed for the ZDES Mode 2 (2020) 56 is utilized. This enhanced formulation provides more robust boundary layer shielding while still enabling a rapid transition to LES in separated regions.
First, an unsteady RANS (URANS) solution is obtained using a first-order explicit Euler time-marching scheme. This serves as the initial condition for the DDES simulation, which then proceeds using a second-order backward temporal discretization. This approach helps accelerate the startup of the DDES solution. The solver considers the energy equations, employing the ideal gas law for the equation of state and determining viscosity using Sutherland’s law.
The Crank-Nicolson (CN) second-order time integration scheme is employed with a blending coefficient of 0.5, providing an equal balance between explicit and implicit schemes. For spatial discretization, a bounded second-order central differencing is used for gradient terms, while divergence terms are treated with a second-order central differencing scheme that transitions to first-order in regions with steep gradients to ensure numerical stability. Specifically for velocity, a hybrid approach is used. In RANS regions, a limited second-order central differencing scheme is applied, while in LES regions, a less diffusive second-order scheme enhanced with filtering is used to manage potential unboundedness and preserve accuracy. While this setup is not strictly optimal, it enables stable DDES simulations at a relatively large time step of 0.25° (
The propeller surface is treated as a wall with zero gradient pressure and temperature boundary conditions. A no-slip boundary condition with a moving wall velocity type is specified for the velocity so that RANS simulations near the wall could use the Spalding’s Law to model the boundary layer eddy viscosity with a specified
For the IGE case, a viscous wall boundary condition is imposed at the ground, and 10 prism layers are generated starting from a height of 1.5 mm with a growth ratio of 1.2. Above the prism layers, the mesh is refined with a uniform cell size of
The FW-H equation is solved using the Farassat 1A formulation via PSU-WOPWOP to capture far-field acoustics using both an impermeable surface, defined by the propeller, and permeable surfaces surrounding it. Each method presents its own challenges and advantages. However, their results should be in agreement. Similarly to CHARM, the MOI technique is utilized for high-fidelity simulations as well, to account for the wave reflected from the ground that happen outside of the range of the FW-H surfaces, as done in a previous referenced work. 48
Flow data on the FW-H surface are collected over 8 propeller rotations with a sampling rate of 50 kHz (
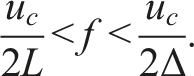
Considering the utilization of the second-order backward time scheme, the resolution of approximately

If the signal is divided into windowed blocks, the minimum resolvable frequency increases as the number of windows increases because the time duration of each window shortens. It is desired to utilize two windows of 3000 samples, thus, the minimum resolvable frequency corresponds to

The grid resolution within the FW-H surface region determines the grid cut-off frequency for this numerical analysis. Two FW-H surfaces are defined for the simulations, to be shown in Figures 6 and 7. The grid cut-off frequency is estimated using equation (3), where the speed of sound is taken as Snapshot of dilatation overlayed by vorticity from DDES simulations. Snapshot of dilatation overlayed by vorticity from ground-effect (2R) DDES simulations.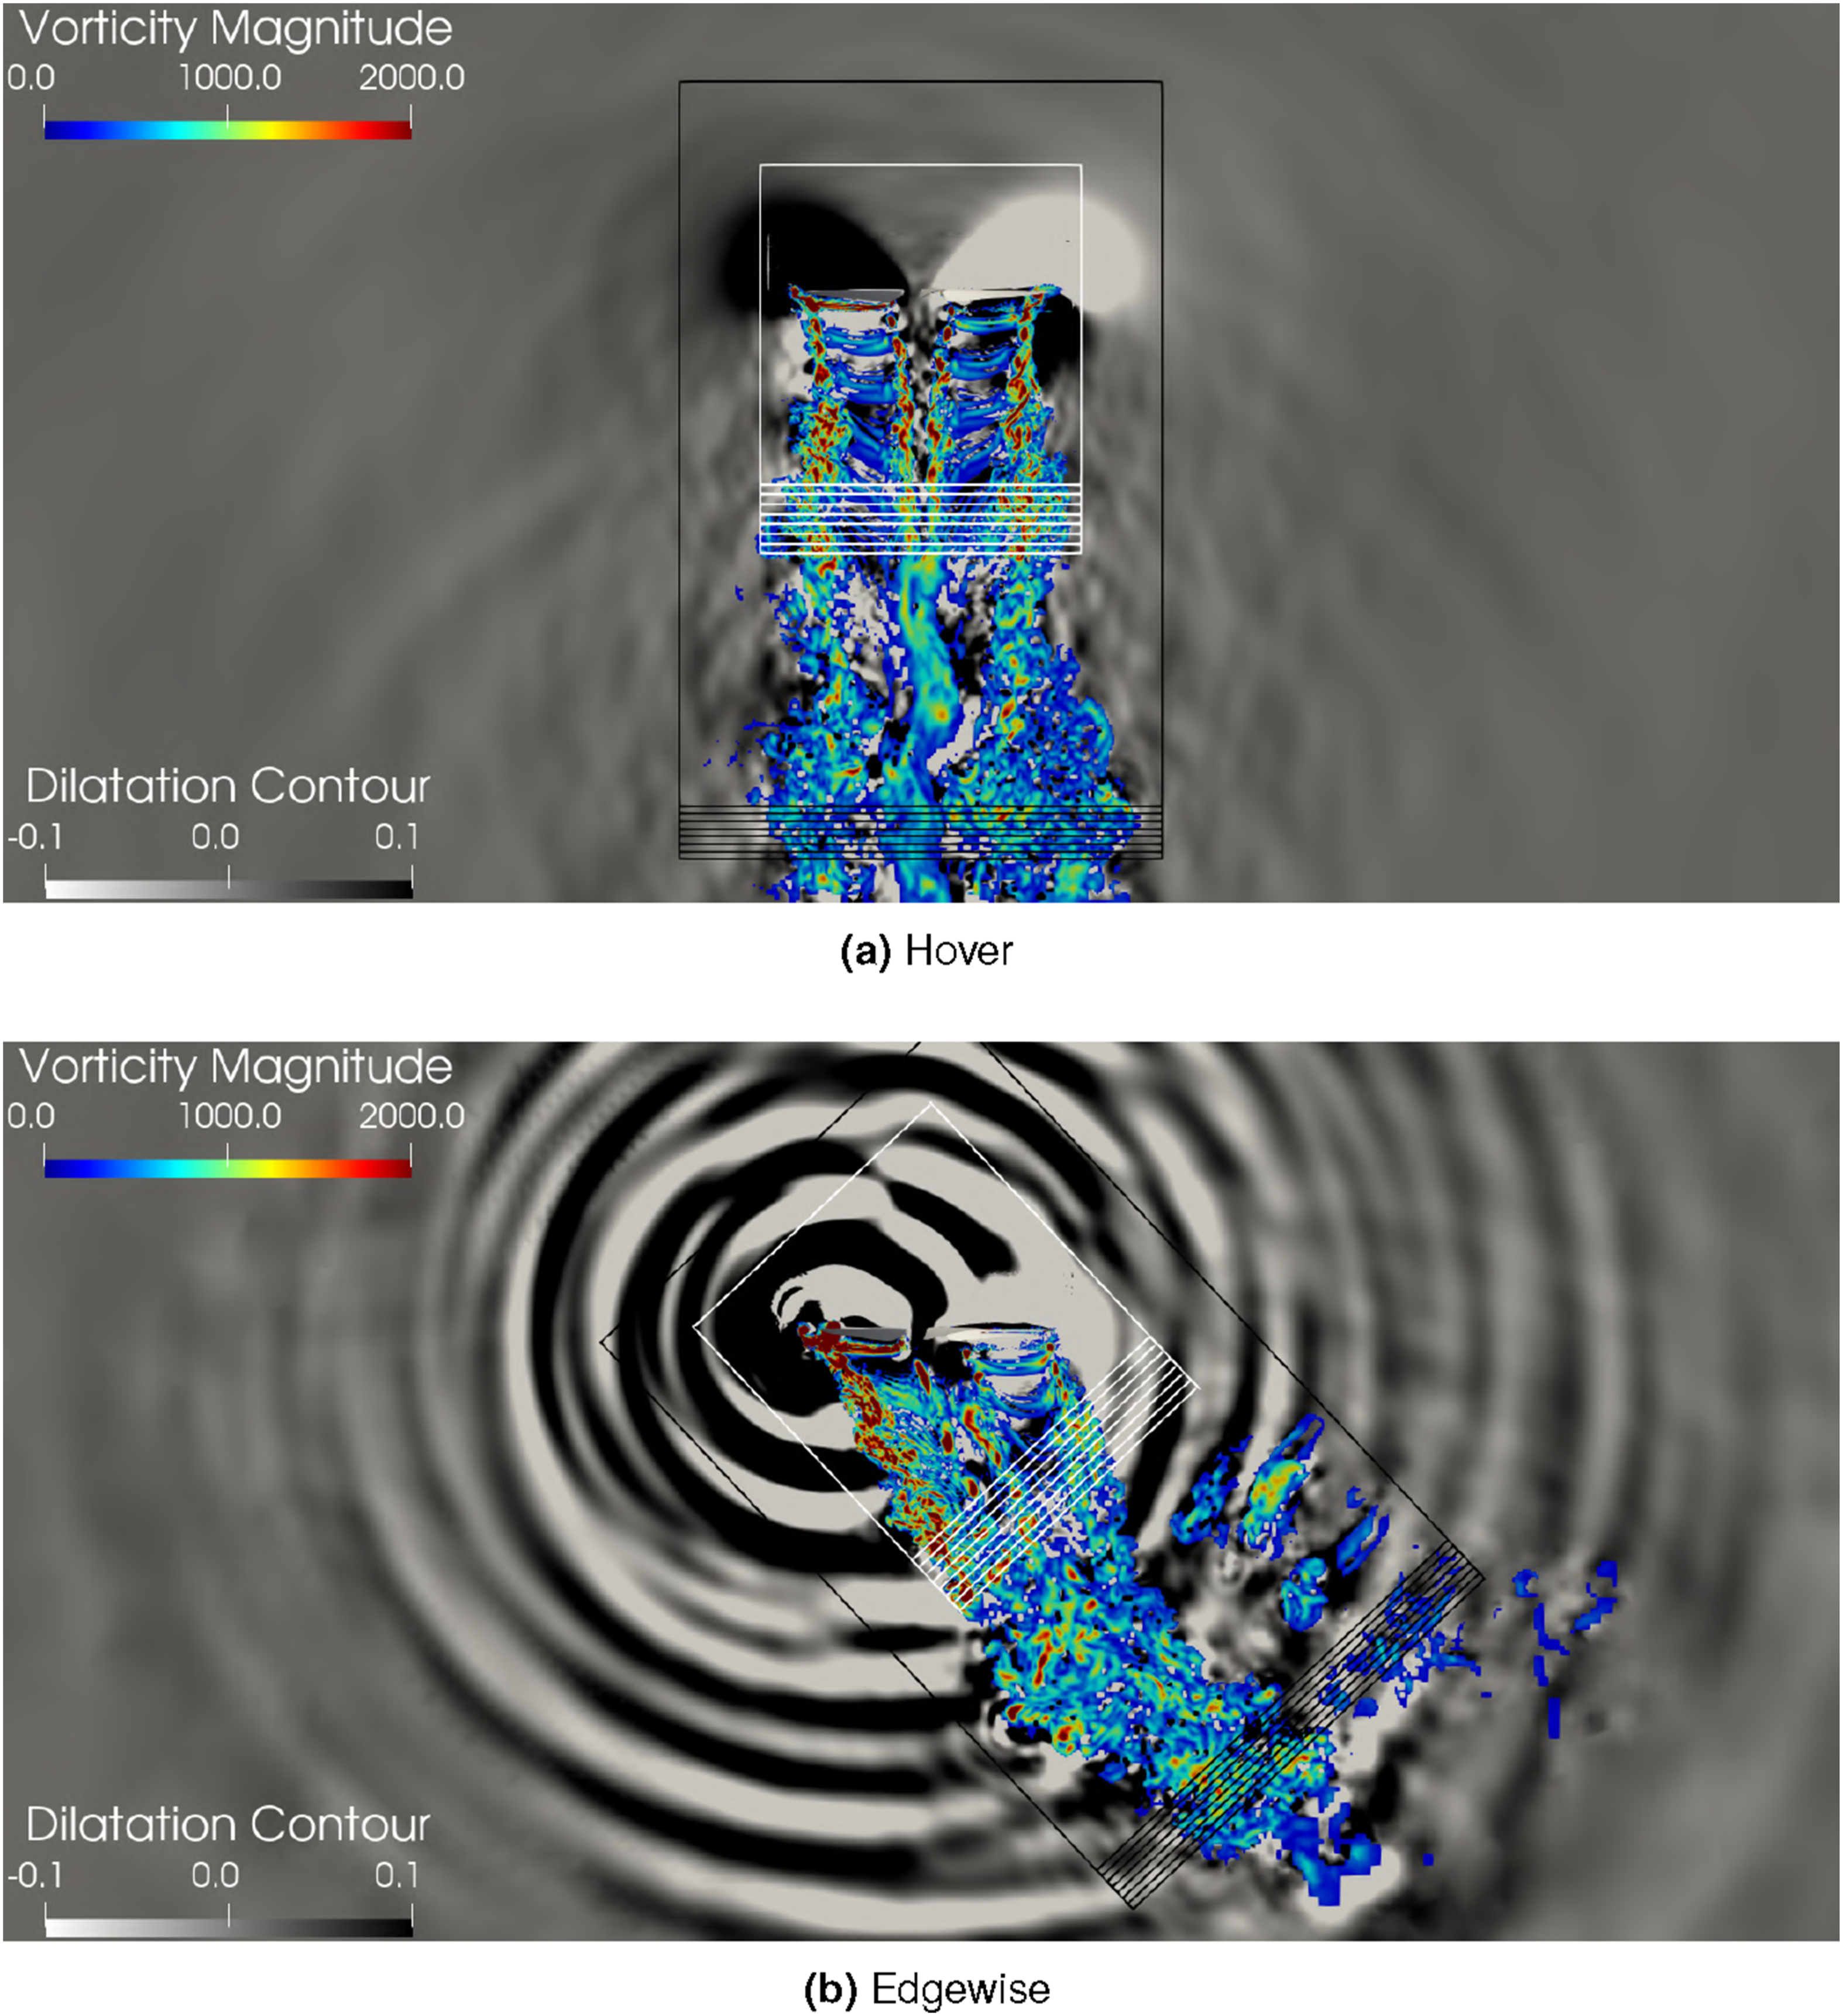

First, the propeller surface is considered as an impermeable FW-H surface, yielding a grid cut-off frequency of approximately
Alternatively, a permeable FW-H surface is placed within the refinement region, where the grid spacing reaches up to
These simulations were run on the Pleiades supercomputer at the NASA Advanced Supercomputing facility at NASA’s Ames Research Center. A total of 500 processors, each running at 2.8 GHz. The DDES simulation for hover required 3.5 h per propeller revolution and 5.5 h when including acoustic data collection. The full simulation encompassed 20 revolutions using URANS, 10 revolutions with DDES, and 8 revolutions for acoustic data collection, resulting in a total runtime of 149 h. These values vary depending on the case, with the total runtime for the IGE simulation reaching approximately 310 h.
Numerical validation
As previously mentioned, the experimental data used in this study are drawn from previously published measurements.
52
A detailed measurement uncertainty analysis (calibration, bias and precision errors) is not provided, so a rigorous propagation of experimental uncertainties is not possible. The only quantitative information available is the digital resolution of the balance, which was reported as
For the numerical results, there is no measurement uncertainty, but errors arise from spatial and temporal discretization and from modeling assumptions. The mesh and time-step resolutions were selected based on previous experience with similar configurations, for which mesh refinement studies showed changes in rotor loads and OASPL on the order of a few percent.
The numerical uncertainties in the present work are therefore expected to be smaller than the modeling uncertainties associated with, for example, the omission of the fairing and support hardware. In addition, 3D scans later revealed that the blade pitch varied from blade to blade, with an average value slightly higher than the nominal
Performance comparison
Performance predictions from CHARM, RANS, and DDES simulations are compared against experimental data, 52 focusing on thrust and torque.
Figure 8 presents performance metrics as functions of RPM. As expected, all numerical methods underpredict torque due to the omission of shaft losses, except for the RANS solution, which predicts a higher torque and lower thrust, likely as a consequence of the low-order scheme and larger time step. This confirms that, for a given grid, using an appropriate numerical scheme is crucial for accurate rotor performance prediction. Meanwhile, CHARM runs are trimmed to the thrust coefficient from the experiment. The DES results, available only at 4000 RPM, align closely with the experiments, with a slight underprediction of thrust in the edgewise case, and an overprediction of torque, which may be related to the wall or turbulence models employed. Based on the operating Reynolds number, the scaled propeller may experience significant boundary-layer transition, while the experiment does not use boundary-layer tripping. Assuming a fully turbulent flow with a model such as Spalart–Allmaras in the RANS region can therefore affect the comparison between high-fidelity CFD and experiments. Incorporating a turbulence model that accounts for transition could improve the accuracy of the DES simulations, as demonstrated for a full-scale eVTOL propeller in Afari et al.
32
Performance results compared against experimental data.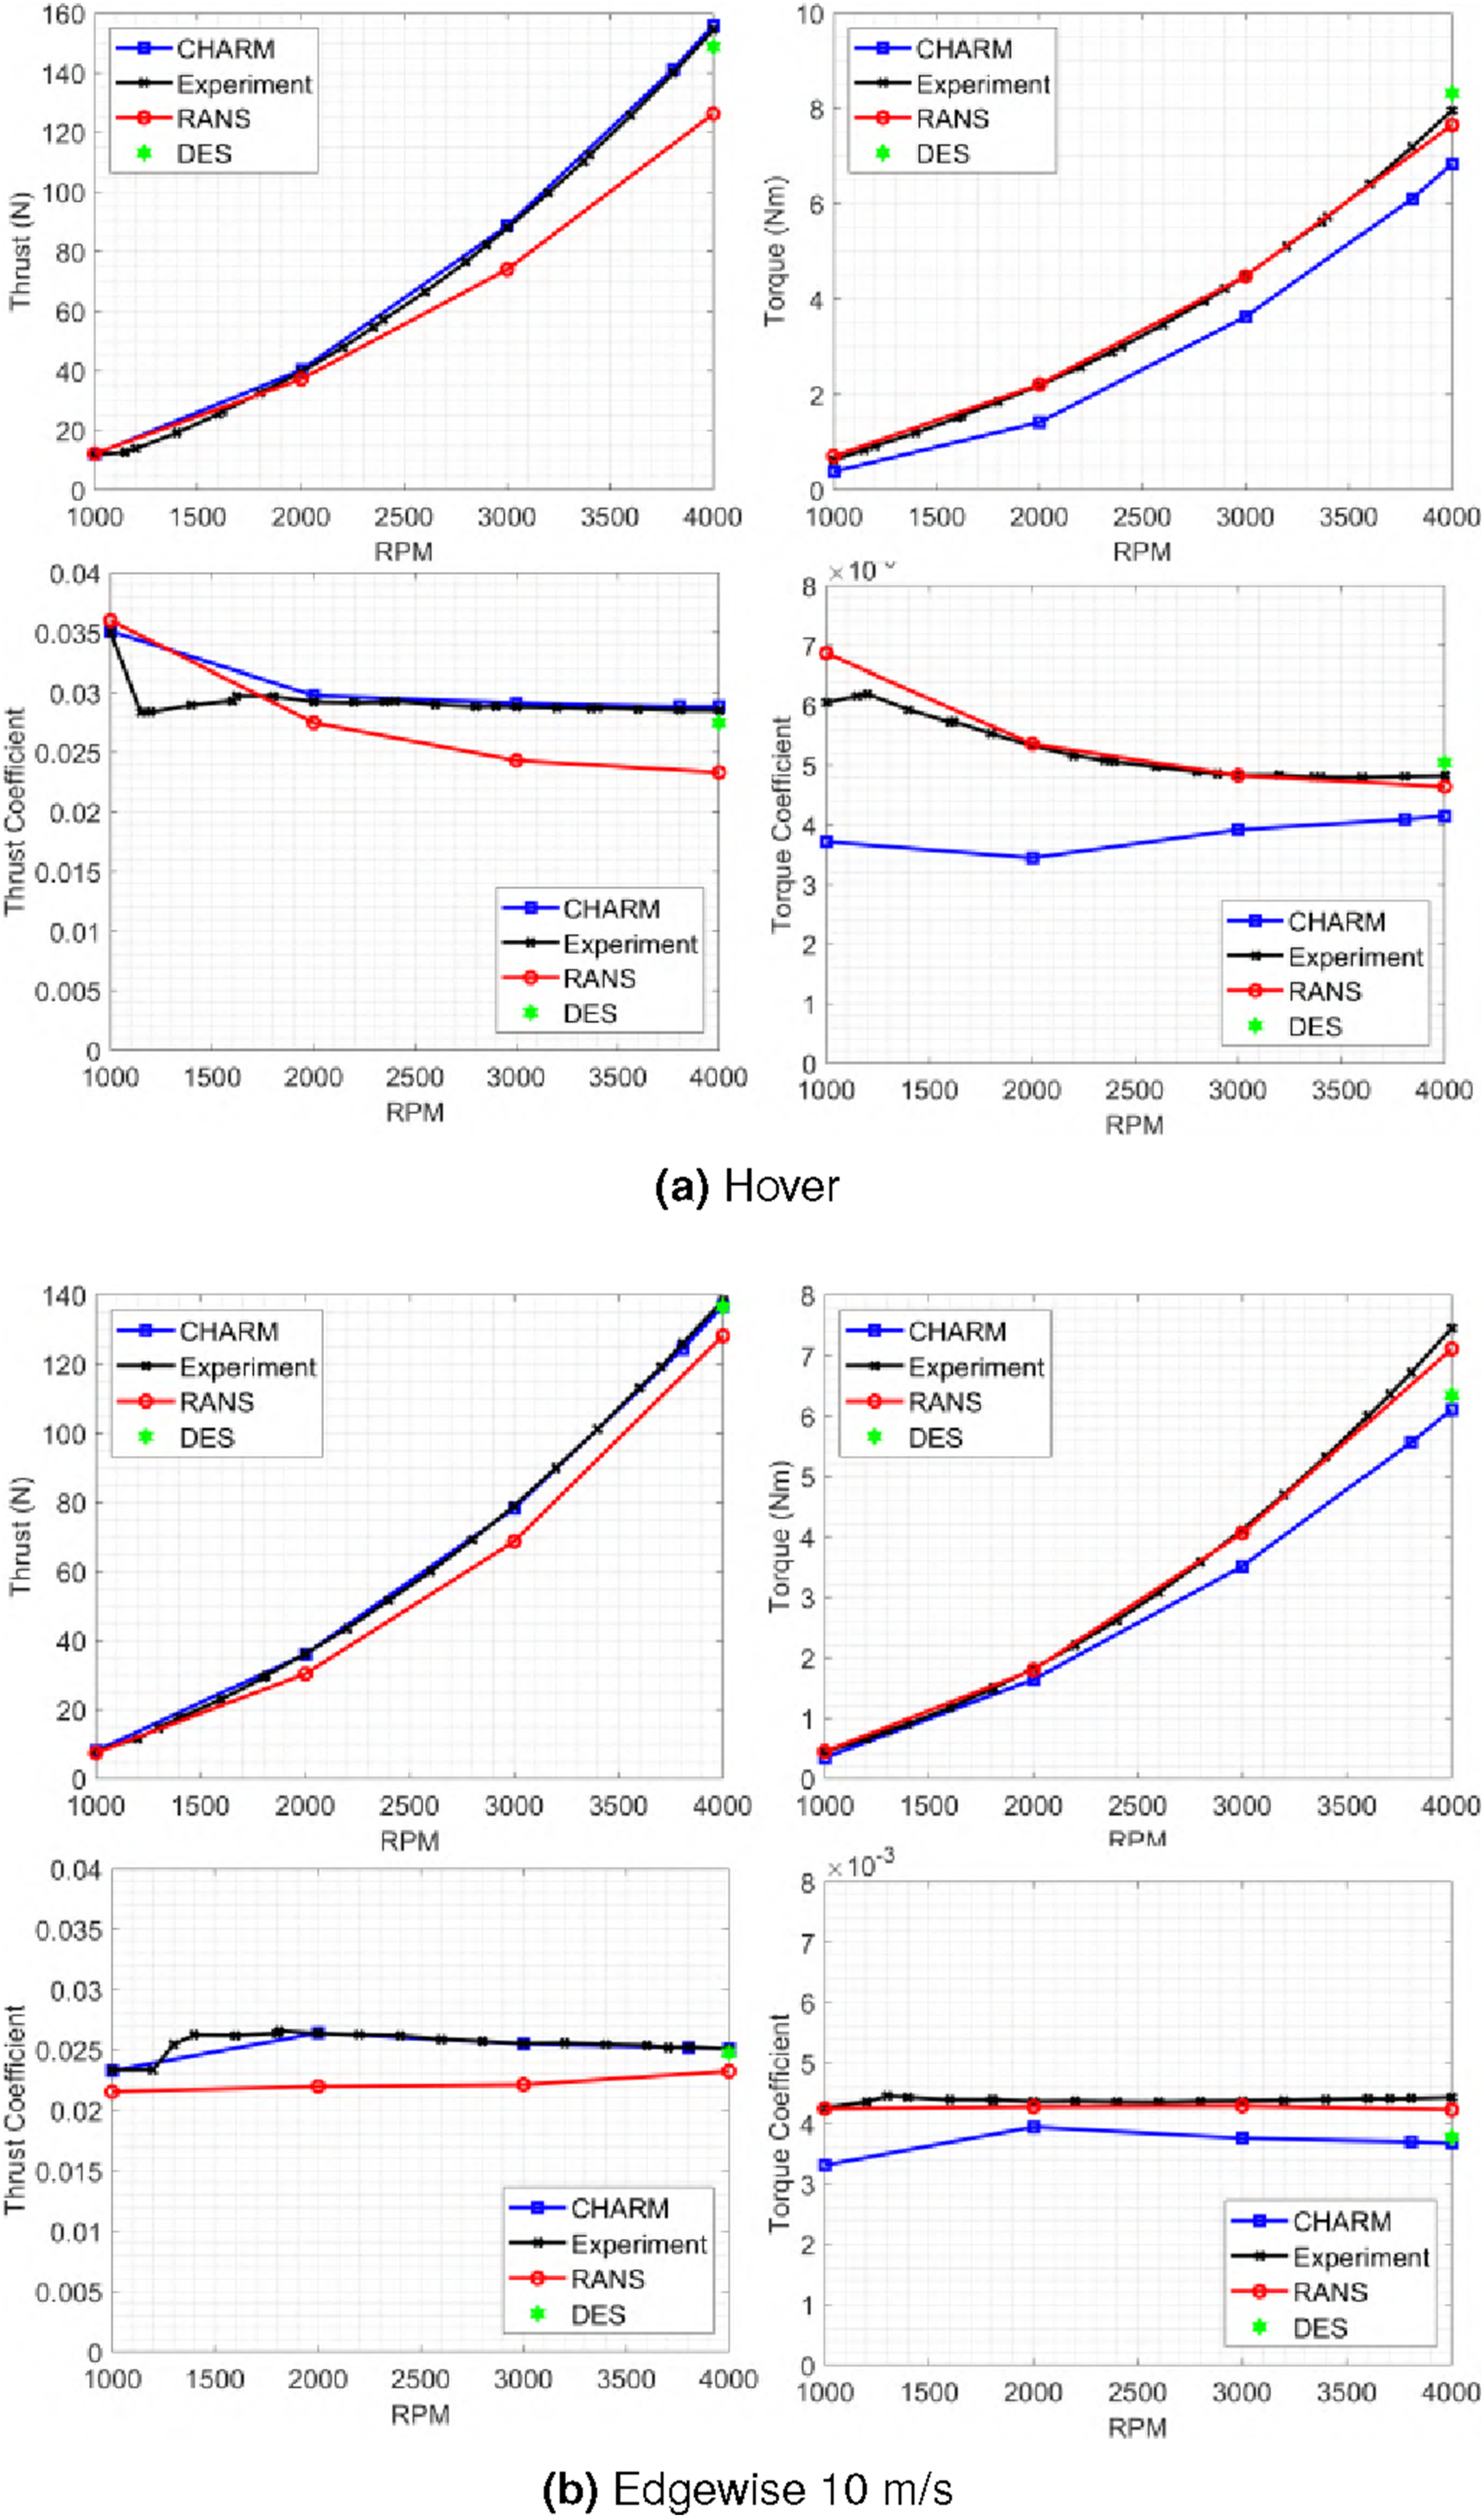
Challenges typically associated with DES simulations, such as non-physical boundary layer separation, were addressed through targeted enhancements to the setup presented on a previous study. 36 These included the application of updated DDES shielding functions, refined near-wall grid resolution, and the use of higher-order spatial and temporal discretization schemes. As a result, boundary layer behavior was more accurately captured, reducing artificial flow separation and improving thrust predictions while slightly decreasing torque, consistent with the elimination of spurious drag sources.
Additionally, pressure wave reflections in the near-field were minimized by placing coarse-to-fine mesh transitions farther from the propeller, thereby reducing numerical discontinuities and preserving the integrity of the acoustic field.
Flow field
Figure 6 show a DES snapshot of dilatation overlaid with vorticity, with white and black lines indicating the shorter and longer FW-H permeable surfaces, respectively. The end-cap averaging technique 59 evaludated here for propeller aeroacoustics was originally developed for jet noise. 60 However, its application to rotating systems warrants caution, as convecting structures in these flows can have variable velocities and rotational effects distinct from the jet configurations for which the method was intended.
Nevertheless, the approach serves as a useful reference for attenuating low-frequency components, particularly BPF subharmonics, in permeable FW–H predictions, since vortex interactions with the acoustic surface end-caps can induce phase-cancellation effects. Additionally, the updated mesh configuration mitigates spurious pressure reflections caused by poor non-orthogonality between grid levels, improving the accuracy of acoustic predictions.
Each permeable surface includes a top cap and eight end-caps, each spaced at
To relate this design choice to a more general formulation, we follow an outflow-disk averaging argument proposed in earlier work.
59
The passage of a coherent turbulent structure through each end-cap generates a spurious sinusoidal signal of frequency
In the present configuration, eight end-caps with spacing
For the hover case, the shorter permeable surface is positioned very close to the tip vortices, which may influence far-field acoustic predictions. Additionally, both end-caps of the hover permeable surfaces interact with vortices passing through them. A detailed investigation is required to assess the impact of neglecting or averaging the contributions of these end-caps.
In the edgewise configuration, the wake skew angle added to the refinement regions allowed the permeable surfaces to be placed strategically, enforcing the wake to convect only through the end-caps.
The dilatation contour reveals that near-field pressure waves are more intense for the edgewise 10 m/s case compared to hover, as expected. Additionally, in the edgewise case the wave pattern appears well defined, whereas in hover the wake seems to generate acoustic waves over a broader range of frequencies, highlighting some importance of quadrupole noise sources.
A detailed permeable surface placement study, included in the Appendix, supports the final choice between the shorter and longer permeable surfaces used in the acoustic analysis. For both hover and edgewise flight conditions, the permeable surface placed farther from the rotor experiences less wake contamination, which improves directivity and broadband noise predictions relative to experimental data. However, because this larger surface extends into a coarser grid region, it resolves a lower maximum frequency than the shorter surface. The study also compared different end treatments; end-cap averaging, a single end cap, and an open-end surface. It was found that end-cap averaging best mitigates edge effects and produced the most consistent acoustic results. Therefore, the permeable surface selected for both hover and edgewise cases is the one placed farther from the rotor, combined with end-cap averaging.
Acoustic spectrum comparison
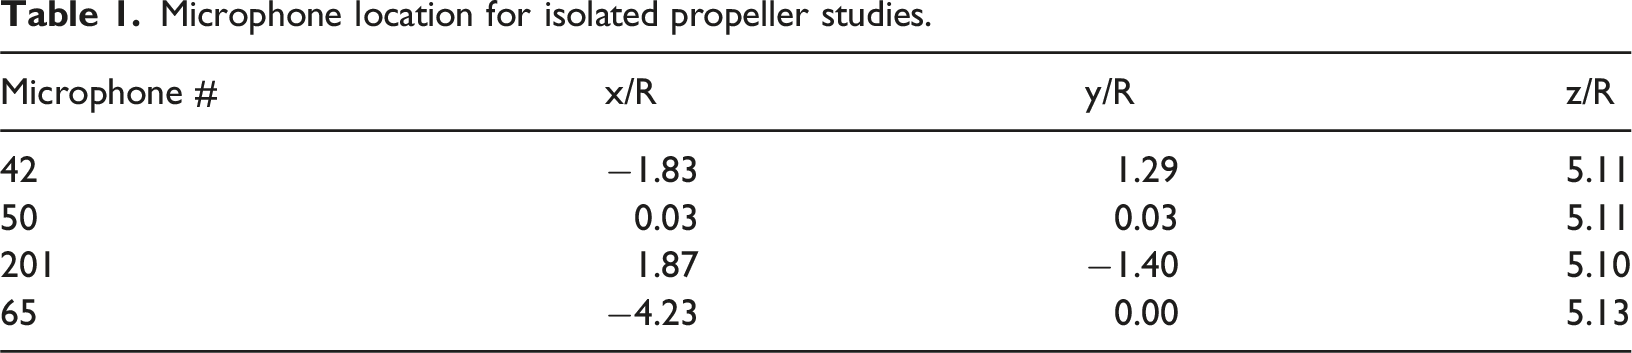
Far-field acoustic validation is conducted by comparing simulation results from CHARM and OpenFOAM with experimental data. The microphone arrangement in the simulations is designed to replicate the experimental setup. In hover or axial flight conditions, the propeller wake remains parallel to the microphones, whereas in edgewise flight, the wake is directed toward the microphone array. This orientation resulted from the necessary rotation of the setup within the wind tunnel. It should also be noted that the CHARM simulations were trimmed to match experimental thrust coefficient, while the high-fidelity CFD results provided an accurate performance prediction. Therefore, the corresponding acoustic predictions are expected to be in reasonable agreement.
Microphone location for isolated propeller studies.
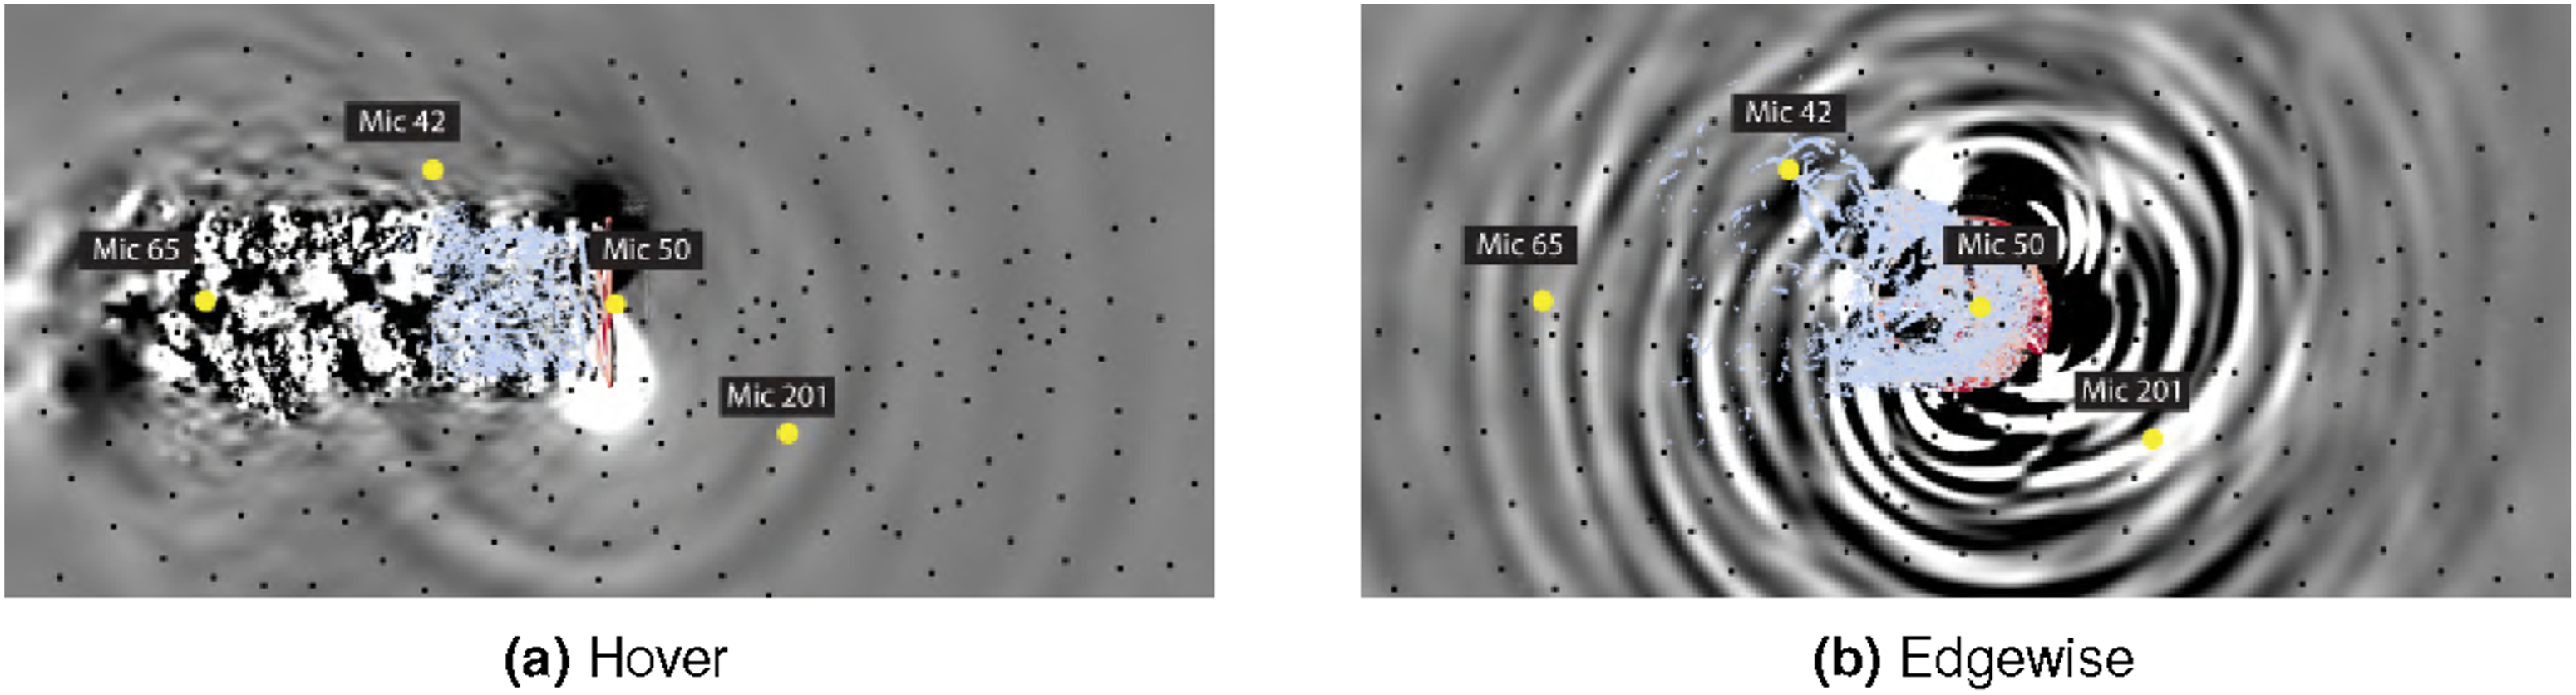
Far-field microphone locations at different setups.
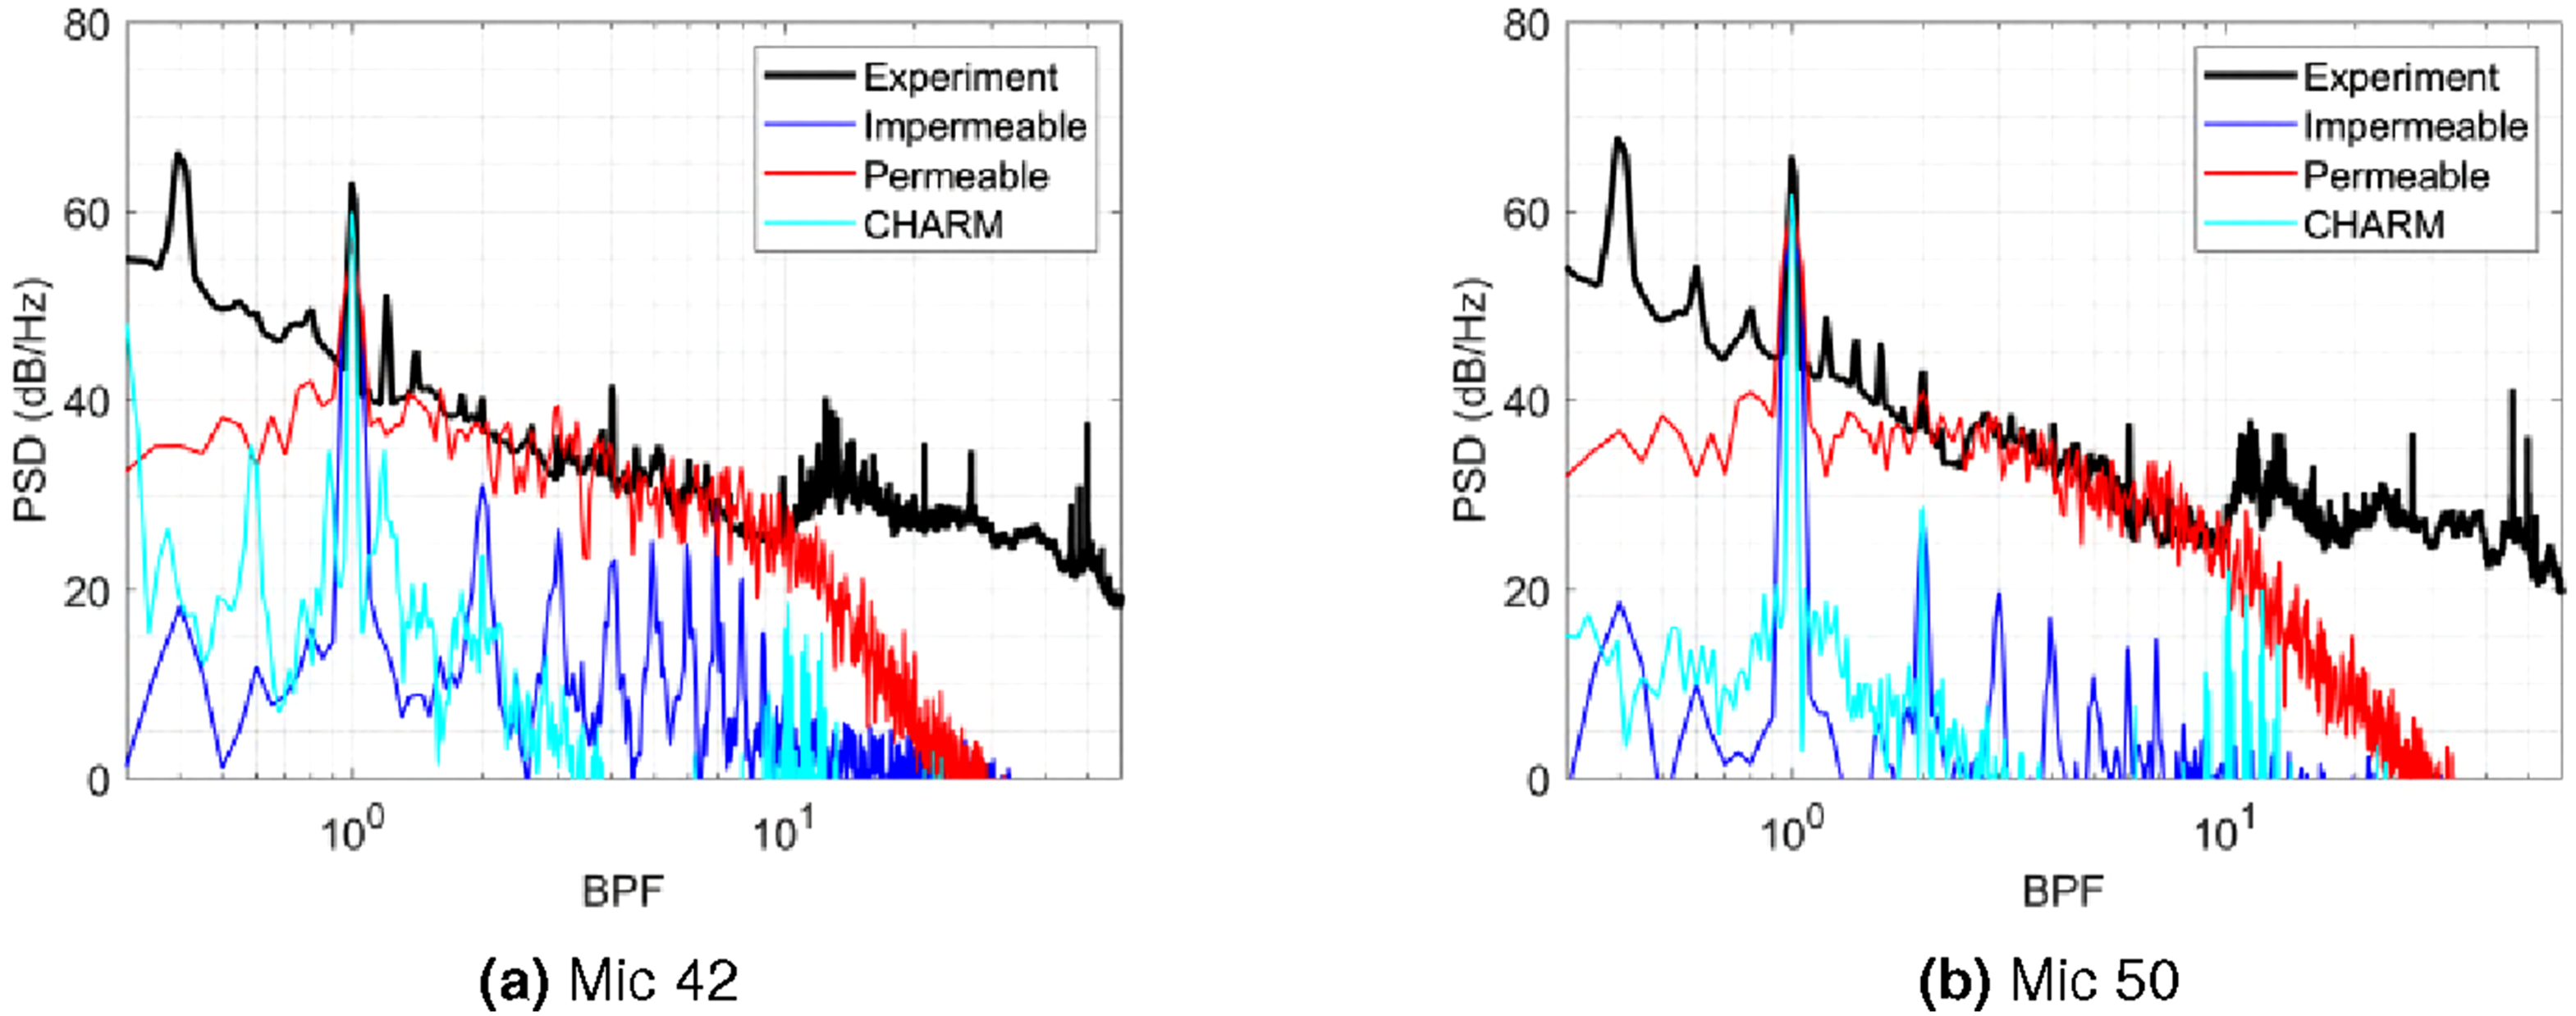
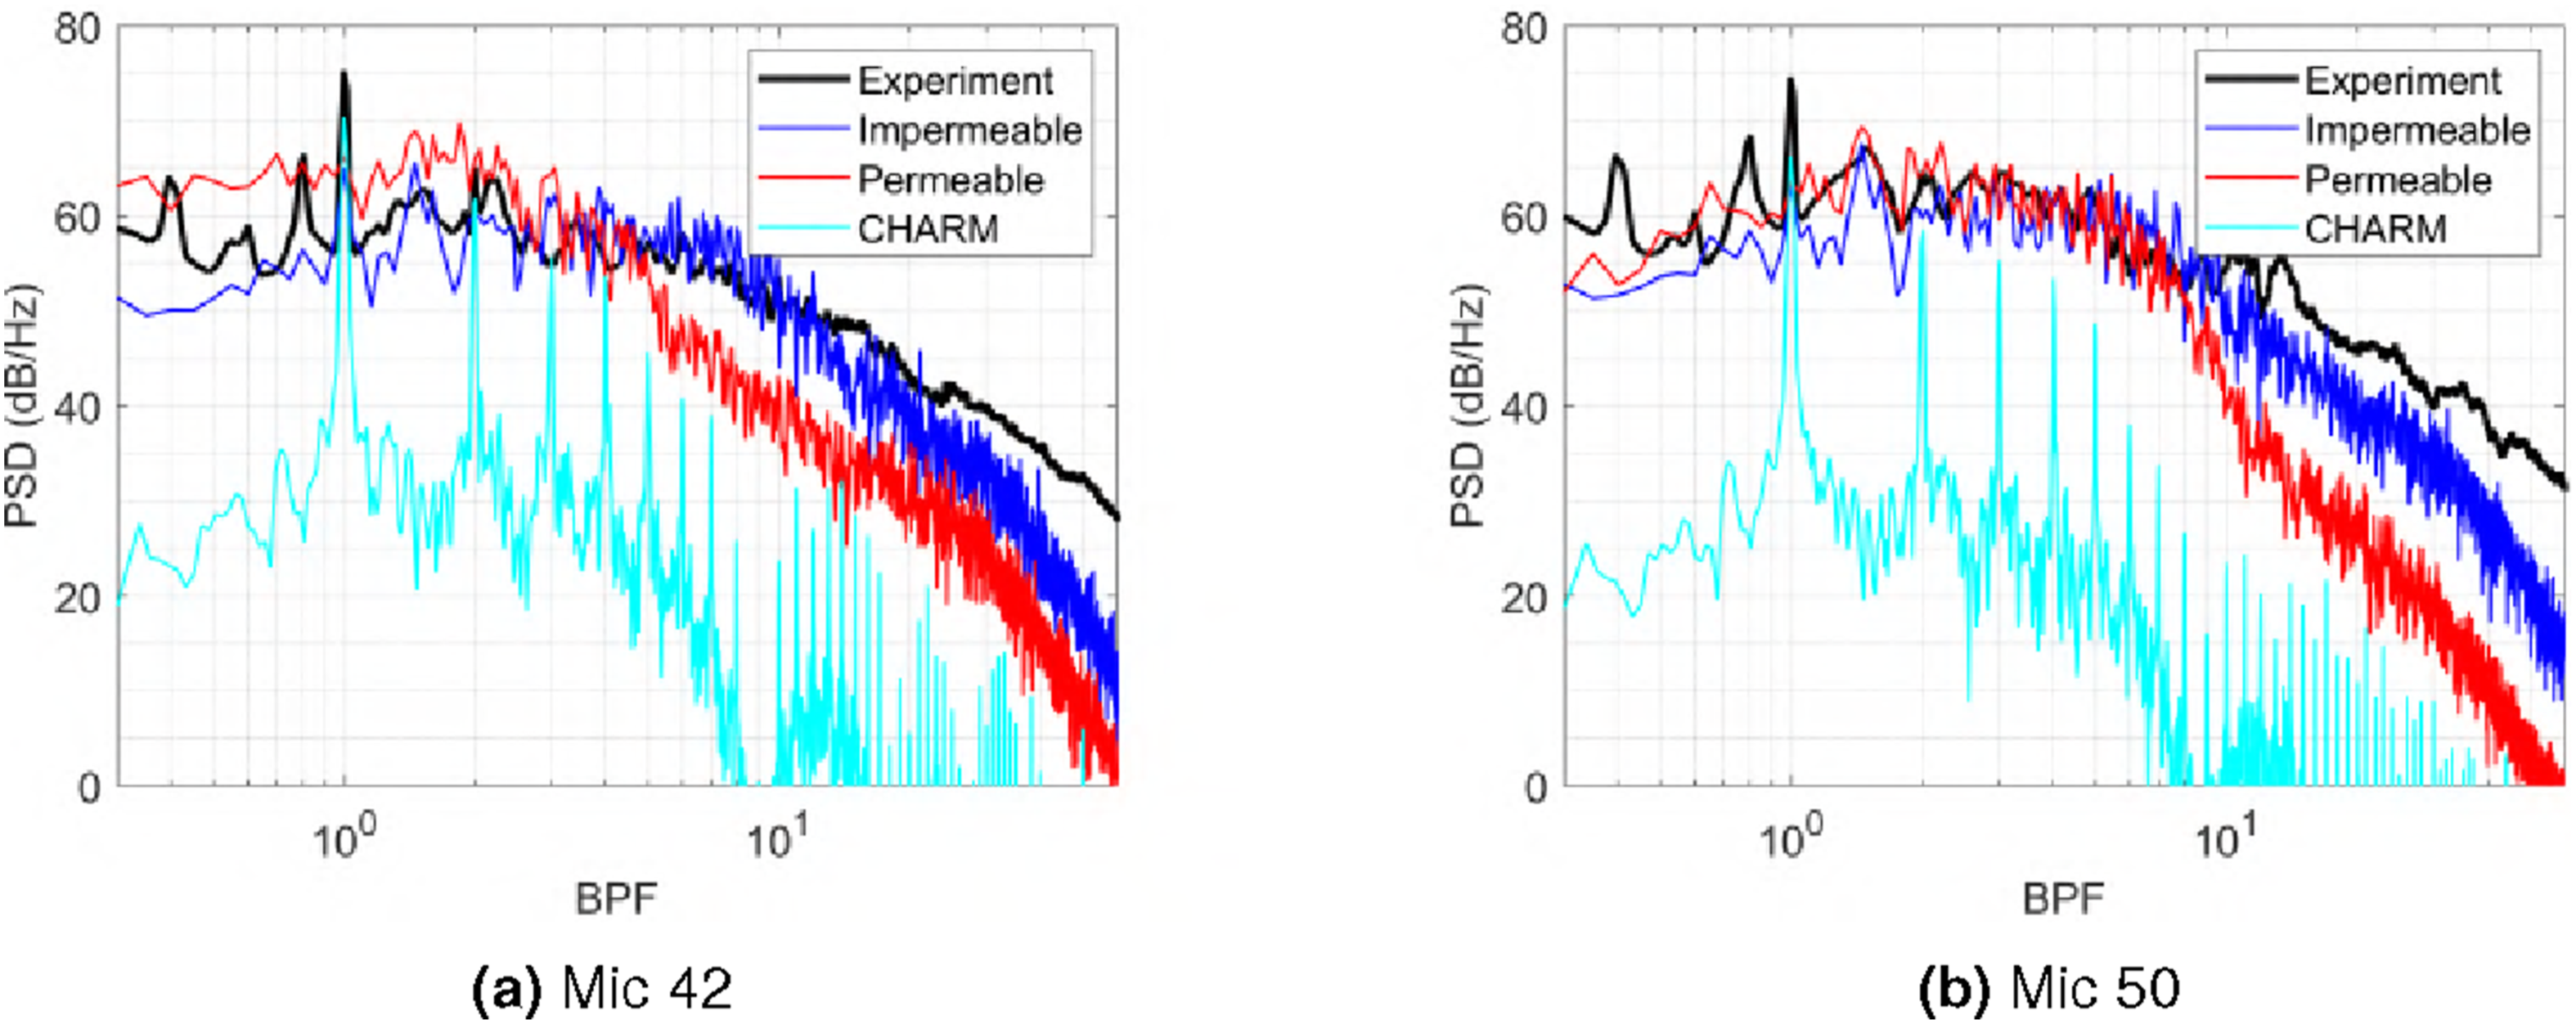
Far-field PSD spectrum comparison for hover at 4000 RPM.
Far-field PSD spectrum comparison for edgewise 10 m/s at 4000 RPM.
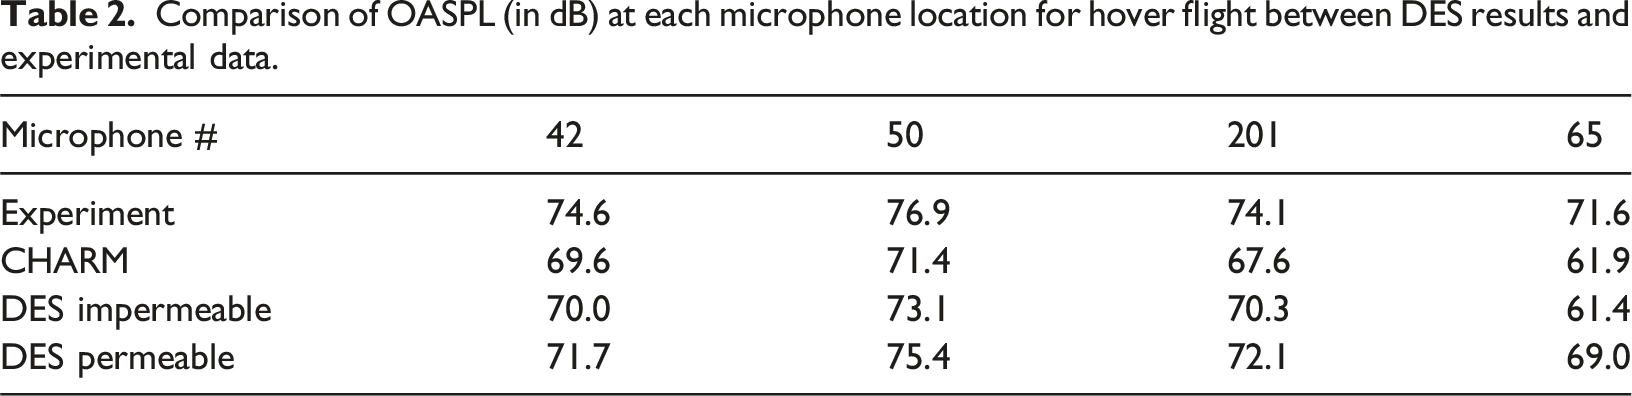
Comparison of OASPL (in dB) at each microphone location for hover flight between DES results and experimental data.
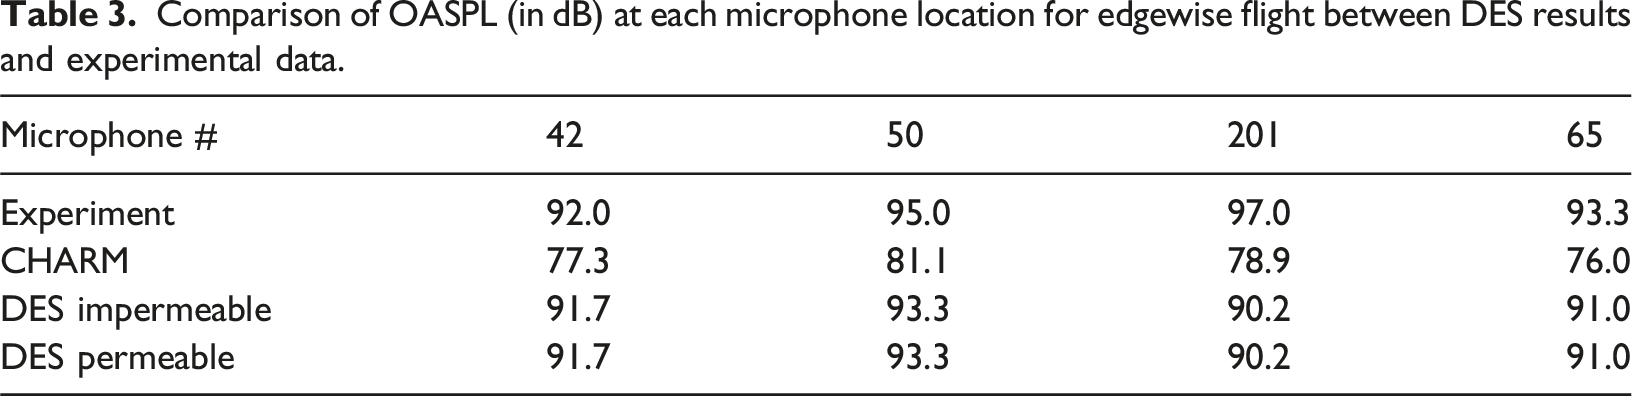
Comparison of OASPL (in dB) at each microphone location for edgewise flight between DES results and experimental data.
For hover, the high-fidelity simulation with the impermeable surface predicts the tonal noise and several higher harmonics, although at lower levels than the measurements. In contrast, the permeable surface recovers essentially the full spectrum up to its grid cut-off frequency.
The behavior shown by the impermeable surface is physically reasonable. The blade surface pressure distribution is nearly steady, and the dominant sound generation mechanism is the periodic modulation introduced by the rotor rotation relative to the observer. Consequently, there is no clear mechanism for this formulation to generate noise content between harmonics, similarly to the experiments. This indicates that a permeable surface is more accurate for hover predictions, since it does capture these inter-harmonic components that are likely associated with wake breakdown, as quadrupole-type noise sources.
Similar to the impermeable formulation, CHARM underpredicts the broadband levels observed in the experiment and does not capture the harmonic content as effectively as the high-fidelity CFD. The OASPL comparison shows that the permeable surface results from CFD are by far the closest to the measurements, while CHARM and the high-fidelity impermeable predictions lie close to one another.
In the edgewise case, the impermeable surface can now capture several unsteady noise mechanisms associated with blade–vortex interaction, which occurs upstream of the rotor, as the tip vortex impinges on the advancing blade. Here, the impermeable and permeable CFD results agree well up to the permeable surface grid cut-off frequency, but CHARM falls behind the high-fidelity predictions. First, it fails to capture the inter-harmonic noise and only produces a few harmonic peaks that barely reach the levels of the CFD and experimental data. The OASPL comparison shows good agreement between the two CFD formulations, while CHARM remains significantly lower. Those quadrupole contributions are still present in edgewise flight but are overshadowed by stronger noise mechanisms such as BVI noise.
Finally, beyond about 10 BPF (3330 Hz), broadband levels attributed to blade self-noise are expected. Although self-noise is not the primary focus of this work, incorporating an appropriate self-noise model into the simulations would likely reduce the remaining high-frequency discrepancy with the experimental spectra.
Directivity maps
The microphone array configuration enables acoustic analysis via directivity maps, which display the SPL at each microphone for a selected frequency. These contour maps help identify noise sources within specific frequency bands. At the BPF, noise levels are expected to match experimental results closely, as they are primarily driven by thickness and steady loading noise, both well captured by numerical simulations.
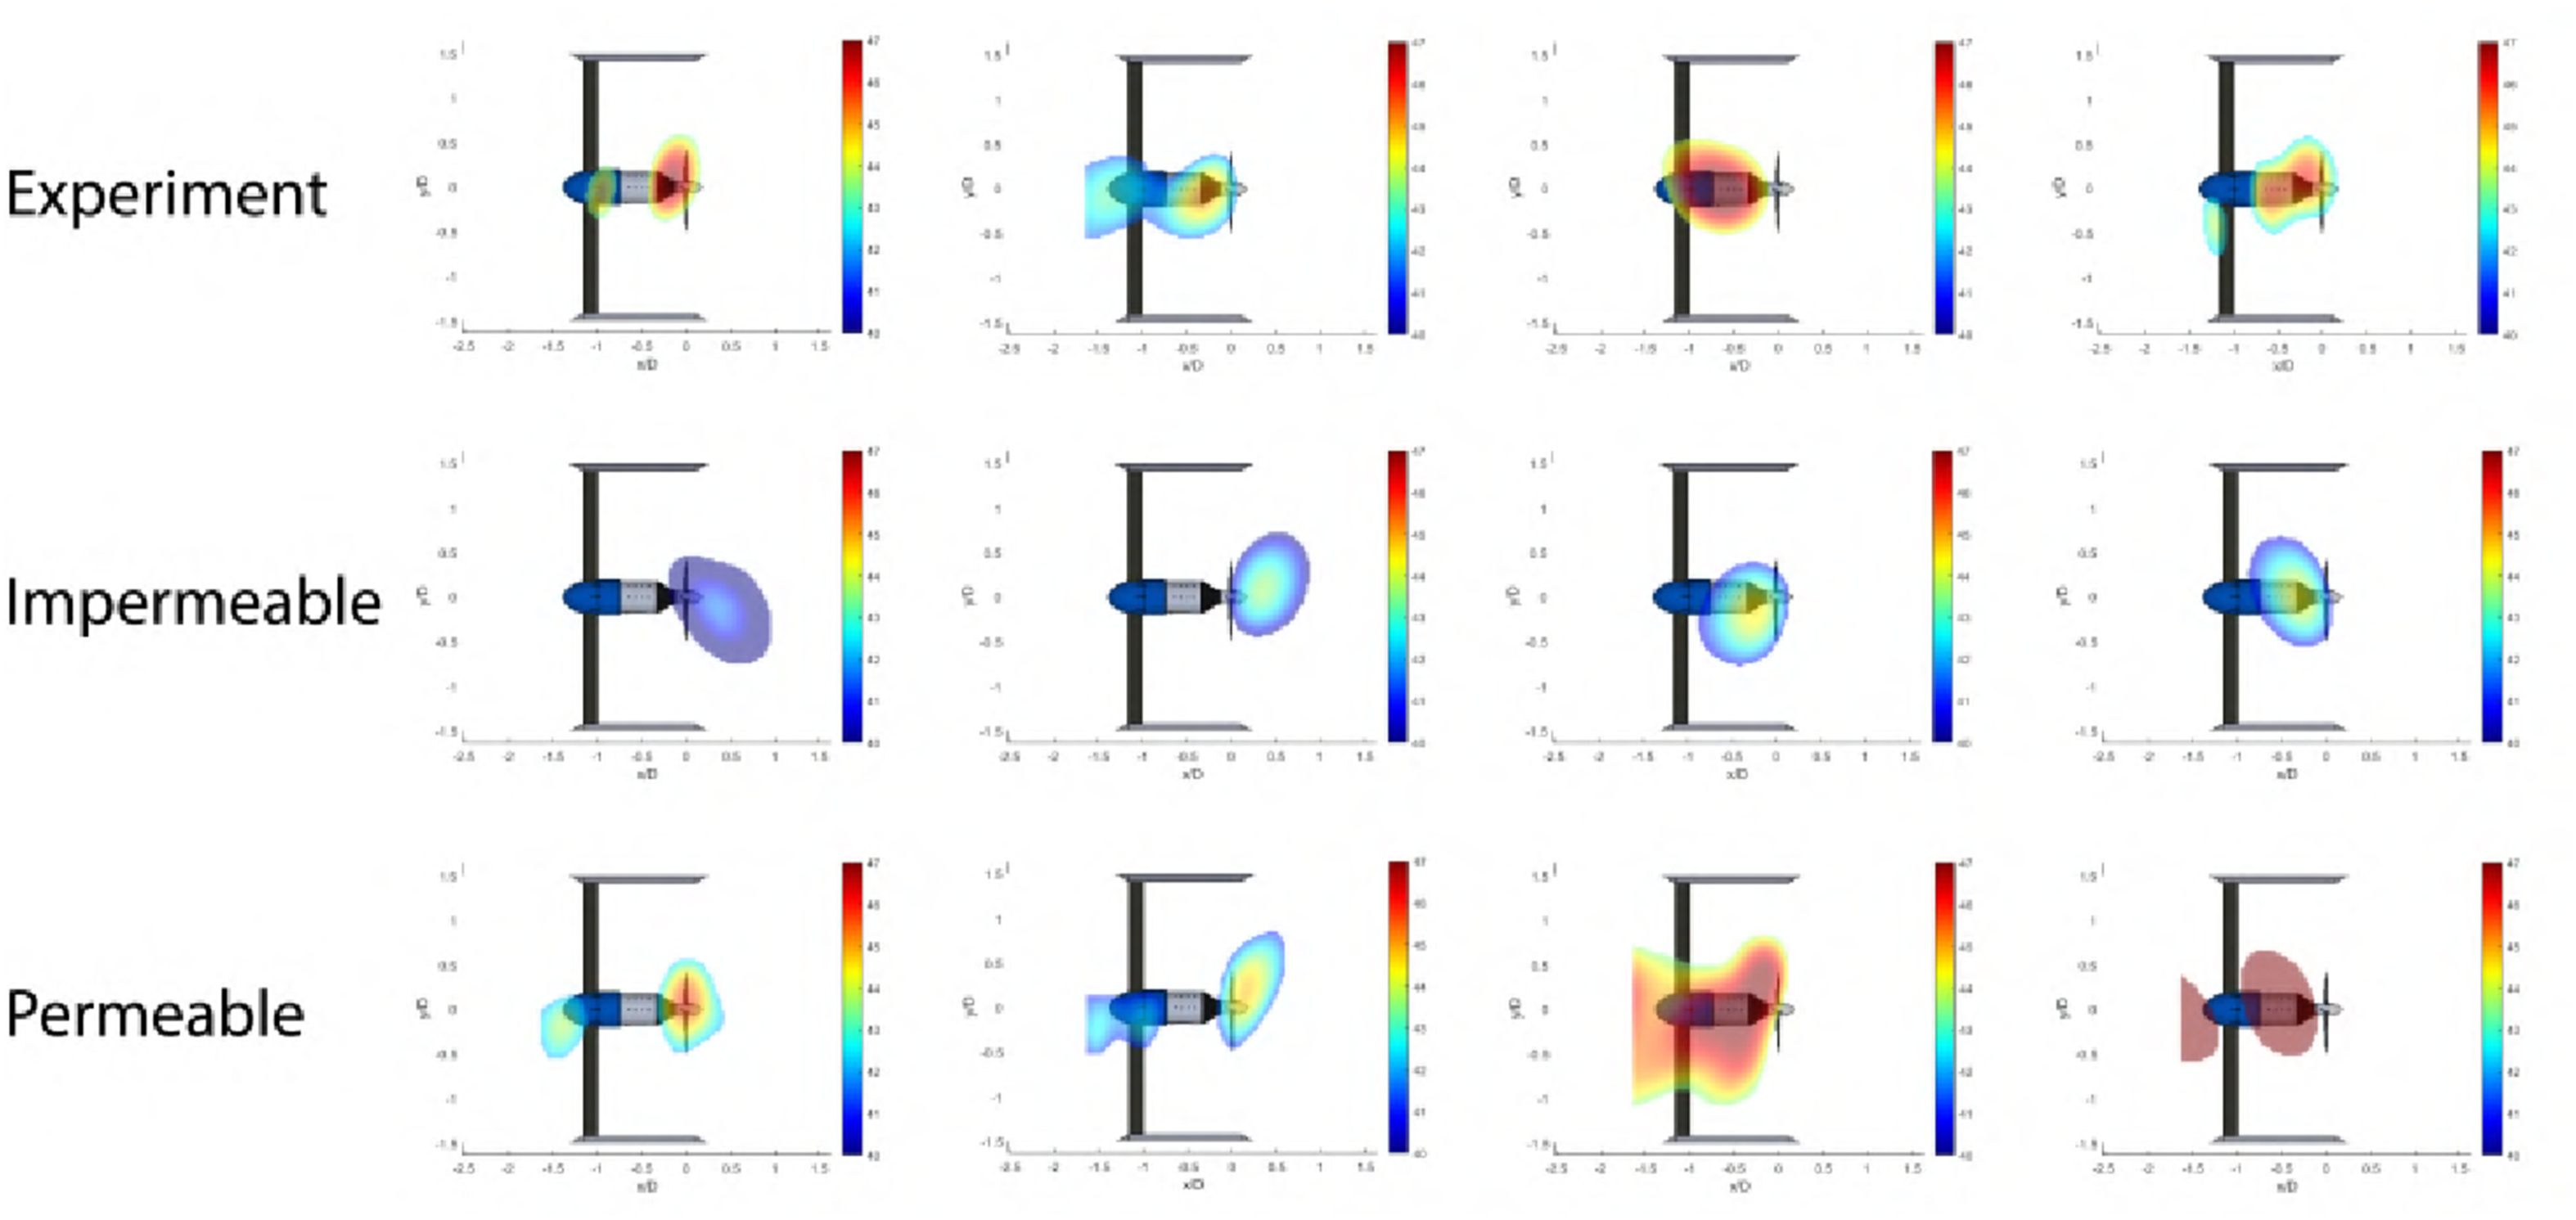
Figure 12 shows directivity maps at the BPF for CHARM, DES (impermeable and permeable FW–H), and experimental hover data. The black line indicates the propeller disk located behind the acoustic plane. While the DES prediction reproduces the experimental levels reasonably well, the directivity contours differ noticeably. The impermeable surface result appears consistent with expectations for an isolated rotor and even agrees qualitatively with CHARM, despite the overall underprediction of noise levels by CHARM. The permeable surface solution, in turn, captures features that more closely resemble the experimental patterns, but the asymmetry in its directivity map lacks a clear physical explanation. Far-field SPL contour at BPF for Hover.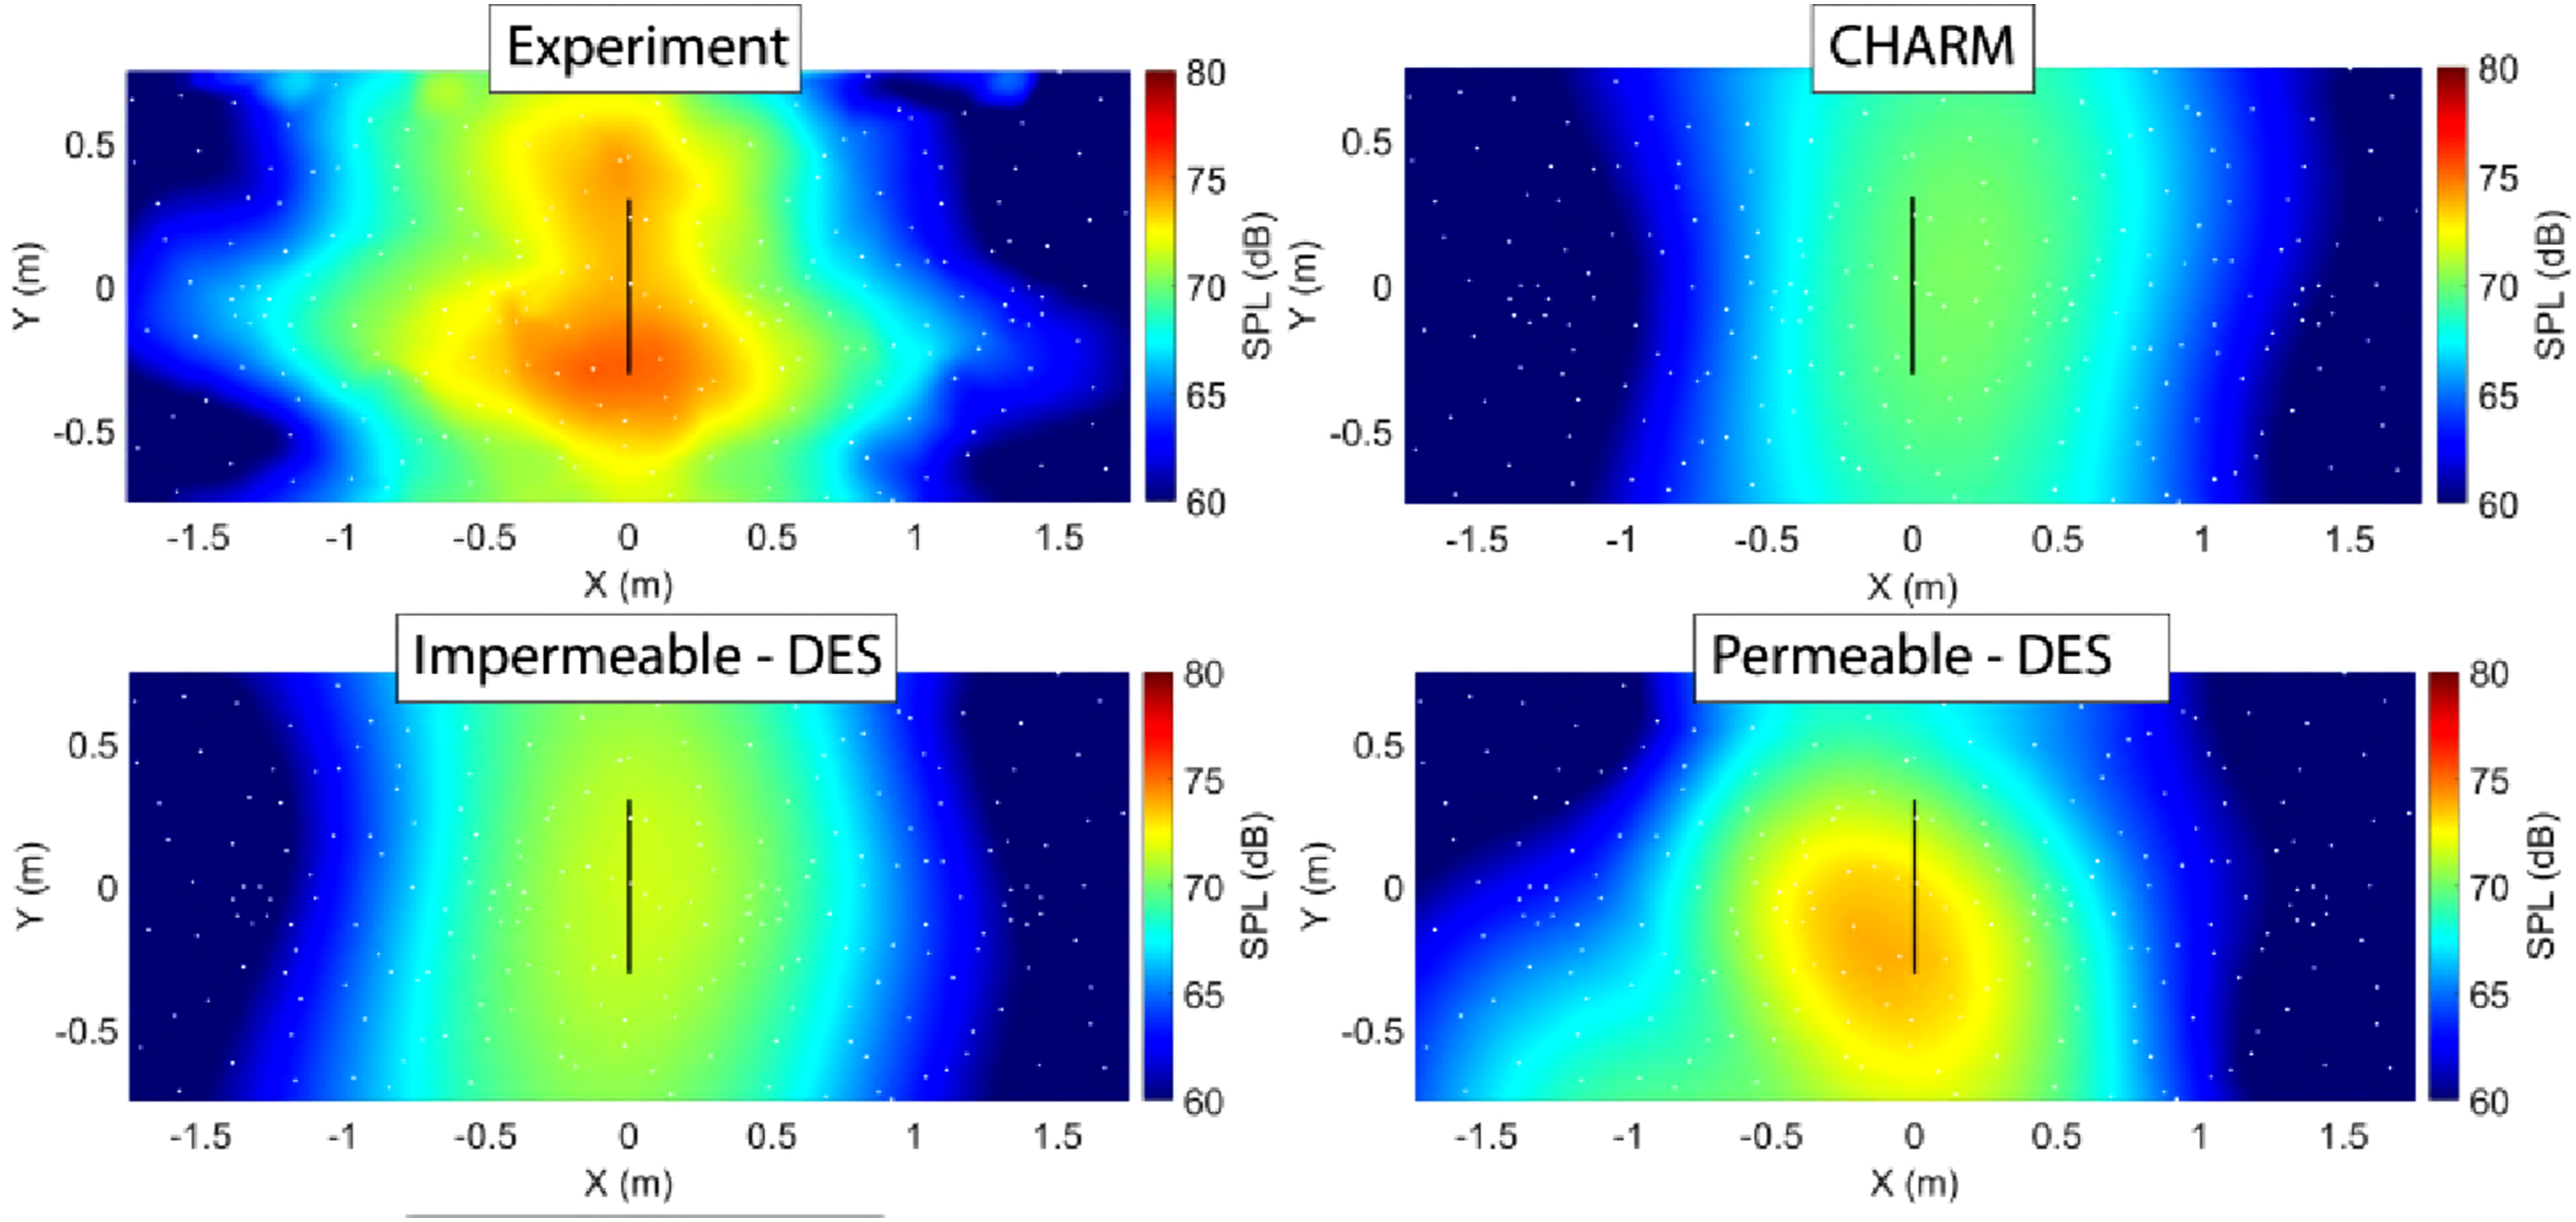
To facilitate comparison, horizontal slices at Far-field SPL comparison at BPF for Hover.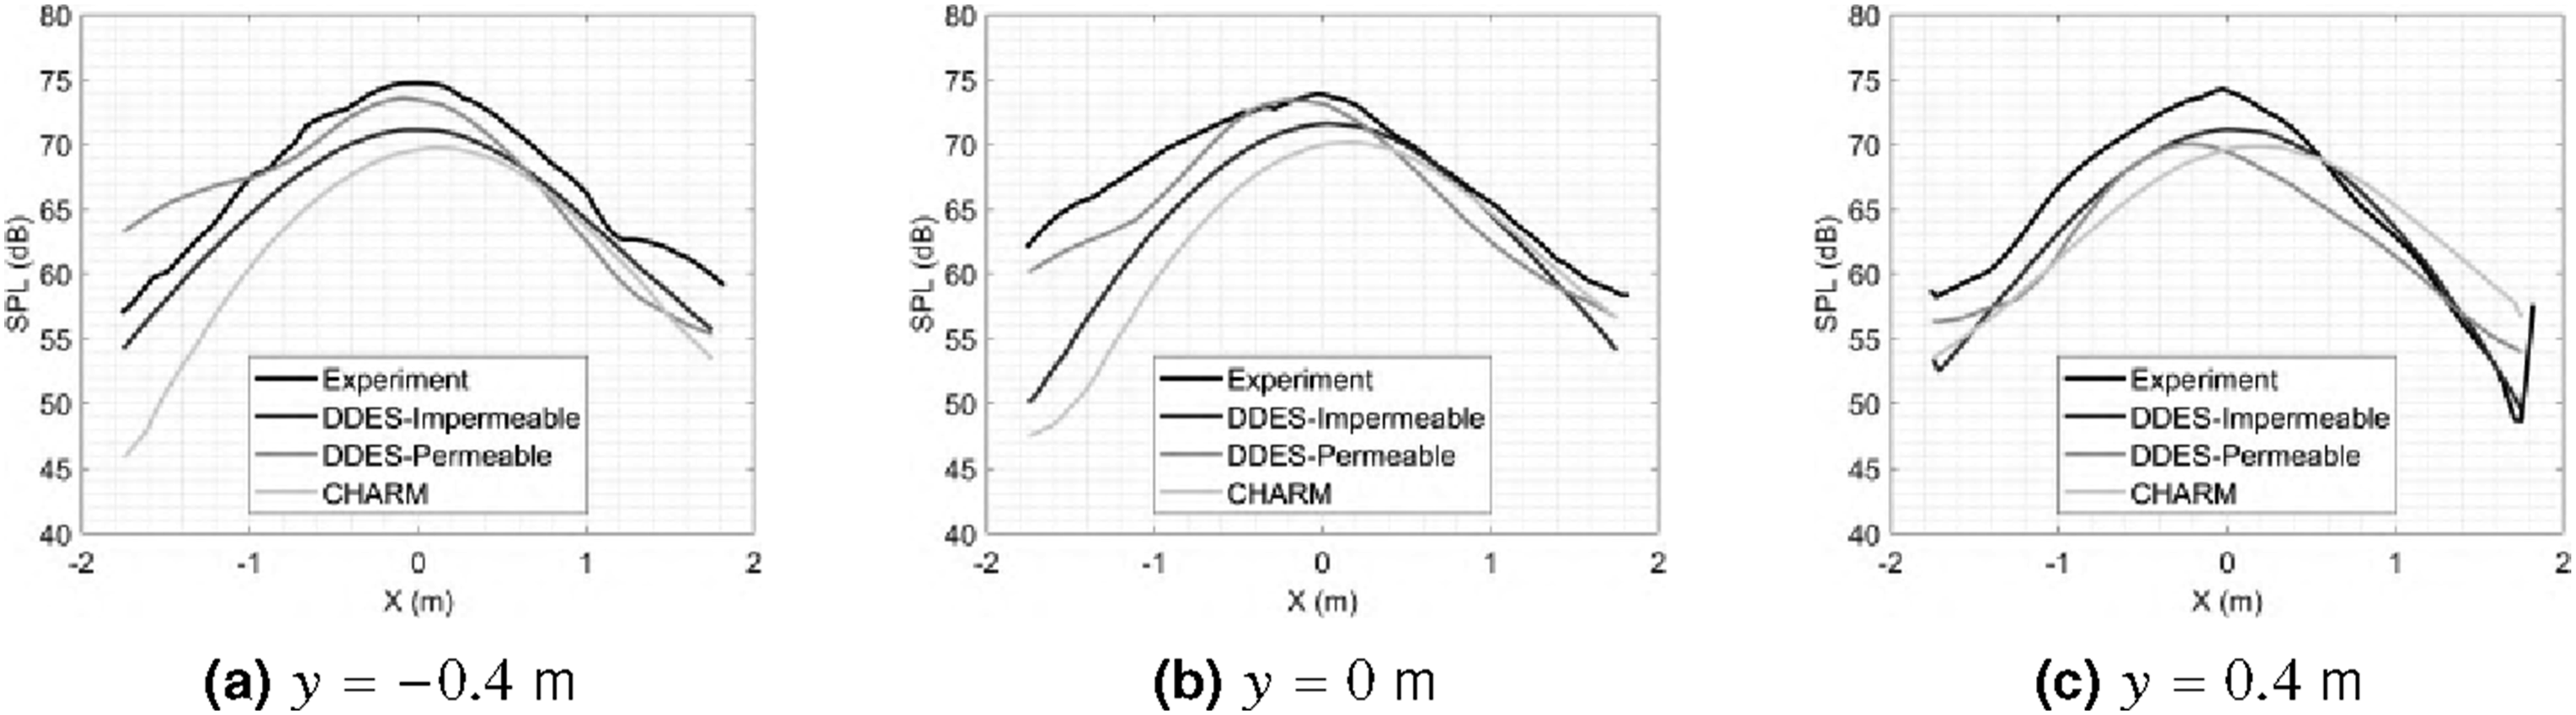
For edgewise flight at 10 m/s, Figure 14 shows SPL directivity maps at the BPF. In contrast to the hover case, the circular line now represents the rotor disk oriented toward the microphone array, as illustrated previously in Figure 9. Far-field SPL contour at BPF for Edgewise.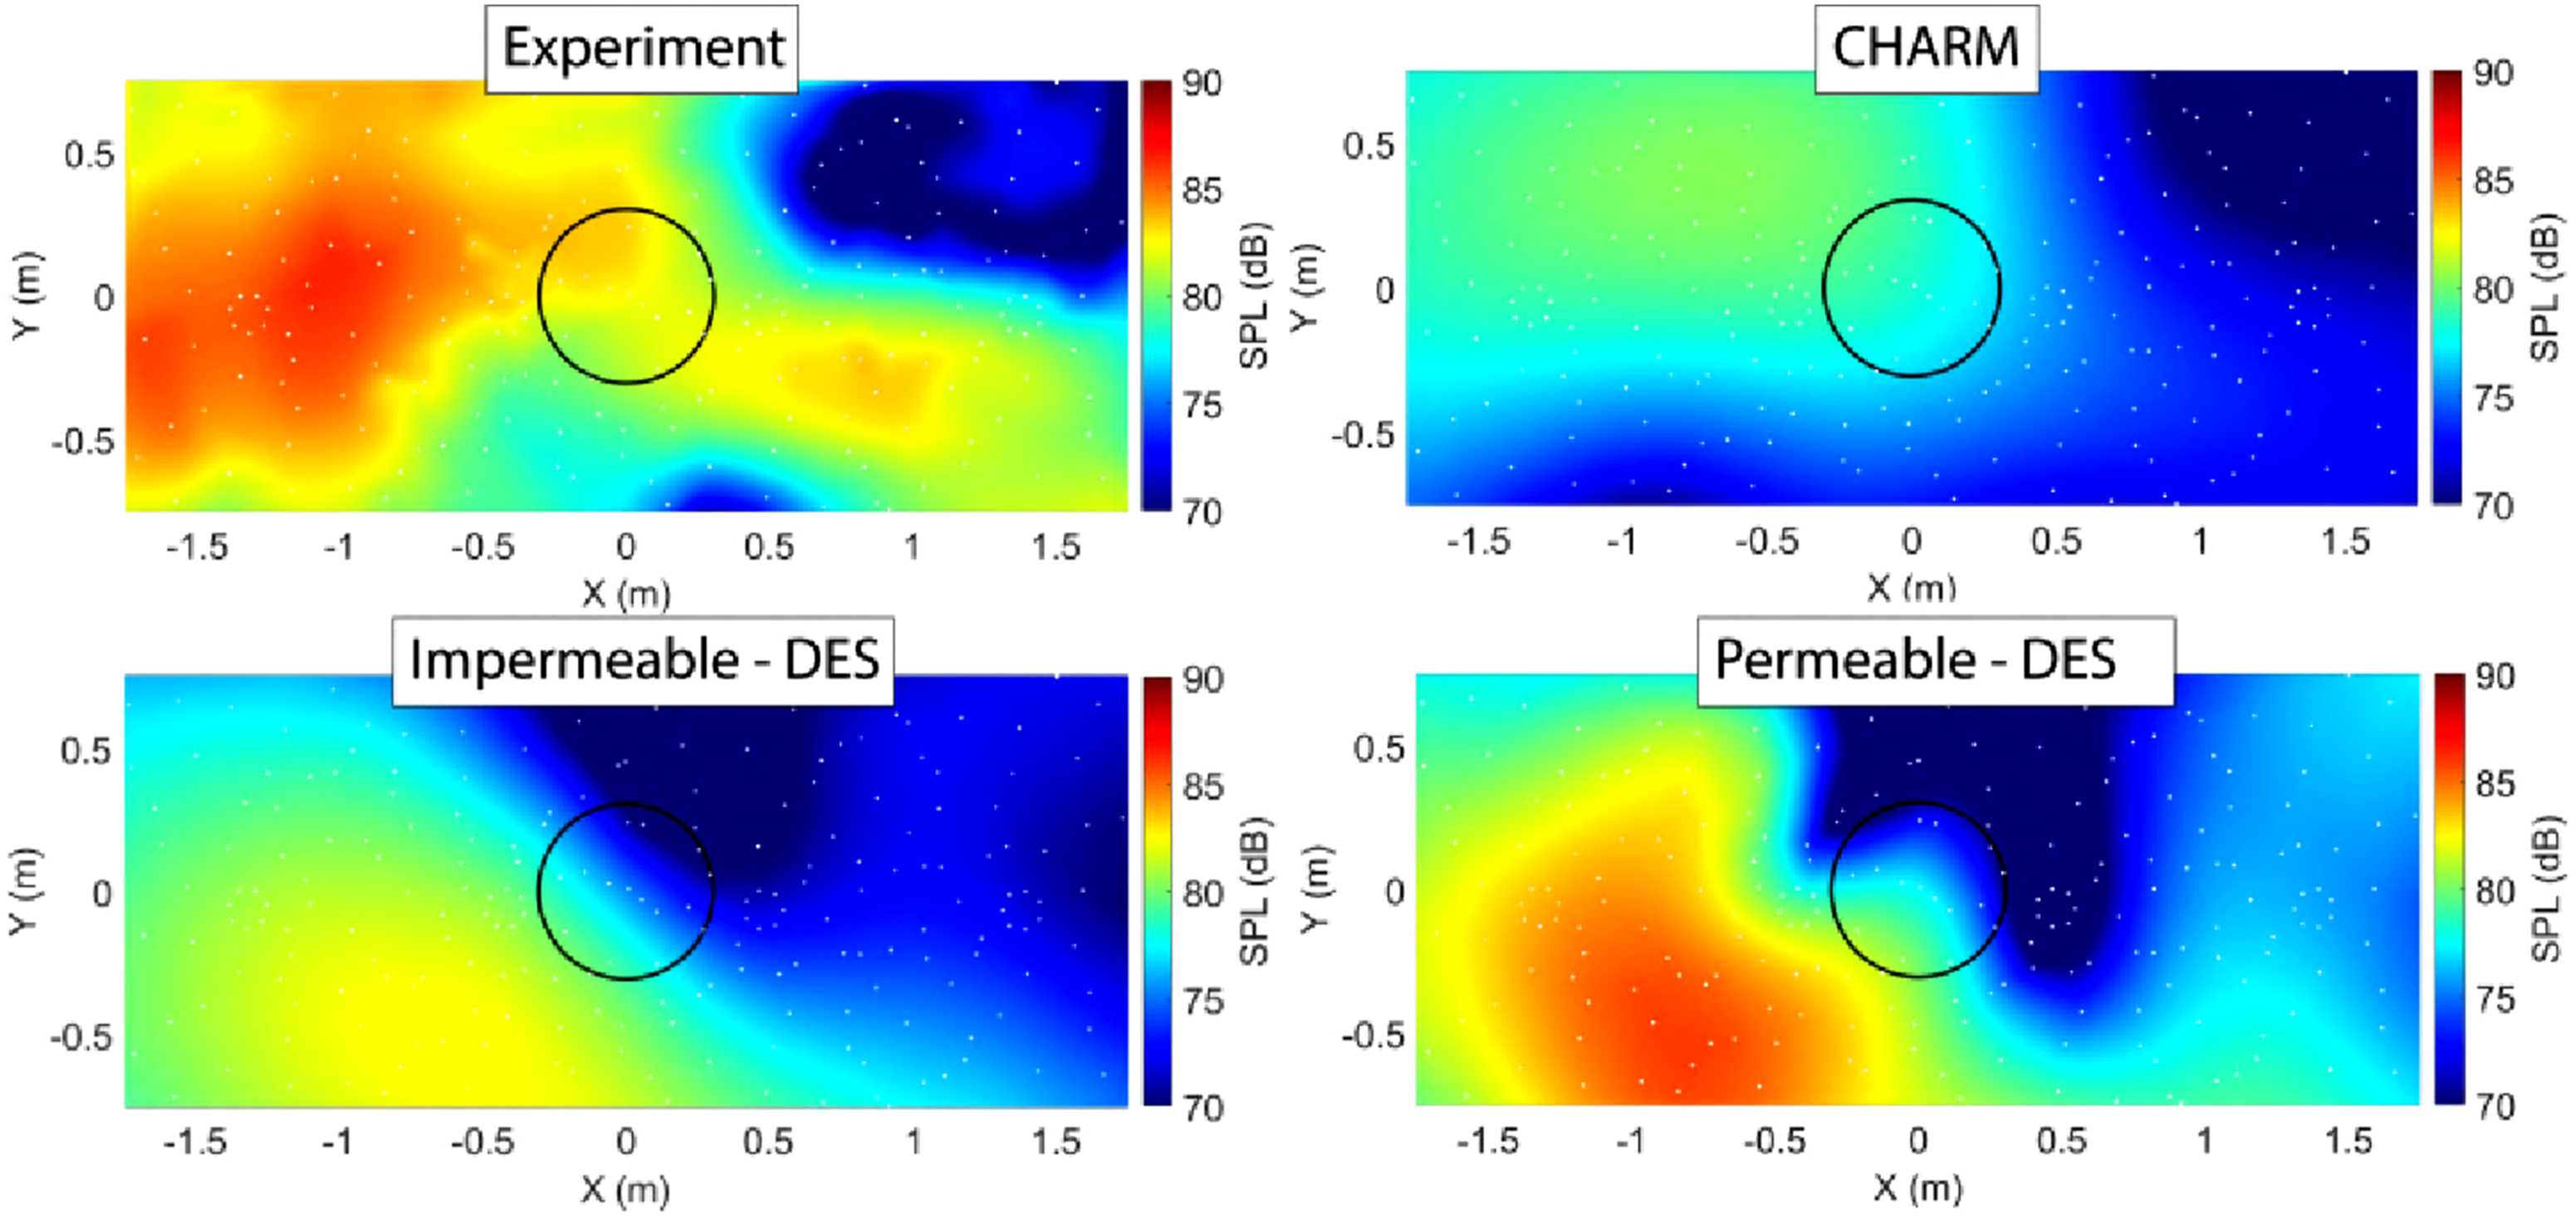
The numerical simulation underpredicts the measured levels. The impermeable and permeable surface CFD results exhibit similar overall trends, although the permeable surface yields higher levels in the downstream region. CHARM produces a directivity pattern that more closely resembles the experimental one. However, its absolute levels are substantially lower. As seen in Figure 15, CHARM consistently underpredicts the SPL by approximately 5–10 dB. Far-field SPL comparison at BPF for Edgewise.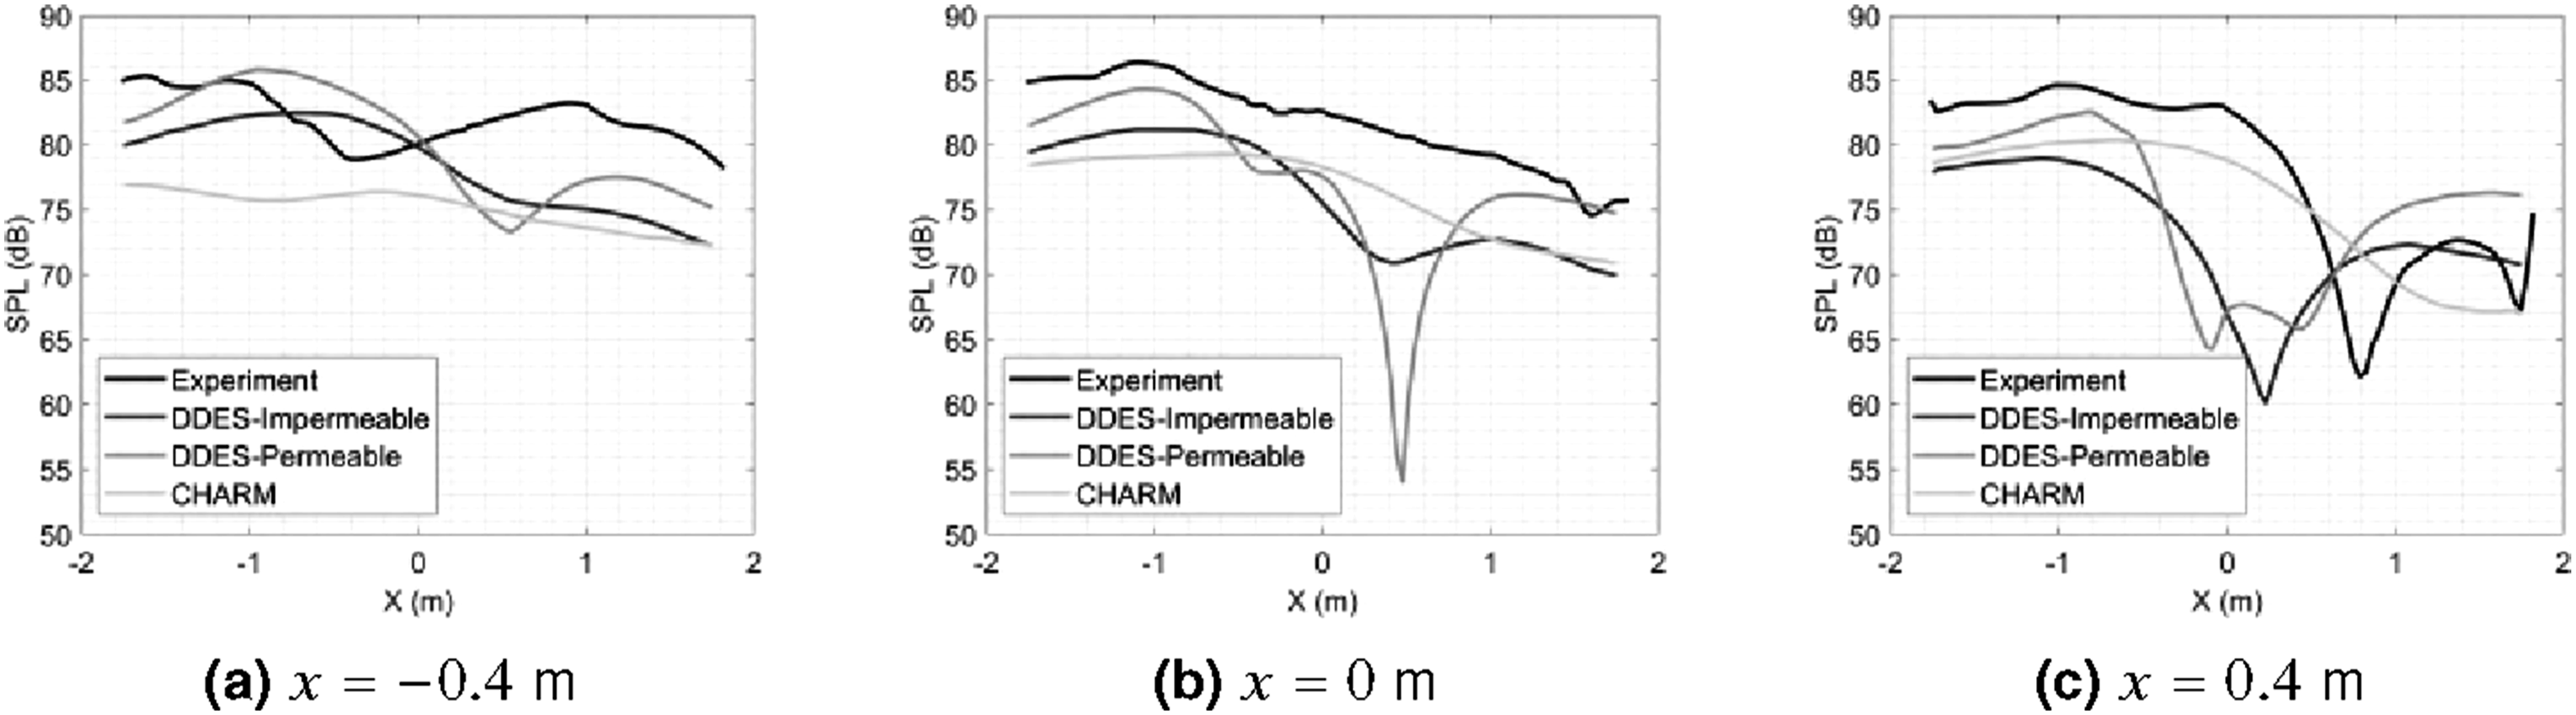
Beamforming maps
Beamforming maps provide a two-dimensional representation of the acoustic source distribution reconstructed from a phased microphone array. For a given frequency, the pressure time histories from all microphones are time-shifted and summed under the assumption that the sound originates from a prescribed point on a grid. Repeating this operation over a plane coincident with, or close to, the rotor disk yields a spatial map of beamformed sound pressure level, which highlights the dominant noise-emitting regions of the rotor and surrounding geometry. In this work, beamforming maps are used to compare the acoustic fields predicted by CHARM and CFD (with both impermeable and permeable surface formulations) against experimental data at the BPF (333 Hz) and the 4 BPF (1332 Hz), to identify the location and nature of tonal and broadband noise sources.
Dividing the array into quadrants (e.g., upstream/downstream and advancing/retreating sides) is important when conducting beamforming calculations. Each quadrant corresponds to a distinct observer sector, so the beamforming output can be interpreted consistently with far-field directivity rather than mixing microphones that “see” distinct propagation paths. Furthermore, it has been shown that using quadrants helps reduce spatial smearing of the beamforming peak that can occur when combining microphones with widely varying steering vectors. 61 As a result, quadrant-based beamforming improves the localization of distributed broadband sources and clarifies how the dominant source regions migrate with different operating conditions, consistent with previously established experimental methodologies. 52
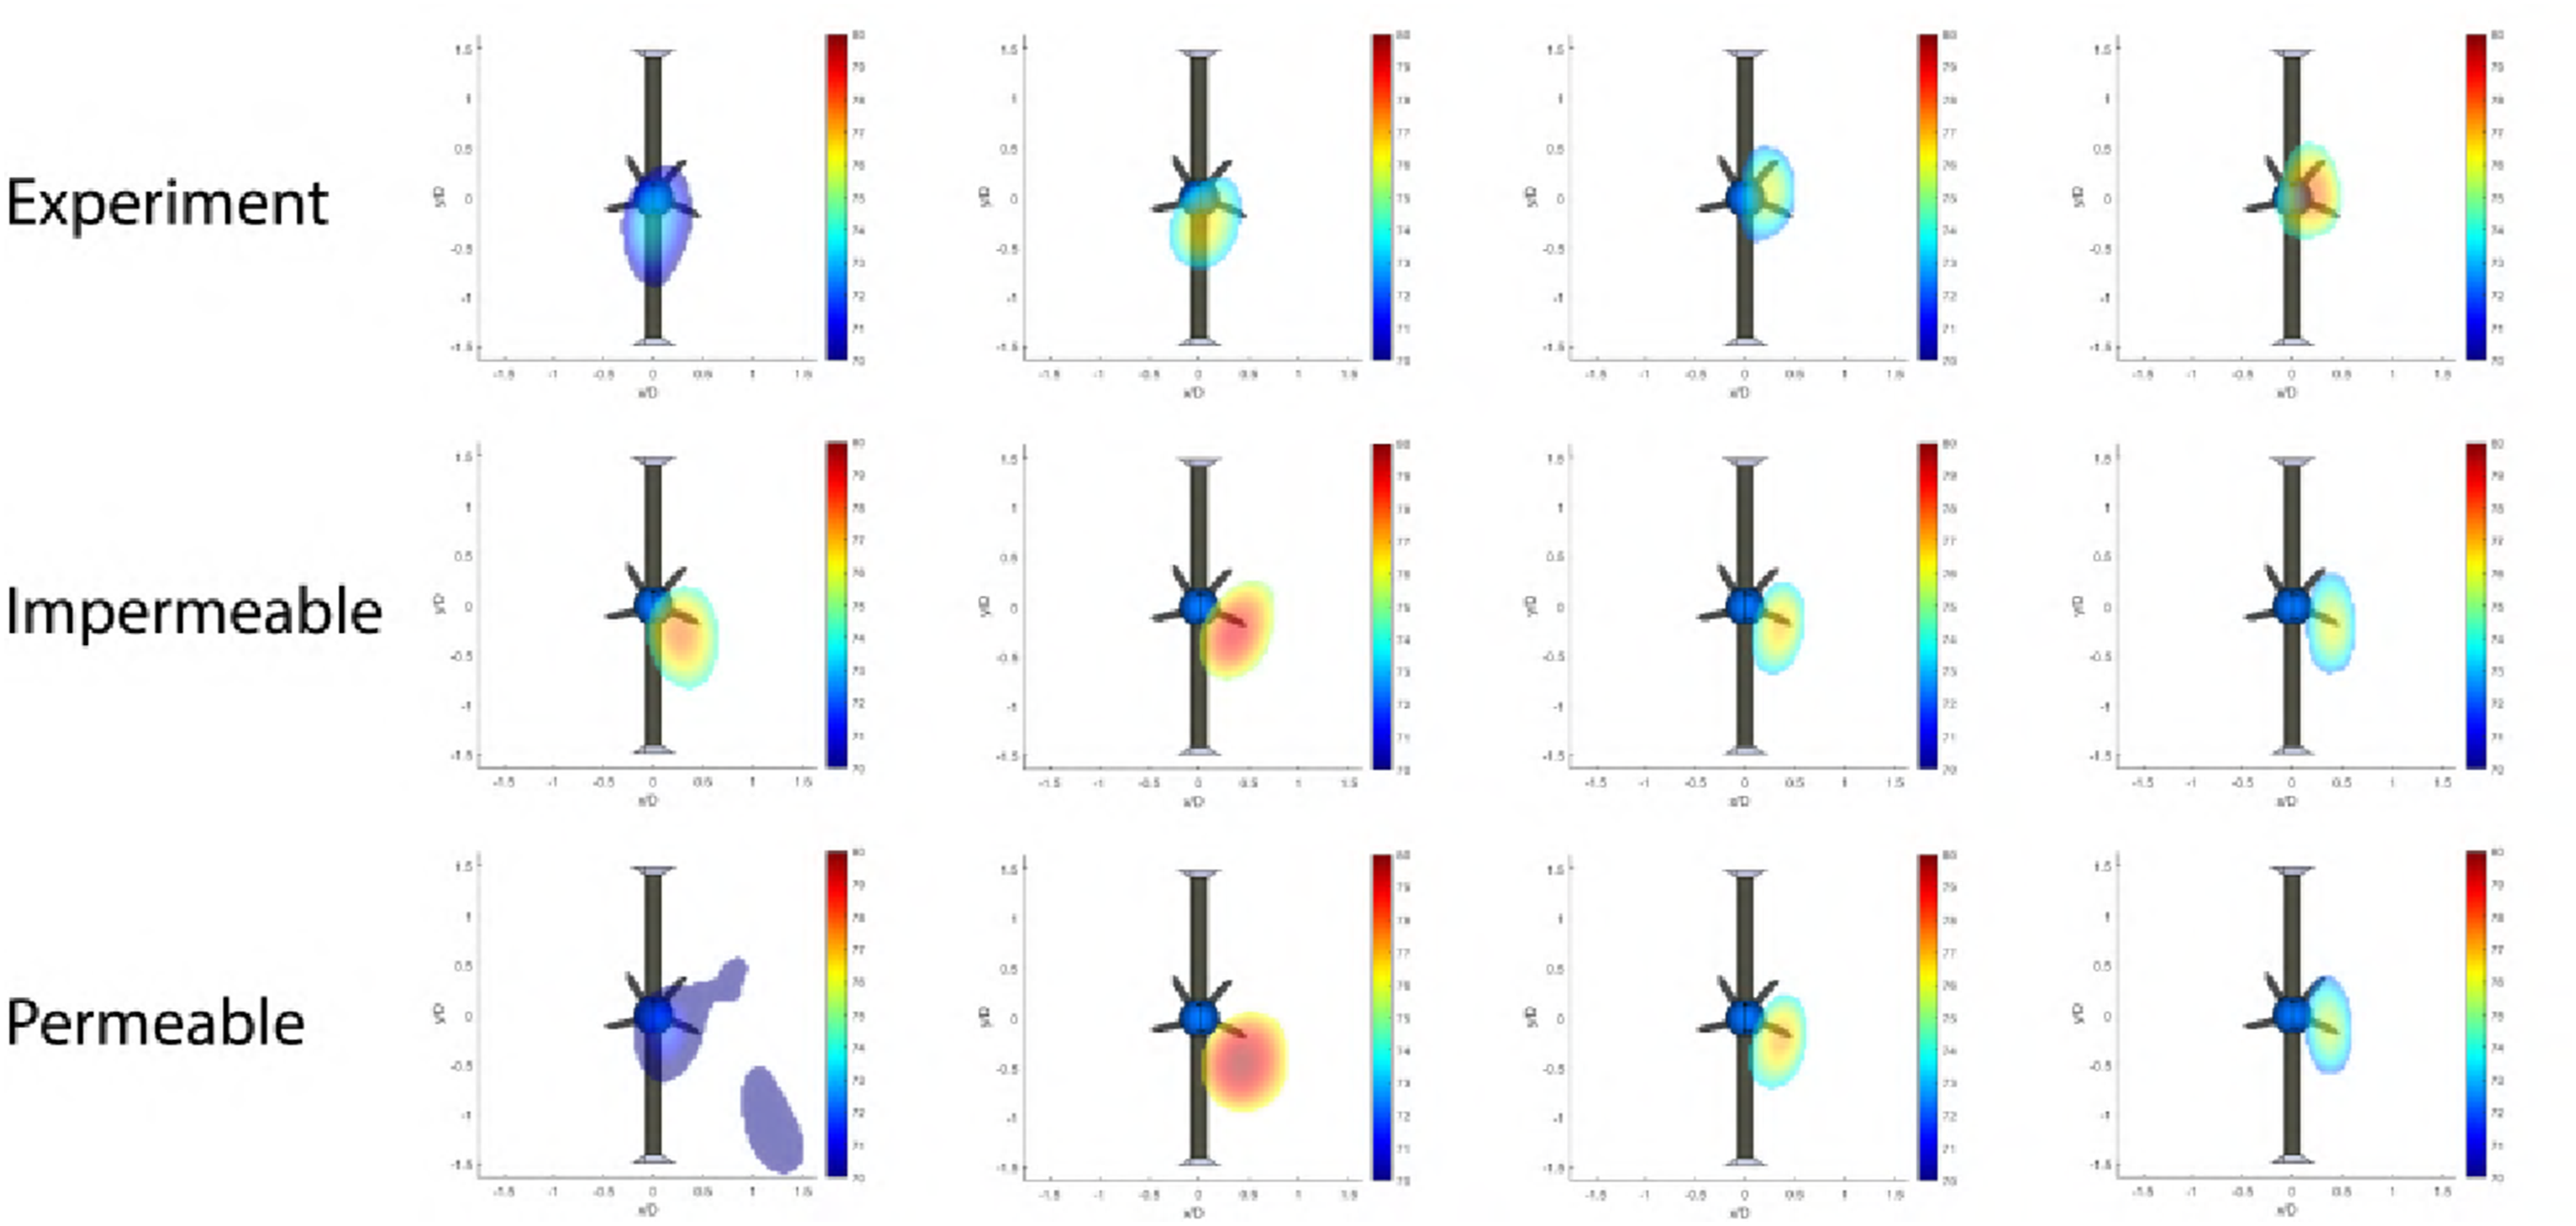
In hover, the beamforming maps at the first BPF (333 Hz), shown in Figure 16, exhibit very good agreement between experiment, CHARM, and the CFD solutions for both impermeable and permeable surface formulations. All approaches identify the rotor disk as the dominant tonal source and predict a similar spatial extent of the acoustic lobe. A systematic upward shift of the reconstructed source region with respect to the physical rotor plane is observed in the maps, which is attributed to array-related effects (finite aperture or fixed source plane) rather than to a true displacement of the sources. At 4 BPF (1332 Hz), Figure 17 shows some differences between experiment and computation that are worth the discussion. The experimental maps capture additional localized high-frequency activity near the fairing and support structure, indicating noise contributions from non-rotor components that are not modeled in either CHARM or CFD. Consequently, the numerical maps attribute a larger fraction of the 4 BPF noise contribution to the rotor wake region. In particular, the CFD solutions (especially with the permeable surface formulation) show elongated lobes in the wake, consistent with quadrupole-like sources associated with turbulence and vortex breakdown in the wake. These volume sources radiate more efficiently at higher frequencies and can contribute significantly to the beamforming levels. Because the rotor in hover does not experience blade-vortex interaction (BVI), the blades are expected to generate predominantly steady, periodic loading and thus mostly tonal radiation at the BPF and its harmonics, while the broadband content in the maps is mainly associated with wake turbulence and secondary structures. While blade self-noise is not considered in the present analysis, it may dominate the acoustic spectrum at higher frequencies as the contribution from wake turbulence noise decreases. Beamforming maps at BPF (333 Hz) for Hover. Beamforming maps at 4 BPF (1332 Hz) for Hover.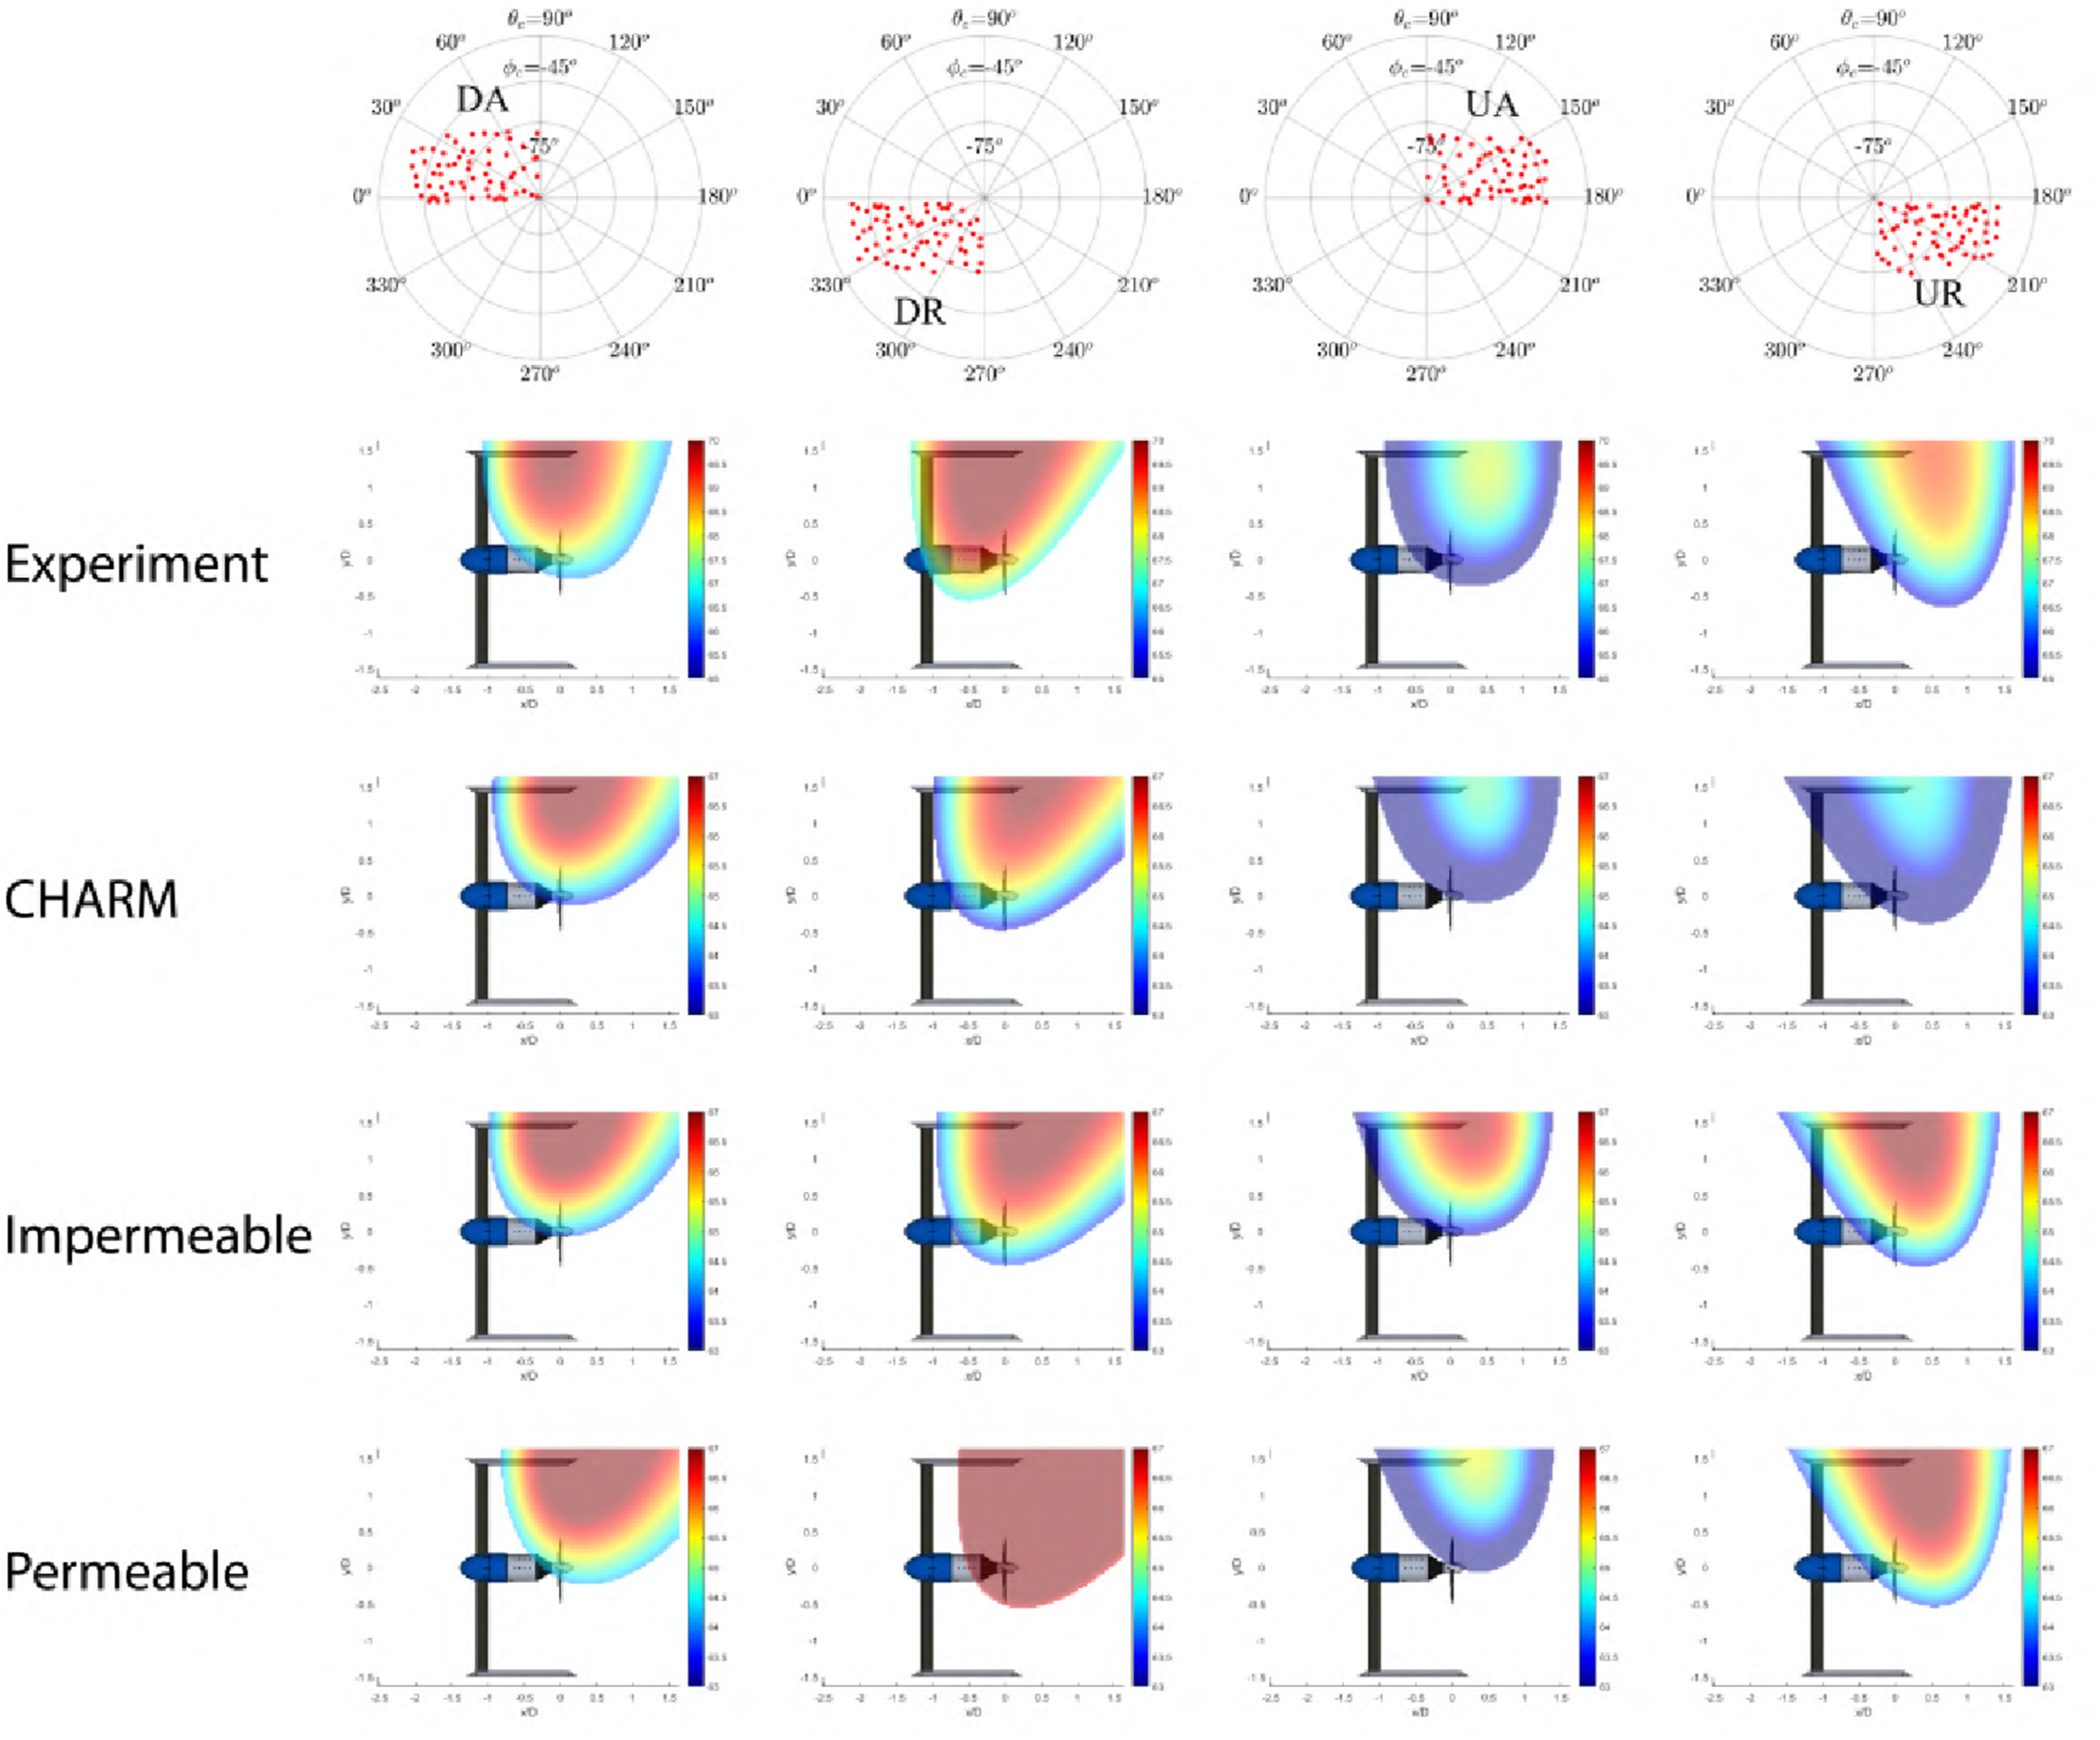
For the edgewise case, the comparison at the BPF is less favorable. At 333 Hz, the beamforming maps in Figure 18 show that the CFD solutions with impermeable and permeable surfaces are in good agreement, but both differ from the CHARM predictions and the experimental maps. This highlights the difficulty of predicting accurate tonal noise directivity in edgewise flight. The discrepancies likely arise from a combination of modeling sensitivity in the unsteady blade loading and limitations of conventional beamforming when applied to coherent rotating tonal sources. In this regime, beamforming tends to smear or misplace narrowband tonal sources, so the maps are not particularly robust for tonal source localization at the fundamental BPF. At 4 BPF (1332 Hz), however, the beamforming maps in Figure 19 are more informative. They show that most of the noise sources are concentrated on the upstream side of the rotor, where the blades meet the freestream and where the tip vortices are formed. The numerical results show strong wake-related activity in this upstream sector, while the experimental maps could be capturing contributions from the fairing and other hardware, which are not modeled in CHARM or CFD. A phenomenon has been reported in edgewise configurations, where the dominant high-frequency levels shift from the advancing to the retreating side as RPM and advance ratio increase for the edgewise 10 m/s case.
52
However, a more detailed assessment considering additional runs is required to track how the high-frequency beamforming peaks migrate between quadrants. Beamforming maps at BPF (333 Hz) for Edgewise. Beamforming maps at 4 BPF (1332 Hz) for Edgewise.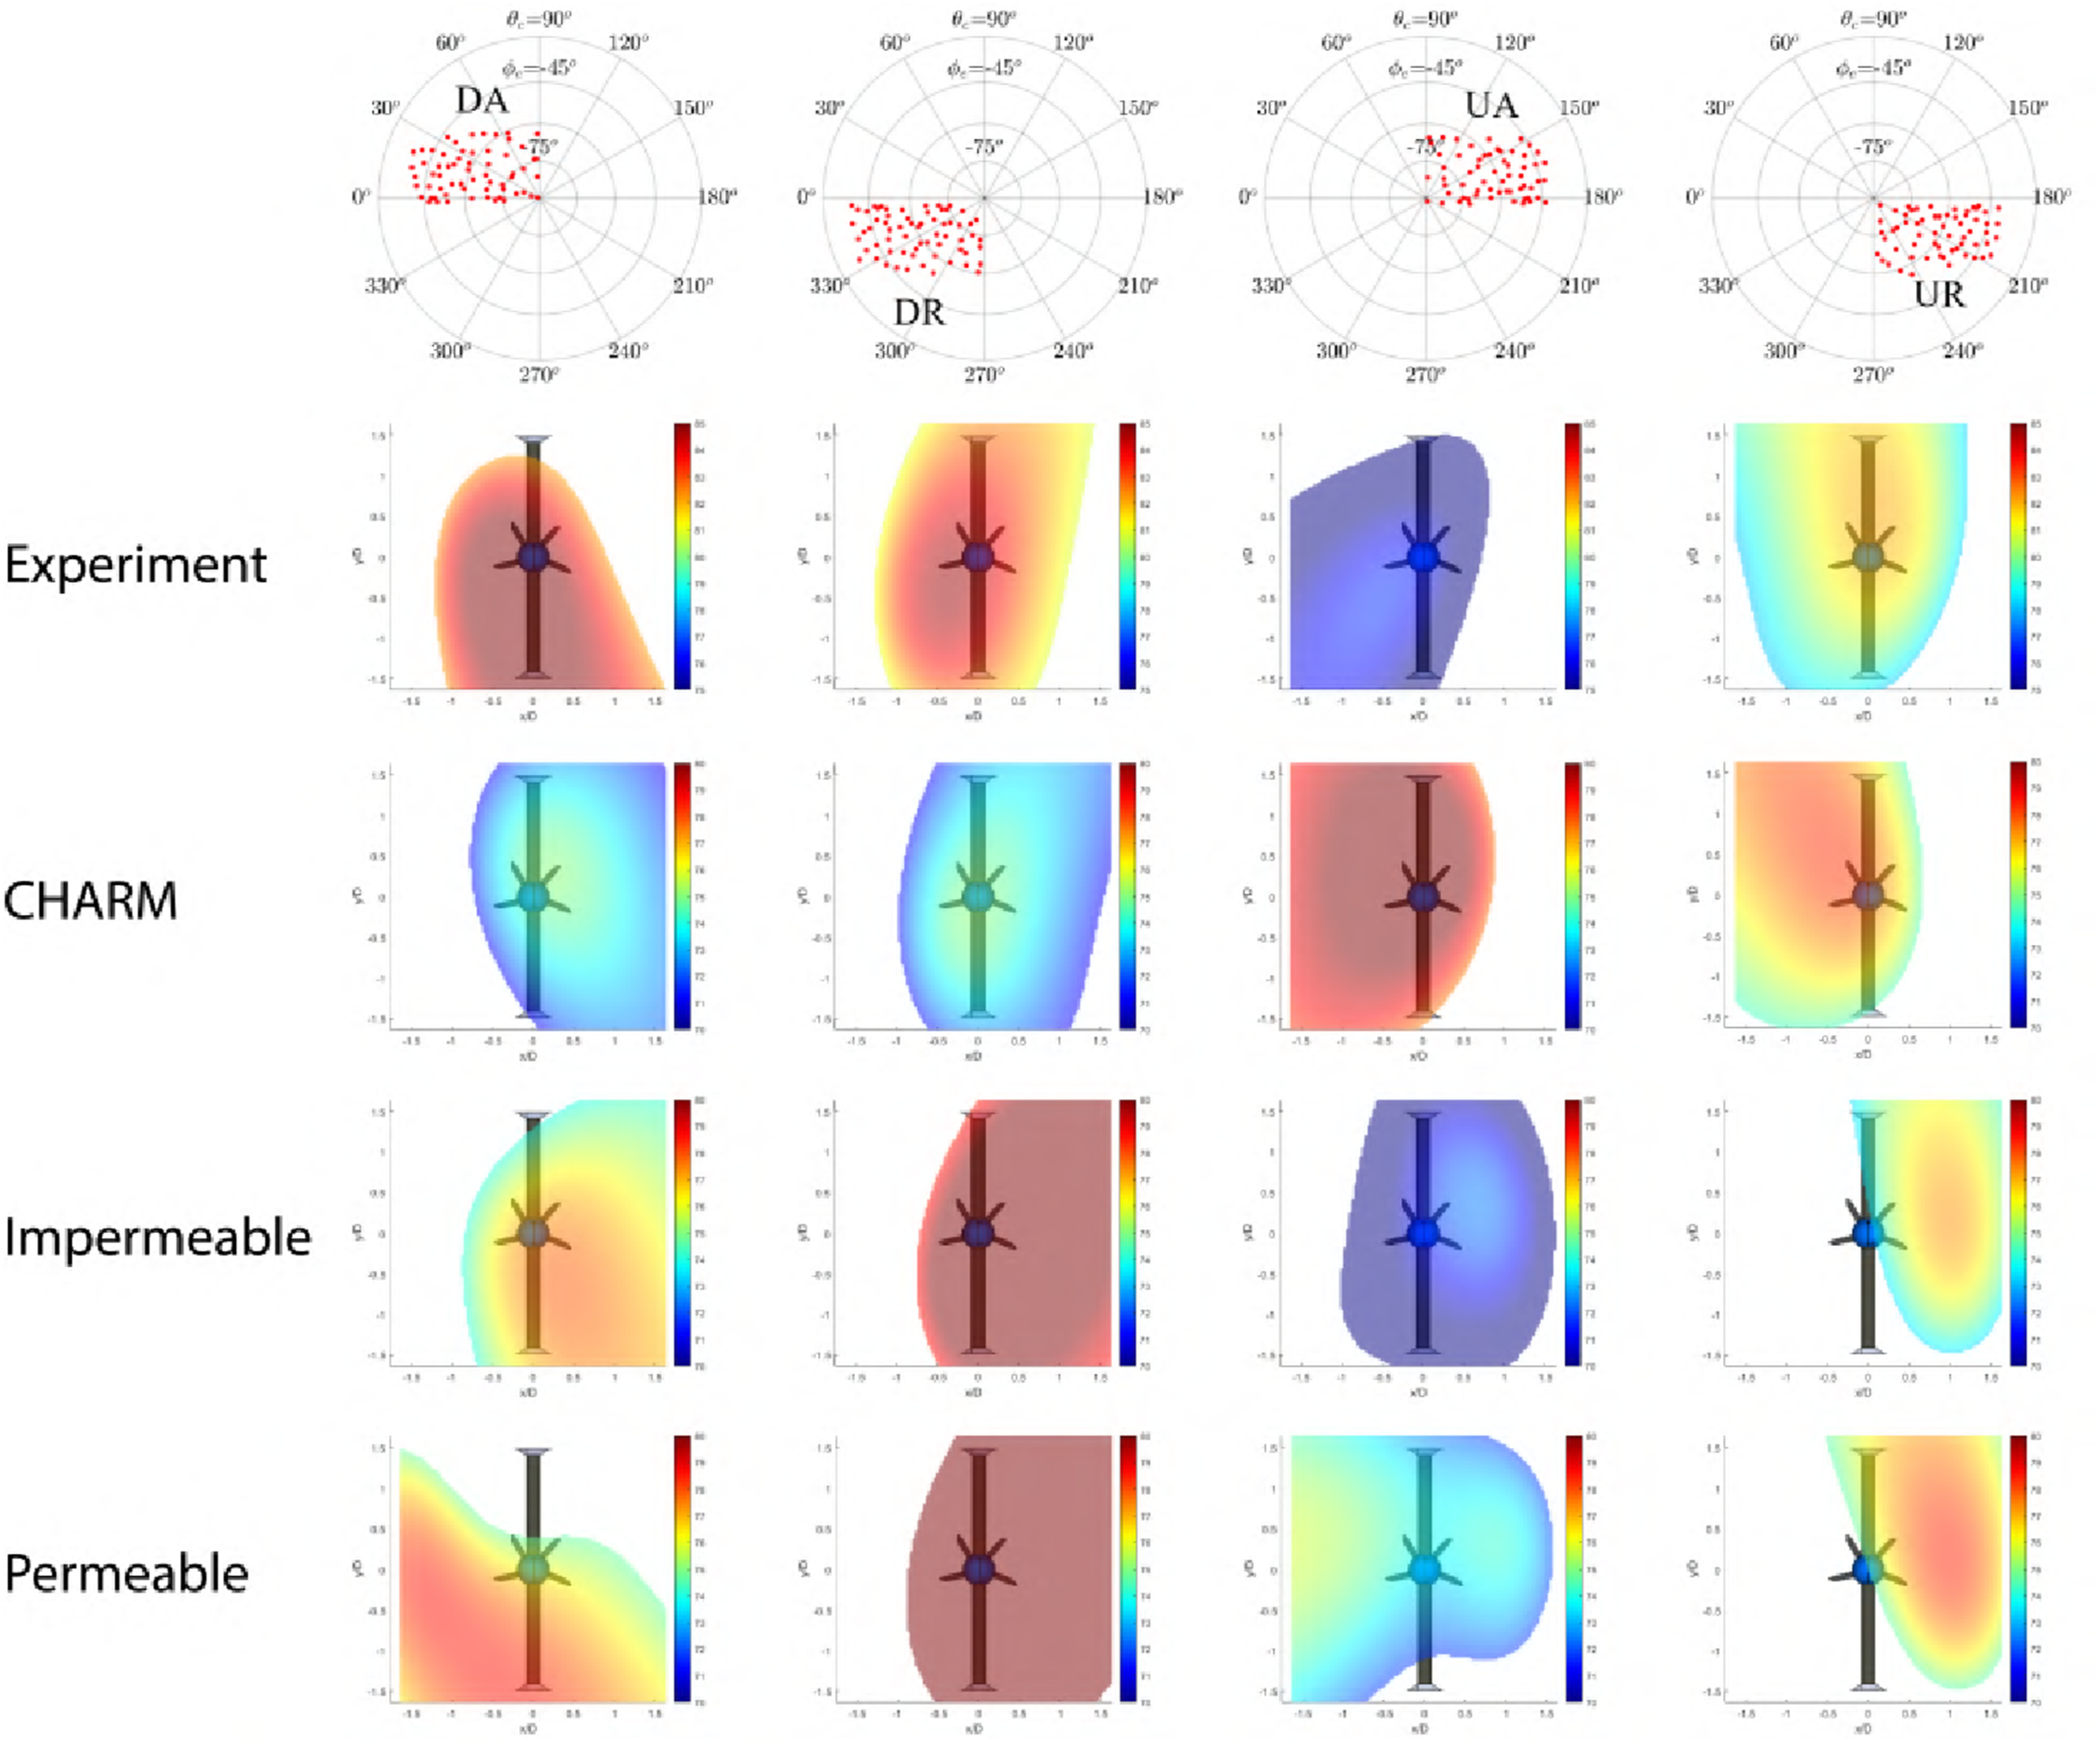
Propeller in ground-effect
Performance comparison
The objective is to run ground-effect cases using CHARM at varying heights from the ground and compare the results with classical analytical ground-effect models based on the Cheeseman and Bennett approach and Johnson’s curve fitting.10,62 This analysis highlights the impact of ground proximity on propeller performance. Also, it serves as a guide for selecting the most relevant cases for high-fidelity simulations which are constrained to a limited number of runs.
Figure 20 illustrates the thrust ratio between isolated and ground-effect cases at various heights for CHARM, Cheeseman & Bennett method and Johnson’s curve fitting for both hover and edgewise 10 m/s cases. DES results are shown in the comparison but limited only for 4000 RPM. Performance results in ground effect compared against Cheeseman & Bennett and Johnson approaches.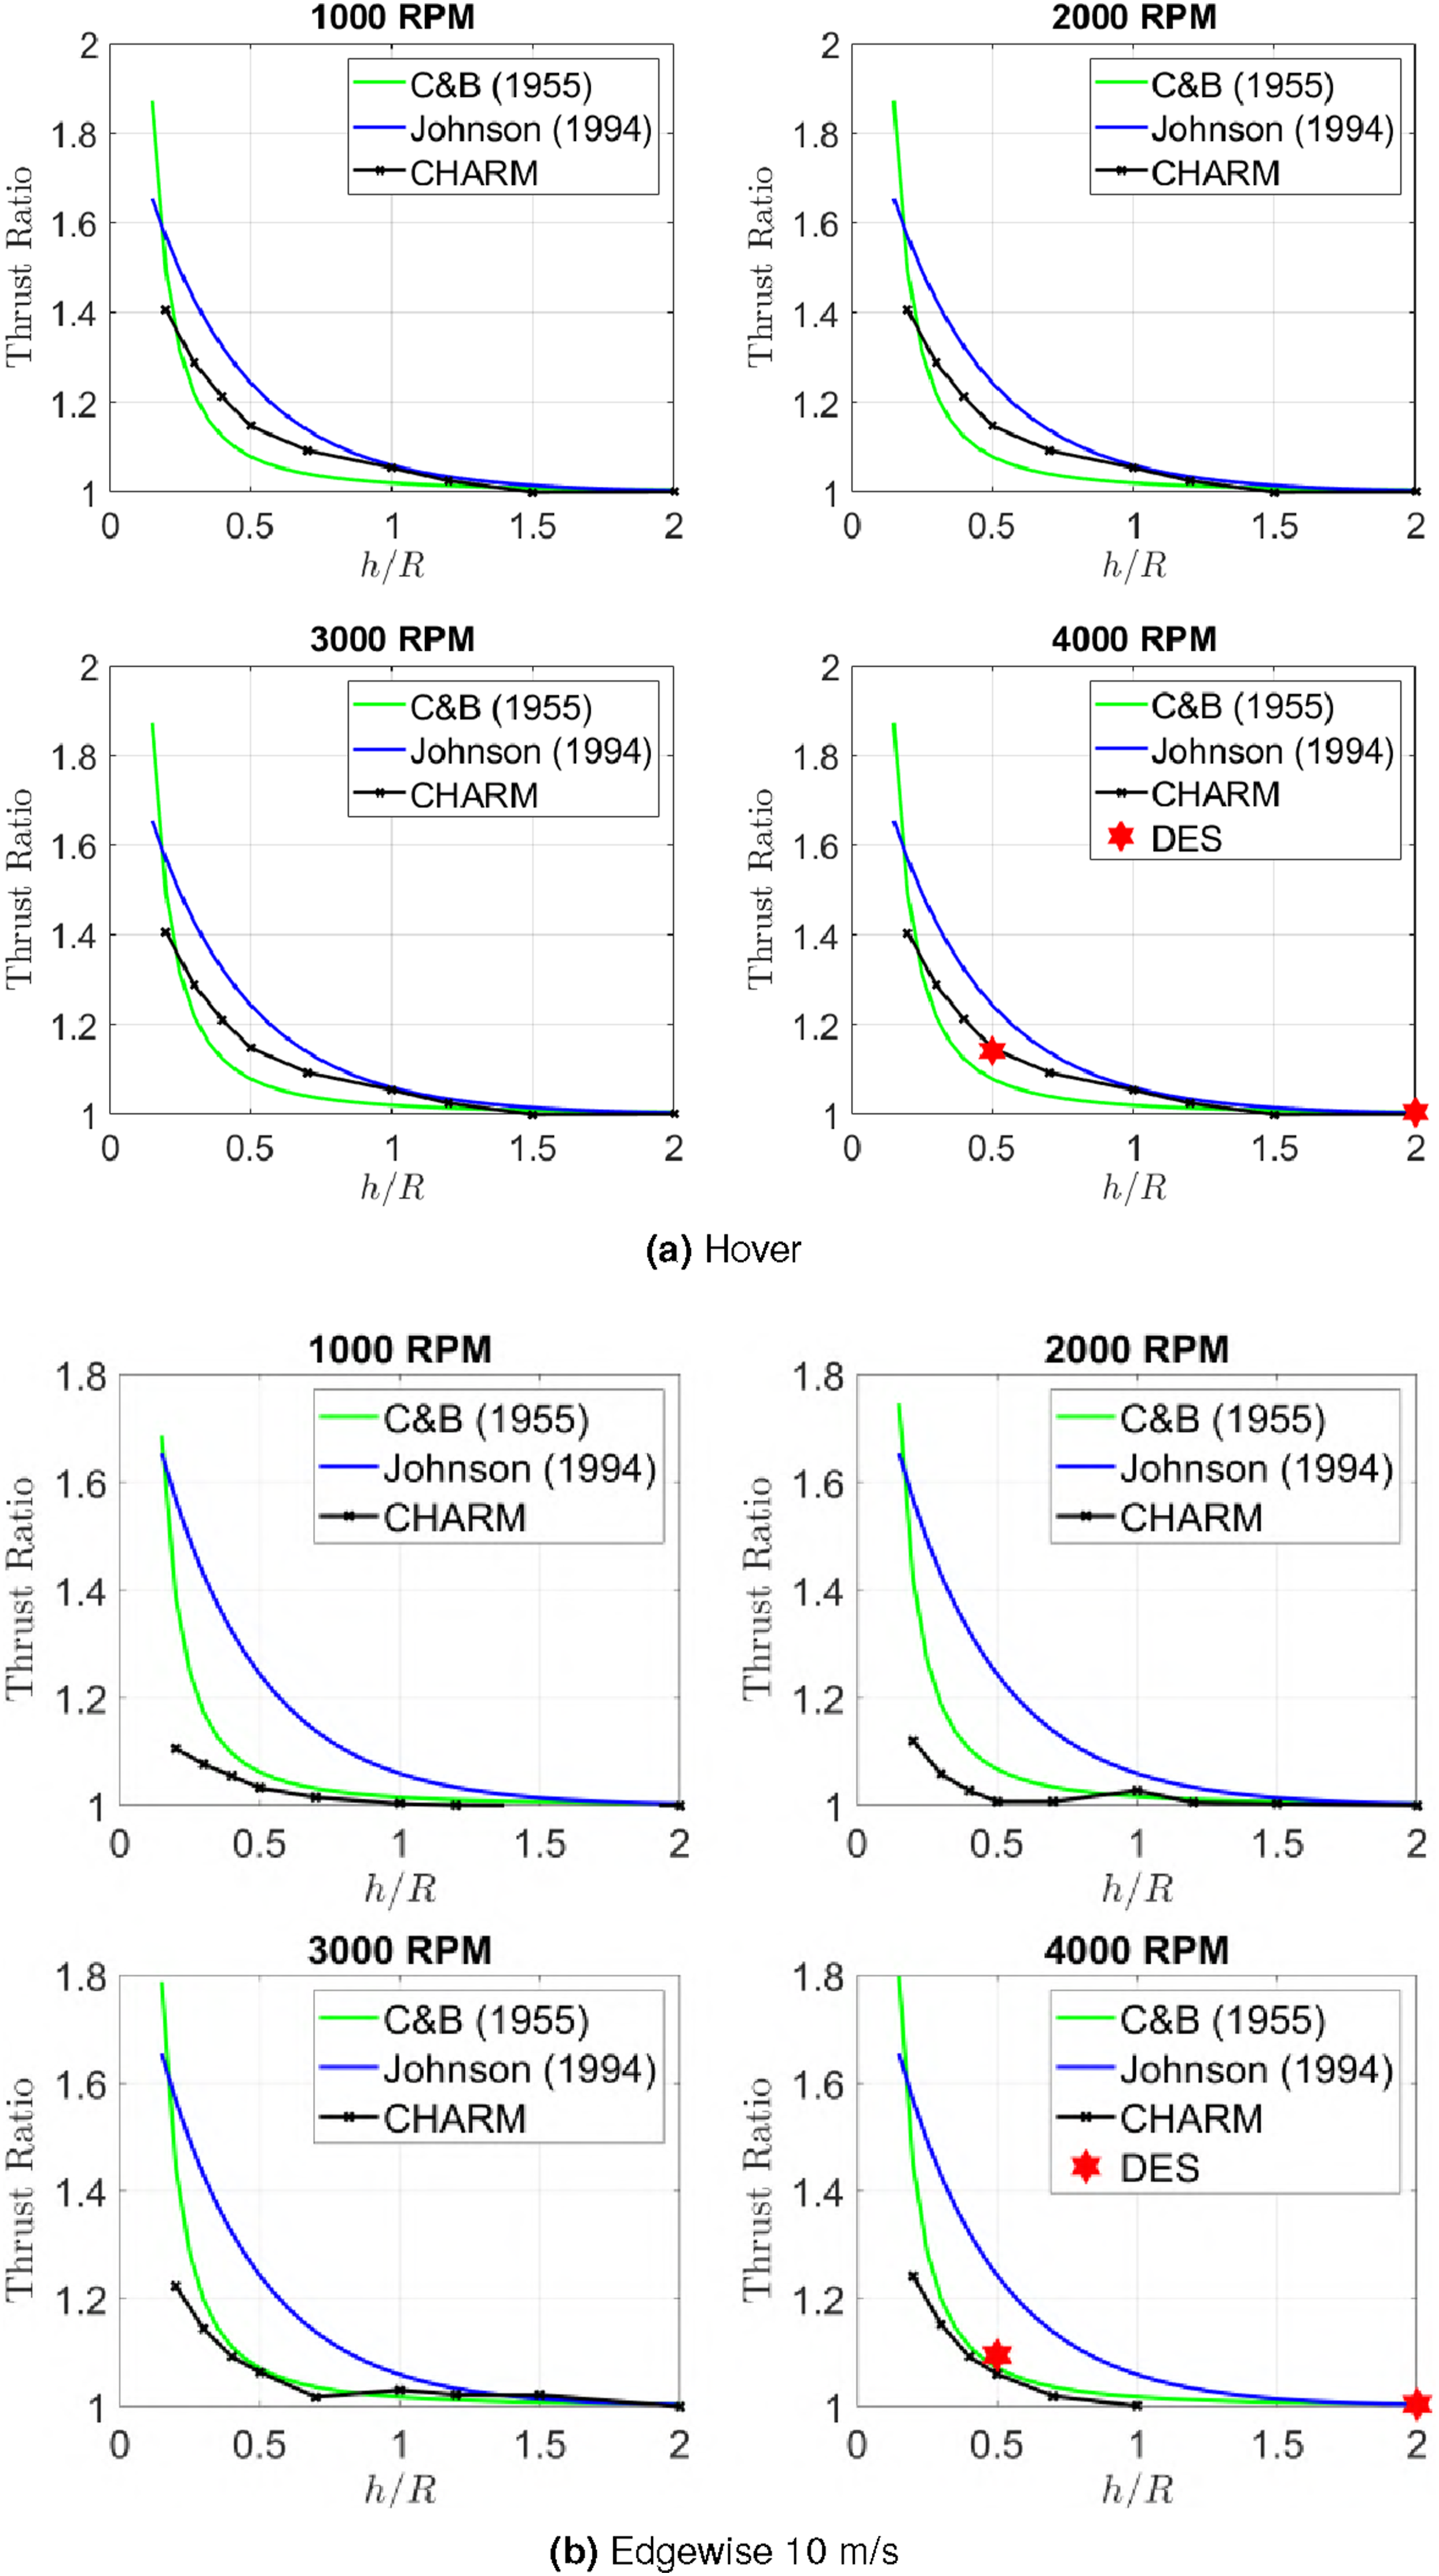
CHARM predicts a trend between both methods and is consistent for hover, however they struggle for edgewise case at lower RPM. This could be due to the airfoil aerodynamic coefficient table provided using XFOIL. Low RPM cases in forward flight tend to have considerable separation zones throughout the blade which could change behavior due to the presence of the ground and CHARM might fail to predict that difference using the current airfoil tables.
Polar plots of the force coefficient normal to the rotor plane per unit span, averaged per revolution, Polar plots of thrust coefficient per unit span 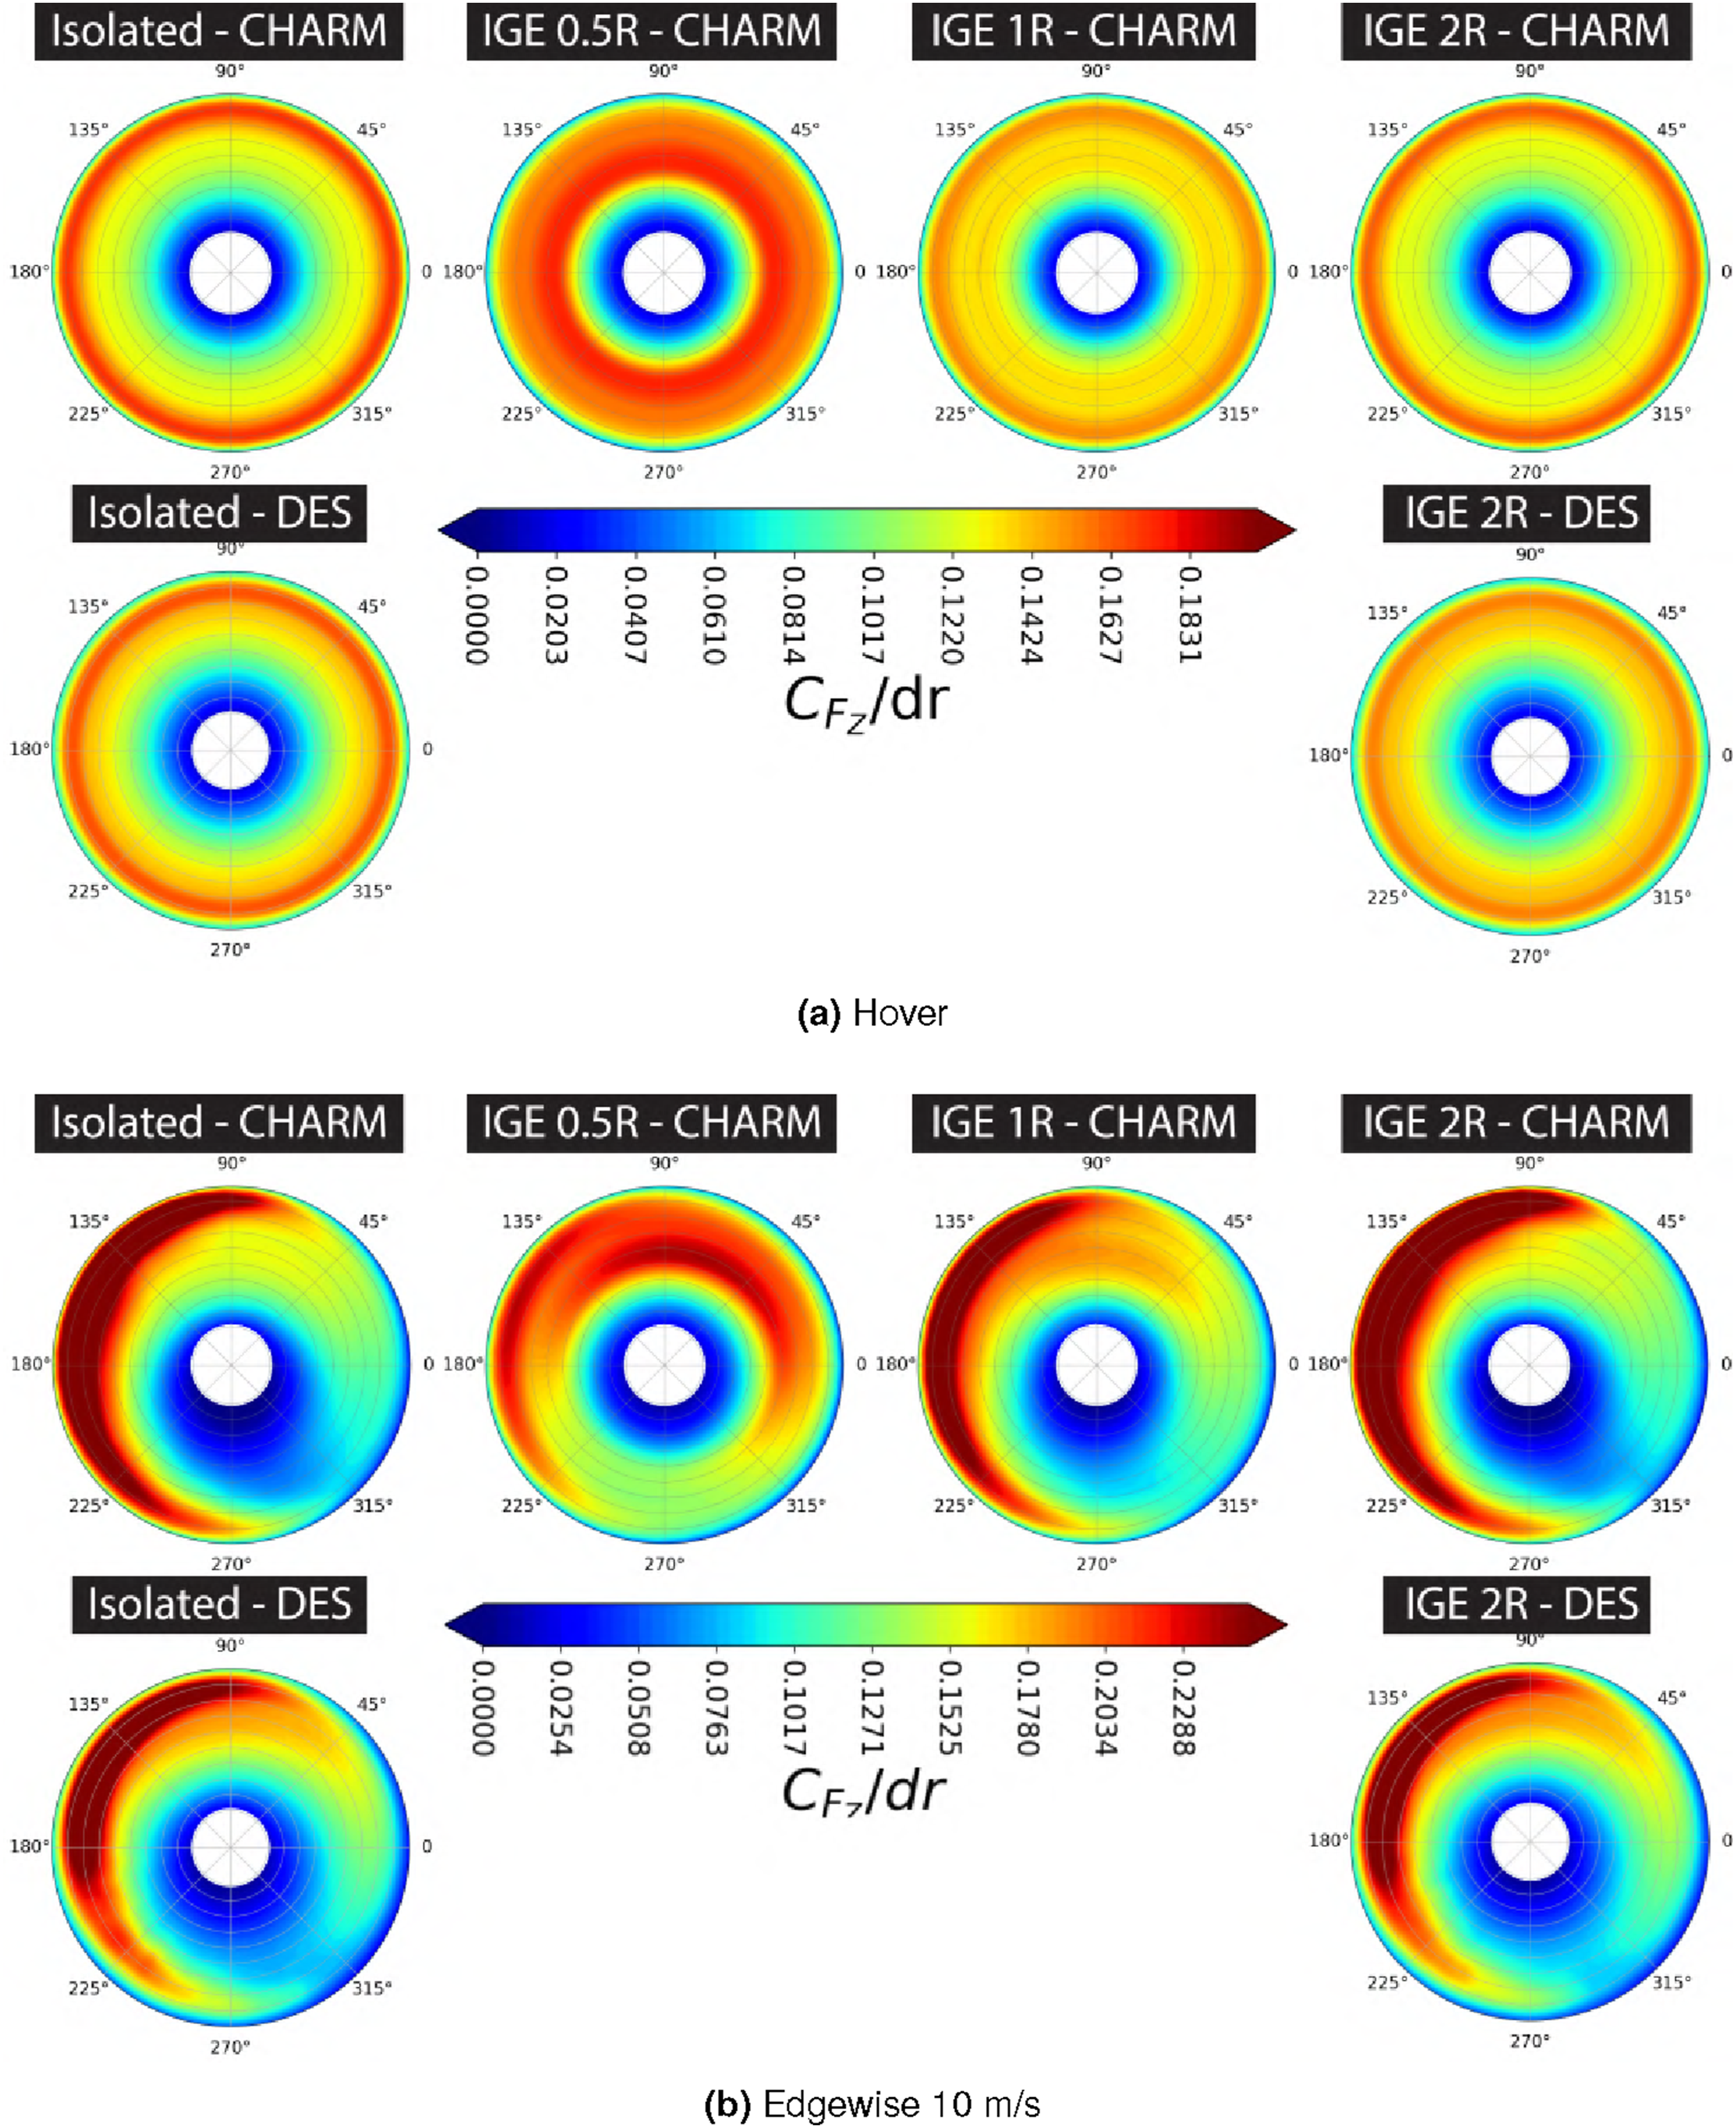
When the ground is positioned at a distance of 2 propeller radii, the differences in the plots are minimal. However, as the ground gets closer, the normal force increases near the blade root, while decreasing toward the tip. This redistribution of forces explains the thrust variation observed under ground-effect conditions and this aligns well with findings from a previous study referenced in the introduction. 46
Figure 22 presents the spanwise distribution of the force coefficient normal to the rotor plane, Thrust coefficient per unit span between DDES and CHARM simulations on advancing blade 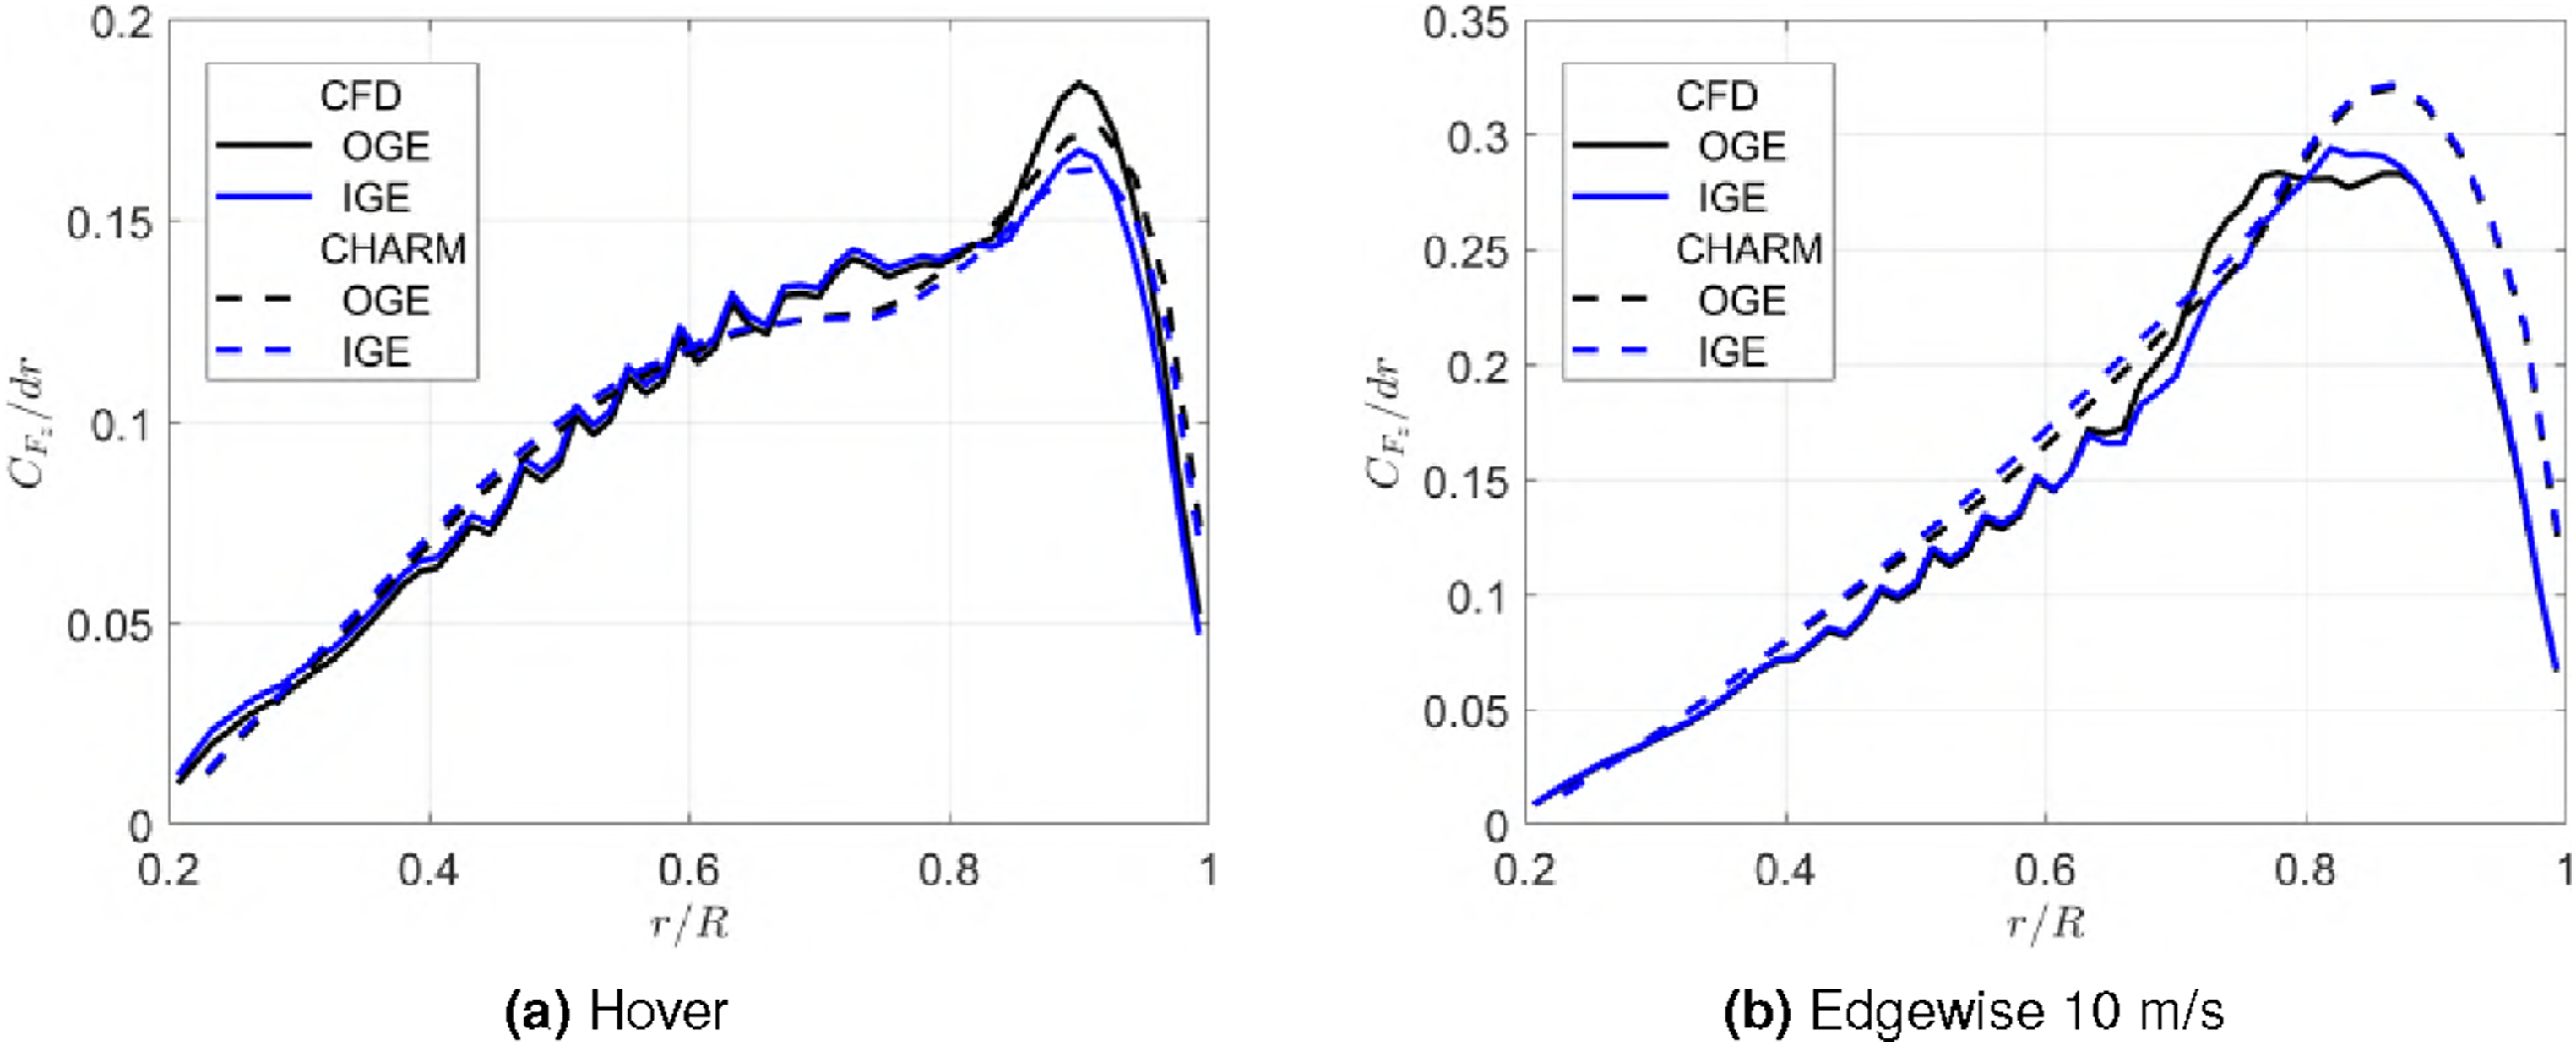
Overall, CFD and CHARM show very good agreement across most of the blade span for both flight conditions, indicating consistent capture of the primary aerodynamic trends by the two solvers. CHARM reproduces the general distribution and additionally shows a more pronounced local peak near
CHARM was also used to evaluate multiple ground clearances. The resulting spanwise force distributions are shown in Figure 23 for hover (a) and edgewise (b). For hover, the response is symmetric and independent of Thrust coefficient per unit span 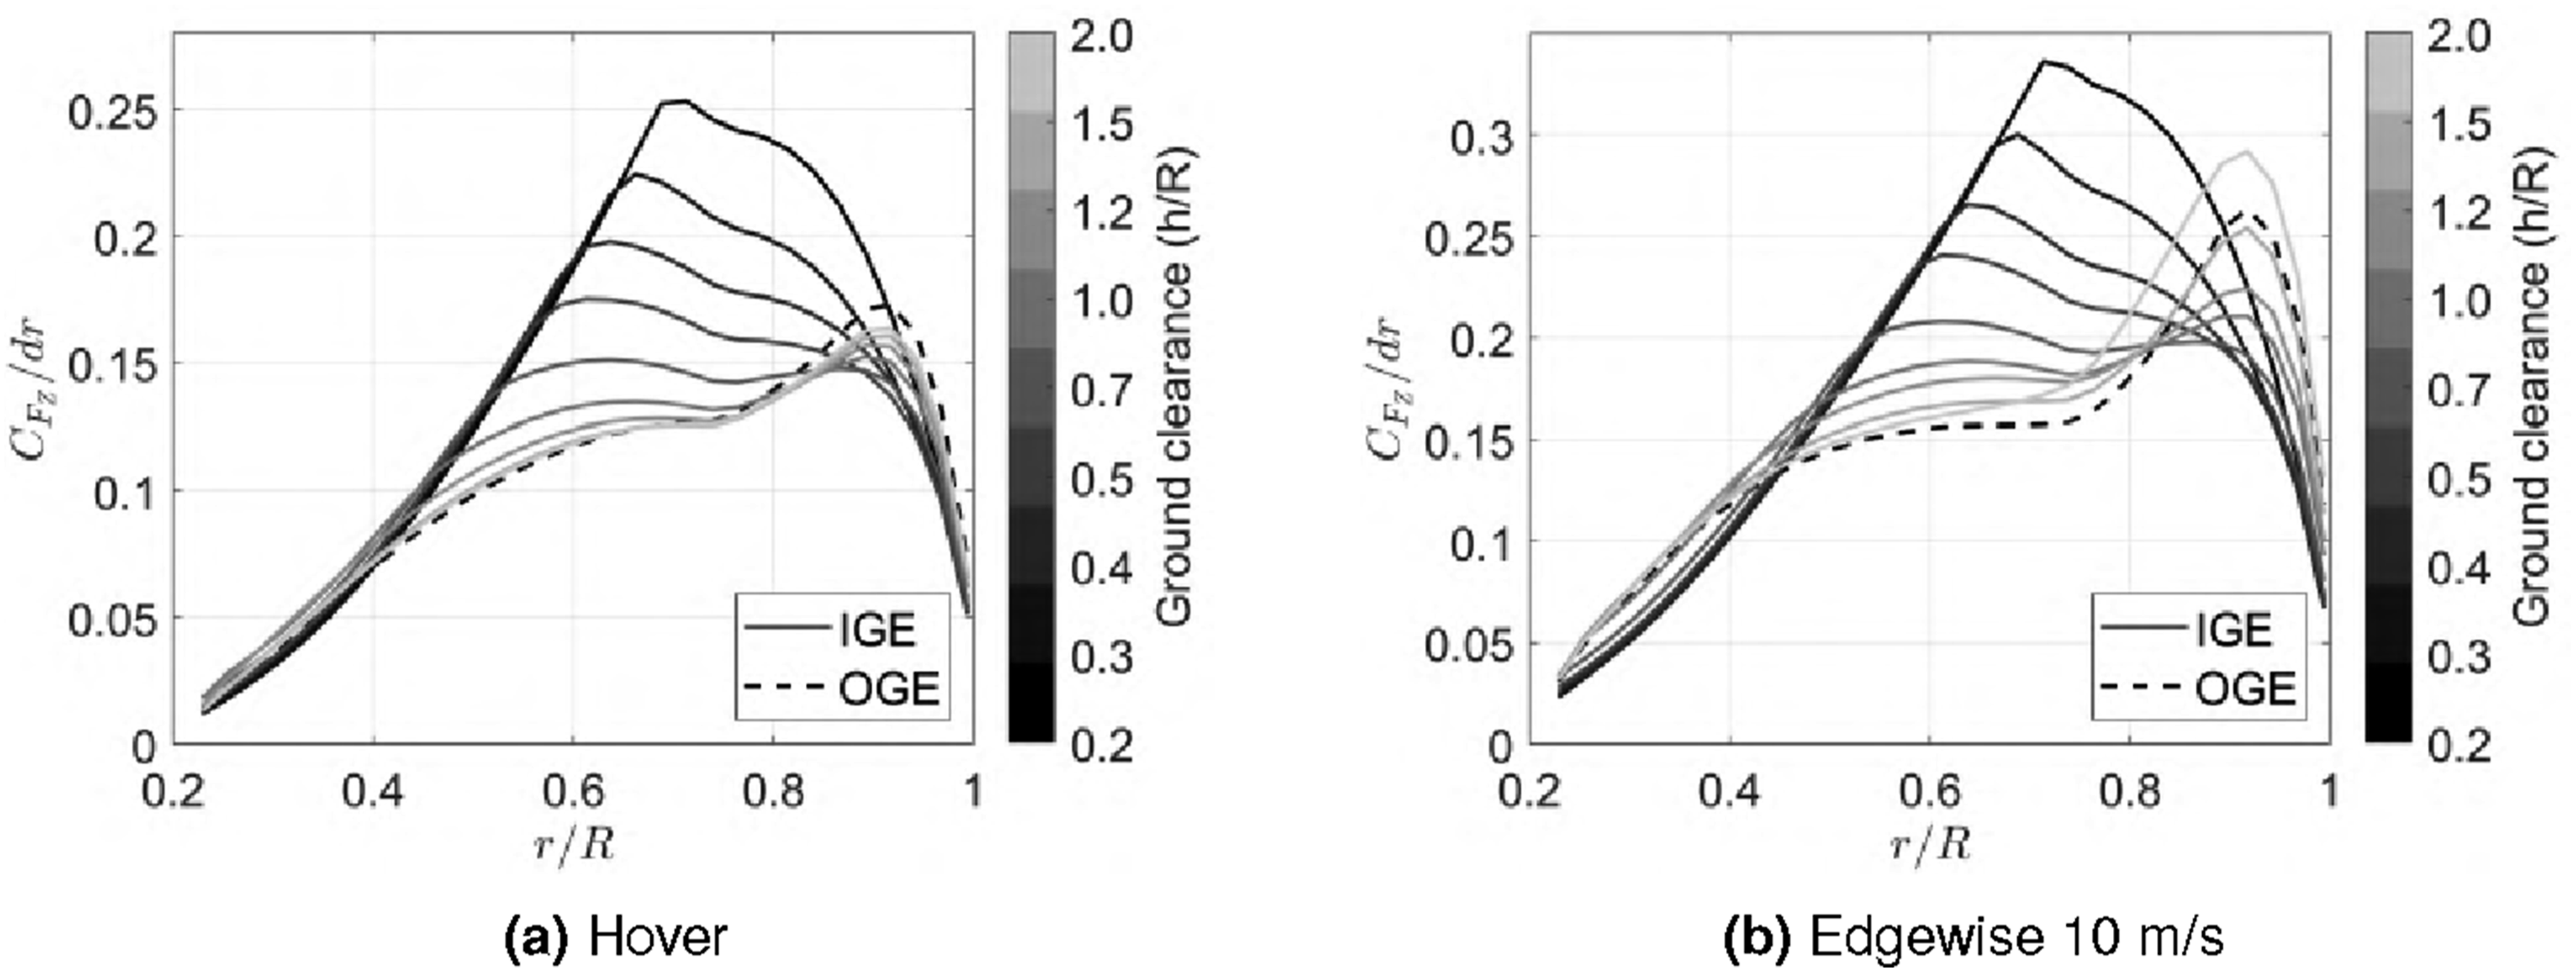
For the edgewise case the comparison in Figure 23 was performed at the sideline azimuth
Flow field
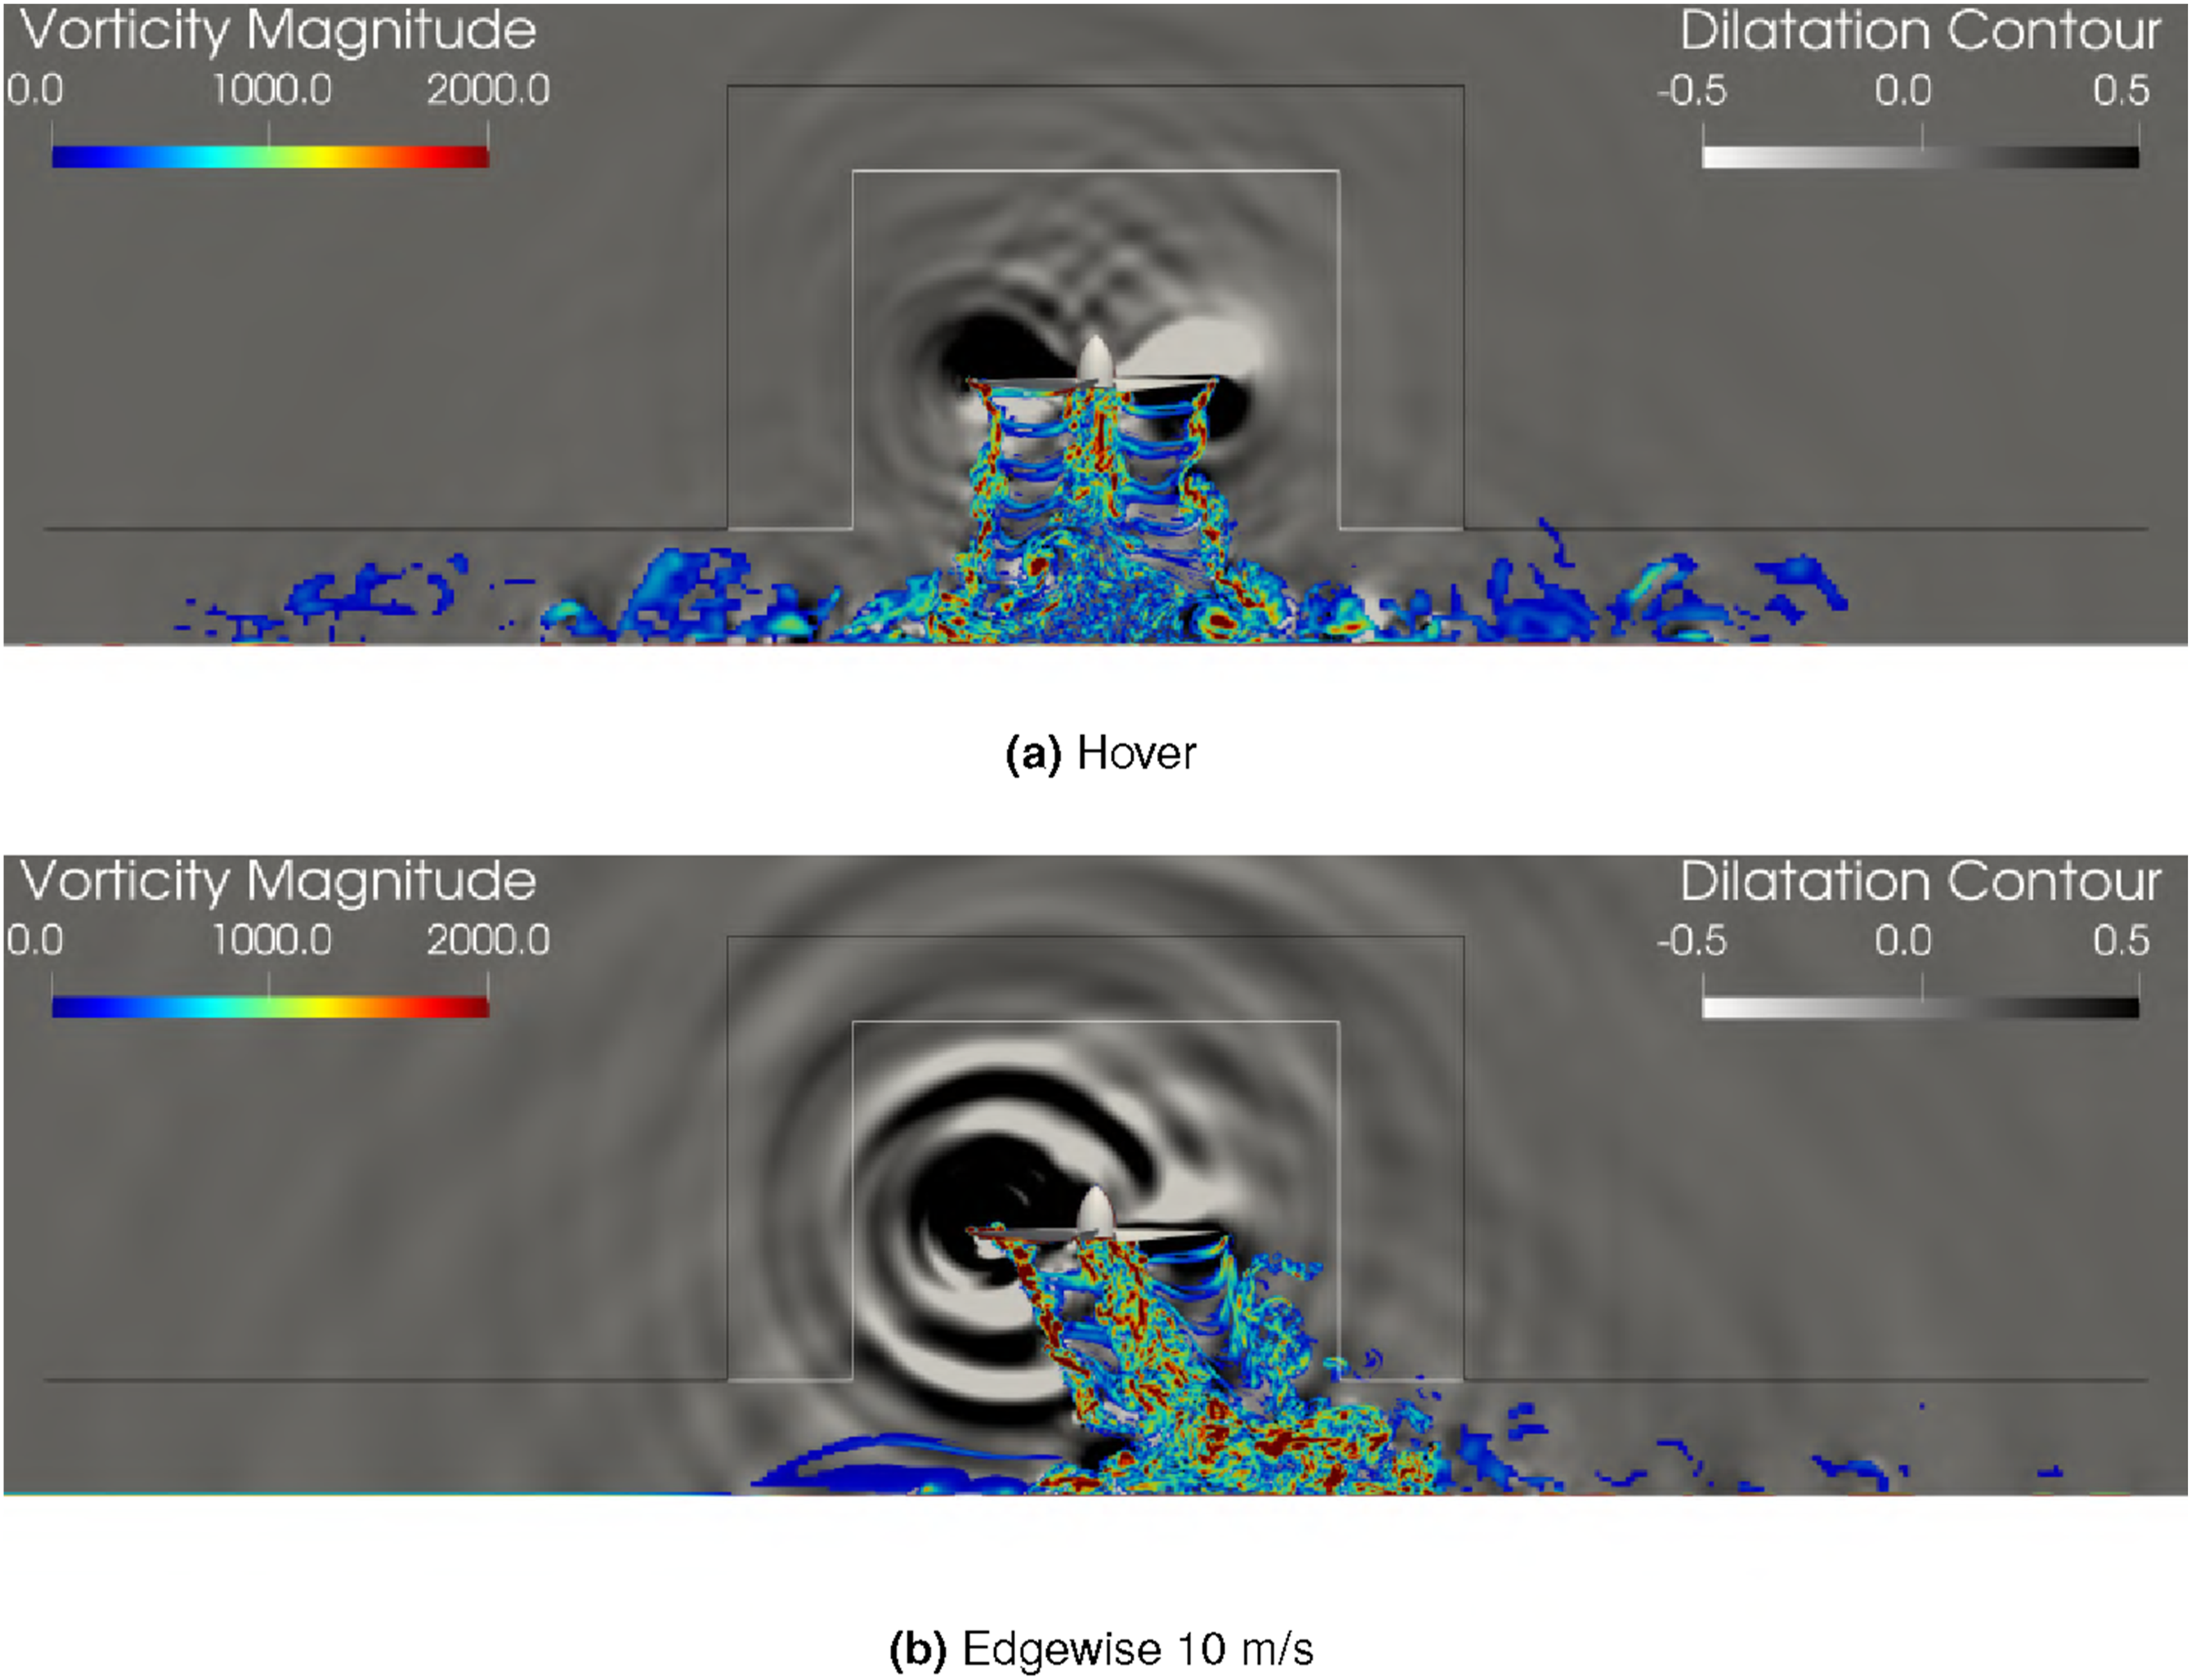
Figure 7 illustrates the dilatation overlaid with vorticity from DES simulations for hover and edgewise flight in ground-effect. Notably, acoustic waves generated by wake rollup propagate upward and interact with the propeller surface. In the edgewise ground-effect case, a portion of the wake spreading along the ground is redirected back toward the propeller wake, introducing additional interactions that influence noise characteristics.
In a previous investigation, permeable surfaces with end-caps were also evaluated for ground-effect cases. 54 The end-cap approach, originally developed for jet simulations, was shown to introduce significant contamination. Recirculating wake structures formed around the end-caps, a phenomenon absent in the jet configuration, which degraded the quality of the acoustic predictions. Consequently, end-caps were excluded from the analysis to avoid wake interference and improve the reliability of the acoustic results.
Subsequent analysis revealed that a permeable surface shaped like an “upside-down T” in a midspan slice could enclose the ground reflections without introducing wake interaction with the integration surfaces below the propeller. 54 Figure 7 shows the proposed permeable surface 1 (white) and the larger permeable surface 2 (black). Both configurations include a top-cap, a cylindrical sidewall, and a horizontal disk positioned one propeller radius above the ground, extending radially from the base of the cylinder to 4.5 propeller diameters from the hub center.
Additionally, when compared to Figure 6, a denser concentration of vorticity is observed along the rotor axis. Wave reflections from the ground are also evident, with intensities comparable to those propagating downwards in the OGE case.
Acoustics comparison
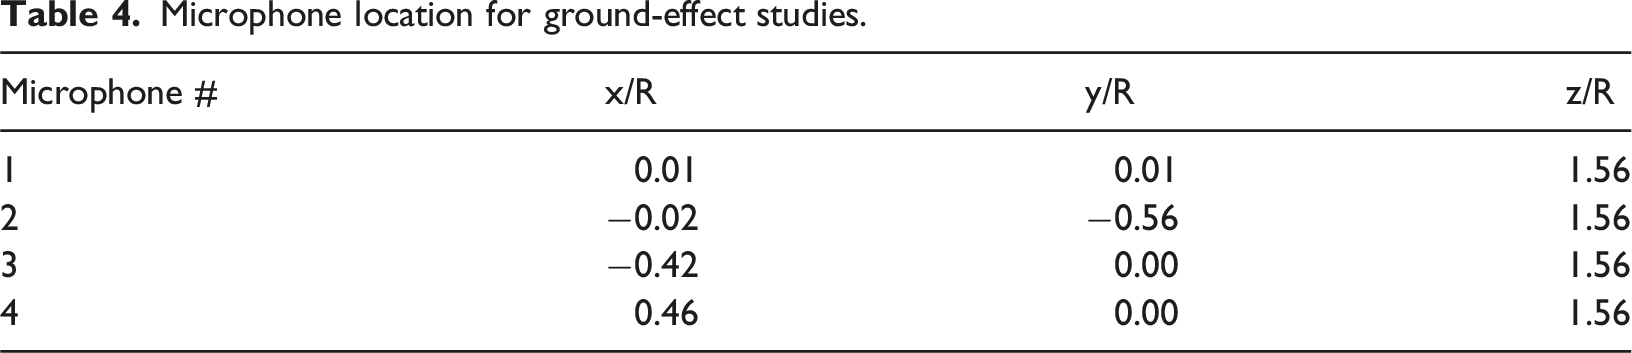
The same experimental microphone setup used for the isolated rotor analysis was considered for the ground-effect study, allowing for directivity maps to be generated. It is important to note that, for the edgewise flight case, the setup now maintains the same orientation as in hover, with some microphones positioned in-plane and others out-of-plane. The only difference is that the freestream velocity now approaches from above, as illustrated in Figure 24. The impermeable surface from either high-fidelity CFD and CHARM simulations is defined by the rotor surface itself, and the Method of Images (MOI) is utilized to account for ground reflections in those cases. Microphone setup for ground-effect studies.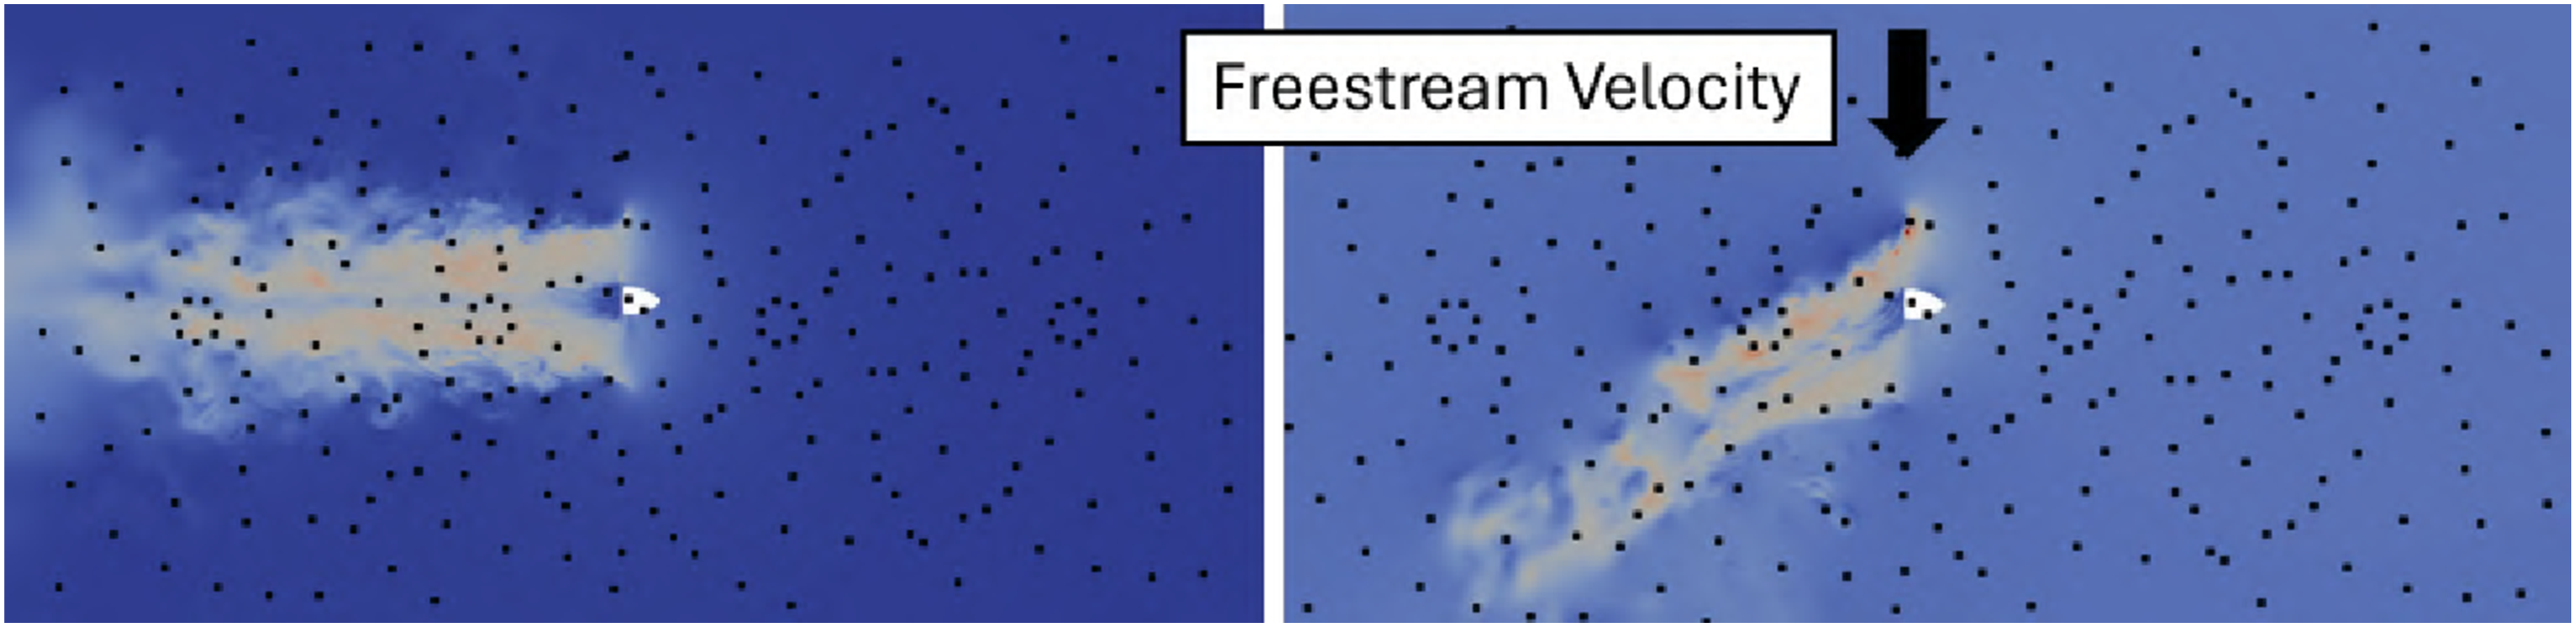
The high-fidelity CFD simulations model a single rotor above a rigid ground plane treated as a wall boundary, consistent with the CHARM setup. Unlike CHARM, the CFD solution provides access to the pressure field, allowing extraction of flow variables on arbitrary permeable FW–H control surfaces that enclose both the rotor and the ground plane. This enables far-field acoustic predictions using both impermeable and permeable formulations. For permeable surfaces, the MOI is not used, since these surfaces are assumed to directly capture the effect of ground reflections.
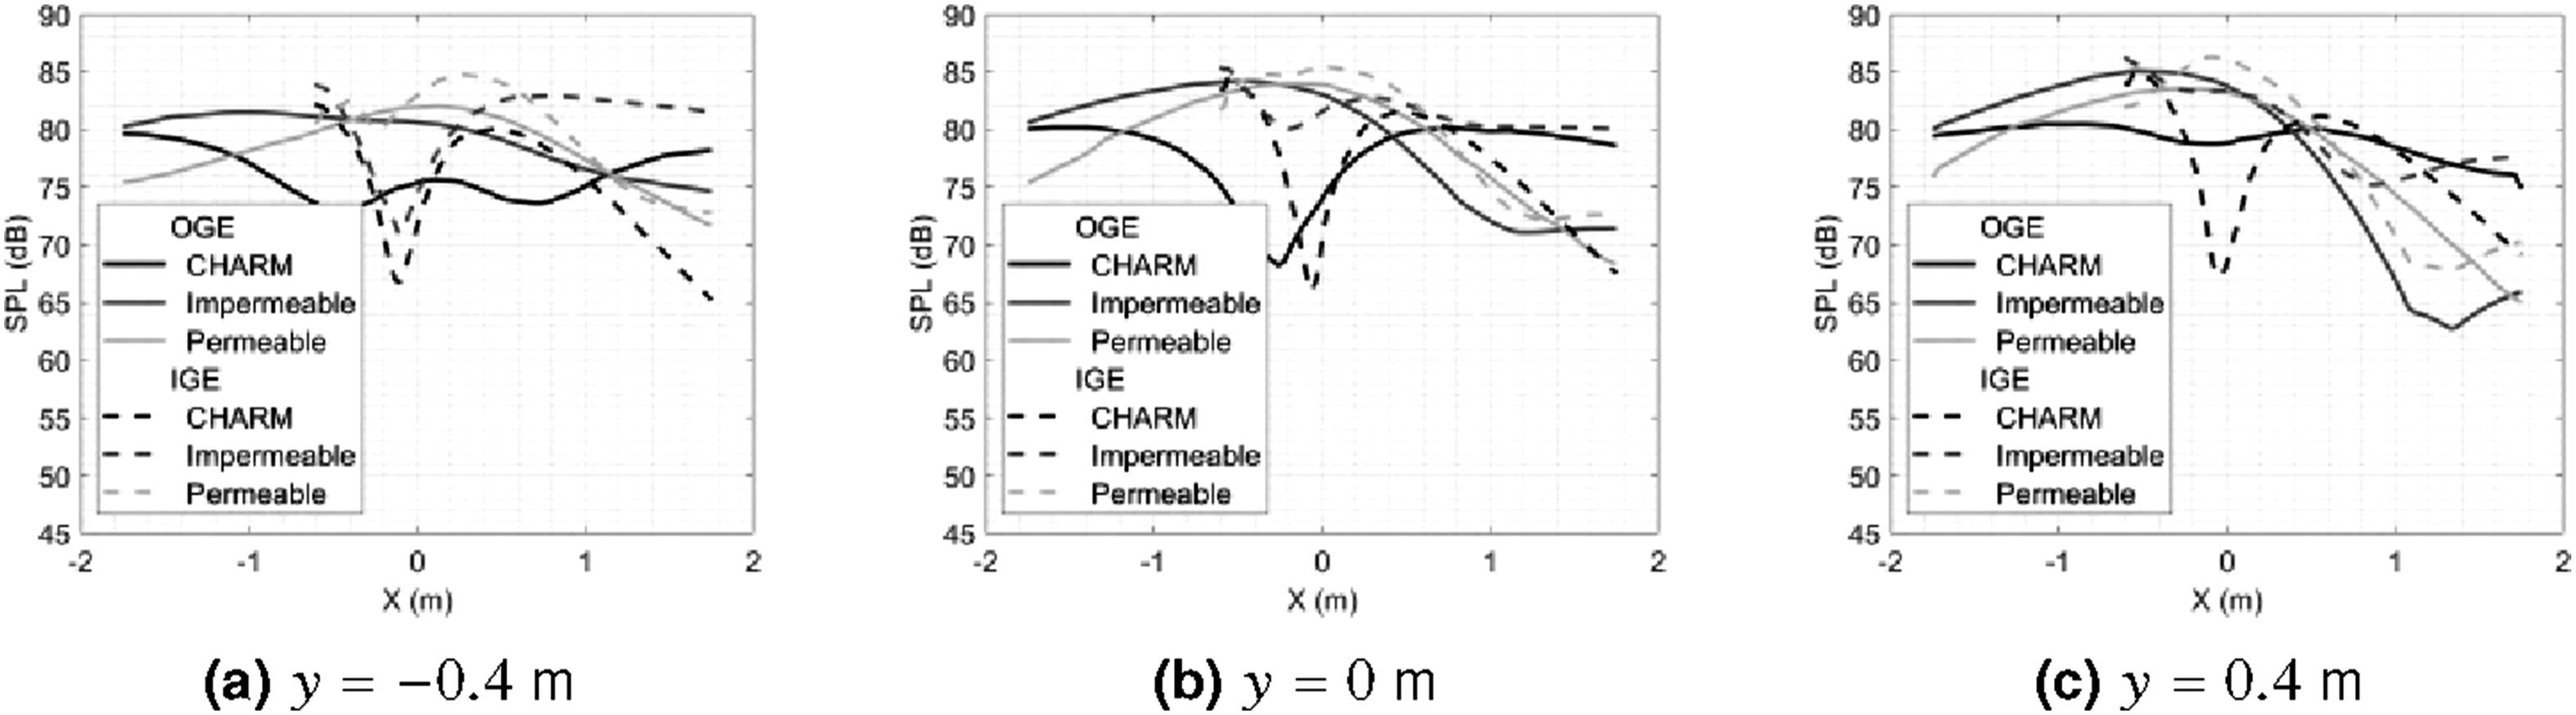
Directivity maps at the BPF obtained from the impermeable and permeable FW–H surfaces in the CFD, along with CHARM predictions, are shown in Figure 25 for both IGE and OGE hover conditions. Figure 26 presents the corresponding SPL distributions at the BPF, extracted along horizontal slices at Far-field SPL contour at BPF from DES simulations for OGE and IGE cases - Hover. Far-field SPL comparison at BPF for OGE and IGE cases - Hover.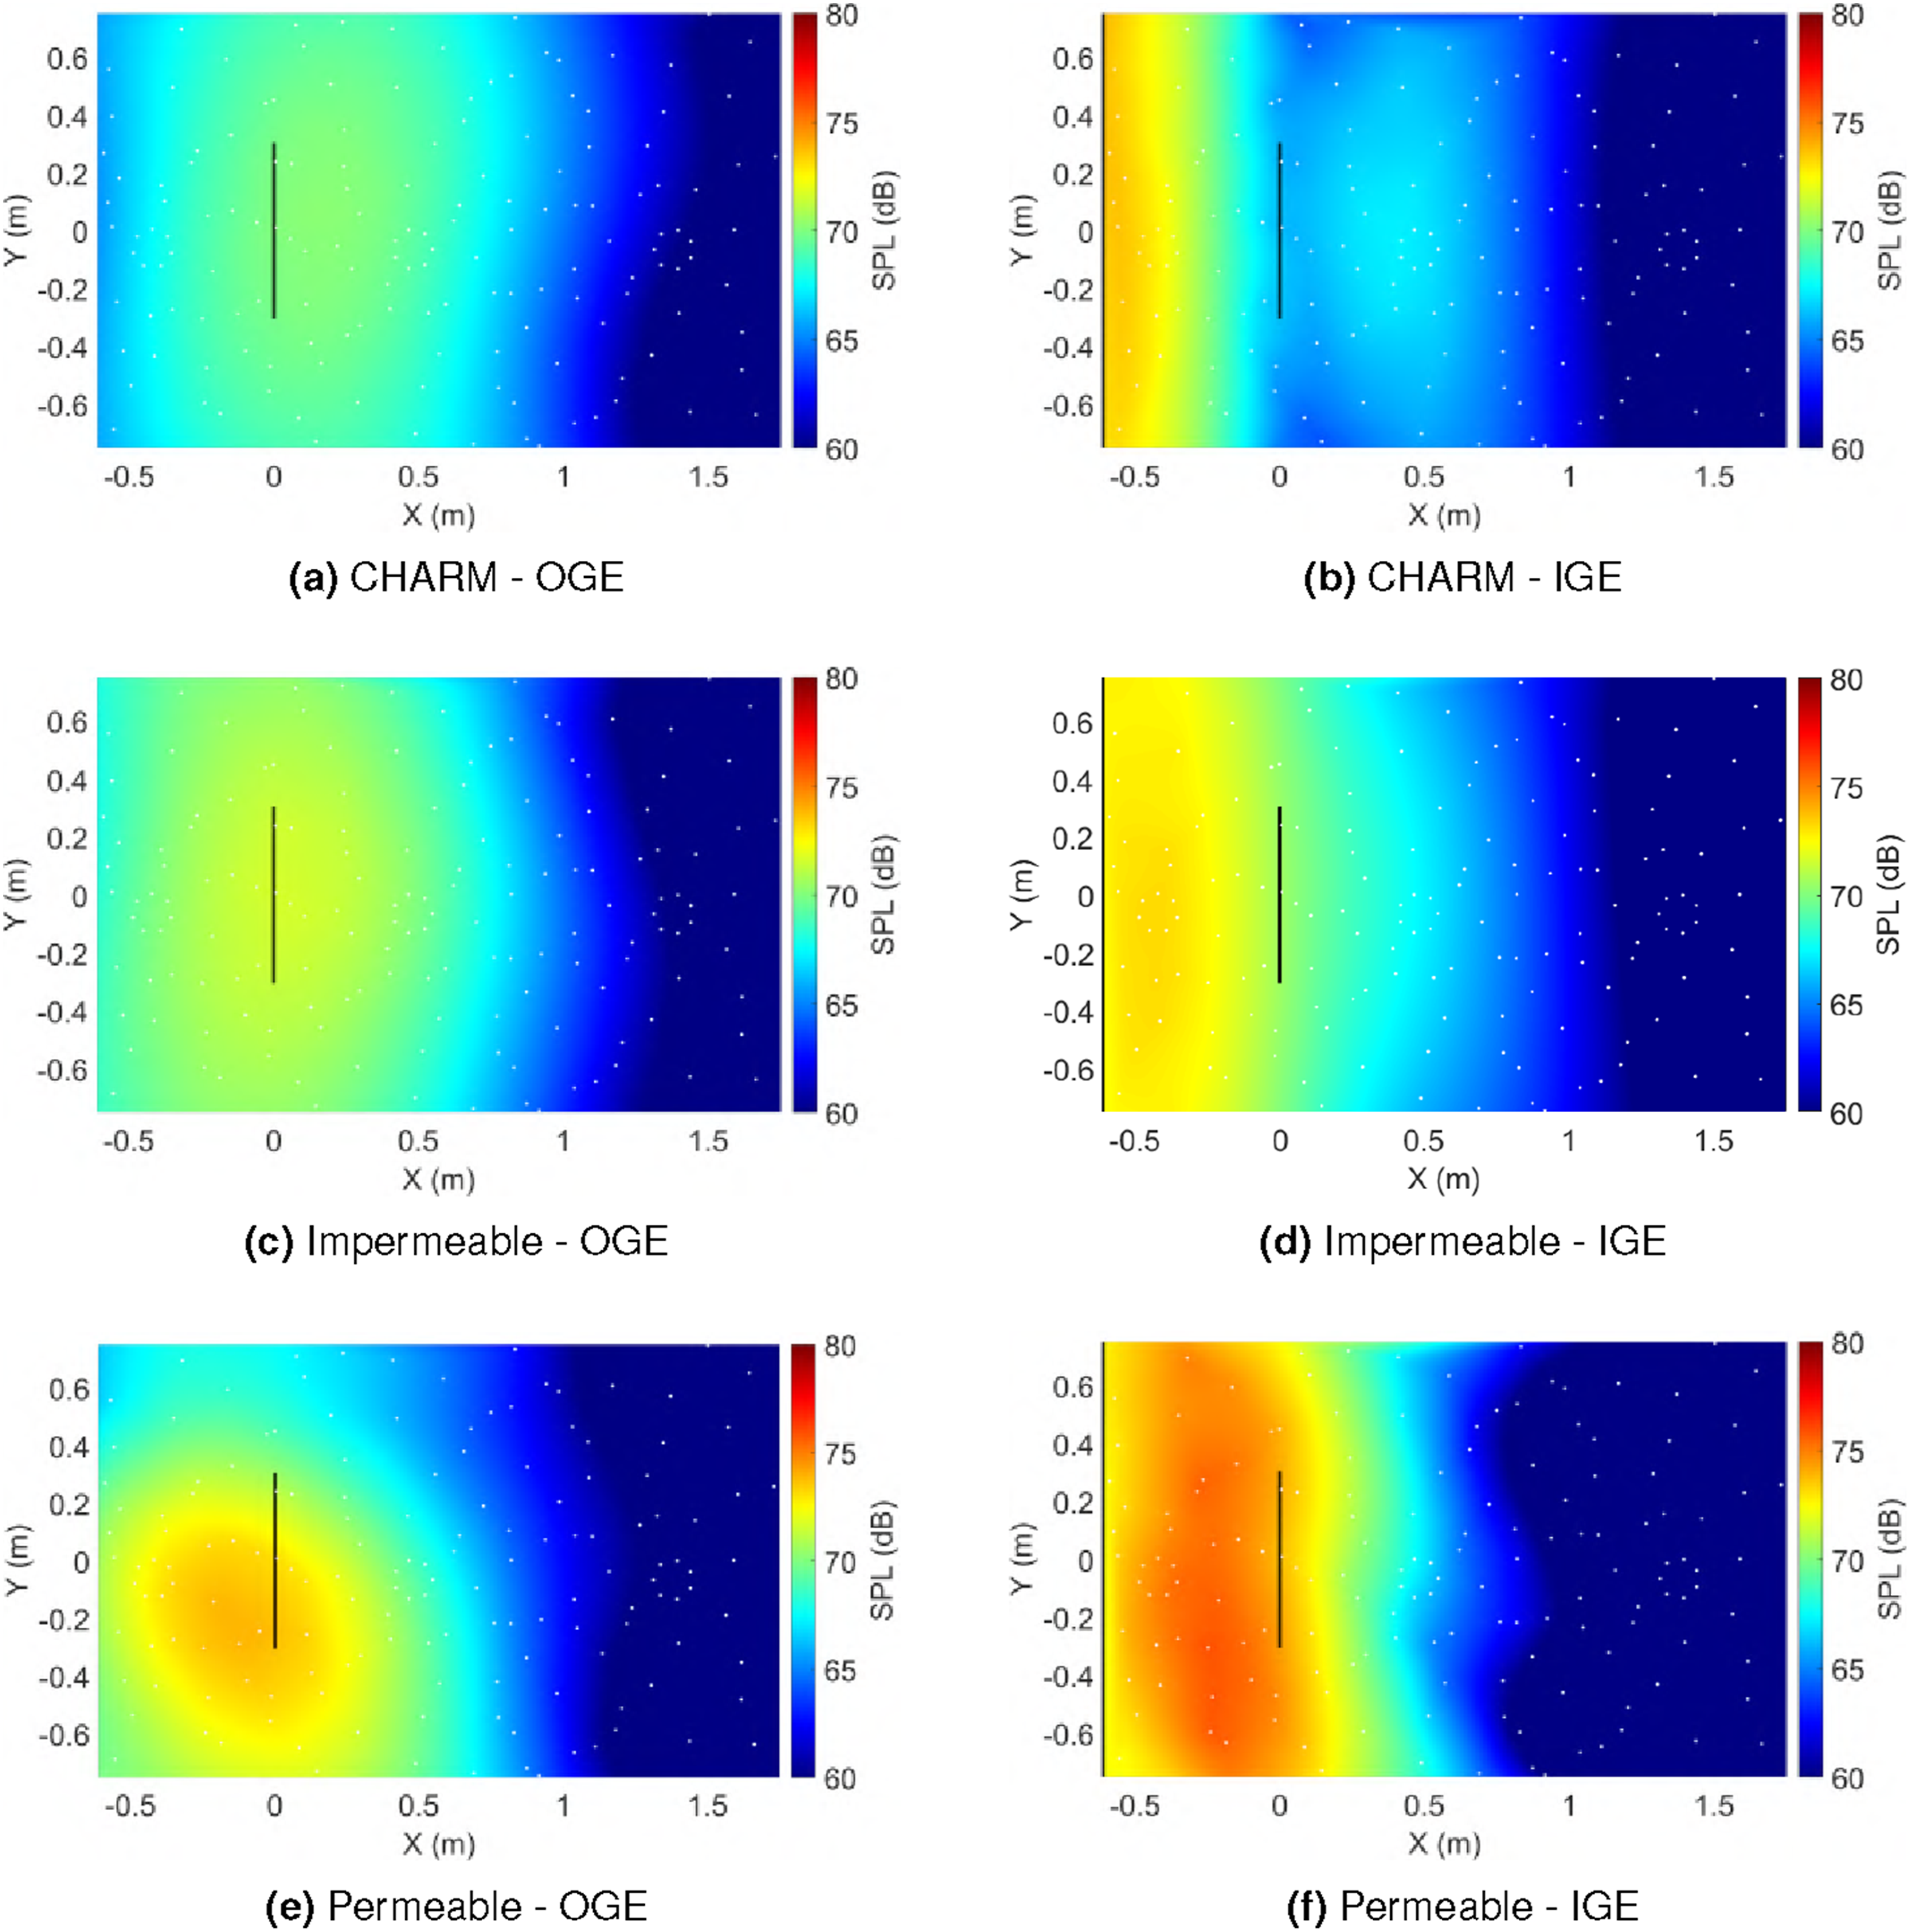
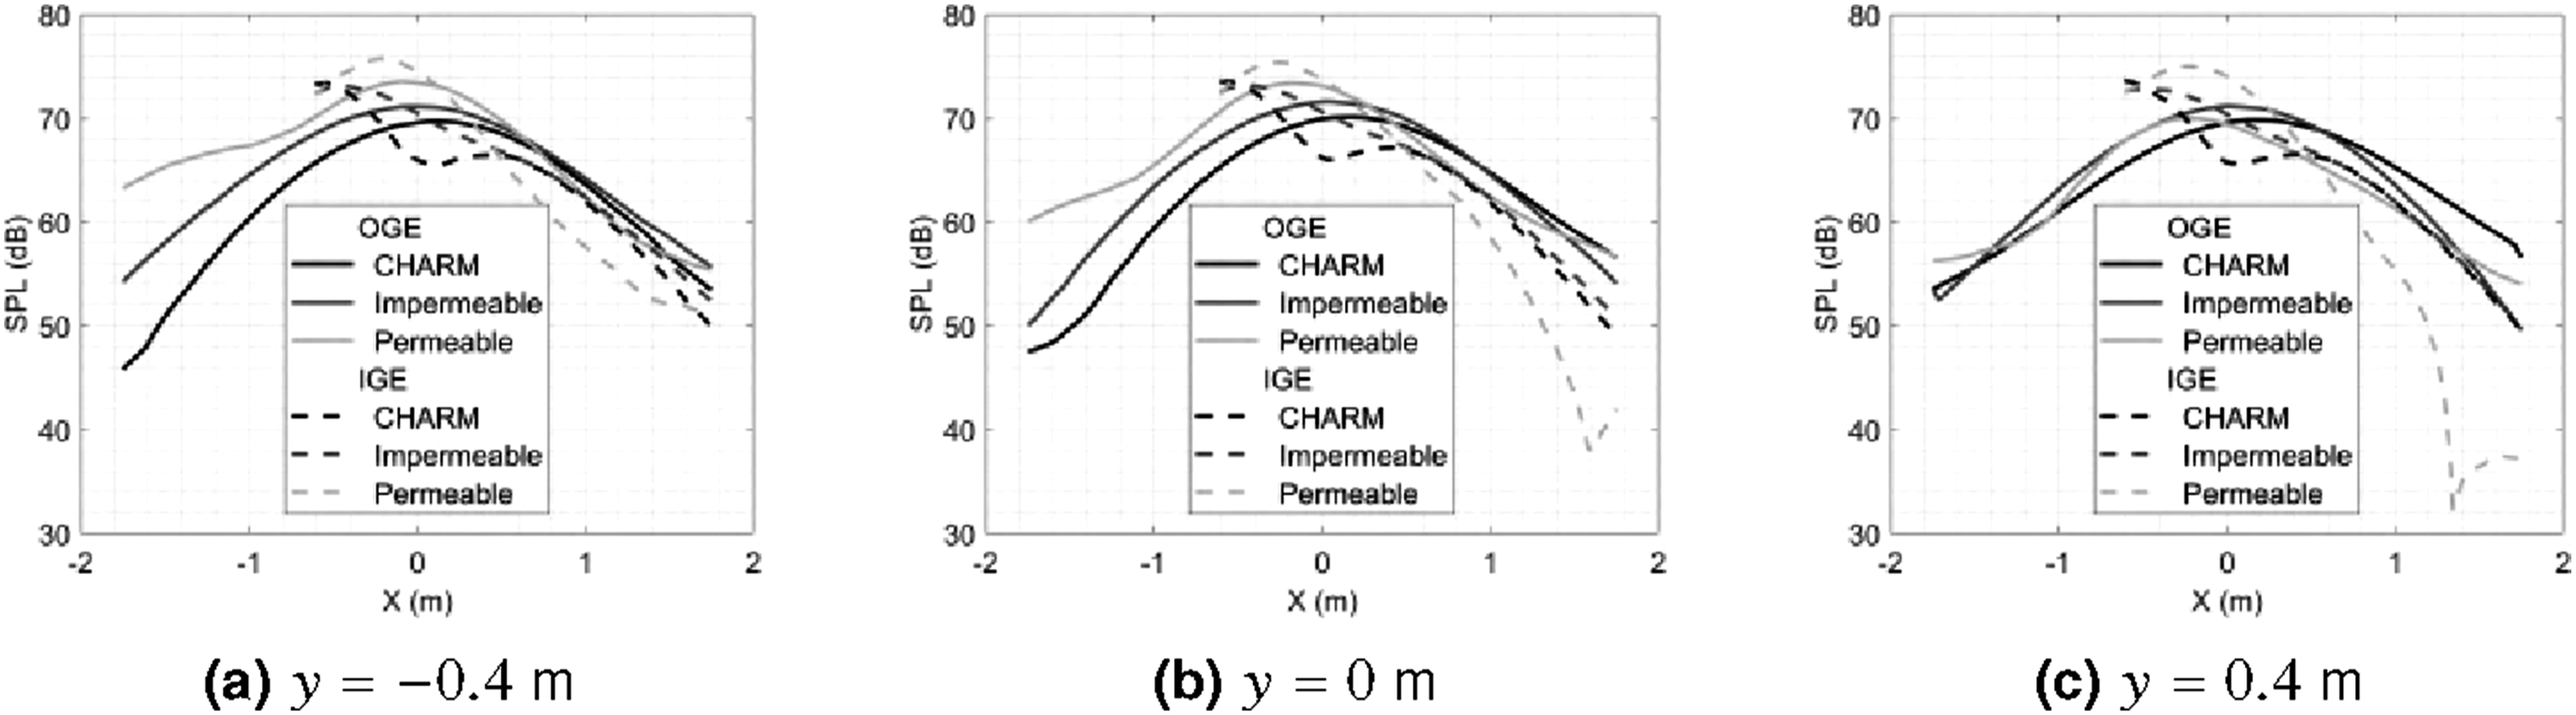
For a given configuration (OGE or IGE), the CHARM directivity maps show good agreement with the CFD results obtained from the impermeable surface. The SPL line plots indicate that IGE increases noise levels by up to 5 dB at microphones located below the rotor plane, while noise levels above the rotor tend to decrease relative to OGE. The permeable surface appears to capture additional noise sources in the OGE case, leading to a closer match with the experimental results, as previously discussed. Under IGE, it also reflects the contribution of these additional sources, predicting higher noise levels below the rotor plane.
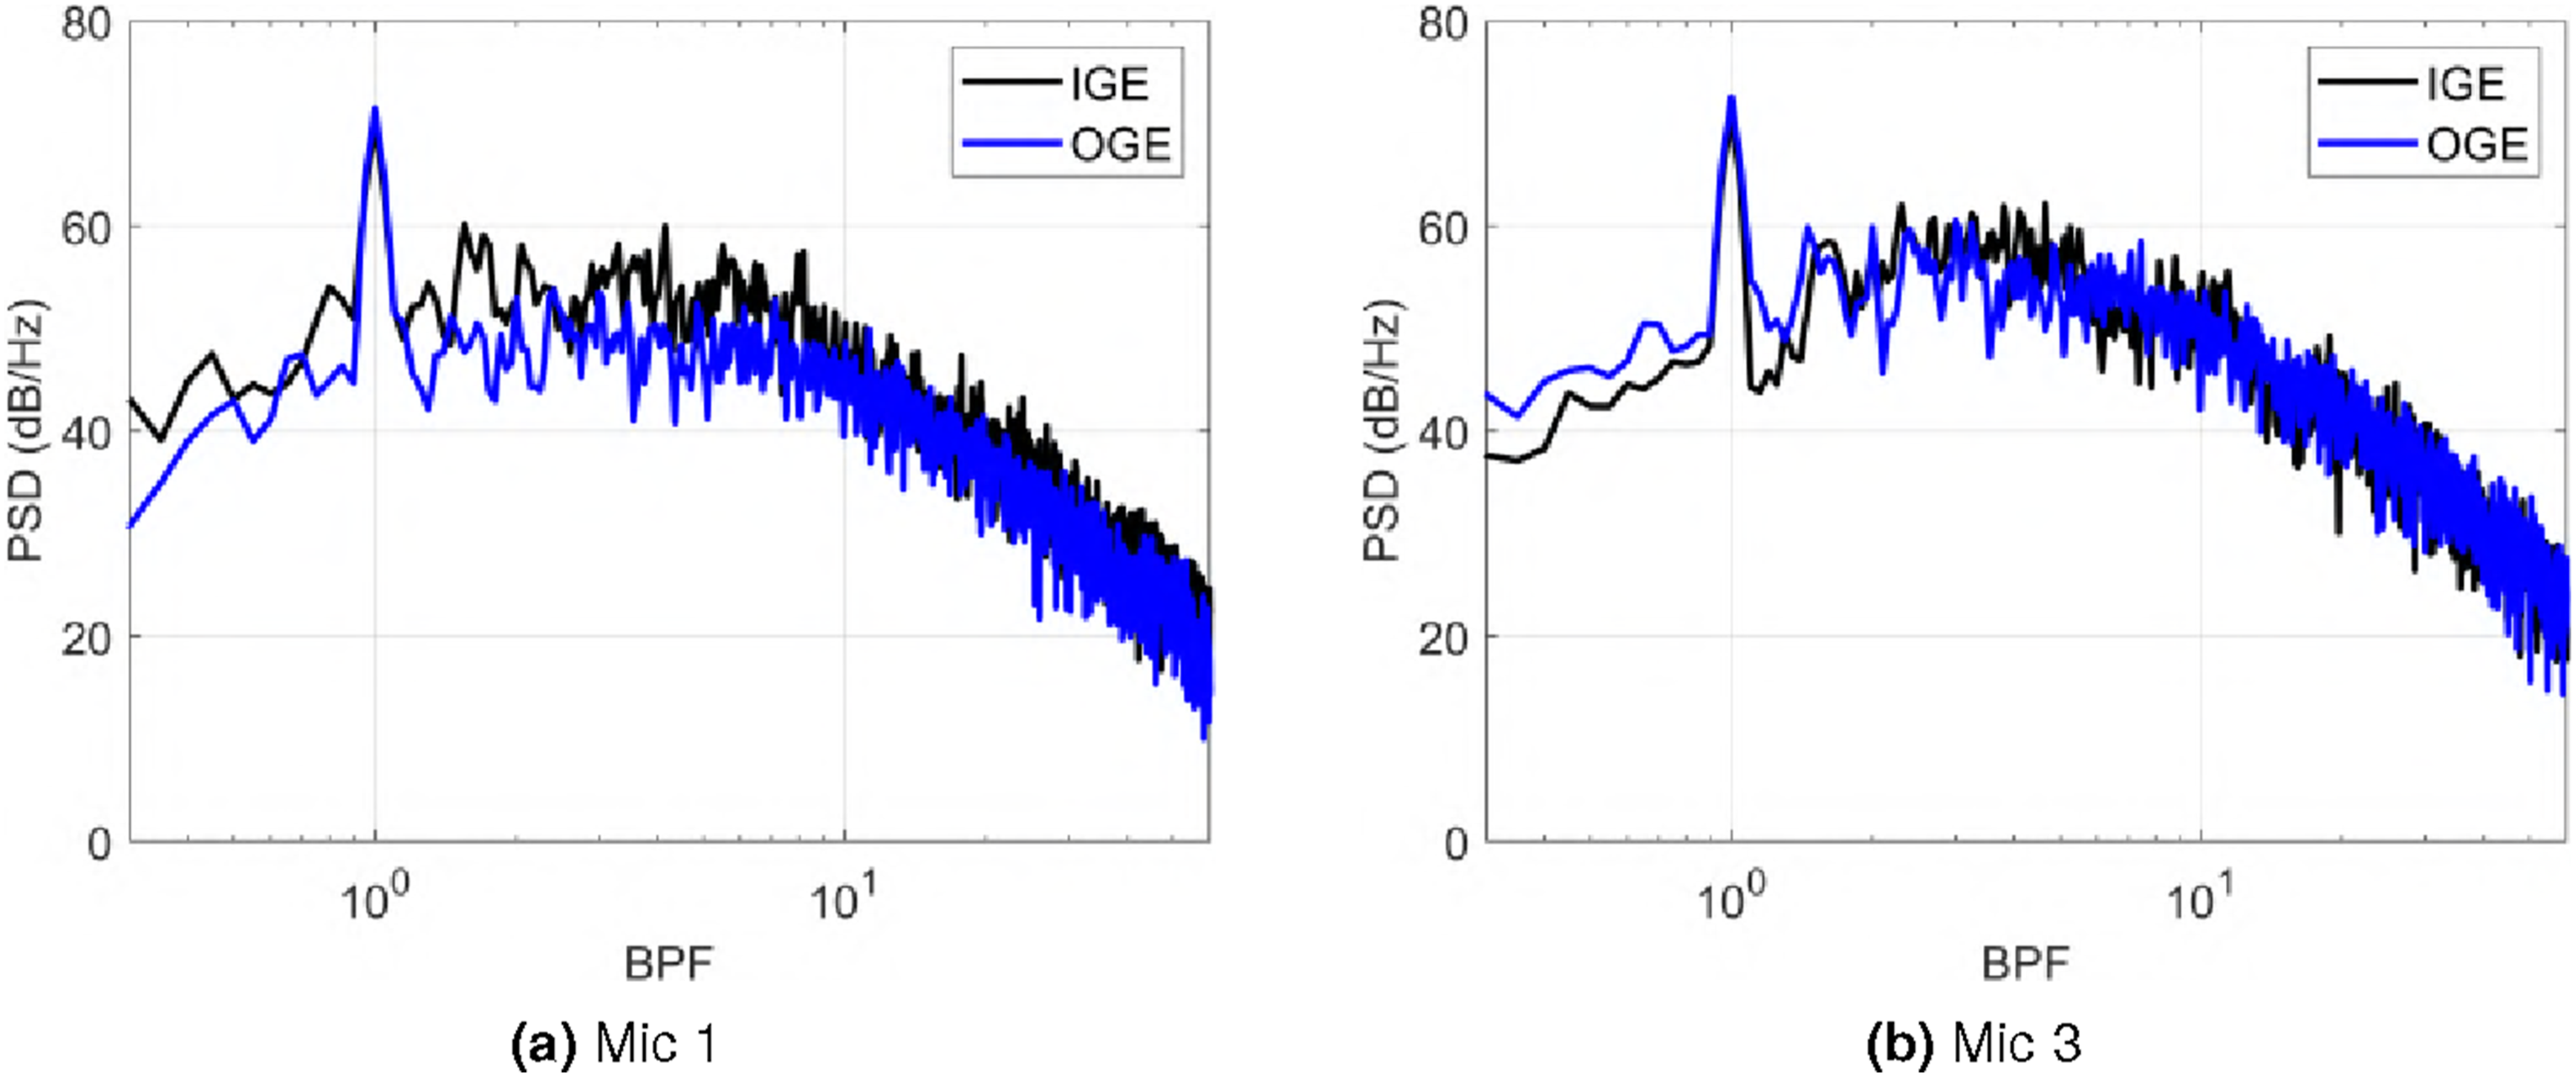
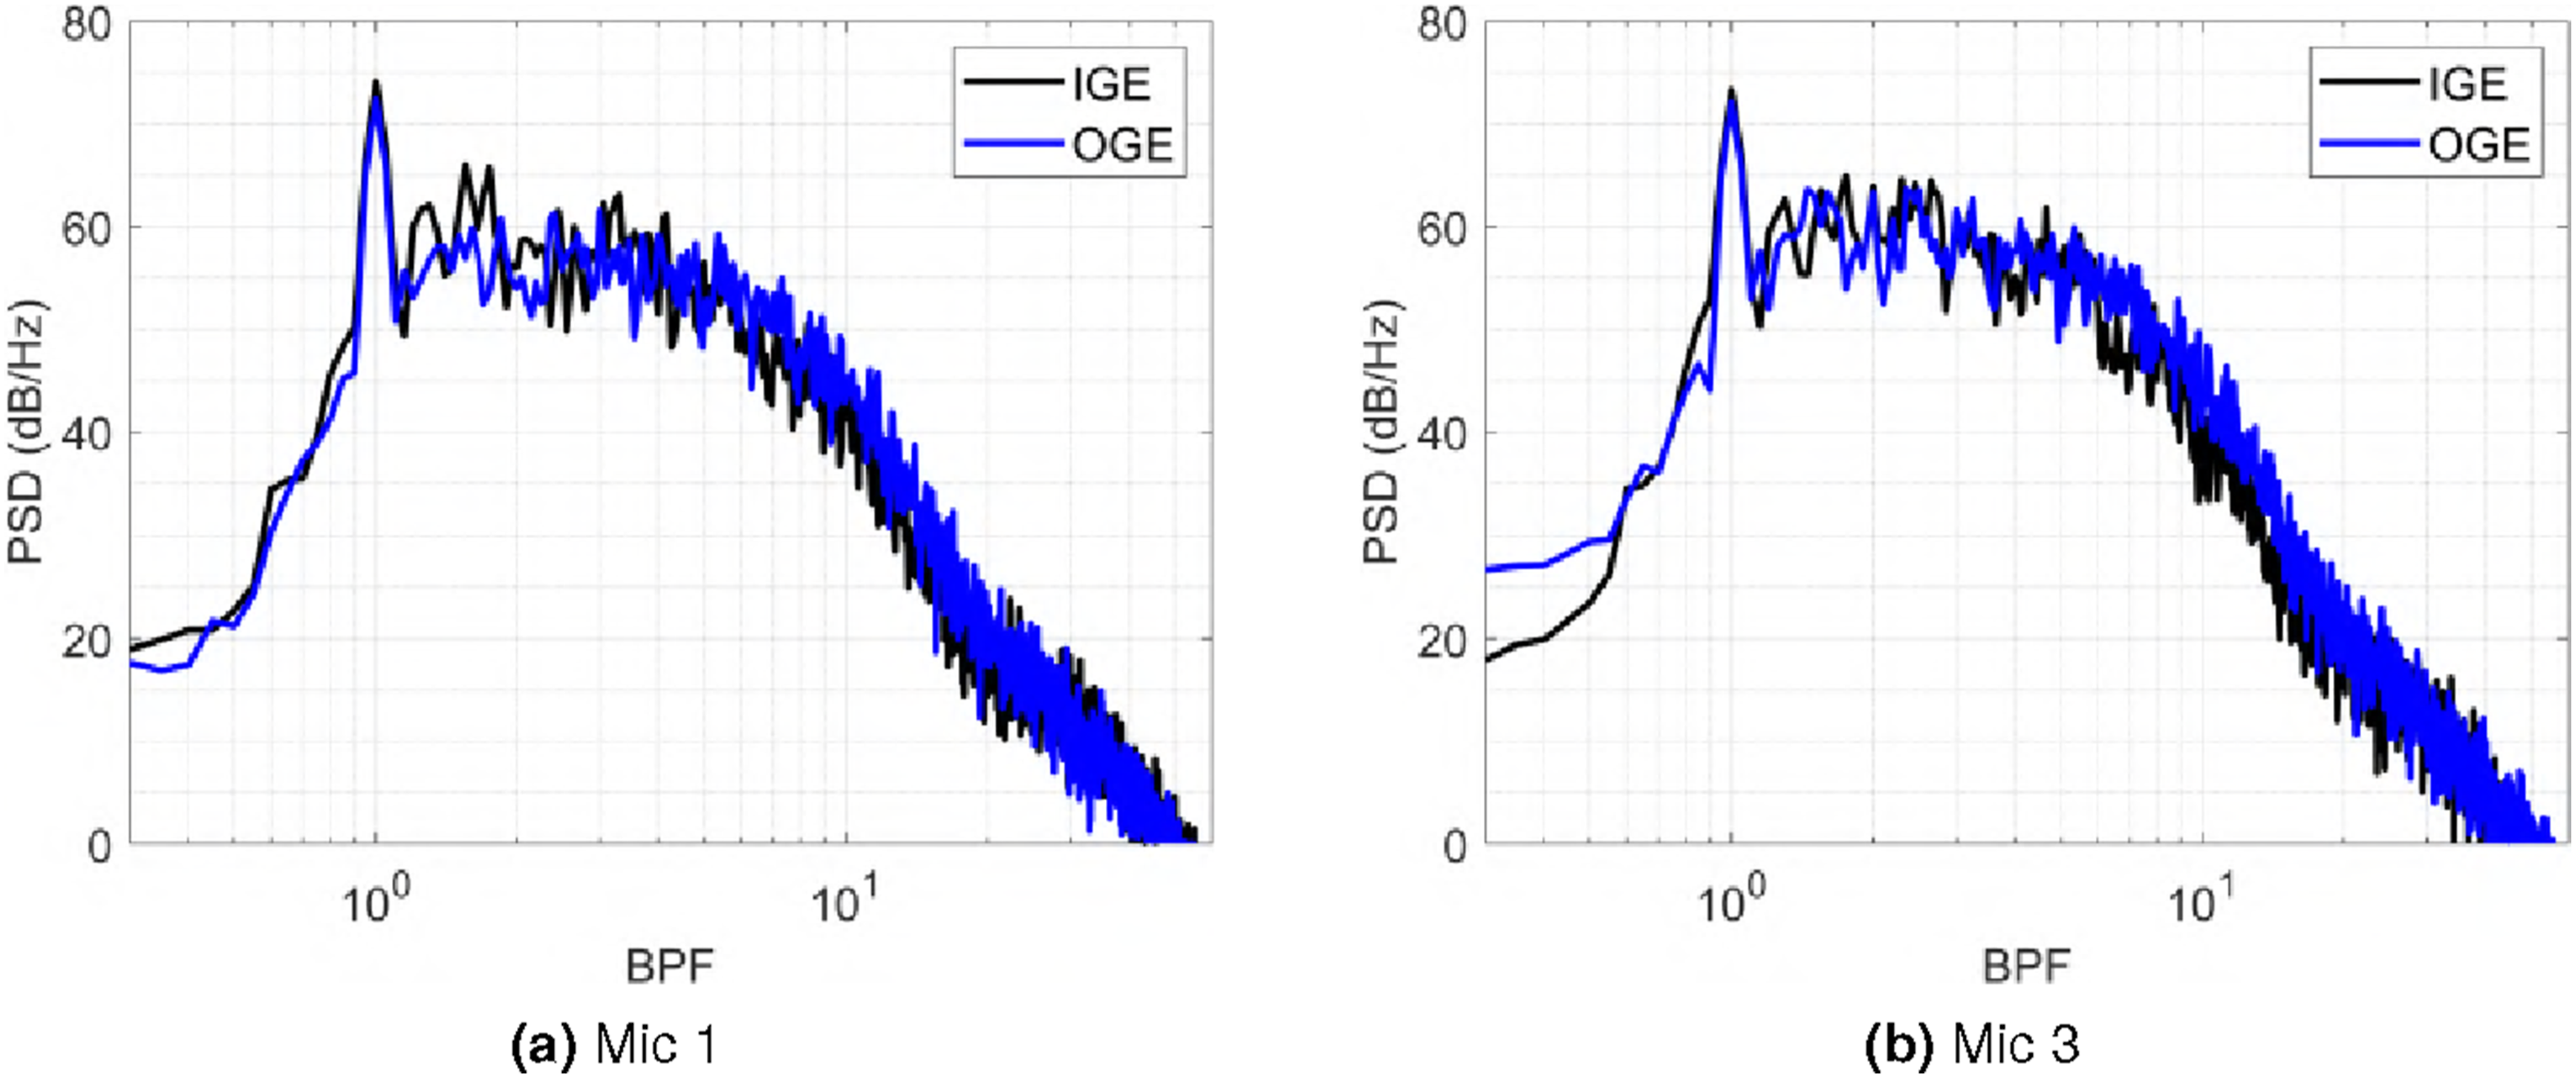
Figures 27–29 show PSD spectra comparisons at two observer locations for CHARM and for the CFD impermeable and permeable surfaces. The corresponding far-field microphone coordinates are listed in Table 4. PSD spectra comparison from hover at different observers using CHARM. PSD spectra comparison from hover at different observers using DDES - Impermeable surface. PSD spectra comparison from hover at different observers using DDES - Permeable surface. Microphone location for ground-effect studies.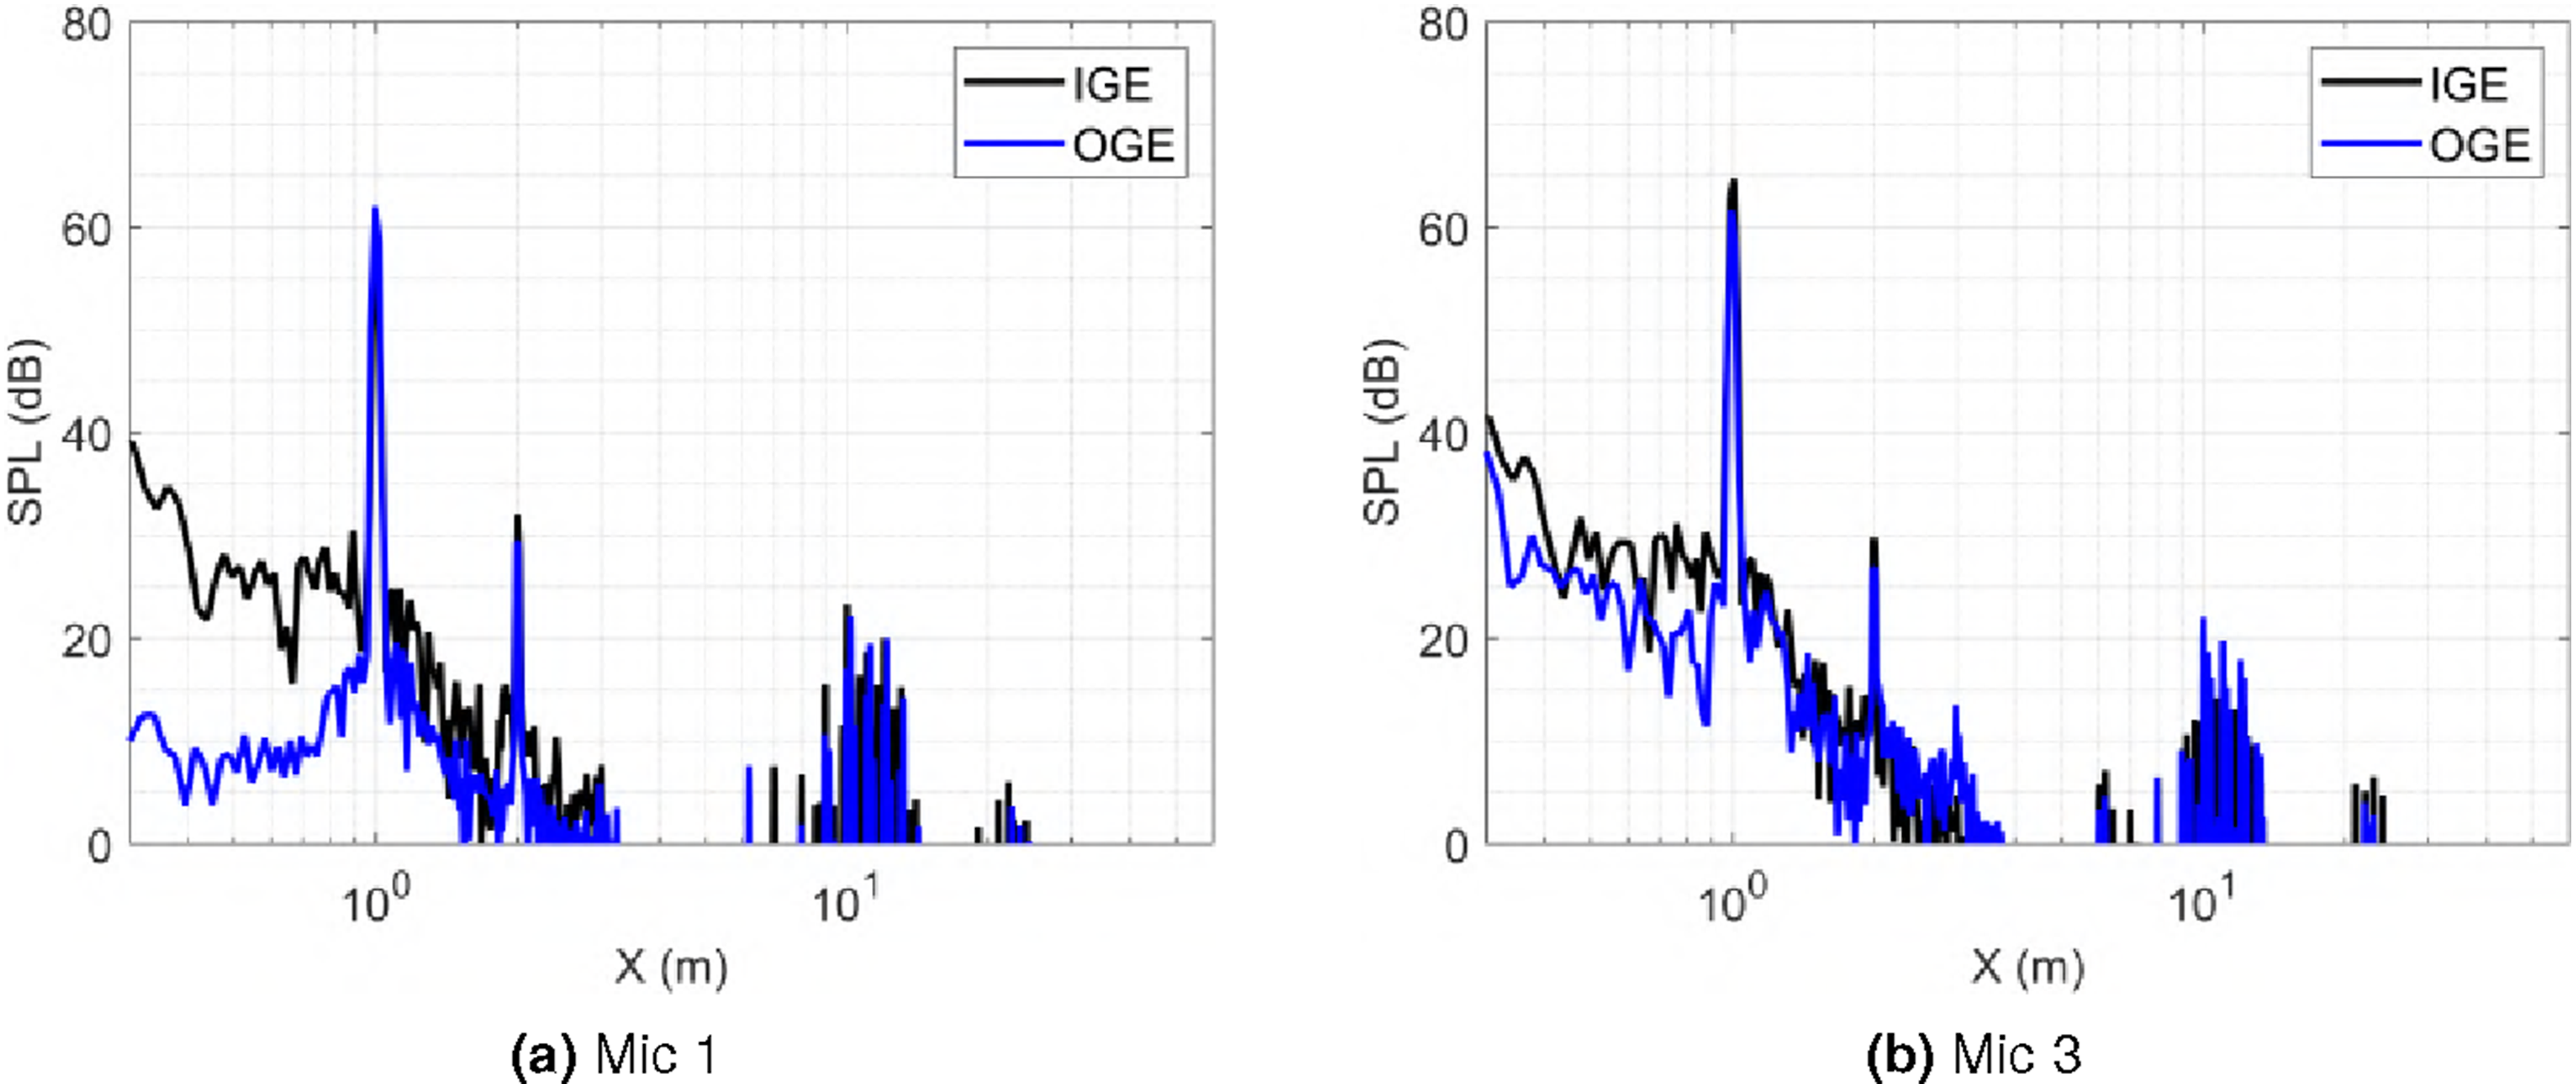
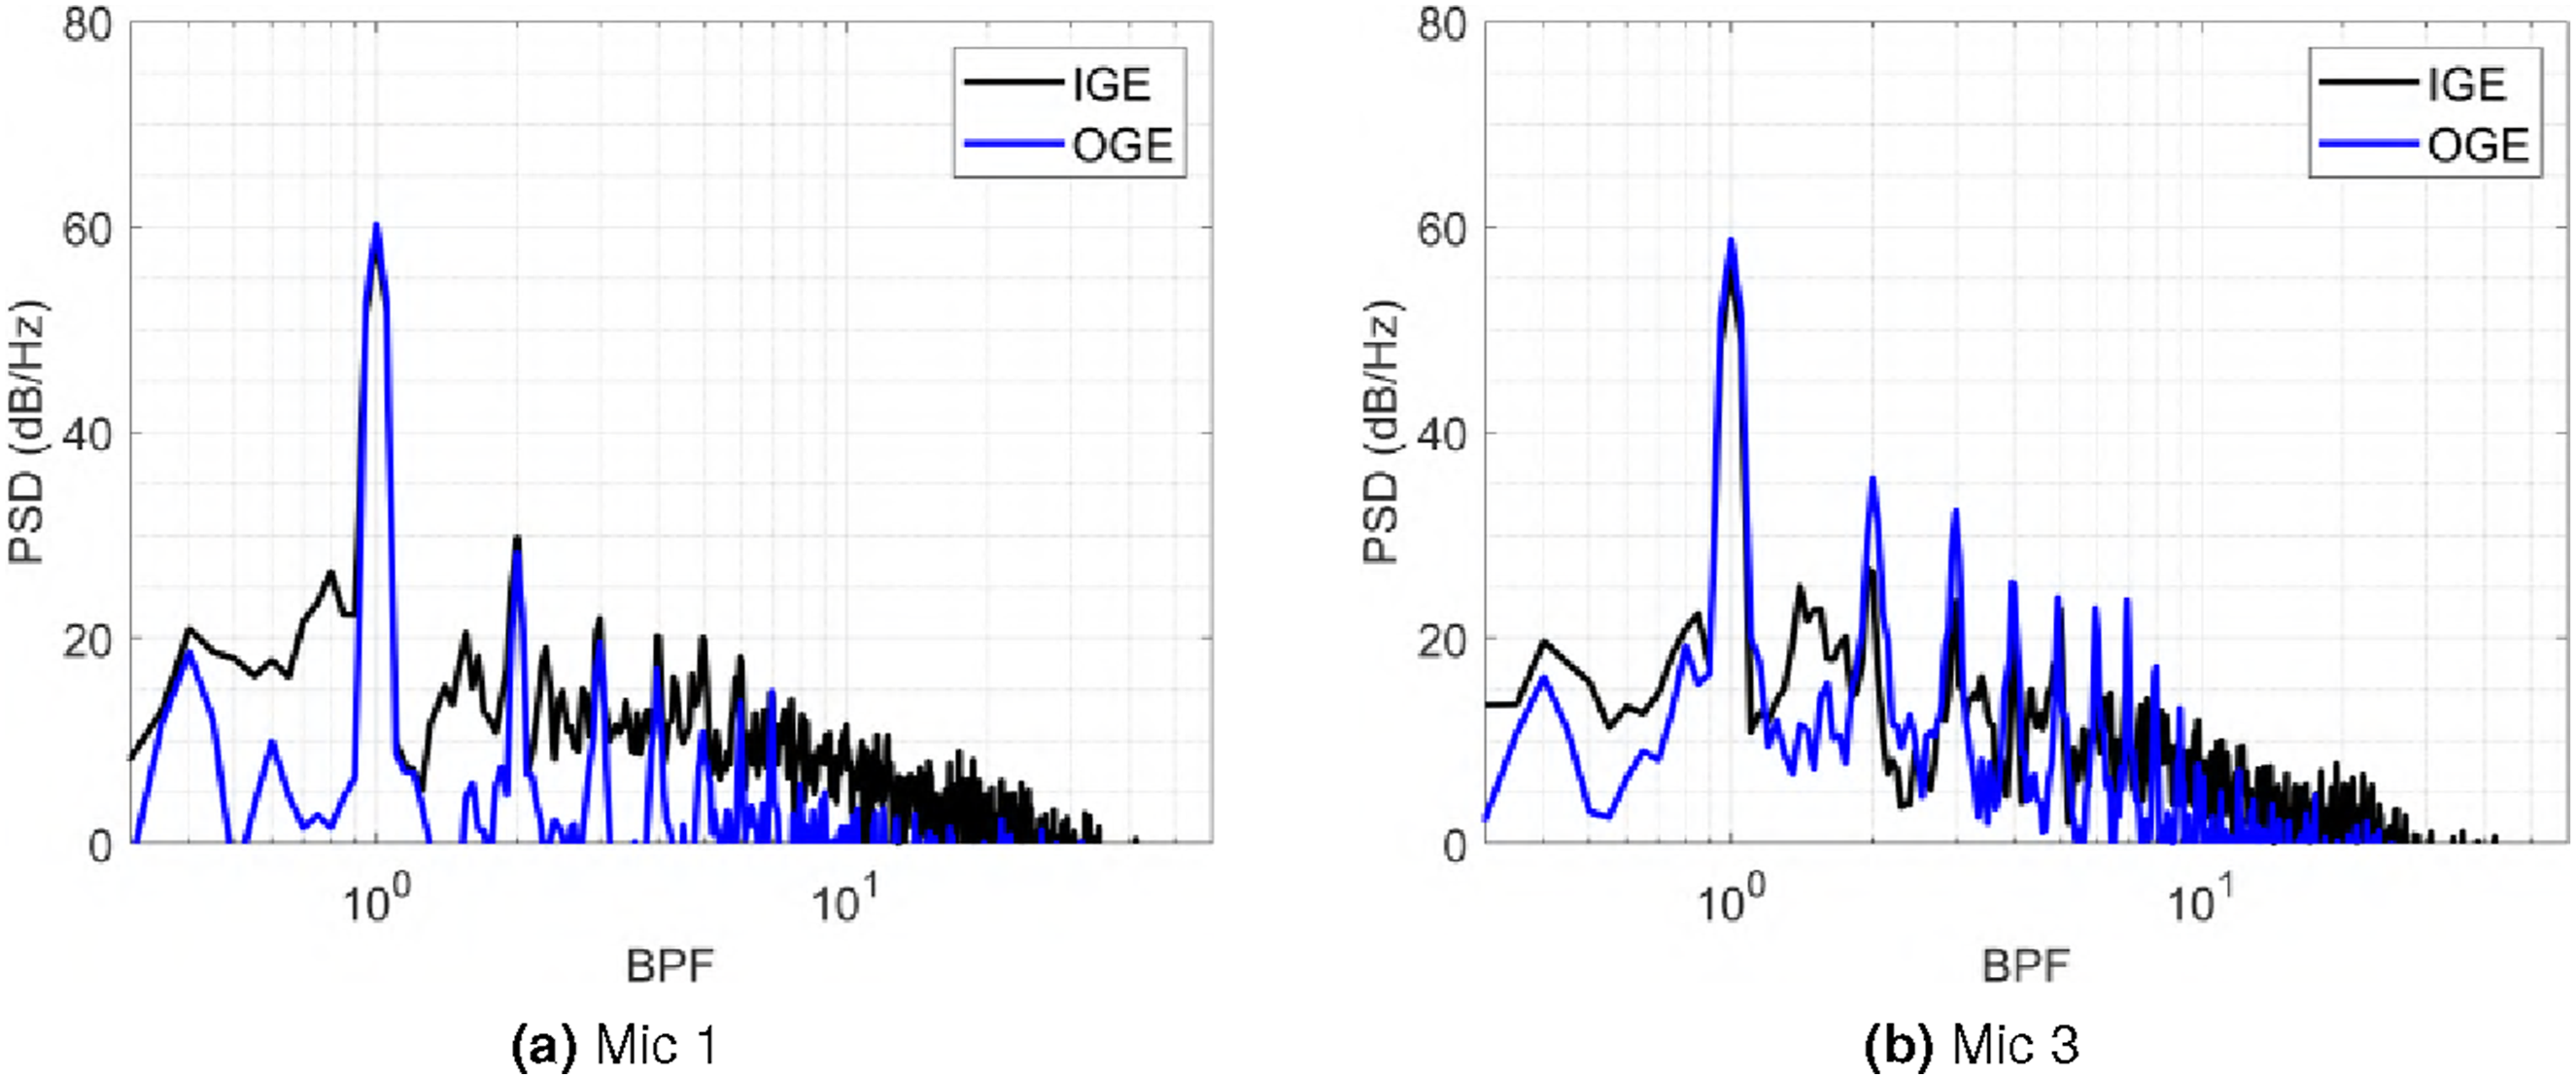
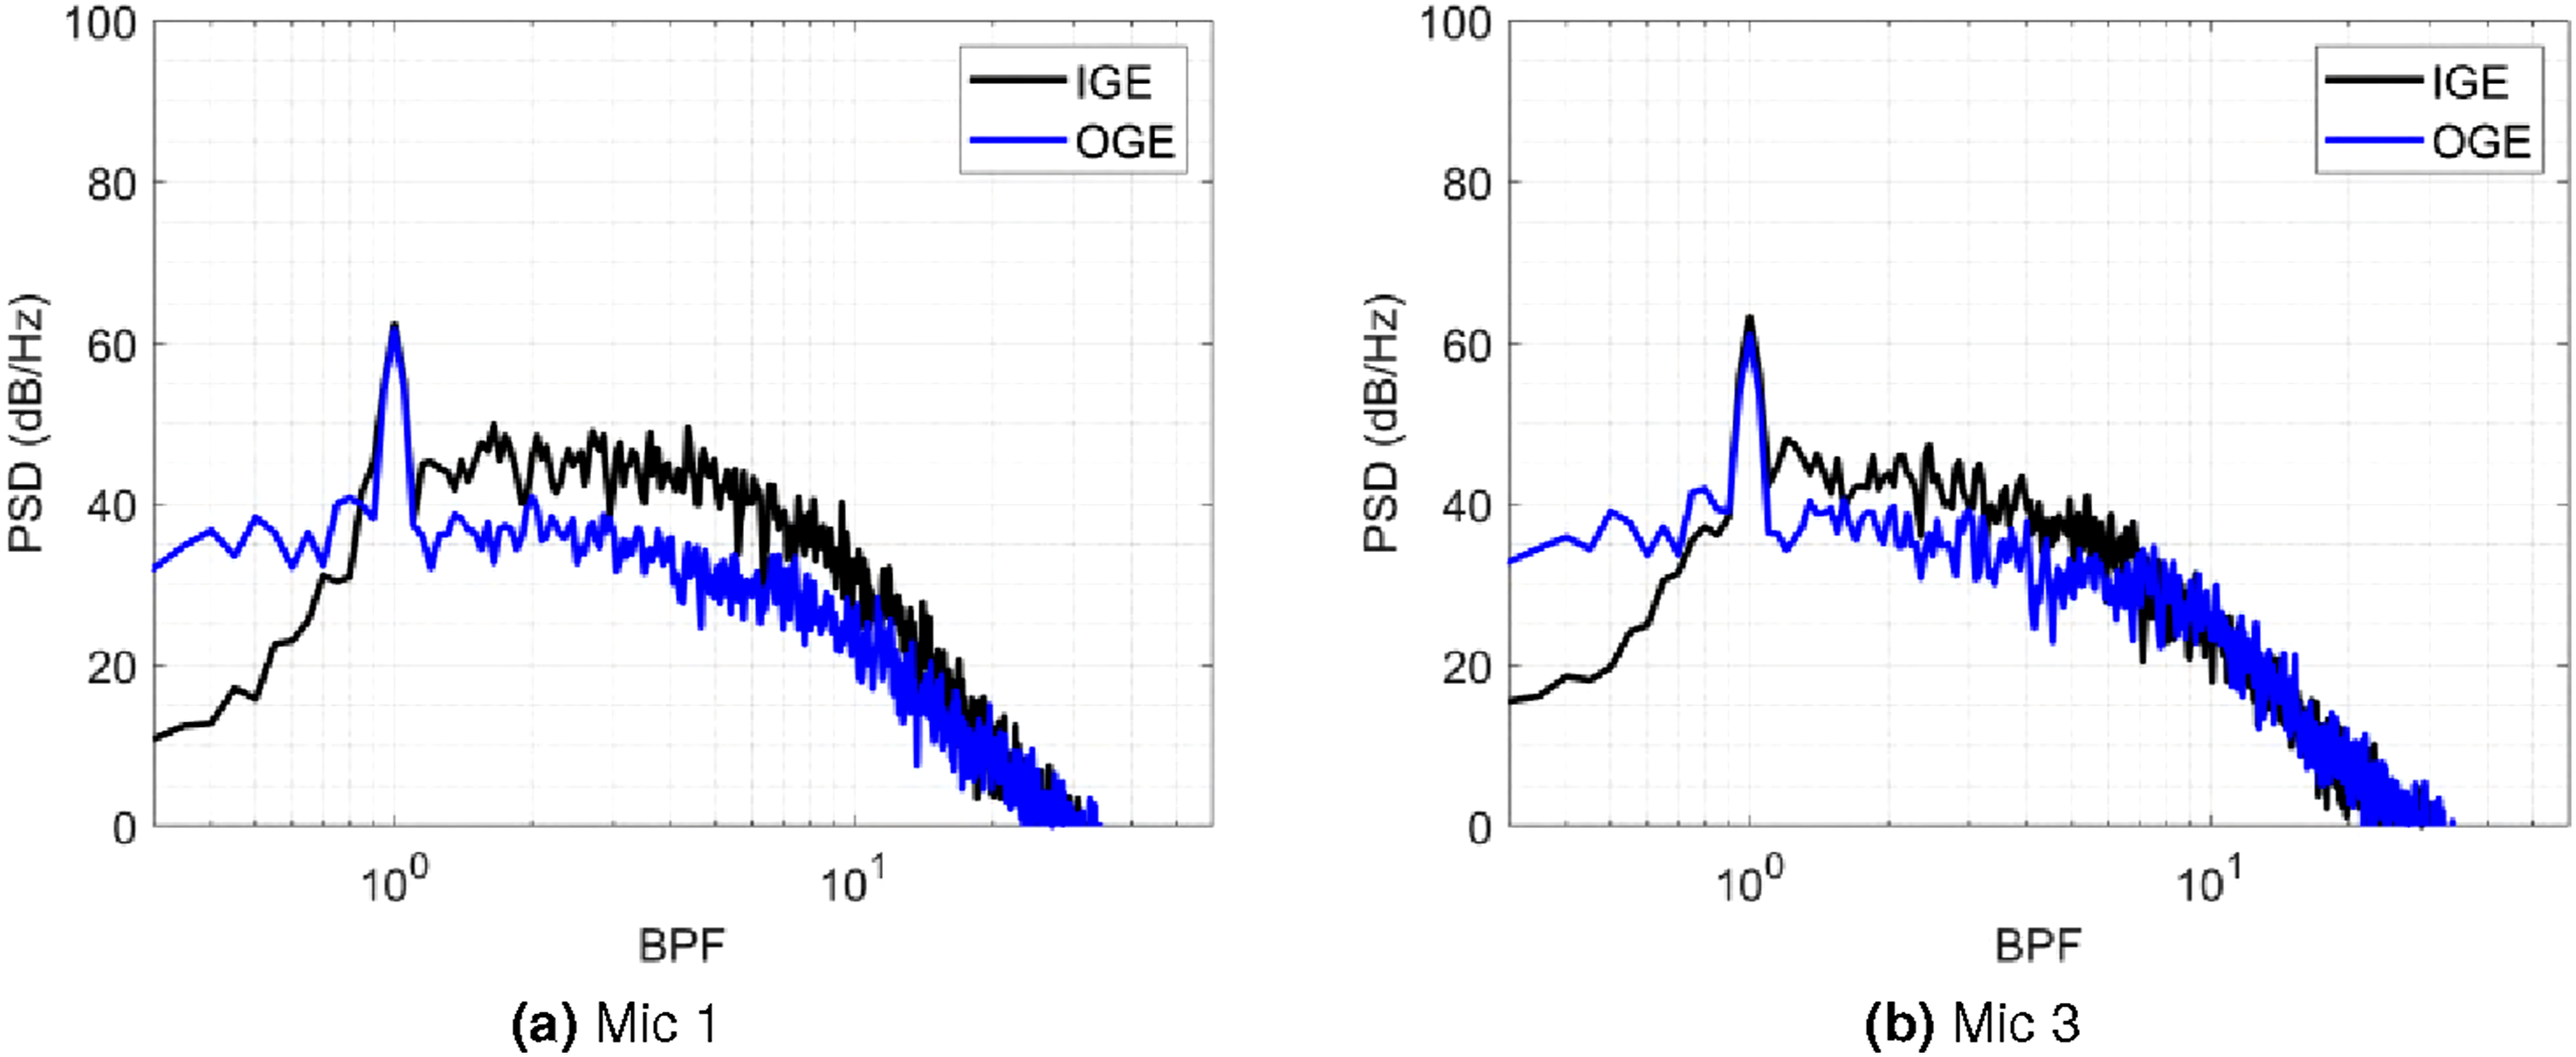
The IGE configuration produces higher noise levels at microphones located near the ground, with a pronounced increase in broadband noise compared to OGE. For microphone 3, which is closest to the ground, the dominant change is an increase in tonal noise at the BPF. At microphone 1, located at the rotor plane, the tonal increase is smaller, while the broadband rise in the mid-frequency range is more significant.
OASPL (in dB) at each microphone location for hover.
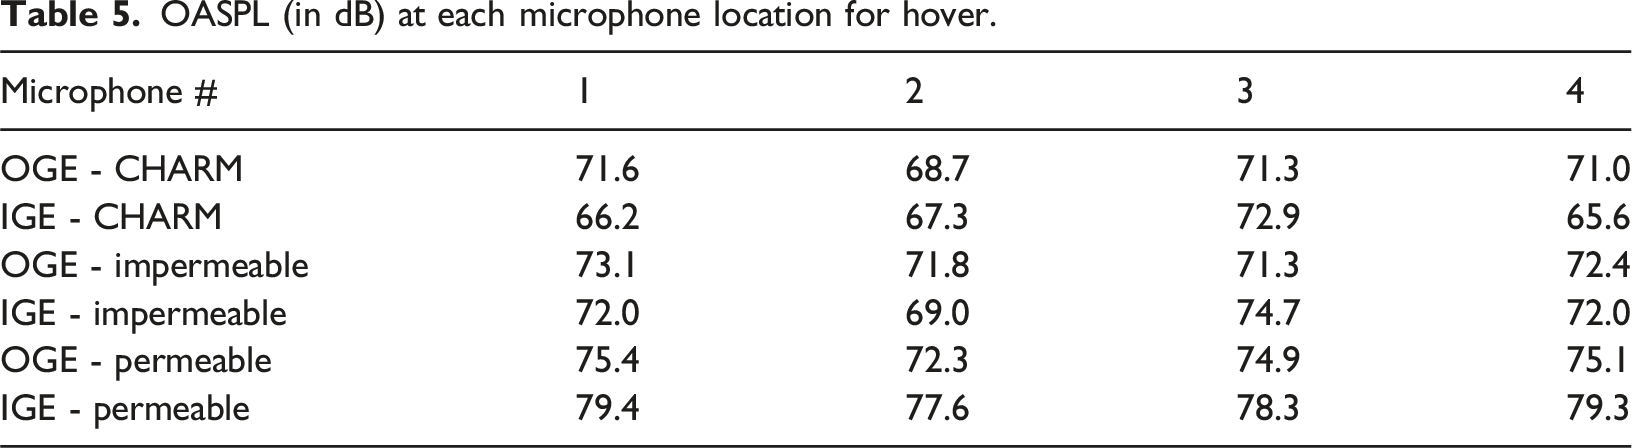
The CHARM simulations, in contrast, do not show a broadband increase for IGE at any situation. This expected as CHARM calculations do not resolve broadband noise. The simulations indicate that ground effect increases noise levels by approximately 2–5 dB for both impermeable and permeable surfaces, depending on microphone position.
A previous numerical study of side-by-side eVTOL rotors in ground effect reported a 4 dBA increase in OASPL at a distance of 2R from the ground for a 0% overlap configuration. 48 Despite differences in geometry and configuration, this prior work supports the general trend observed here, namely that ground effect can lead to several decibels of noise increase in the far field.
SPL directivity maps at the BPF for the edgewise case are shown in Figure 30, while Figure 31 presents SPL comparisons along the extracted horizontal lines. In contrast to the hover case, the impermeable surface from high-fidelity simulations predict higher noise levels at the BPF when compared with both the permeable surface and CHARM results. Nevertheless, all approaches consistently predict increased noise levels toward the upper region of the directivity map. This behavior is likely associated with the incoming freestream velocity direction, which promotes blade-vortex interactions (BVI) that radiate noise toward that region. Far-field SPL contour at BPF from DES simulations for OGE and IGE cases - Edgewise. Far-field SPL comparison at BPF for OGE and IGE cases - Edgewise.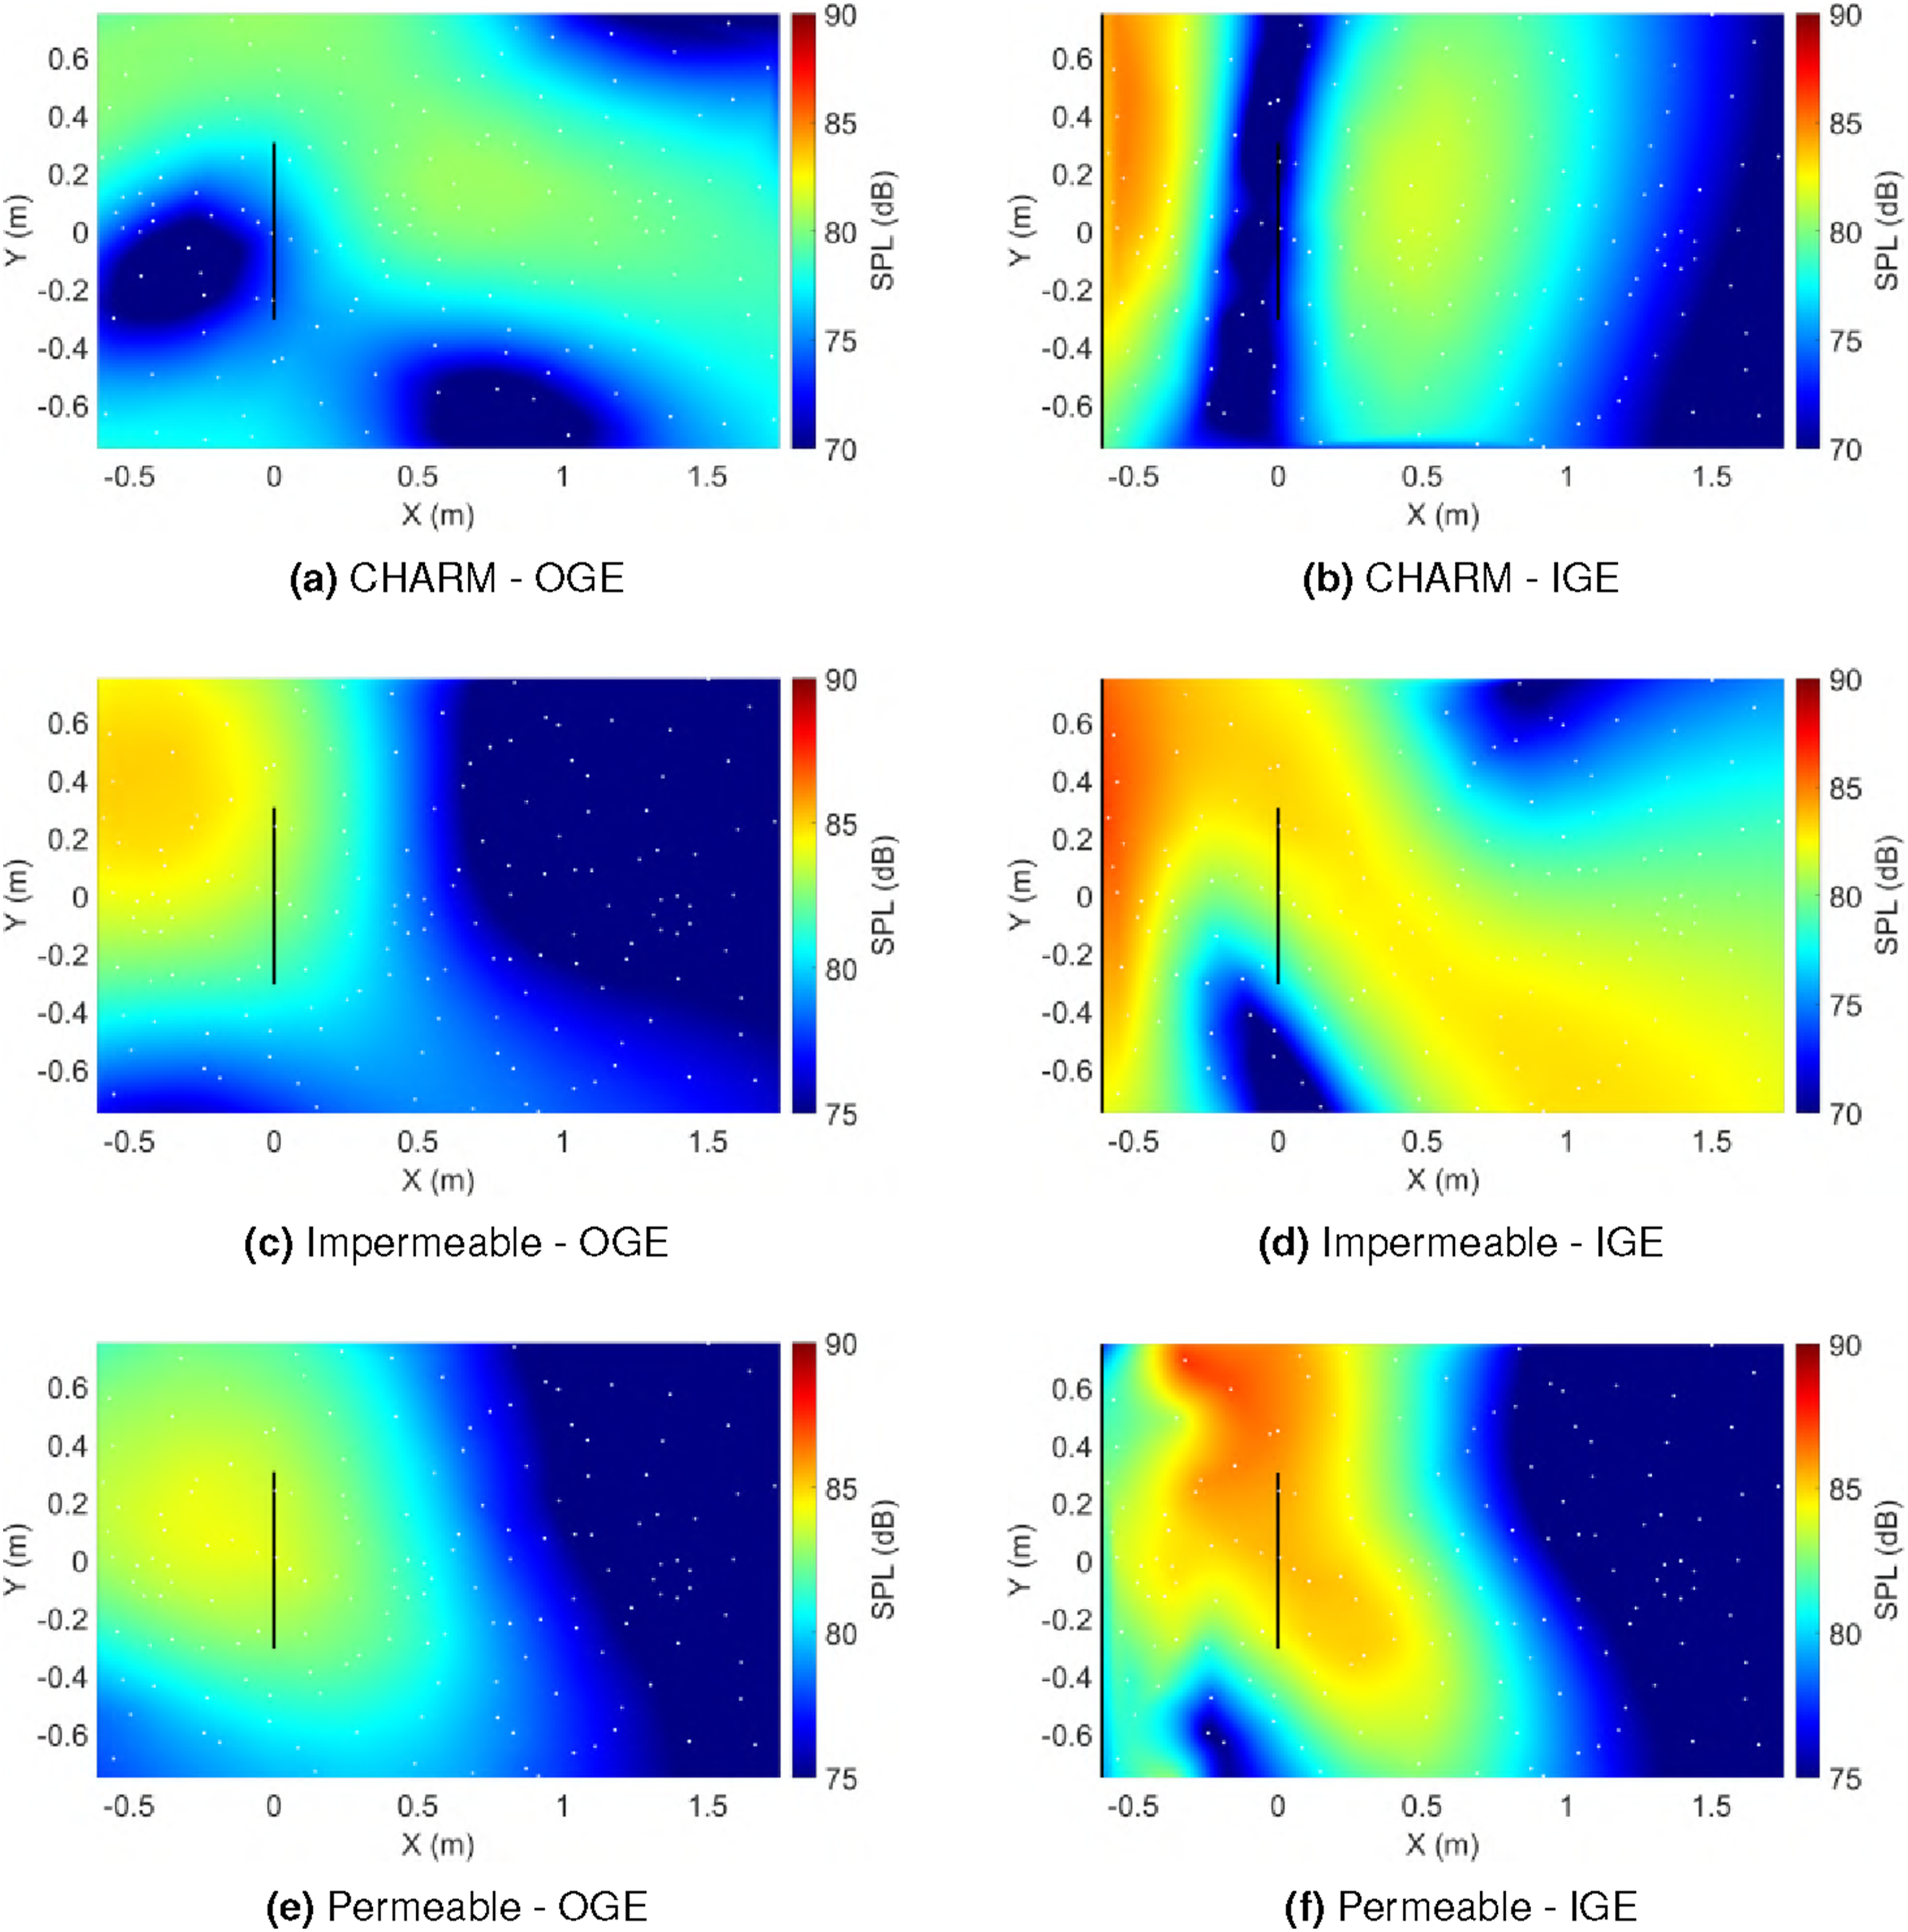
Although the directivity trend for CHARM and high-fidelity simulations do not compare well for the OGE condition, similarities can be observed between the impermeable surface high-fidelity results and CHARM predictions for the IGE cases. The directivity trends differ significantly among the methods, highlighting the sensitivity and complexity of edgewise noise prediction compared with hover. Despite this complexity, such analyses are essential, as these propellers operate under dynamic conditions. Additionally, the distance of the microphone array may influence the resulting directivity maps, and this requires further investigation.
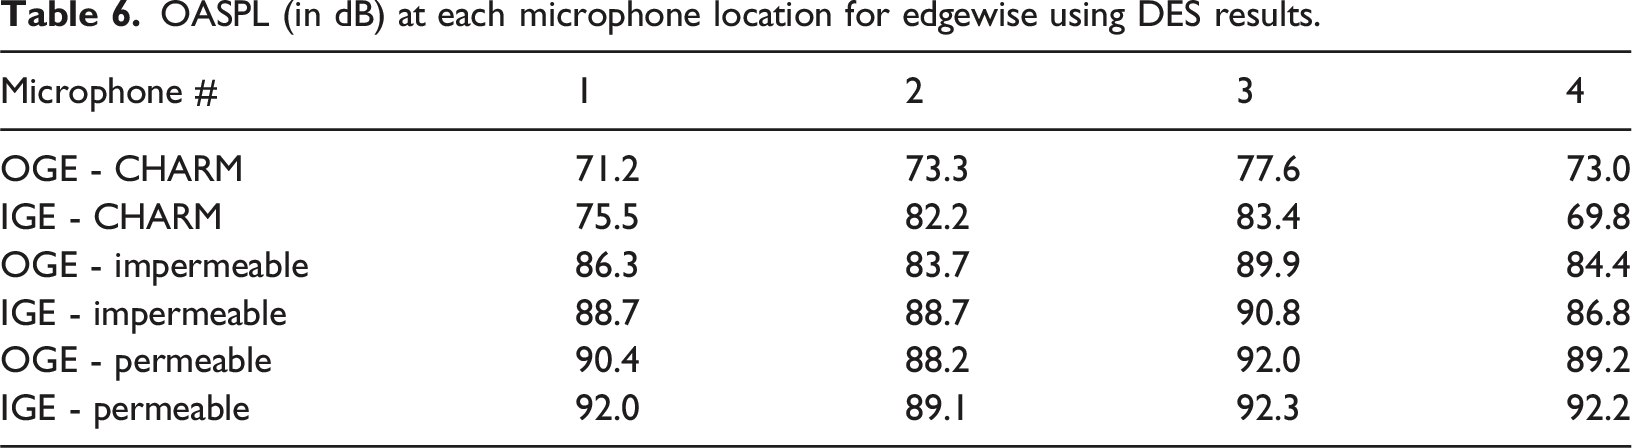
The PSD spectra comparisons shown in Figures 32 through 34 consistently indicate an increase in noise levels at the BPF when transitioning from OGE to IGE conditions. This increase leads to higher OASPL values, as summarized in Table 6. The observed increase of approximately 2–5 dB does not appear to be associated with an increase in broadband noise, since the spectral content outside the BPF remains largely unchanged between OGE and IGE cases. PSD spectra comparison from Edgewise CHARM results at different observers. PSD spectra comparison from Edgewise DES results at different observers - Impermeable surface. PSD spectra comparison from Edgewise DES results at different observers - Permeable surface. OASPL (in dB) at each microphone location for edgewise using DES results.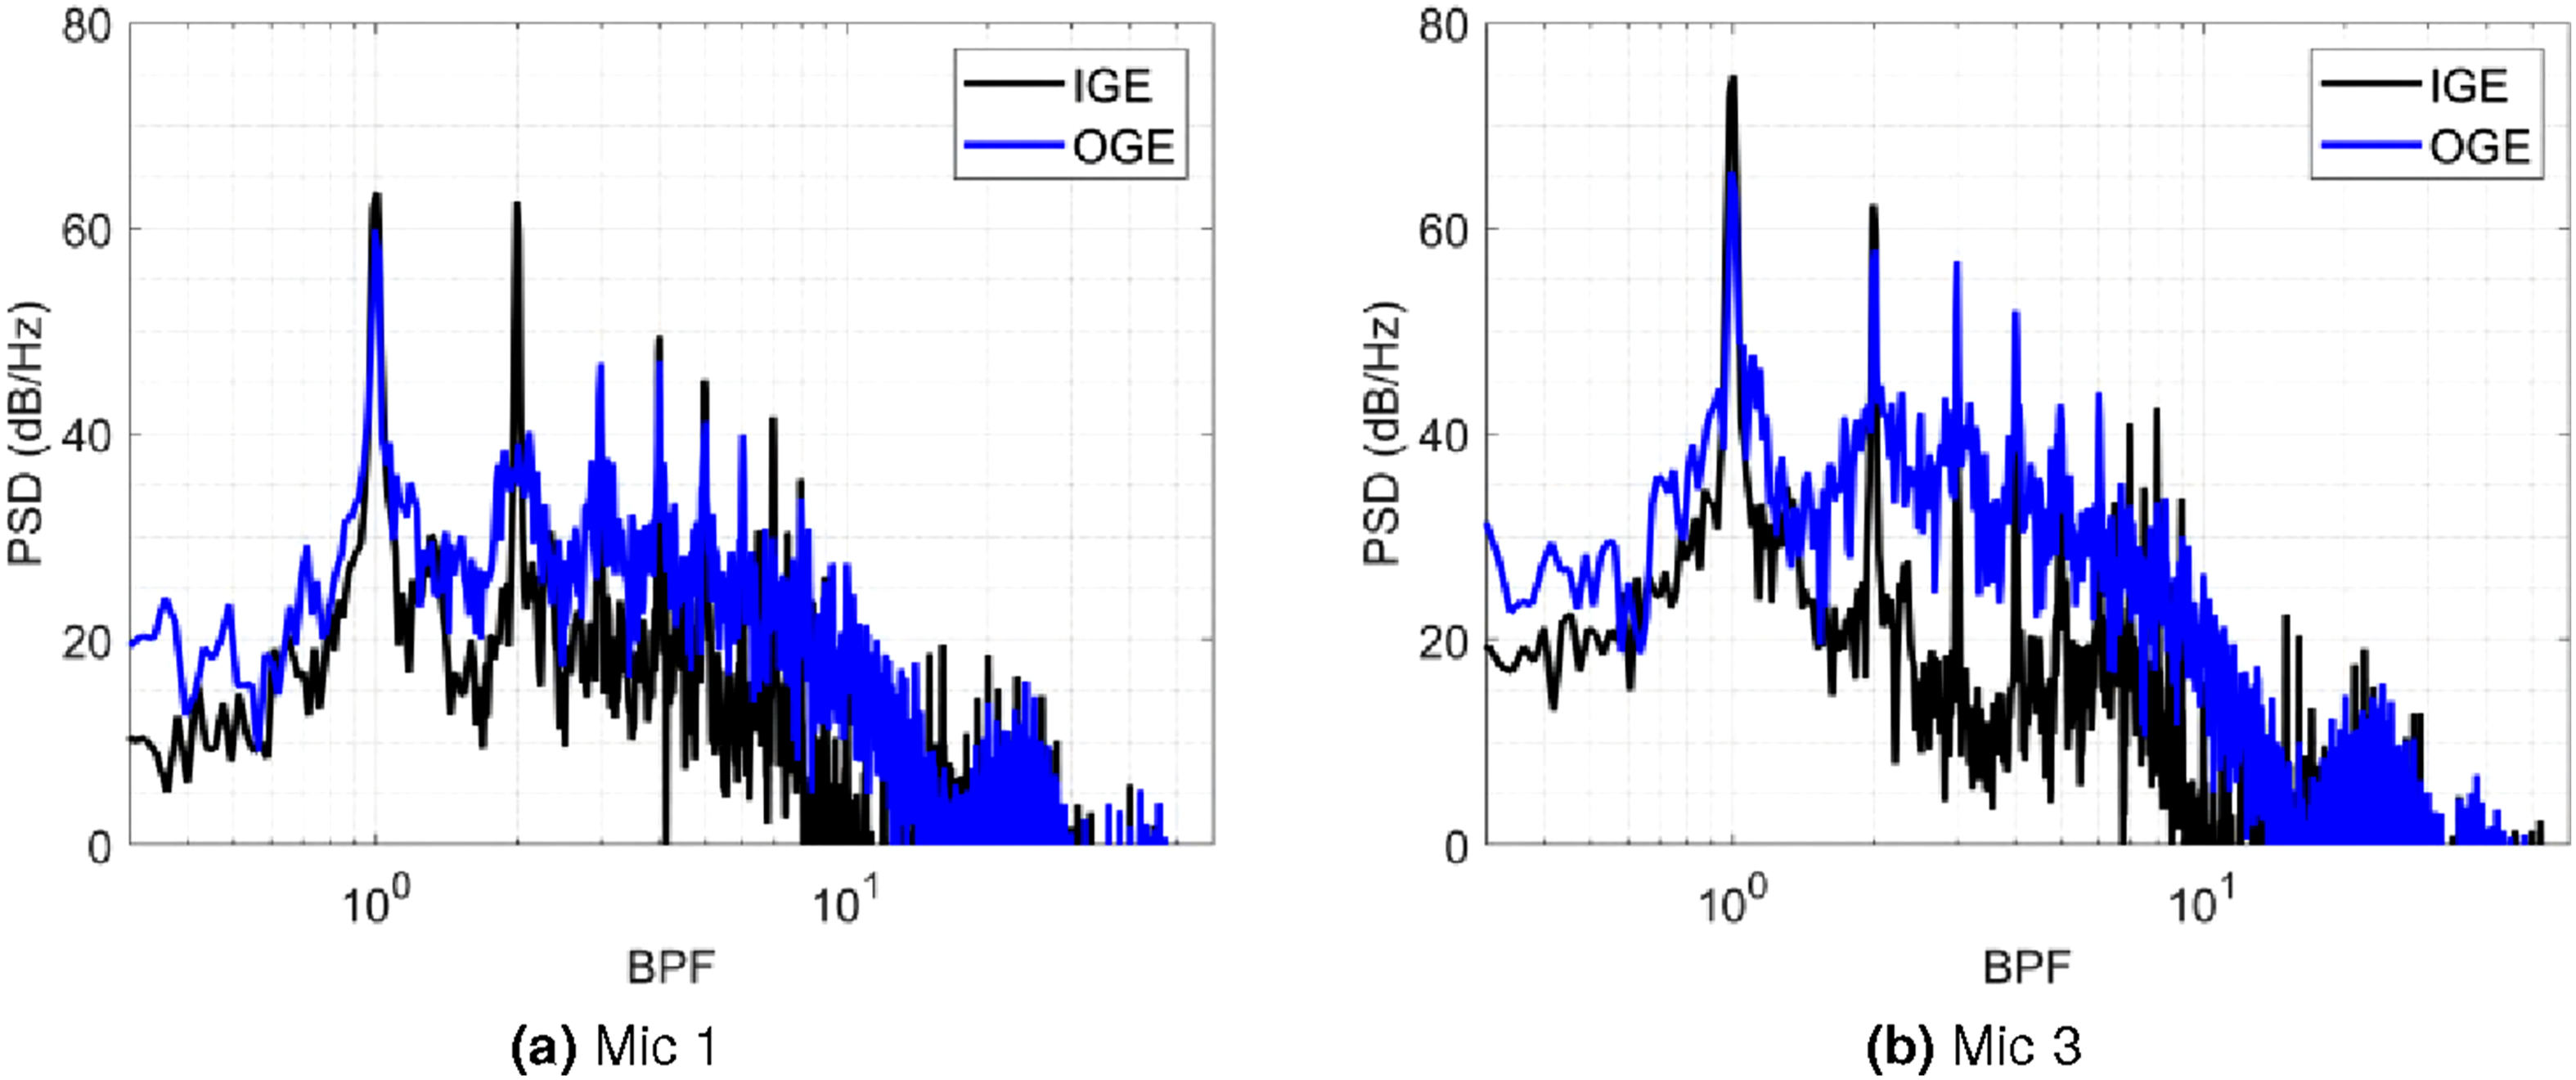
Ground cleareance effects on acoustics
This section presents a parametric acoustic analysis of the propeller operating at different ground clearances using the mid-fidelity CDI-CHARM framework. By varying the rotor height above the ground, the objective is to isolate and quantify the influence of ground proximity on far-field noise levels, directivity, and spectral characteristics.
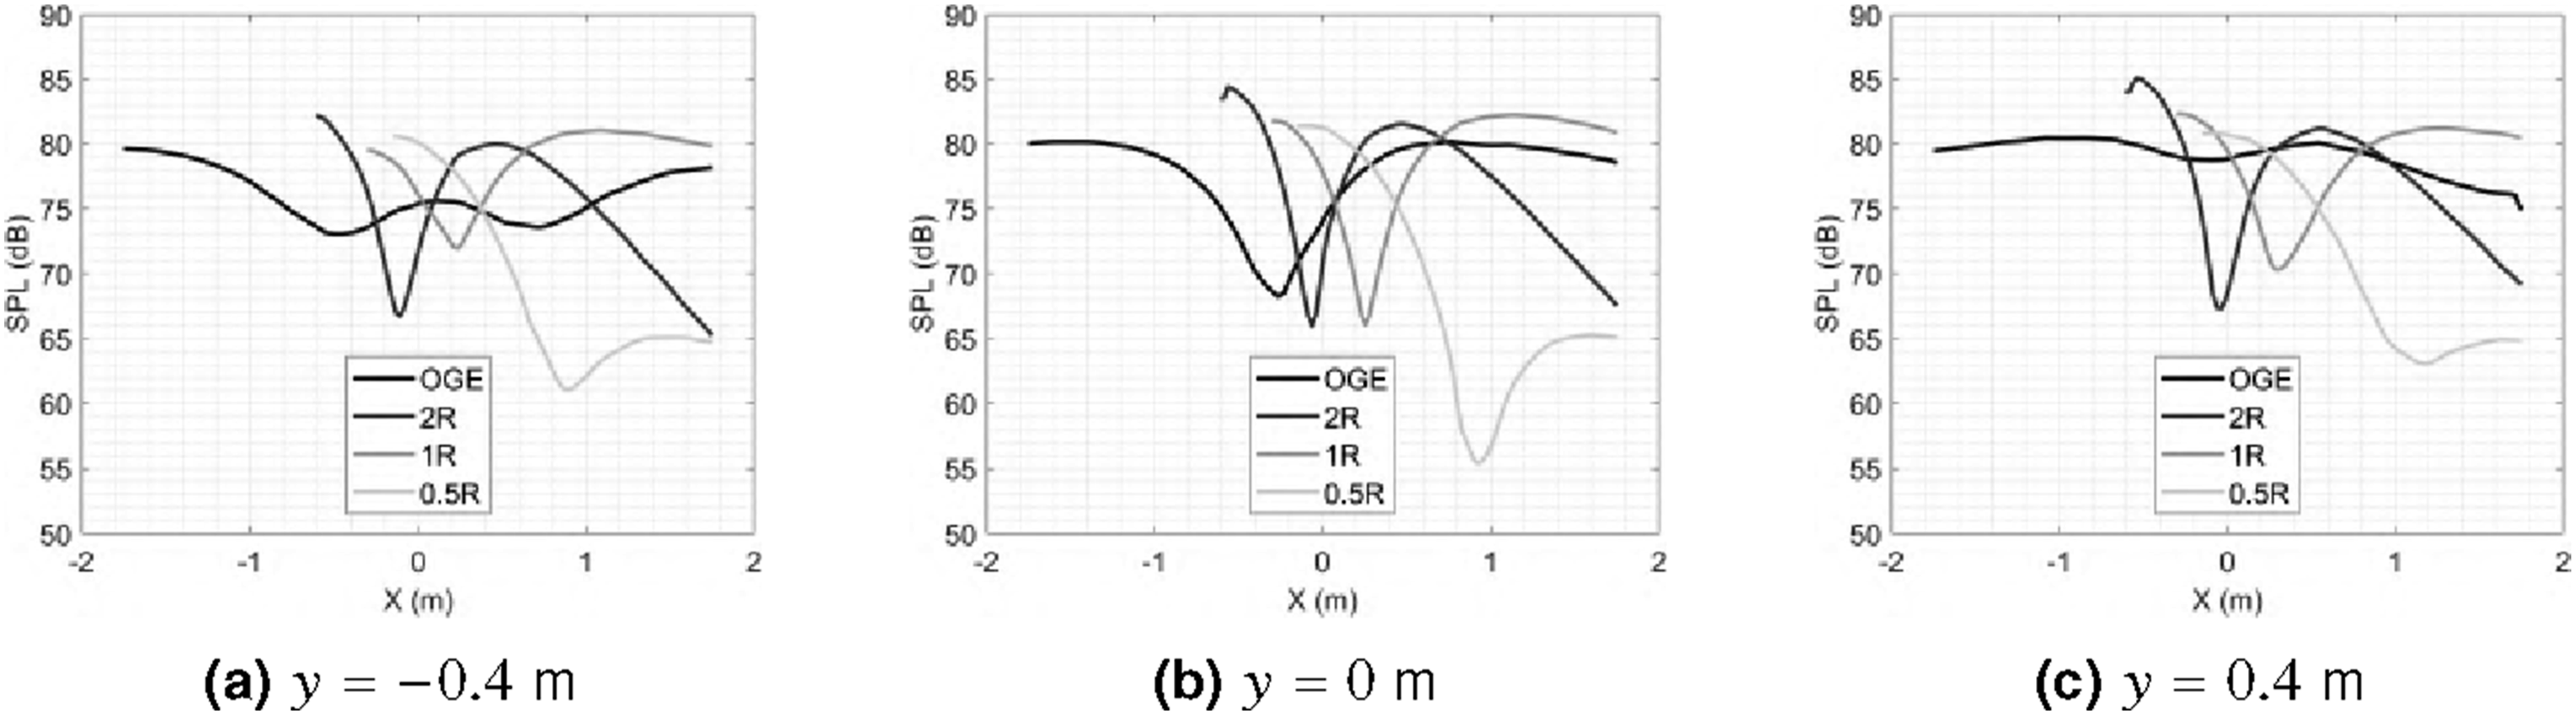
Figure 35 presents SPL contours at the BPF for the hover case at 4000 RPM, as computed using CHARM. The analysis includes both the isolated propeller case and configurations where the propeller operates 0.5, 1, and 2 propeller radii above the ground. To better understand the directivity maps, Figure 36 presents SPL comparison at the BPF extracted over horizontal slices at Far-field SPL contour at BPF for varying ground distances using CHARM - Hover. Far-field SPL comparison at BPF for varying ground distances using CHARM - Hover.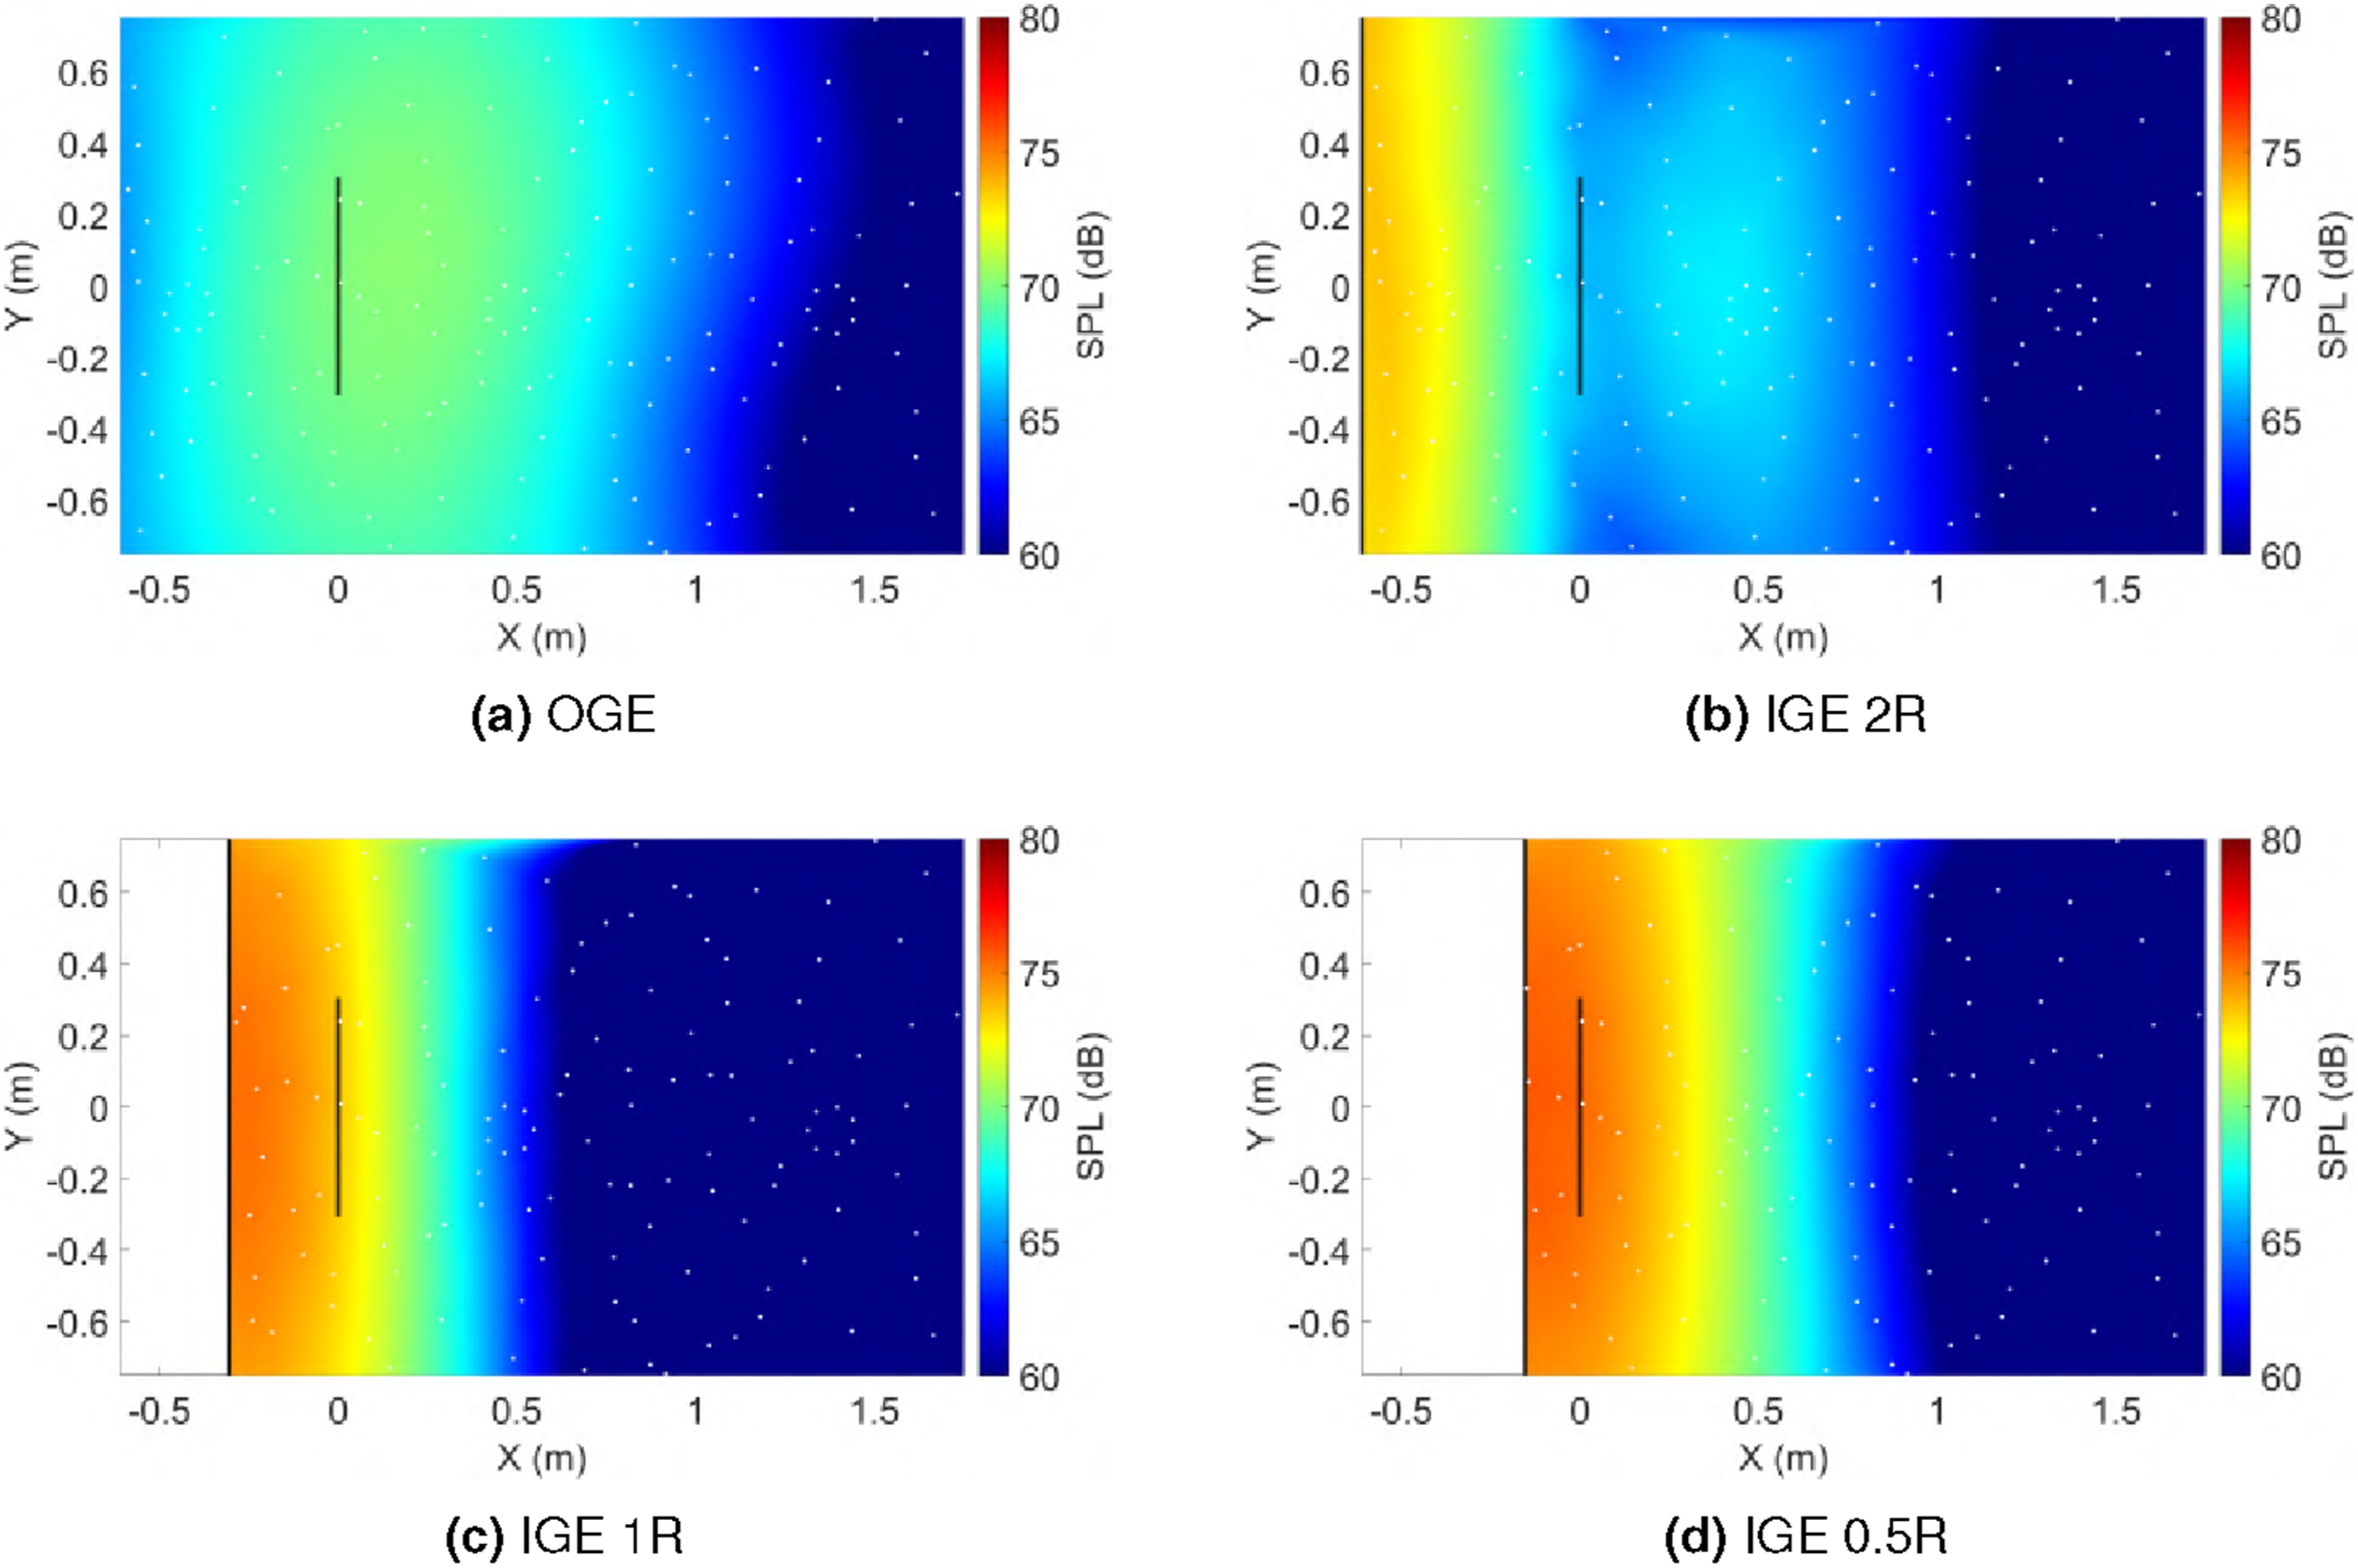
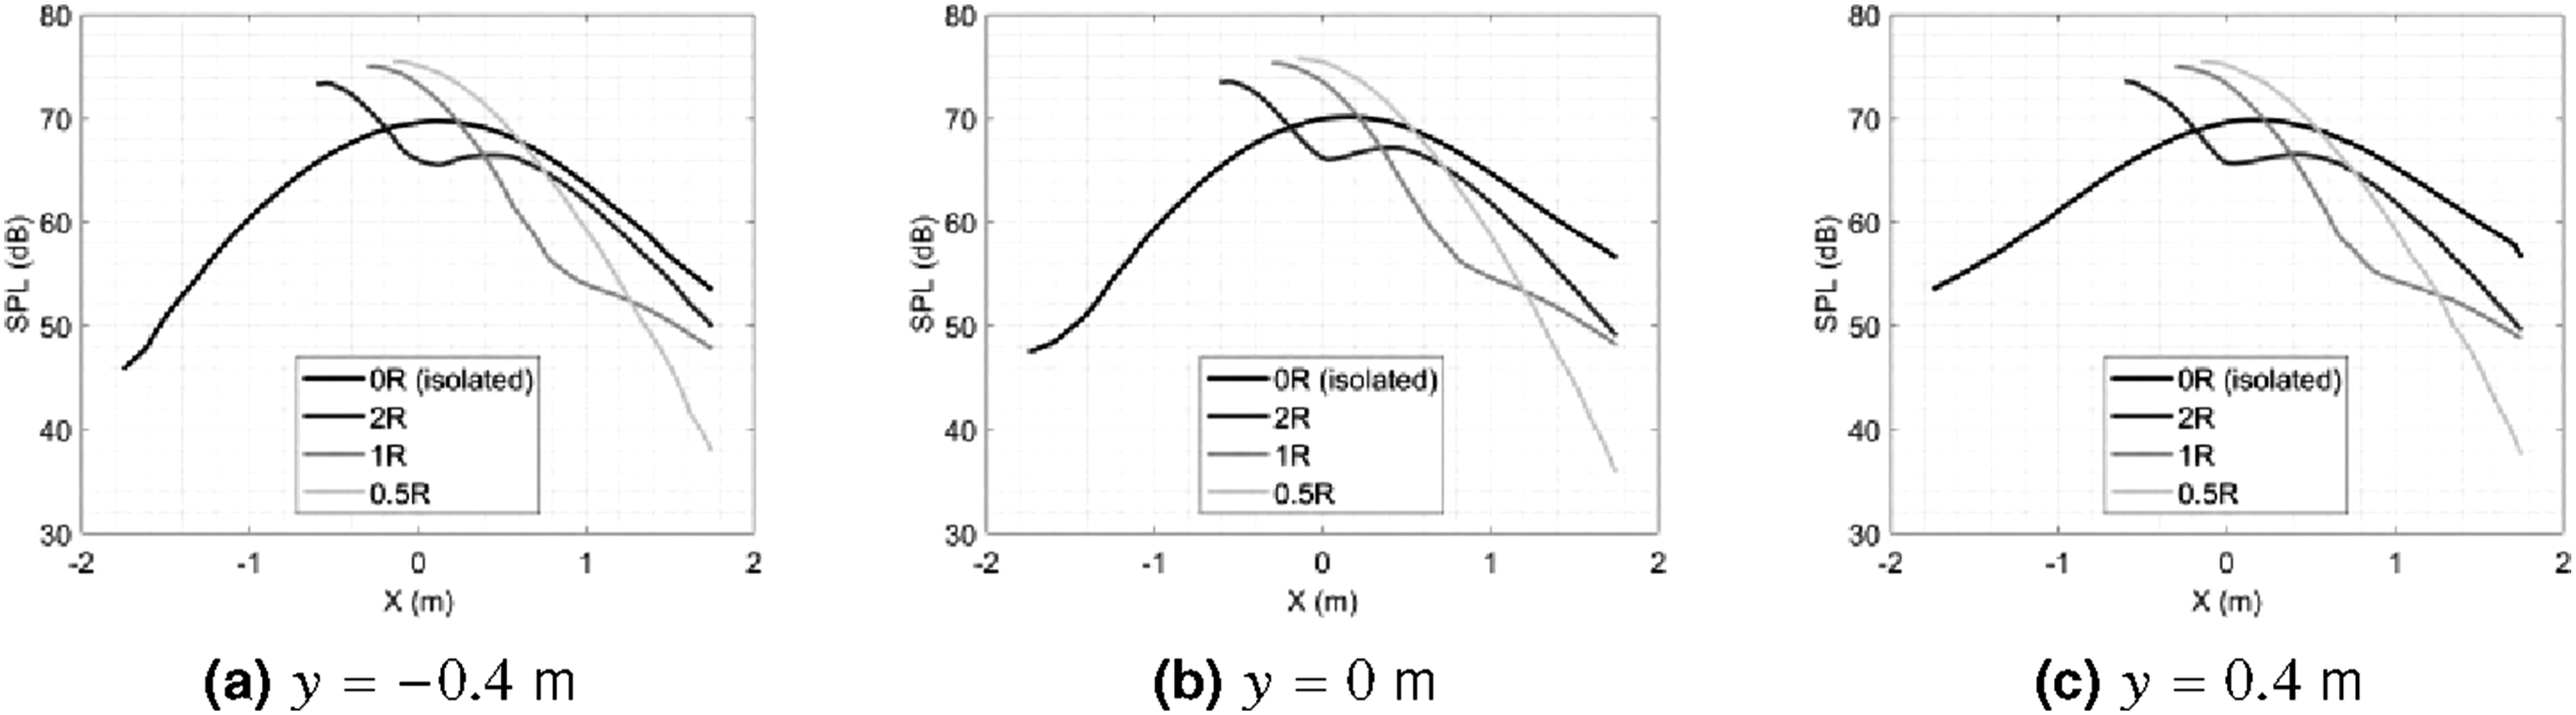
This comparison clearly shows that CHARM predicts an increase in noise between the ground and the propeller due to ground reflections, while slightly reducing noise levels above the propeller, likely as a result of destructive interference. However, as the propeller gets closer to the ground, the noise beneath it continues to rise, and the quieter region above shifts upward, concentrating high noise levels around the propeller itself. The SPL line plot indicates that the IGE case raises noise levels by up to 3 dB when the rotor is 2R away from the ground, while the 1R and 0.5 R configurations exhibit increases of approximately 5 dB.
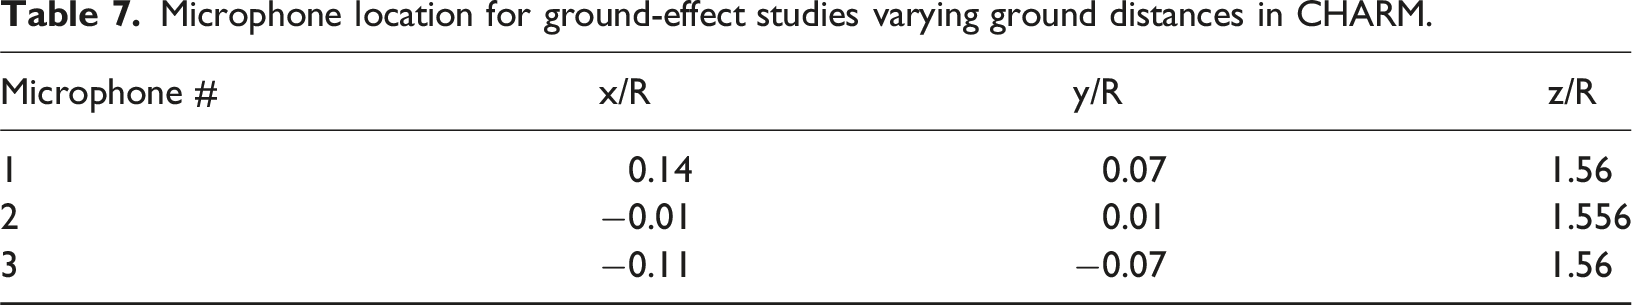
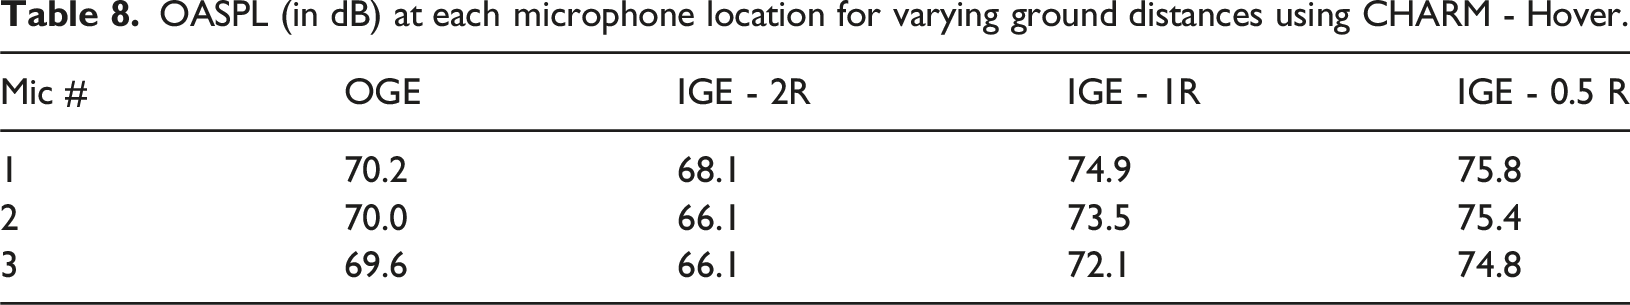
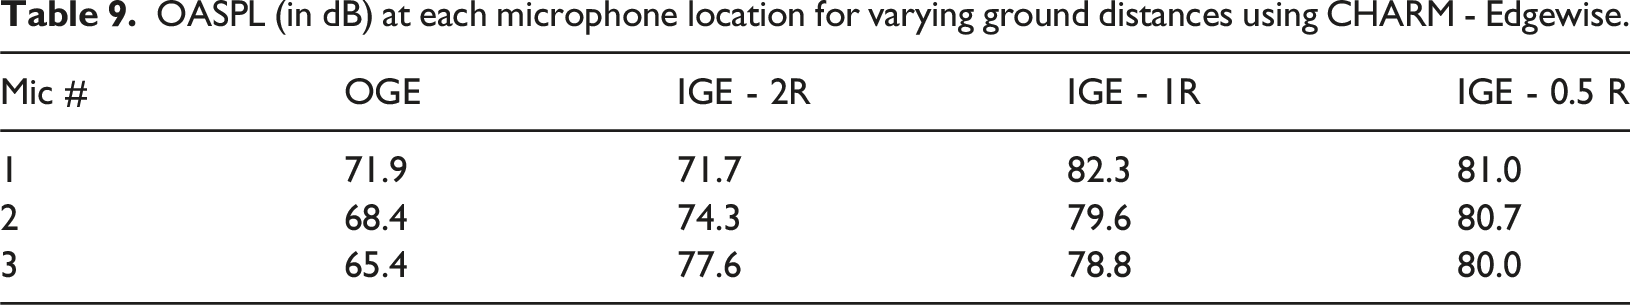
Figure 37 compares the PSD spectra for hover and ground-effect cases at various heights for three observers, whose coordinates are provided in Table 7. Table 8 presents OASPL levels (in dB) for both OGE and IGE cases. As in the validation analysis, only the frequency range from 1 BPF (333 Hz) to 7 BPF (2331 Hz) is considered for the OASPL calculation. PSD spectra comparison for varying ground distances using CHARM - Hover. Microphone location for ground-effect studies varying ground distances in CHARM. OASPL (in dB) at each microphone location for varying ground distances using CHARM - Hover.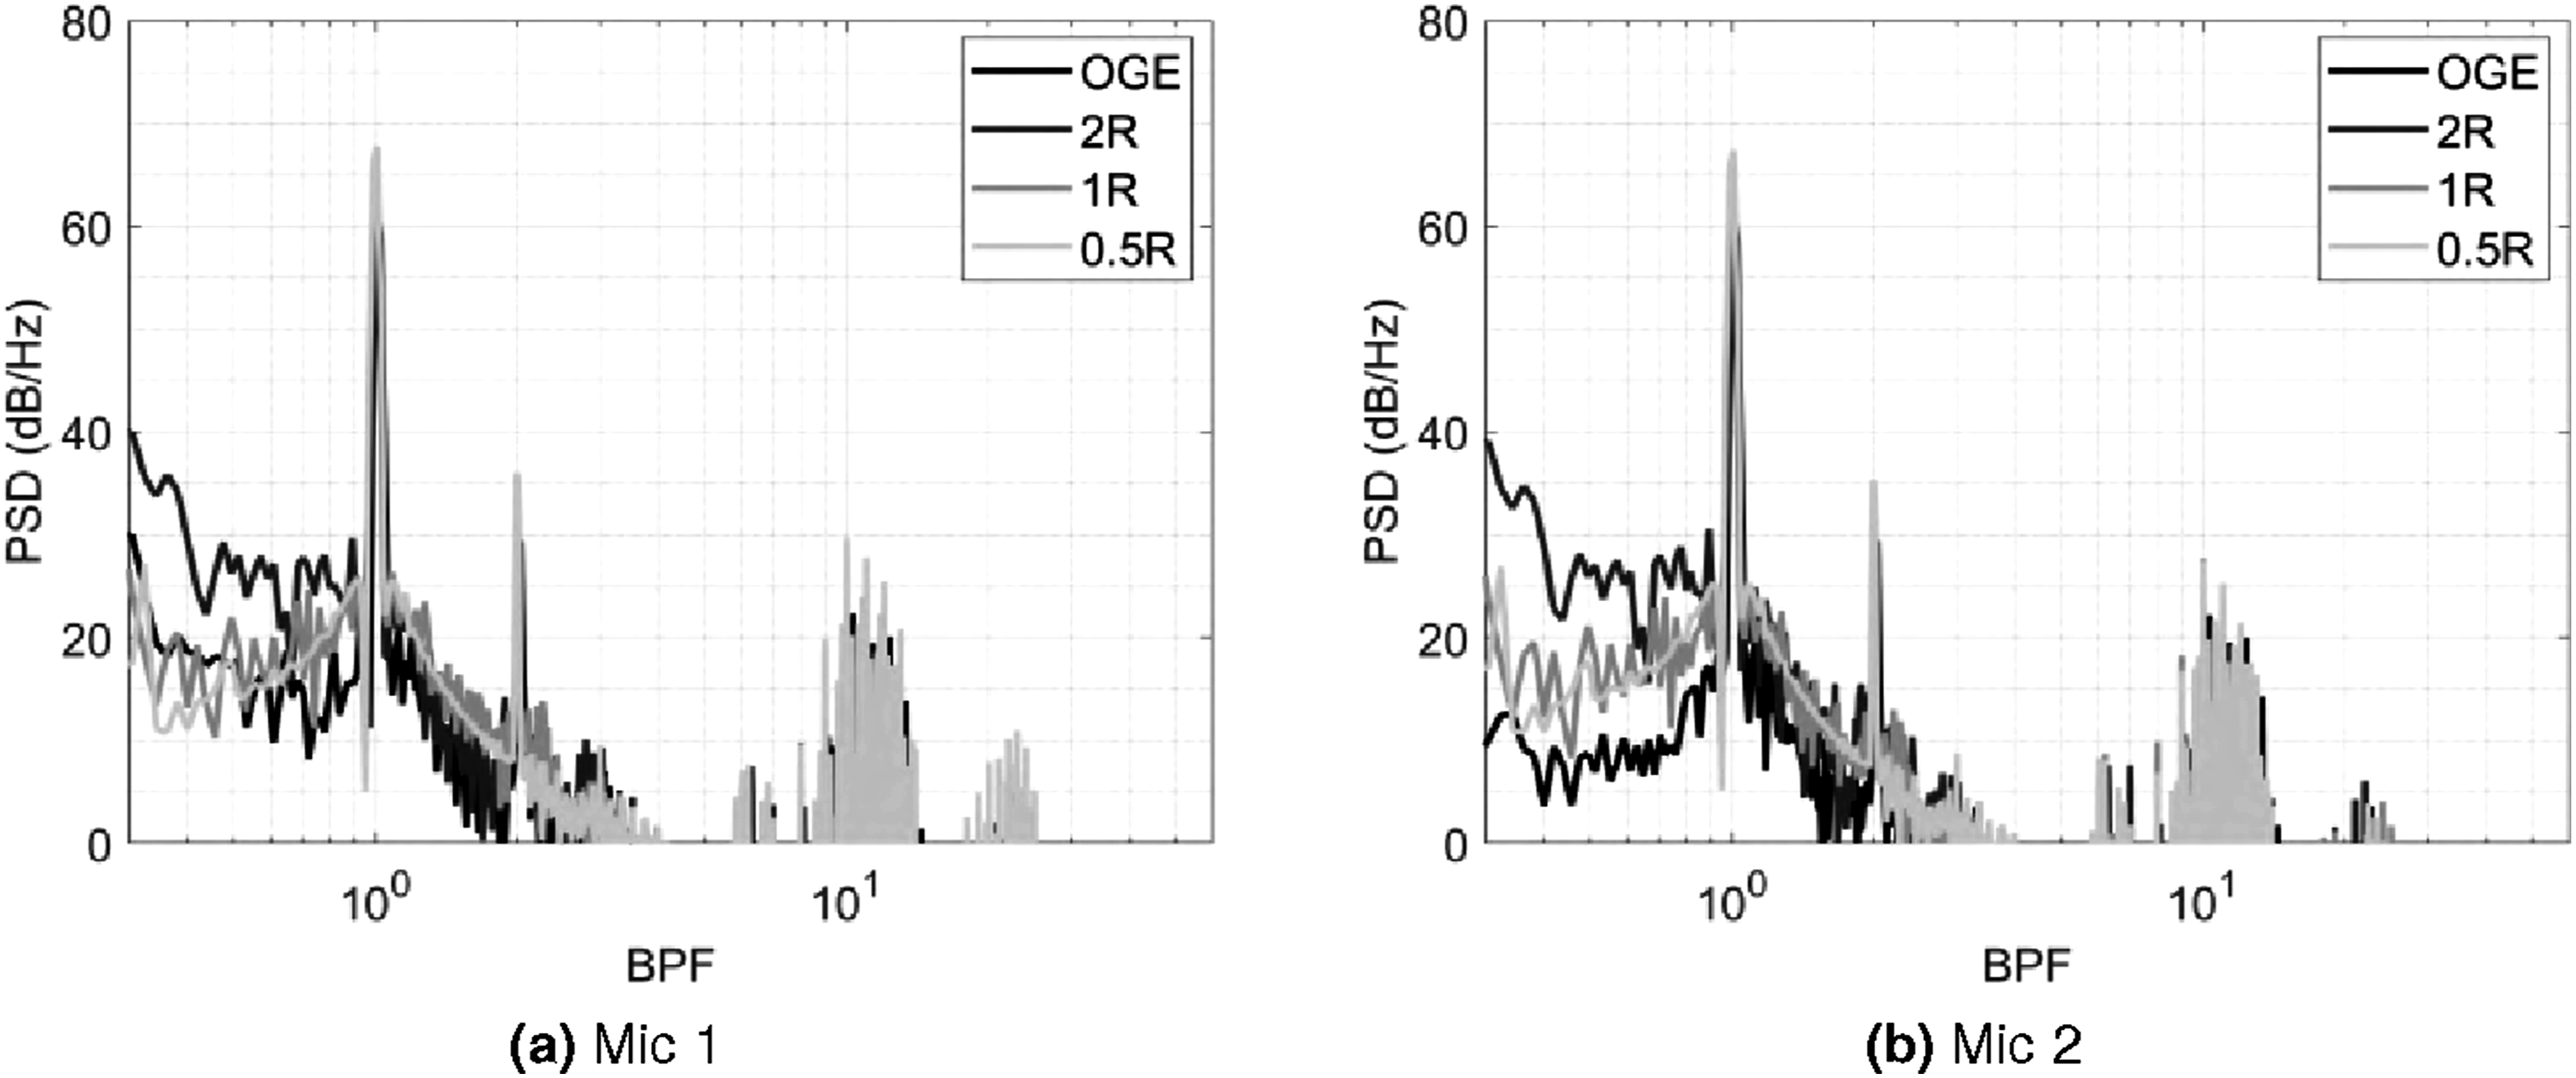
As the propeller moves closer to the ground, the increase in BPF noise becomes progressively more pronounced It is also worth noting that noise levels at the second harmonic
A similar analysis was performed for the edgewise flight condition. The directivity maps are shown in Figures 38 and 39 presents comparisons of noise levels along the extracted horizontal lines. As noted above, the freestream arrives from the top of the directivity map, coinciding with the region of maximum radiated noise. The ground-effect configurations produce a pronounced interference pattern, with alternating zones of constructive and destructive wave interaction. Far-field SPL contour at BPF for varying ground distances using CHARM - Edgewise. Far-field SPL comparison at BPF for varying ground distances using CHARM - Edgewise.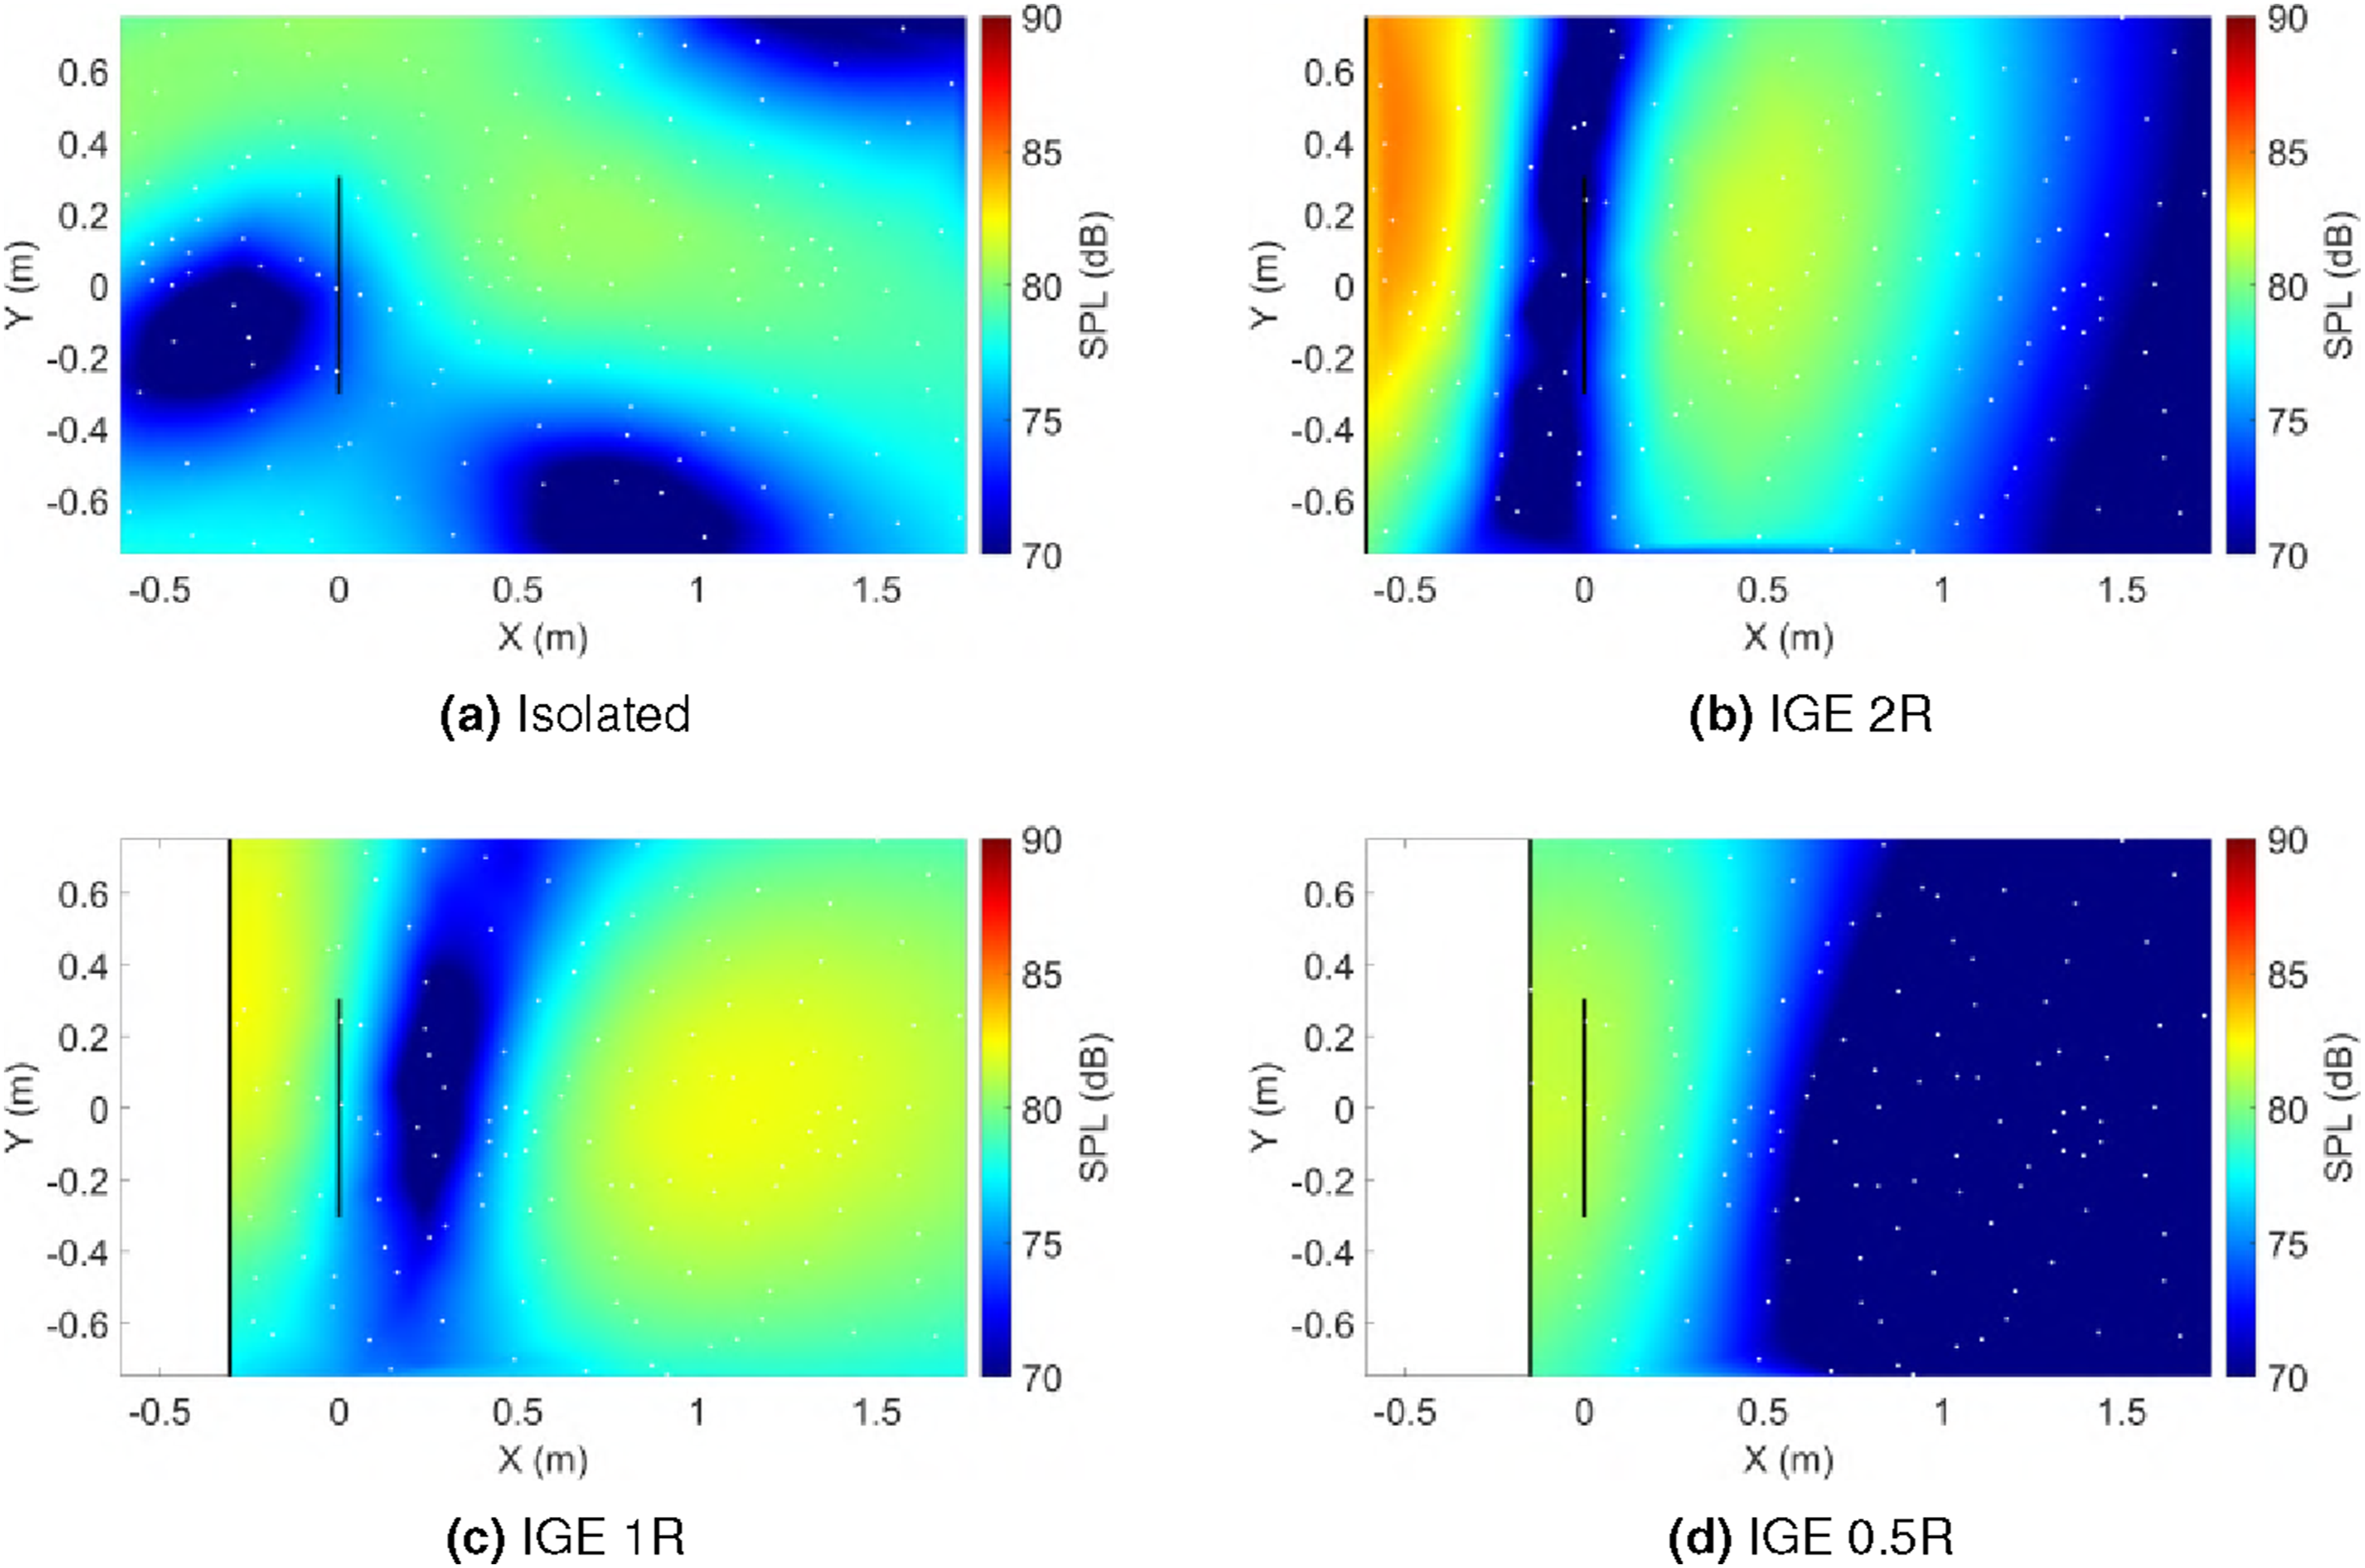
Despite the oscillatory spatial pattern exhibited by the IGE cases, an increase in far-field noise is observed in the region between the propeller and the ground. SPL increases by more than 10 dB when the rotor is at a clearance of
Because CHARM employs an impermeable surface acoustic formulation, one might expect higher thrust to correlate directly with higher BPF noise. However, this simple correlation does not hold for the edgewise ground-effect cases when the rotor is very close to the ground, indicating a more complex coupling among loading, vortex dynamics, and acoustic radiation under those conditions.
Figure 40 compares PSD spectra from several microphones and shows that the edgewise configuration produces substantially stronger harmonic content than hover, even though broadband predictions from CHARM may be less accurate. With respect to ground effect, the spectral trends at the microphone located between the rotor disk and the ground (mic 1) and the in-plane microphone (mic 2) are similar. At a clearance of PSD spectra comparison for varying ground distances using CHARM - Edgewise. OASPL (in dB) at each microphone location for varying ground distances using CHARM - Edgewise.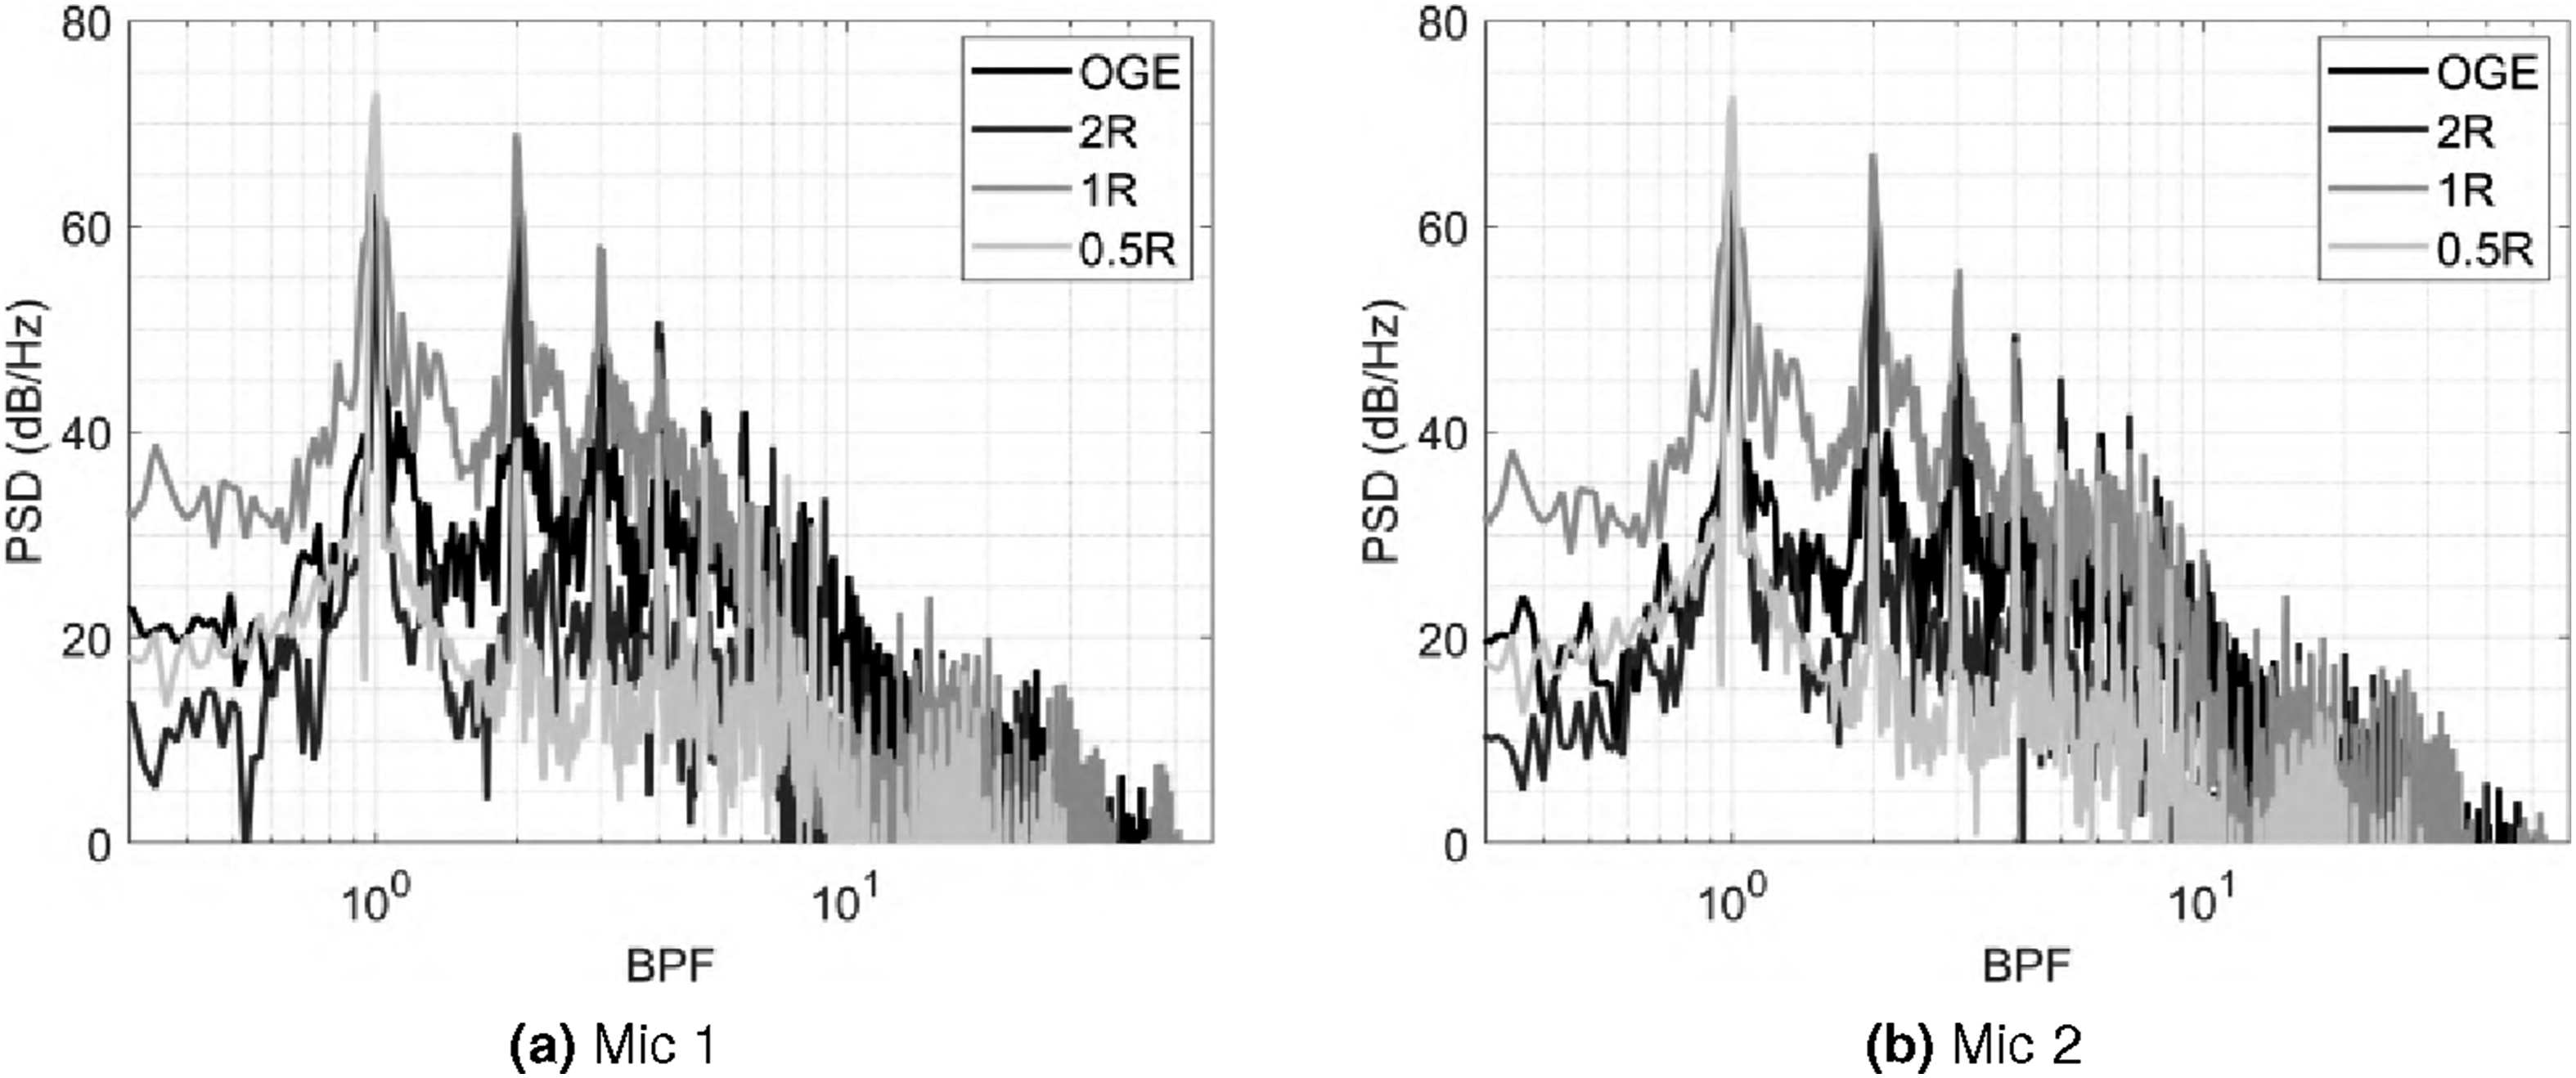
As noted in the hover analysis, microphone-array distance is likely to influence the observed directivity and spectral levels. A systematic study of array placement would therefore be valuable in future work to assess ground-effect noise signatures.
Discussion on the method of images
For impermeable surfaces, the MOI is essential to estimate ground reflections, since the acoustic integration surface is restricted to the propeller geometry and cannot capture waves reflected from the ground. In this case, the MOI assumes a perfectly reflecting ground plane, thereby predicting the contribution of waves as if they were
Permeable surfaces, by contrast, can capture ground-reflected waves directly, provided that the integration surface extends sufficiently to enclose the main reflection region. However, if the permeable surface is not large enough, it will miss part of the reflected wave field, requiring the use of the MOI to approximate the missing portion. This was the case in a previous study, 54 where a shallower permeable surface failed to fully enclose the reflection zone, and the addition of the MOI was necessary to recover the missing contributions. The drawback of this hybrid approach is the risk of double counting waves already captured by the permeable surface are also estimated via the MOI, artificially amplifying their contribution in the final result.
The “upside-down T” permeable surface proposed in this work overcomes this limitation. Its geometry encloses both the propeller wake region and the near-ground reflection zone, capturing nearly all reflected acoustic energy without requiring the MOI. The resulting directivity maps show very similar patterns to those obtained with the shallower permeable surfaces with the MOI. 54 This demonstrates that, for high-fidelity ground-effect simulations, a carefully designed permeable surface can fully resolve the reflection phenomena without relying on additional image-source corrections.
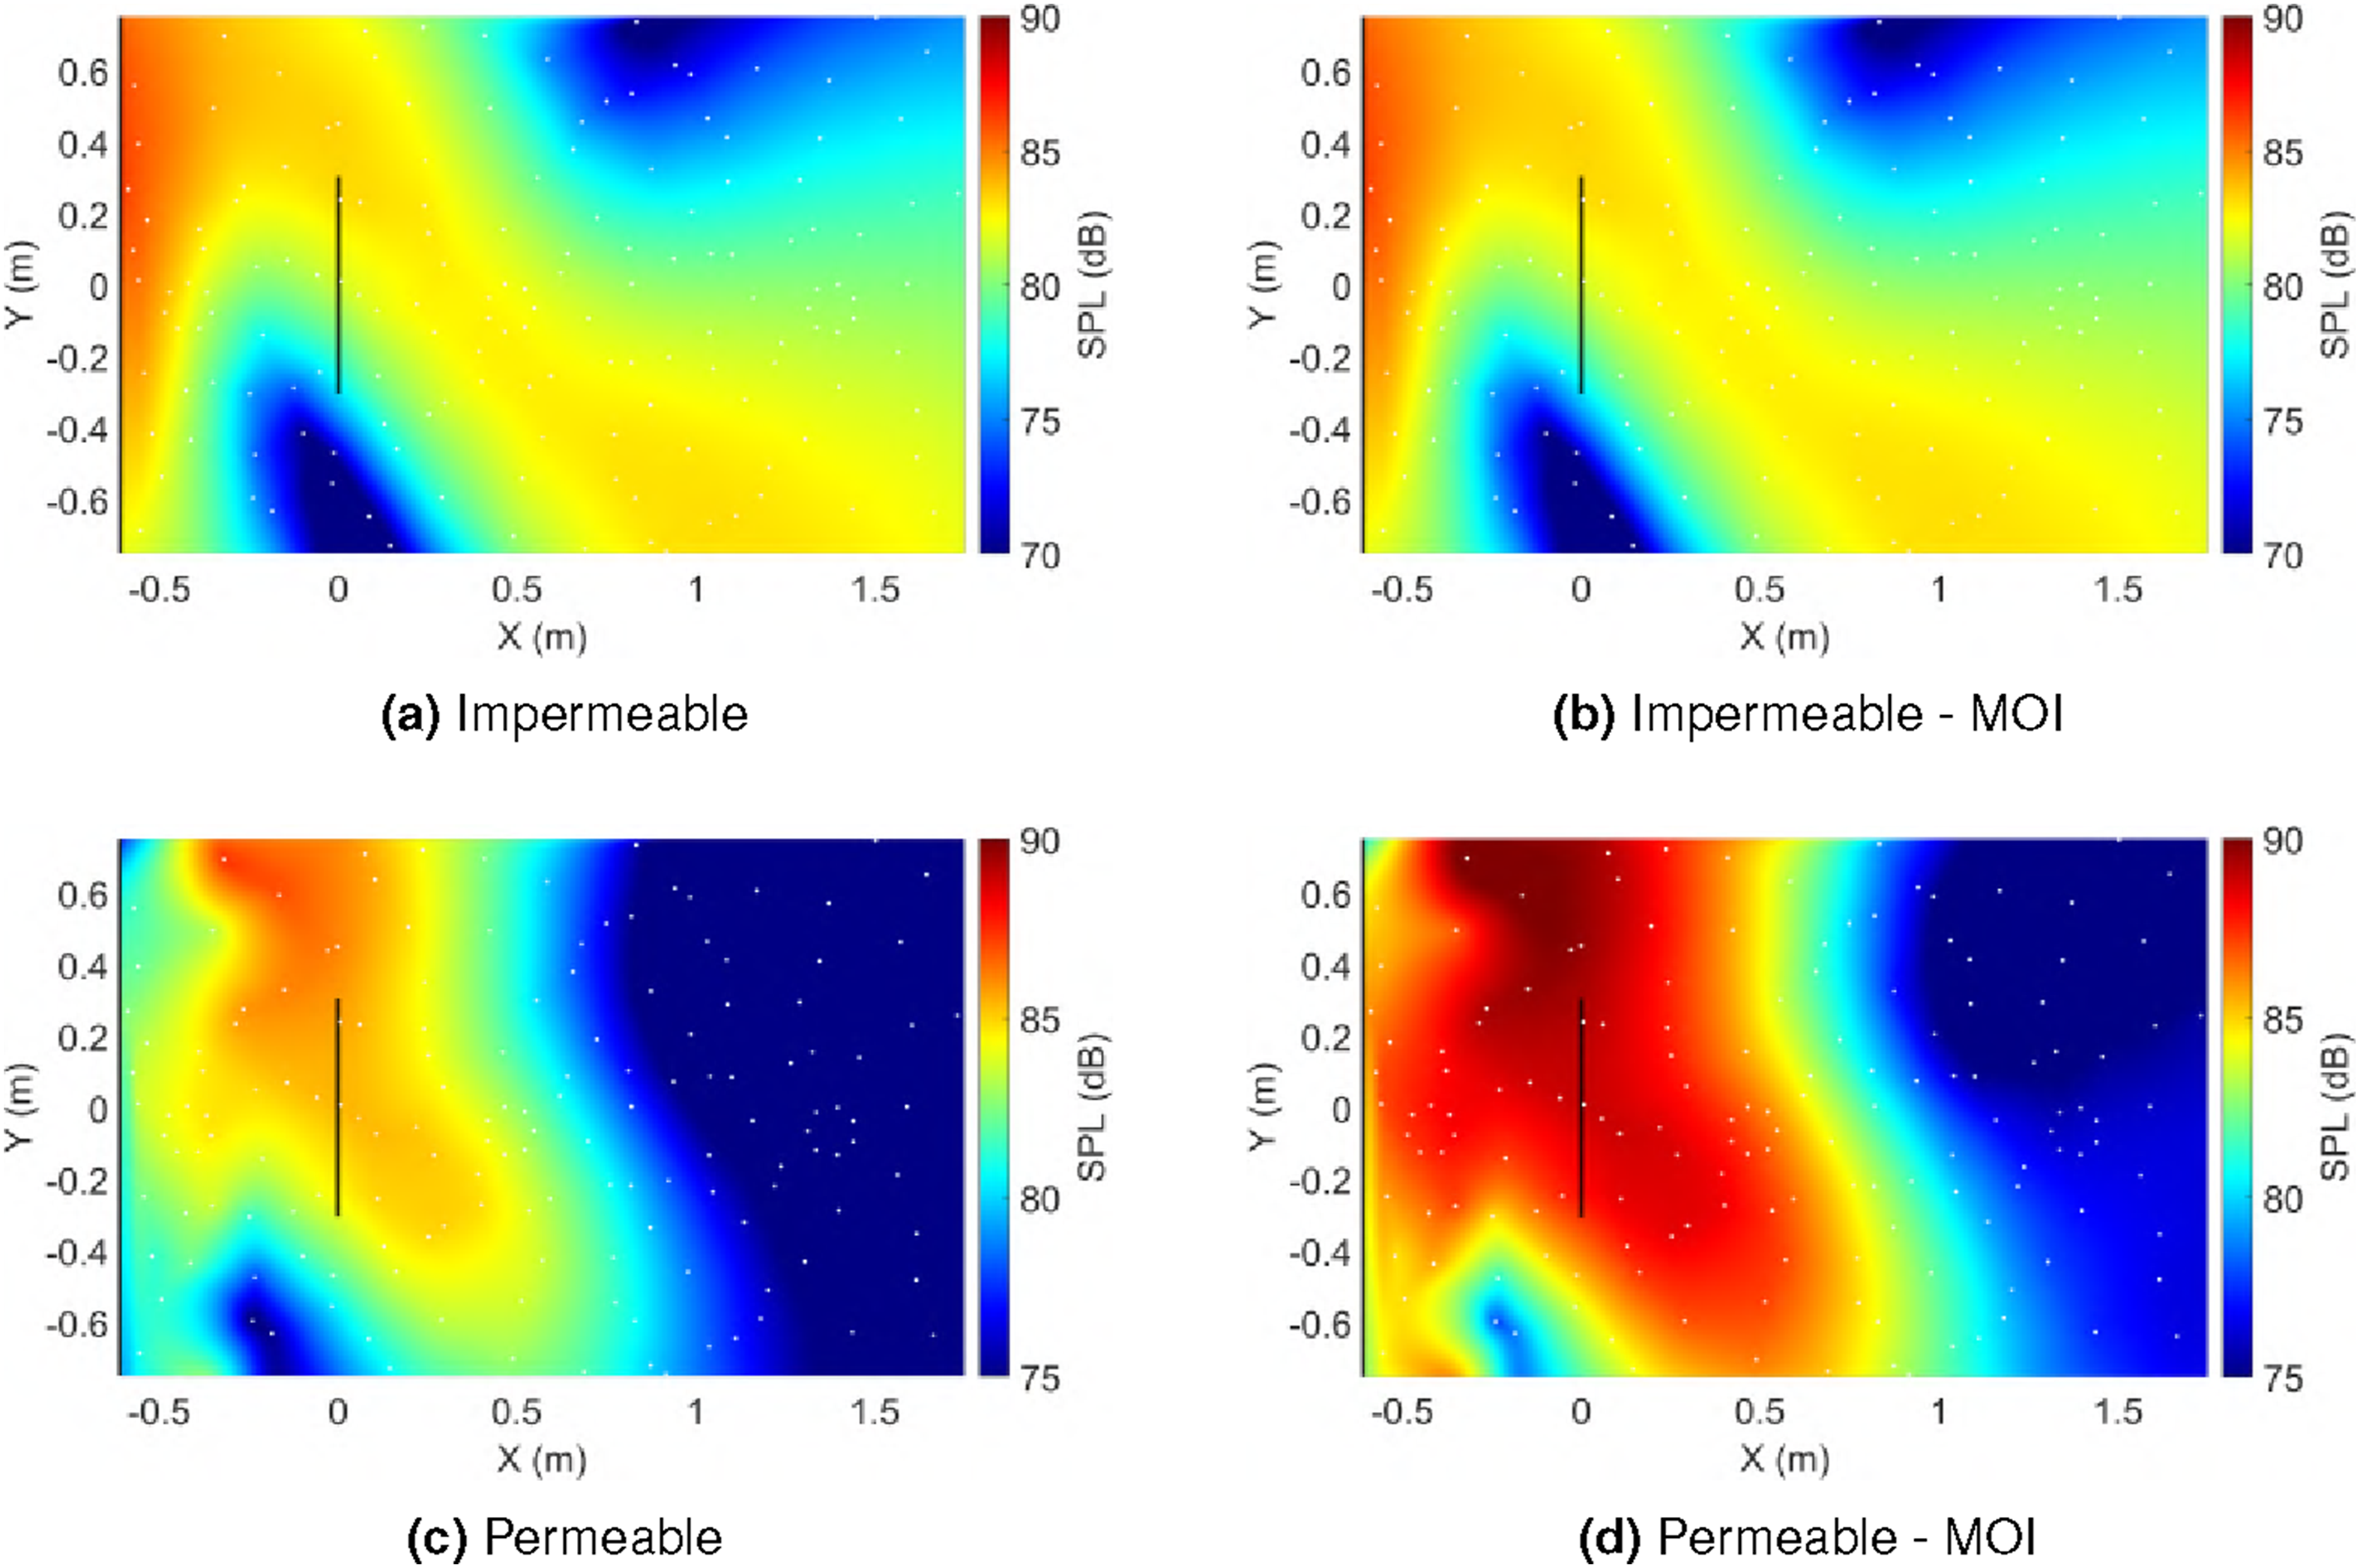
Figures 41 and 42 compare far-field directivity maps obtained with the proposed “upside-down T” permeable FW-H surfaces, both with and without the application of the MOI, for hover and edgewise flight in ground effect. This direct comparison demonstrates that applying MOI to these surfaces merely amplifies the reflected waves already captured by the permeable surface, thereby confirming our proposition. Far-field SPL contour at BPF with and without MOI using different acoustic surface techniques - Hover. Far-field SPL contour at BPF with and without MOI using different acoustic surface techniques - Edgewise.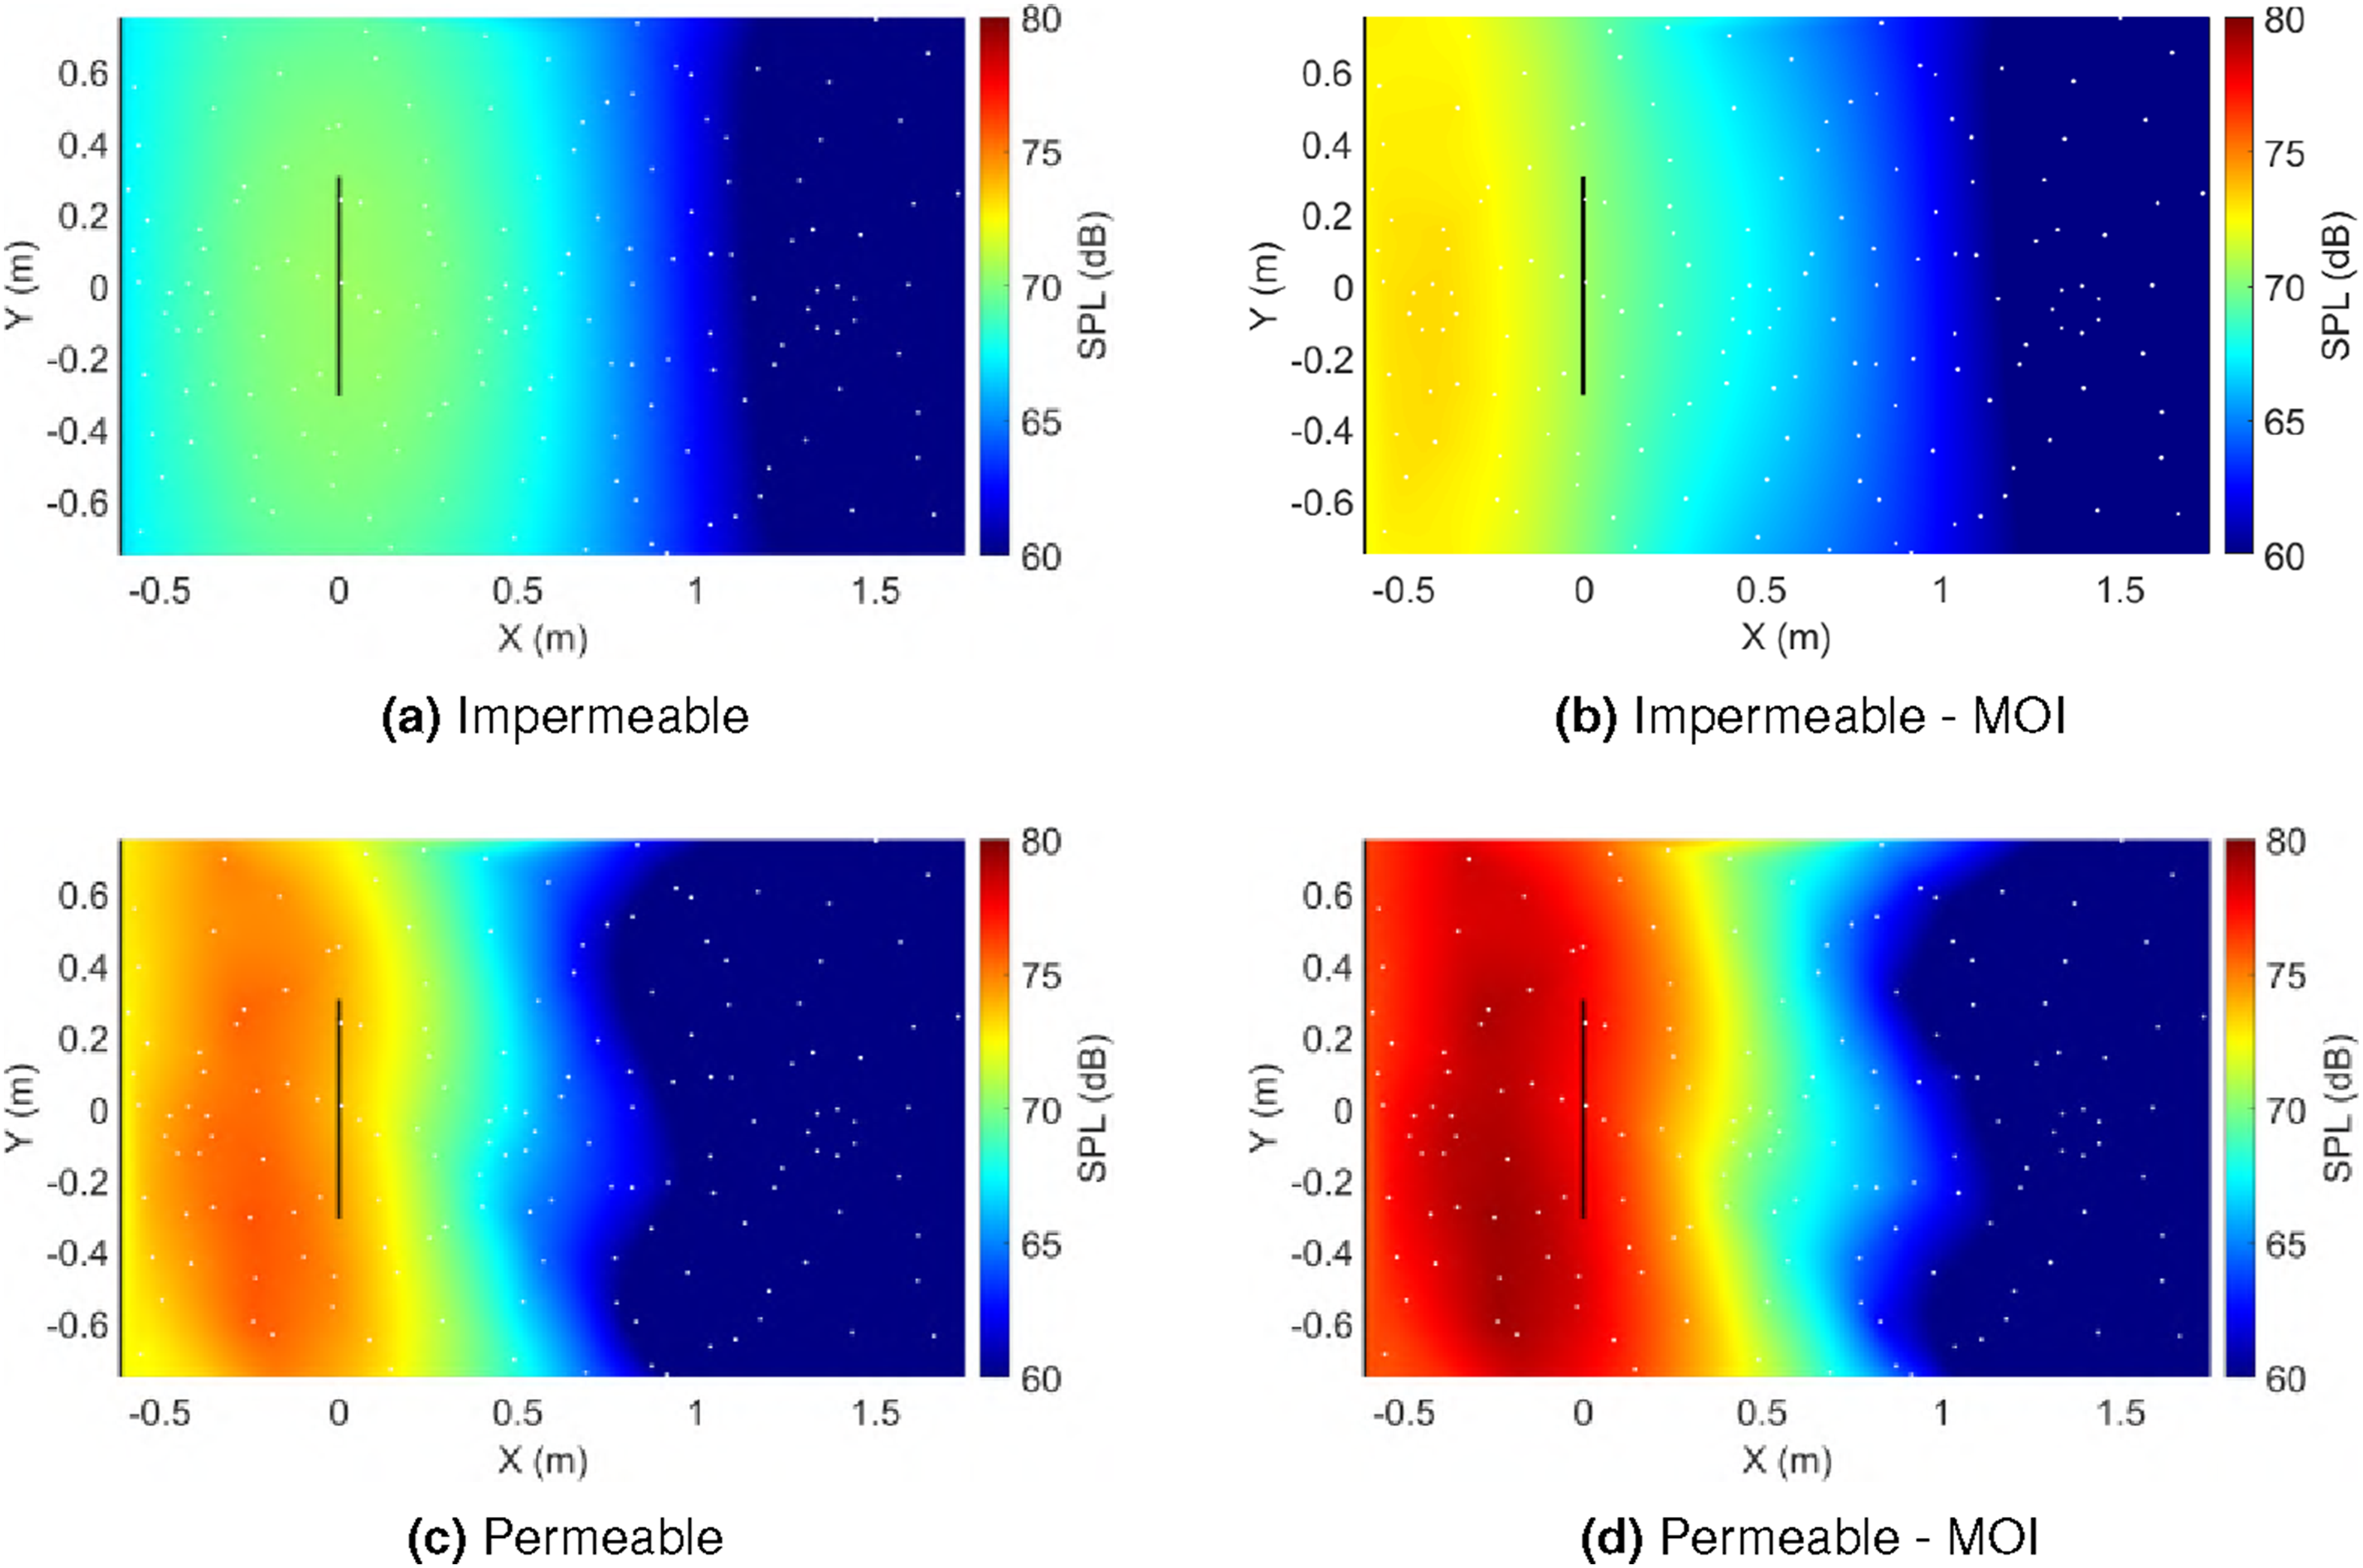
Conclusion
This study investigated the aeroacoustic behavior of an eVTOL propeller operating in ground-effect conditions using a multi-fidelity computational framework. High-fidelity Delayed Detached Eddy Simulations (DDES) conducted using OpenFOAM, coupled with the FW-H acoustic analogy in PSU-WOPWOP, were employed alongside mid-fidelity CDI-CHARM simulations. The Method of Images (MOI) was employed for ground-reflection modeling on acoustic calculations using impermeable surfaces. The analysis encompassed hover and edgewise flight conditions and examined both out-of-ground-effect (OGE) and in-ground-effect (IGE) configurations.
Extensive validation of the numerical framework was conducted against experimental measurements, including thrust, torque, far-field spectra, OASPL levels, directivity maps, and beamforming results. The validation demonstrated that the high-fidelity simulations accurately capture propeller performance trends and dominant tonal noise mechanisms, with remaining discrepancies largely attributable to modeling simplifications such as the omission of the hub and fairing, as well as uncertainty in experimental boundary conditions. CHARM reproduced global performance trends and dominant tonal features with reasonable accuracy but systematically underpredicted broadband noise levels, consistent with its actuator-line acoustic formulation.
Prior to acoustic analysis, detailed flow-field investigations were performed to establish the aerodynamic mechanisms governing noise generation. The DDES results revealed significant modifications to wake development under ground-effect conditions, such as downwash to outwash wake redirection along the ground plane, and enhanced blade-wake and blade-vortex interactions. In edgewise flight, wake skewing and freestream alignment intensified unsteady loading on the advancing blade, while in hover the fountain flow and recirculation beneath the rotor played a dominant role. These flow-field changes provided the physical basis for the observed acoustic trends.
Spanwise force coefficient distributions,
The acoustic analysis demonstrated that ground effect significantly alters both noise levels and directivity. In hover, IGE conditions increased SPL beneath the rotor by up to 5 dB at small clearances while reducing levels above the rotor due to destructive interference. In edgewise flight, the acoustic response was more complex, with strong sensitivity to azimuthal position, blade-vortex interaction, and ground clearance. In several cases, the highest noise levels occurred at intermediate clearances rather than at the smallest ground distance. CHARM successfully reproduced the primary tonal trends and ground-reflection patterns but did not capture broadband noise amplification observed in the high-fidelity simulations.
A main contribution of this work is the assessment of FW-H acoustic surface strategies under ground-effect conditions. Impermeable surfaces required the use of MOI to account for ground reflections, while standard cylindrical permeable surfaces combined with MOI were shown to risk double counting reflected energy. To address this limitation, a novel “upside-down T” permeable FW-H surface was introduced. This configuration fully encloses both the rotor wake and the near-ground reflection region, enabling accurate capture of reflected acoustic energy without the need for MOI. The resulting predictions exhibited improved symmetry, reduced overprediction, and closer agreement with experimental directivity maps. Additionally, permeable surfaces placed farther from the rotor were found to be less susceptible to wake contamination, yielding cleaner spectral and directivity results when combined with end-cap averaging.
The results demonstrate that ground effect can significantly increase eVTOL propeller noise, with magnitude and distribution strongly dependent on flight condition and clearance. Also, aerodynamic loading redistribution and wake modification are key drivers of IGE performance and acoustics behavior. Finally, careful FW-H surface design and placement is essential for reliable high-fidelity ground-effect noise prediction.
Footnotes
Acknowledgements
Any opinions, findings, and conclusions or recommendations expressed in this material are those of the author(s) and do not necessarily reflect the views of the National Aeronautics and Space Administration. Resources supporting this work were provided by the NASA High-End Computing (HEC) Program through the NASA Advanced Supercomputing (NAS) Division at Ames Research Center. The authors would like to thank Dr Sheryl Grace (Boston University) and Dr Reda Mankbadi (Embry-Riddle Aeronautical University) for their valuable discussions and insights, which greatly contributed to the development of this work.
Funding
The authors disclosed receipt of the following financial support for the research, authorship, and/or publication of this article: This research is based upon work supported by the NASA Aeronautics Research Mission Directorate (ARMD) University Leadership Initiative (ULI) under cooperative agreement number 80NSSC21M0057.
Declaration of conflicting interests
The authors declared no potential conflicts of interest with respect to the research, authorship, and/or publication of this article.