






Abstract
In this article, the simultaneous use of ultrasonic testing and impedance-based technique to monitor the health of structural waveguides is proposed. Methods based on the propagation of guided waves are increasingly used in all those structural health monitoring applications that benefit from built-in transduction, moderately large inspection ranges, and high sensitivity to small flaws. In the meantime, impedance-based method promises to adequately assess the structural integrity of simple and complex structures that include welds and bolts. As both wave-based and impedance-based approaches can utilize piezoelectric transducers (lead zirconate titanate) bonded or embedded to the structure being monitored, this article describes a unified structural health monitoring paradigm where these techniques are employed simultaneously, driven by the same sensing/hardware/software unit. Specifically, we propose to use two lead zirconate titanates controlled by a National Instruments–PXI running in LabVIEW. An ad hoc LabVIEW Virtual Instrument controls signal output and input as well as processing and storage. To assess the feasibility of this unified system, an aluminum plate and a steel pipe were monitored. Damage was simulated by changing the boundary conditions of each structure. The results show that the proposed system is robust and can be developed further to address the challenges associated with the structural health monitoring of complex structures.
Introduction
The demand for robust, agile, and cost-effective structural health monitoring (SHM) systems is increasing in all fields of engineering. Among the several methods proposed to monitor waveguide-like structures, which are ubiquitous in civil, mechanical, and aerospace systems, ultrasonic-based1–12 and impedance-based13–32 methods have emerged.
Probing waveguides by means of ultrasound can be done either by generating narrowband tone bursts and detecting few controlled modes1–9 or by exciting broadband pulses and sensing all modes of all propagating directions and frequencies with random amplitudes that are independent of each other.10–12 The latter approach is conventionally known as diffuse ultrasound. Guided ultrasonic waves (GUWs) are very attractive as they enable the inspection of a large area from a single or few probe positions thanks to the guidance of stress waves by the structure acting as an acoustic waveguide. 33 Although several devices such as lasers, air-coupled transducers, electromagnetic acoustic transducer (EMAT), or magnetostrictive transducers34–40 have been used to excite and sense guided waves, the use of piezoelectric transducer (lead zirconate titanate (PZT)) patches is increasing.1,6,9,41–44
Impedance-based SHM, often indicated as the electromechanical impedance (EMI) method is also an active sensing approach that exploits the relationship between the electrical impedance of a PZT and the mechanical impedance of the host structure to which the PZT is bonded or embedded. The electrical admittance, which is the inverse of the electrical impedance, is a function of the stiffness, mass, and damping of the host structure,21,45 the length, width, thickness, orientation, and mass46,47 of the PZT, as well as the adhesive utilized to bond the PZT to the structure. 48 Therefore, any changes in the admittance are indicative of the presence of structural damages, provided the physical characteristics of the adhesive and the PZT remain constant. When compared to the SHM methods based on lower order global modes, the impedance-based methods use higher frequency ranges from ten to the hundreds of kHz. This has the drawback that the sensing region of the PZT is limited to an area close to the PZT sensor/actuator but provides an advantage in that the impedance sensor is less sensitive to boundary condition changes or any operational vibrations, which instead affect global modes analysis. 21 The EMI-based technique has an advantage over the guided-wave technique in terms of local monitoring of more complex structures that have bolted or welded components.
As the same type of transducers can be used for either active sensing method, we propose an integrated monitoring system that evaluates the admittance of a PZT and the characteristics of the guided waves generated by the same PZT and detected by a second transducer. The general proof-of-concept is presented in Figure 1(a). The function generator of a National Instruments (NI)–PXI is used to drive a finite sinusoidal excitation to a PZT bonded to the host structure. By means of a low-cost circuit, schematized in Figure 1(b), connected to the PXI’s digitizer, the variation of the PZT’s admittance is measured. The sinusoidal excitation also generates guided waves that are sensed by a second PZT connected to the same digitizer. Finally, damage-sensitive features are extracted from both the impedance and the wave measurements and correlated to damage. These features are analyzed separately and then combined into a single multidimensional vector fed to an unsupervised learning algorithm based on outlier analysis. The outlier analysis approach unifies the proposed SHM system also in terms of diagnostics. The main novelty of this study is the development, from the design to the implementation, of a unified sensing/hardware/signal-processing paradigm for the local–global SHM of waveguides. Given that impedance-based methods are effective for near-field damage detection and GUWs can gage large areas, the proposed monitoring protocol can be identified as glocal.

(a) Schematic of the underlying idea behind the unified SHM algorithm proposed here. The PXI’s function generator drives a finite sinusoidal excitation to the actuator, which, therefore, operates as a self-sensor to detect changes of local dynamic response as a generator of guided waves detected by the sensor. The actuator is driven by the PXI’s function generator. The circuit connected to the function generator and to one channel of the PXI’s digitizer allows the measurement of the actuator admittance. The guided waves are digitized simultaneously by the second channel of the PXI’s digitizer. For clarity, the propagation of the guided wave was indicated only along the line of sight between the actuator and the sensors. (b) Detail of the low-cost circuit designed in this study.
The work presented here differs from49–56 where impedance method and wave propagation were used separately using different and disjointed hardware, software, and signal processing algorithms. Moreover, the structural monitoring was performed sequentially rather than simultaneously. In two articles, Park et al.53,54 demonstrated the feasibility of a piezoelectric sensor–based health monitoring technique combined with a two-step support vector machine (SVM) classifier for railroad track damage identification. The system was composed of two PZT patches used to exploit the principles of both impedance (frequency range = 40–50 kHz) and guided-wave propagation (input signal of 3-cycle 50-kHz sine function in a magnitude of 10 V). The impedance and the GUW measurements were taken using separate instruments and not simultaneously. The root mean square deviations (RMSDs) of the impedance signatures and the sum of square of the wavelet coefficients associated with the guided waves were considered as damage-sensitive features. They were combined into a two-dimensional (2-D) damage feature space fed into a two-step SVM classifier. Finally, Zagrai et al. 56 recently reported on the use of piezoelectric transducers to assess bolted structures by means of the acoustoelastic effect and the EMI method. The systems were disjointed, and the latter method was employed using a conventional impedance analyzer. In the same work, an aluminum plate with varying boundary conditions was monitored by means of two bonded transducers. The effect of the varying boundary conditions on the strength of the guided waves propagating at 200 and 500 kHz as well as the variations of the impedance signatures in the frequency range of 303–306 kHz was evaluated. As for the bolted structure setup, an impedance analyzer was used, and the two methods were used separately using two different suites of instrumentation. Moreover, a unified signal processing for structural diagnostics, as done in our approach, was not reported.
The article is organized as follows: for the sake of completeness, chapter 2 provides the basis of the impedance method and the guided-wave propagation, chapter 3 describes the simplified circuit designed and built to implement the EMI approach, chapter 4 illustrates the experimental setup of the two experiments, and chapters 5 and 6 present the results associated with the monitoring of an aluminum plate and a steel pipe, respectively.
Background on EMI and guided-wave propagation
The basis of the impedance method is the use of high-frequency vibrations to monitor local changes in structural mechanical impedance that would indicate damage or incipient damage. 30 In order to describe the underlying principle, Liang et al.15,16 modeled the actuation of a PZT as a one-degree-of-freedom spring–mass–damper system. They showed that the electrical admittance Y(ω) can be expressed as

where Z and Za are the mechanical impedance of the structure and the PZT, respectively,
When a PZT bonded to or embedded to the host structure is driven by an alternating electric field, a small deformation is produced in the structure. The dynamic response of the structure around the transducer is transferred back to the PZT and “interpreted” in the form of the electrical admittance, which consists of the real term known as conductance (G) and the imaginary term known as susceptance (S). A plot of G or S as a function of the actuation frequency serves as a diagnosis of the structure. These plots present peaks and valleys that correspond to the structure’s modes of vibrations and peaks associated with the resonance of the PZT-adhesive-structure system. When damage alters the dynamic response of the structure, the admittance signature is affected.
Conventionally, EMI measurements are conducted by means on an electrical impedance analyzer that is expensive, bulky, and heavy.21,58 Therefore, some researchers have proposed cost-effective solutions that do not compromise the reliability and the robustness of the methodology. Peairs et al. 30 developed an operational amplifier-based turnkey device connected to a fast Fourier transform (FFT) analyzer to measure and record the electric impedance of a PZT driven by a chirp signal. The results were compared to those obtained using a HP 4194A impedance analyzer. Xu and Giurgiutiu31,32 developed, and then tested on a spacecraft panel, a signal acquisition module that replaces the use of analyzers. Wang and You 26 used the concepts of bridge circuit to design and build an electronic circuit able to generate a frequency sweep from 53 to 164 kHz and to measure the relative value of the electrical impedance modulus of a piezoelectric patch. Simmers et al. 17 evaluated the effects of an unbalanced bridge circuit and improved the impedance measuring system by utilizing capacitors in series and in parallel with the PZT patch.
The development of a simple circuit to replace expensive equipment eased the transition from tethered to wireless systems. Overly et al. 14 developed a compact wireless impedance sensor node that includes a microcontroller for local computing, telemetry for wireless transmission, multiplexers for managing several PZTs, and energy harvesting and storage mediums. The node was tested for corrosion and bolted joint monitoring. Park et al. 13 presented a wireless system that incorporated signal processing based on principal component analysis and k-means clustering.
When an ultrasound propagates into a bounded media, a guided wave is generated. The wave is termed “guided” because it travels along the medium guided by its geometric boundaries.59–62 Lamb waves and cylindrical waves are two kinds of GUWs that propagate along plates and hollow cylinders, respectively. Lamb waves propagate in plate-like structures, and they occur in two different basic modes, the symmetrical or dilatational mode, and the asymmetrical or bending mode.33,62 In addition to the Lamb wave modes, shear horizontal (SH) modes can exist in flat layers. The particle vibrations (displacements and velocities) of these modes are in a plane that is parallel to the surface of the layer. The direction of propagation and the particle displacement of SH modes are perpendicular to each other. In hollow cylinders, GUWs can propagate along the circumference and along the axial direction, and three different modes can propagate: longitudinal (L), flexural (F), and torsional (T).
The application of GUWs can be challenging, as they are multimodal (many vibrating modes can propagate simultaneously) and dispersive (the propagation velocity and the attenuation depend on the wave frequency f). The wave-based SHM of complex or thick structures can be difficult due to factors such as simultaneous propagation of many modes, large number of overlapping reflections, and mode conversion. The dispersive behavior is represented by the dispersion curves that describe the relation between the wave velocities and the frequency. 33 These curves can be calculated analytically or they can be computed by approximate solutions derived from numerical methods. Exact solutions for cylinders and plates are well established. 62 When the waveguide cross-sectional geometry is complex, a closed form of solution is not available, and numerical63–65 or semianalytical approaches66–69 are necessary.
Hardware/software implementation of the unified system
To allow for the implementation of the unified health monitoring system proposed here, we designed and built a low-cost electric circuit to perform EMI measurements. The circuit was coupled to an NI–PXI according to the scheme discussed in Figure 1. The circuit consisted of a PZT and a 100-Ω resistor, and it was connected to the PXI’s function generator. The nodes of the circuit were connected to the PXI’s digitizer.
A LabVIEW program was created to drive the PZT with a 2-V peak-to-peak (ppk) 30-cycle sinusoidal wave. The program controlled the selection of the frequency range and the frequency resolution of the excitation. The output waveform Vo from the resistor was amplified 20 times by means of a linear amplifier, sampled at 10 MHz, and averaged five times at each excitation frequency to increase the signal-to-noise ratio. The program was designed to determine in real-time the output amplitude and phase angle difference using the FFT and to compute the actuator’s admittance Y. For the latter operation, the following equation was implemented
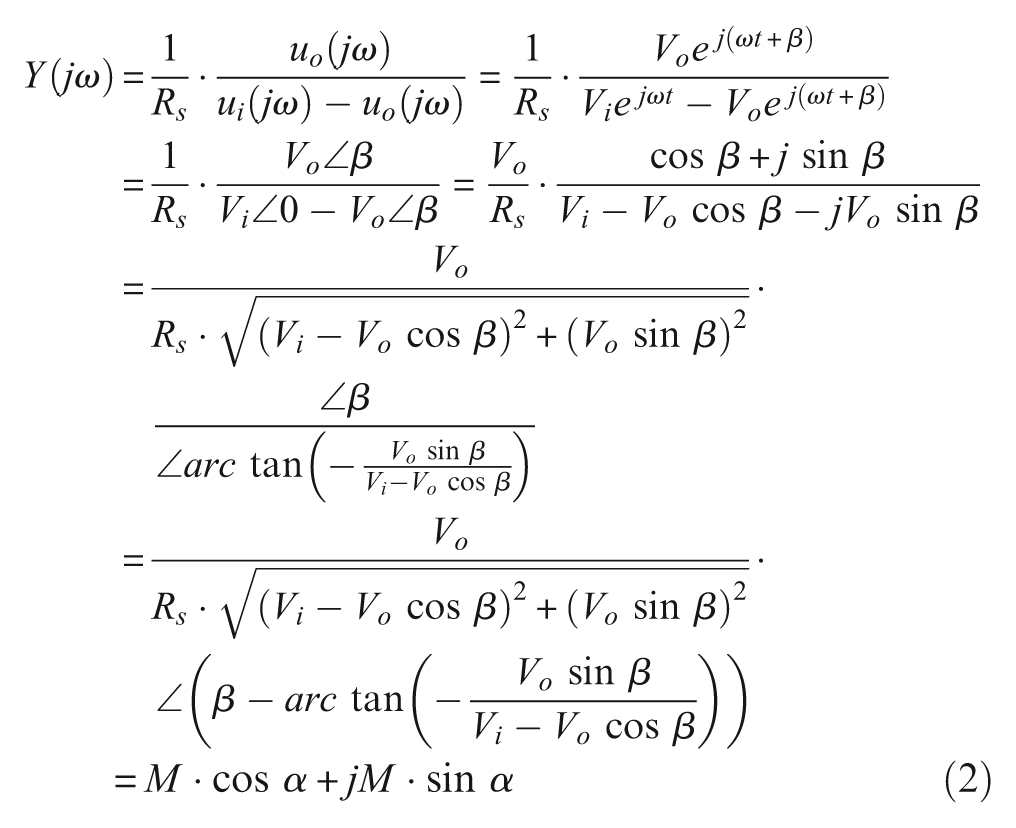
In equation (2) ui and uo are the input and output signals, respectively; Vi and Vo are the amplitude of the input and output signals; Rs is the value of the resistance; β is the phase shift between the input signal and output signal; and ω is the angular frequency. Finally, M and α are defined as
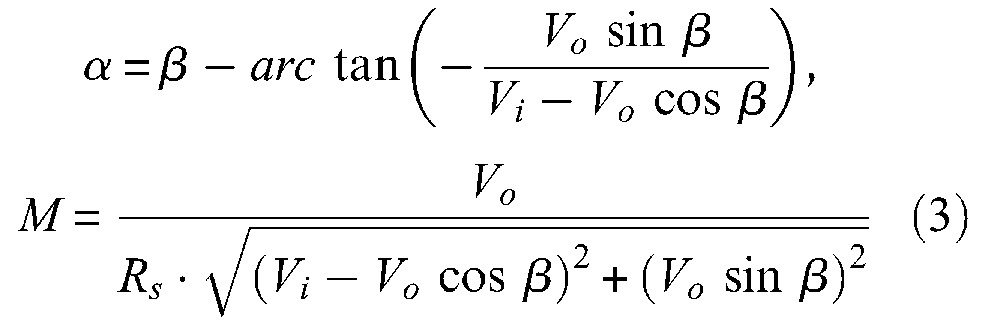
Figure 2(a) shows a photo of the hardware while Figure 2(b) and (c) shows the LabVIEW front panels created to execute the above-mentioned operations.

(a) Photo of the employed hardware. (b) LabVIEW subpanel for the configuration of the function generator. (c) LabVIEW subpanel for the measurement of the electrical impedance.
To assess the performance of the hardware/software system, a comparative study was conducted. The admittance of a free PZT was computed by using the program and a commercial LCR meter (Agilent E4980A). Figure 3(a) and (b) present the conductance and the susceptance, respectively, as a function of the excitation frequency. By observing these figures, it is evident that the low-cost circuit coupled to the PXI is capable of identifying the main peaks. Moreover, the values of these peaks agree very well with the values found using the LCR meter. As suggested by Peairs et al., 29 the small discrepancies in values could be the results of differences in time windowing, analog to digital (A/D) conversion, sampling frequency, and excitation type. To further validate the proposed measurement system, the same PZT was then bonded to an aluminum plate. Figure 3(c) compares the conductance as a function of frequency from both the LCR meter and the PXI. The measurements follow the same trend. Besides the differences in time windowing, A/D conversion, sampling frequency, and excitation type, the deviation observed above 250 kHz might be related to the need to improve the separation between the sensed signal caused by structural vibration and the input force driven electronically to the PZT.

Comparing the measurements obtained using the hardware/software developed in this study with the measurements form a commercial LCR meter. (a) Real and (b) imaginary parts of the admittance of a free PZT. (c) Real part of the admittance of the same PZT bonded to an aluminum plate.
To measure the propagating stress waves, the SHM system comprised a second transducer identical to the first one. This second transducer was connected to the PXI’s digitizer, and it sensed the wave propagating at certain frequencies, for instance every 25 kHz, selected by the user through a third tab in the LabVIEW program. The sensor was connected to a preamplifier set at 40 dB connected to the digitizer and sampled at 10 MHz. It is noteworthy that the guided-wave sensing occurred simultaneously to the measurement of the admittance. Moreover, our system is only apparently similar to the one reported by Baptista and Filho 58 that proposed a new impedance measurement methodology based on EMI using a low-cost circuit and a data acquisition system driven by LabVIEW. With respect to that work, our work differs in terms of the circuit’s design, signal processing associated with the EMI measurements, and in terms of the damage-detection algorithms. We also include the detection and processing of GUWs, which were not considered in that article.
Experimental setup
To validate the proposed “glocal” active sensing system, we monitored two waveguides. The first specimen consisted of a 1220 mm by 3664 mm T-6061 aluminum plate 1.27 mm thick. The second structure was a 4000-mm-long steel pipe with an outer diameter of 33.4 mm and an inner diameter of 26.7 mm (American Standard Pipe 1).
For each experiment, two PKI-502-Navy type II PZT transducers (Model No. PKI P/N SP0.330-0.330-0.120-502) from Piezo Kinetics were used. The dimensions of the transducers were 8.38 mm × 8.38 mm × 3.05 mm (0.33 in × 0.33 in × 0.12 in). The applied field voltage output of these transducers was in shear mode. The location of the PZTs on the plate is shown in Figure 4(a), while the location of the patches on the pipe is displayed in Figure 4(b). For convenience, the transducers are hereafter identified as T1, R1, T2, and R2 where subscript 1 identifies the plate and subscript 2 identifies the pipe. The actuators T1 and T2 acted as self-sensing for the EMI method, while the pairs T1 –R1 and T2 –R2 represented the pitch–catch configuration for the guided wave–based monitoring.

Schematics of the specimens tested in this study. (a) Dimension of the aluminum plate and location of the transducers. The circles identify the position of the mass onto the plate. (b) Dimension of the pipe, position of the transducers, and locations at which the C-clamp was sequentially placed. Dimensions in millimeters.
A 30-cycles sine wave was driven from 100 kHz to 500 kHz at 0.1 kHz increment. The lower bound (100 kHz) was selected to prevent the overlap, caused by electronic cross-talk, between the tail of the signal output and the front of the detected stress wave. The 30 cycles provided a narrowband wave and good agreement of the impedance measurements between the low-cost circuit and the LCR meter.
In order to simulate the presence of damage, the structures were subjected to varying boundary conditions. For the plate test, a 1850-g mass was placed on three different locations, namely, 305 mm, 915 mm, and 1525 mm from T1 along the line of sight between T1 and R1 (Figure 4(a)). For the pipe test, a C-clamp was fastened 250 mm, 500 mm, 1000 mm, and 1500 mm away from T2 along the line of sight between T2 and R2, as shown in Figure 4(b). This approach is a common practice to simulate damage.
For the plate test, a total of 19 measurements were taken. The first 10 measurements (baseline) were associated to the pristine structure, that is, without the presence of the mass. Measurements 11–13 were taken when the distance between T1 and the weight was 305 mm. Measurements 14–16 corresponded to the data when this distance was 915 mm, while the last three acquisitions were taken when the mass was located 1525 mm away from the actuator.
For the second test, 22 measurements were taken. The first 10 represents the baseline. Then measurements 11–13, 14–16, 17–19, and 20–22 refer to the position of the C-clamp progressively away from the actuator T2. For each measurement, extreme care was taken to apply the same torque to the clamp, in order to ensure the same localized stress around the point of application of the clamp. In order to prevent or minimize any effect associated with bonding layer degradation and temperature variation, all the measurements in each test were taken under controlled temperature conditions and within the same day. As such, we can safely affirm that environmental factors did not affect both EMI-based and GUW-based data. Moreover, the acquisition of multiple data at a given damage scenario served to account for any variability associated with the electronics.
Test 1: experimental results
Impedance-based measurements
It is known that the real part of the electric impedance is more reactive to damage and less sensitive to temperature variation than the imaginary part. 21 The conductance signatures relative to four measurements are shown in Figure 5. Compared to the baseline, some change is visible around the resonance peak and above 300 kHz.

Test 1: conductance signatures associated to the baseline and three different damage scenarios.
In the past, several statistical indices were proposed to analyze the EMI-related data using signature assurance criteria, adaptive template matching, RMSD, mean absolute percentage deviation, covariance change, and correlation coefficient deviation. Typically, such indices compare signatures in the same frequency range of two different states. In the present study, to quantify the effect of damage on the conductance signature, the peak amplitude, the area under the signature, and the RMSDs were considered. The RMSD compares the quantitative deviation of the kth measurement with the baseline signature and it is defined as21,53,54:
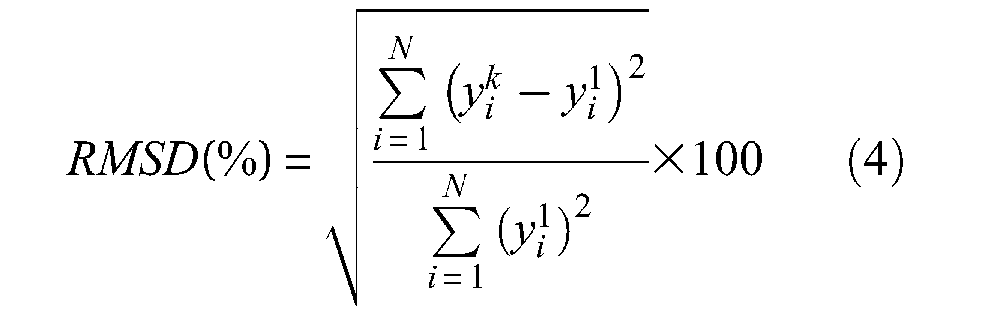
where
Figure 6 presents the statistical features considered in this study as a function of the measurement number. Overall, it can be observed that these features enable the detection of damage close to the actuator. As the mass is moved away from the EMI sensor, its effect on the electromechanical properties of the PZT diminishes. A slight increase of the values of the area is observed among the baseline data (the first 10 measurements), which suggest that this feature might be oversensitive to electronic noise. Moreover, the largest variation observed at measurement 13 is about 1% of the area value measured at the first four measurements. By observing Figure 7(b) and (c), the effect of the mass when closest to the actuator is clearly visible. When the mass was located away from the sensing area, the capability of the EMI measurement in the detection of damage degraded.

Test 1: analysis of the data related to the impedance method. (a) Area under the conductance signature, (b) RMSD of the conductance signature, and (c) peak amplitude of the conductance signature. The vertical lines bound the four different damage scenarios.

Test 1: guided waves detected by sensor R1 under four different damage scenarios. (a) No damage, for example, baseline, (b) mass located at 305 mm from the actuator, (c) mass located at 915 mm, and (d) mass located at 1525 mm. The vertical lines bound the guided waves that were processed to extract damage-sensitive features.
Wave-based measurements
The guided waves propagating at 200 kHz are discussed here. Such a frequency was close to the resonance frequency of the PZT-adhesive-plate system, and it provided the largest signal-to-noise ratio. At 200 kHz, the dispersion curves predict the presence of the first symmetric (S0) and antisymmetric (A0) mode. Figure 7 shows the time waveforms recorded by sensor R1 under four different damage scenarios. To bind the analysis to the first arrival of the S0 and A0 modes, the signal-processing analysis was performed to the time histories bounded by the vertical lines superimposed in Figure 7.
To quantify the effect of damage on the characteristics of the propagating waves, the ppk amplitude of the S0 mode and the RMS of the bounded time history were considered. In addition, the correlation between each signal and a reference signal (the first baseline datum) was considered. Figure 8 presents the values of these features as a function of the measurement number. With some exception, the values associated with damage are scattered from the baseline. As shown in Figure 8(a), the correlation coefficient neatly separates the baseline from the data related to damage, while the ppk amplitude (Figure 8(b)) does not present any evident pattern. Finally, the values of the RMS associated with the position of the mass 915 mm and 1525 mm away from the PZT indicate the presence of damage.

Test 1: analysis of the data related to the guided wave method. (a) Correlation coefficient, (b) ppk amplitude of the time waveforms, and (c) RMS of the windowed time waveform.
Outlier analysis
To unify the signal processing associated with both measurements, the multivariate outlier analysis based on the computation of the Mahalanobis squared distance (MSD). The outlier analysis is a novelty-detection method that establishes whether a new configuration of the system is discordant or inconsistent from the baseline configuration, which consists of an existing set of data (or patterns) that describe the normal operative conditions. 33 Ideally, if outlier analysis is used for detecting damaged states, the baseline should include normal variations in environmental or operative conditions of the structure (e.g. temperature, humidity, loads). 70,71 However, it is generally difficult to account for all of the environmental variables that may affect a damage-sensitive set of features.
The MSD Dζ is a nonnegative scalar defined as

where
The input vector contained the values of the three features displayed in Figure 6, associated with the measurement of the electric impedance, and the three features displayed in Figure 8 related to the guided waves. Figure 9 shows the MSD as a function of the measurement number. The horizontal line represents the threshold above which the datum would be classified as outlier. Clearly, all the data associated with damage were properly classified as outliers, and the multivariate statistics outperform any of the other features considered separately and presented in Figures 6 and 8.

Test 1: multivariate outlier analysis. MSD as a function of the measurement number. The horizontal line represents the 99.7% confidence limit threshold. Data above this threshold are classified as outliers and therefore considered as indicator of the presence of damage.
Test 2: experimental results
Impedance-based measurements
The conductance as a function of frequency measured at five different boundary conditions in the pipe is presented in Figure 10. A slight change in the amplitude of the resonance peak is observed. However, when the clamp was placed 1500 mm away from the actuator, the corresponding admittance signature overlapped to the baseline.

Test 2: conductance signatures associated to the baseline and four different damage scenarios.
As done for the first test, three statistical features were considered to quantify the effect of the simulated damage on the electromechanical response of the PZT T2. Figure 11 shows the values of the area, RMSD, and peak amplitude as a function of the measurement number. Overall, the values of the features are constant at the baseline and then deviate from the baseline when the clamp was located within 1 m from the actuator. As expected, once the clamp was positioned away from T2, the deviation of the RMSD and peak amplitude from the correspondent baseline’s value diminishes.

Test 2: analysis of the data related to the impedance method. (a) Area under the conductance signature, (b) RMSD of the conductance signature, and (c) peak amplitude of the conductance signature. The vertical lines bound the four different damage scenarios.
Wave-based measurements
For the guided wave-based monitoring, the propagation at 175 kHz was considered. At this frequency, the presence of the flexural modes F(1,i), with i = 1, 2, or 3, and F(2,i), with i = 1 or 2, are expected as well as the longitudinal modes L(0,i), with i = 1 or 2. Although the presence of the nondispersive torsional mode T(0,1) is predicted, it is believed that the actuation motion of T2 did not originate any torsional mode.
Figure 12 displays the time waveforms recorded at the baseline (Figure12(a)) and under three different damaged conditions. The small lobes observed between 400 and 650 microseconds are related to the propagation of the fastest modes F(1,3) and L(0,2), while the larger packet refers to the slower modes F(1,1), F(1,2), and L(0,1).

Test 2: guided waves detected by sensor R2 under four different damage scenarios. (a) No damage, for example, baseline, (b) C-clamp located at 250 mm from the actuator, (c) C-clamp located at 915 mm, and (d) C-clamp located at 1525 mm. The vertical lines bound the guided waves that were processed to extract damage-sensitive features.
The same approach discussed in section “Wave-based measurements” was used to process these time histories. The vertical dotted lines in Figure 12 limit the lower bound of the windowed time waveform. Figure 13 shows the correlation coefficient, ppk amplitude, and RMS as a function of the measurement number. Overall, the same behavior observed in test 1 was seen in test 2.

Test 2: analysis of the data related to the guided-wave method. (a) Correlation coefficient, (b) ppk amplitude of the time waveforms, (c) RMS of the windowed time waveform.
Figure 14 presents the MSD as a function of the measurement number. As done for the test on the aluminum plate, the input vector contained the features associated with the electrical impedance measurements and the features relative to the characteristics of the guided waves. The first 10 measurements were used as training data, and all the data associated with damage were properly classified as outliers.

Test 2: multivariate outlier analysis. MSD as a function of the measurement number. The horizontal line represents the 99.7% confidence limit threshold. Data above this threshold are classified as outliers and therefore considered as indicator of the presence of damage.
Conclusion
This article presents a SHM system that unifies the EMI method and the guided wave–based technique. The system employs two piezoelectric transducer patches. The first transducer serves as actuator to perform the self-sensing of a local area through the measurement of the actuator’s admittance and to excite the guided waves that are sensed by the second transducer. Ultrasonic data are then processed to extract damage-sensitive features that unfold the presence of structural anomalies in the far field. Both PZTs are controlled by a NI–PXI unit running under LabVIEW.
This unified glocal monitoring system was tested on two waveguides, namely, an aluminum plate and a steel pipe. Damage was simulated by changing some of the boundary conditions of the structures by adding a localized mass on the test object surface. For both specimens, the conductance of the actuator and the time history of the detected guided waves were processed to extract damage-sensitive features. The features extracted from both measurements were then merged into a single multidimensional vector fed to an outlier analysis algorithm to provide a multivariate diagnosis of damage. The results demonstrated that the implementation of this unified system is feasible and reliable: the EMI approach detected damage locally, that is, within a certain distance from the actuator, while the wave-based approach was effective for the far-field damage detection. As such the “glocal” term should be intended to account for near- and far-field damage detection. Our experimental results are in line with the general considerations synthesized in Ref. 21 where it was concluded that the EMI-sensing area of a single PZT can vary anywhere from 0.4 m on a composite structure to 2 m on simple metal beams.
As this article presented a feasibility study on the use of a unified approach for SHM, future studies should (a) develop algorithms able to compensate the effect of temperature and moisture; (b) optimize the excitation signals in terms of number of cycles, sine waves versus chirp, and Hanning versus Gaussian windowing; (c) test smaller waveguides with more complexity; and (d) evaluate and compare different frequencies on the damage-detection performance of ultrasonic wave component of the unified approach.
Footnotes
Acknowledgements
Mr. Xuan Zhu performed this research while he was a graduate student at the University of Pittsburgh.
Funding
Mr. Xuan Zhu was mainly supported by the Pennsylvania Department of Transportation under contract 10601-PIT 008 with Jerry Bruck serving as a technical advisor. Partial support was provided by the National Science Foundation program CMMI 1029457 (Dr M.P. Singh, program manager).