
Abstract
This article proposes an in situ structural health monitoring method able to locate the impact source and to determine the flexural Lamb mode A0 velocity in composite structures with unknown lay-up and cross section. The algorithm is based on the differences of the stress waves measured by six surface-attached acoustic emission piezoelectric (lead zirconate titanate) sensors and is branched off into two steps. In the first step, the magnitude of the squared modulus of continuous wavelet transform, which guarantees high accuracy in the time–frequency analysis of the acoustic waves, was used to identify the time of arrival of the flexural Lamb wave. Then, the coordinates of the impact location and the group speed values are obtained by solving a set of non-linear equations through a combination of local Newton’s iterative method associated with line search and polynomial backtracking techniques. The proposed method, in contrast to the current impact localization algorithms, does not require a priori knowledge of the anisotropy angular-group velocity pattern of the measured waveforms as well as the mechanical properties of the structure. To validate this method, experimental location testing was conducted on two different composite structures: a quasi-isotropic carbon fibre–reinforced plastic laminate and a sandwich panel. The results showed that source location was achieved with satisfactory accuracy (maximum error in estimation of the impact location was approximately 3 mm for quasi-isotropic carbon fibre–reinforced plastic panel and nearly 2 mm for sandwich plate), requiring little computational time (nearly 1 s). In addition, the values of the fundamental flexural Lamb mode A0 obtained from the optimization algorithm were compared with those determined by a numerical spectral finite element method.
Introduction
Due to their desirable characteristics as high strength, stiffness and low weight, advanced composite structures have been widely used over recent years in aerospace and civil applications. However, the mechanical properties of such materials can be severely degraded after an external impact, which might occur during service or maintenance. Structural health monitoring (SHM) systems based on guided waves with integrated components (passive sensors and probes) are addressed to provide a real-time warning of the structural health status and to avoid the tested specimen to be disassembled during the inspections. In this manner, disruptions and a considerable increase in maintenance costs can be eluded. In isotropic or quasi-isotropic materials, the impact source location is conventionally performed through a time of arrival (TOA) triangulation technique (also known as the Tobias algorithm).1–3 However, since the group velocity in isotropic media is assumed constant in all directions, these methods are not suitable for anisotropic and inhomogeneous structures. In the last decade, a number of studies present in the literature were focused to the detection and location of the acoustic emission (AE) source (impact event) in composite materials. White 4 was the first one to look into TOA measurements in dispersive media, while Ziola and Gorman 5 employed wavelets to determine TOAs in dispersive media.6,7 Seydel and Chang 8 proposed a model-based method for the reconstruction of the force history and the identification of the impact location, based on the minimization of the difference between the actual and predicted response from lead zirconate titanate (PZT). Although this method was applied to any kind of anisotropic material, even with complex geometries, it required the knowledge of the mechanical properties of the medium and a theoretical model for the simulation of dynamic–acoustic behaviour of the structure. Meo et al., 9 Paget et al. 10 and Kurokawa et al. 11 developed an algorithm for the impact point identification, assuming an elliptical angular-group velocity pattern. This method necessitated a priori knowledge of the group velocities at 0° and 90° with respect to the planar reference frame x–y, and it was applied to only quasi-isotropic and unidirectional composite structures. Kundu et al. 12 presented an alternative approach that consisted of minimizing an error function representing the differences of TOA of the recorded signals. Huang et al. 13 used non-linear least squares optimization methods to calculate laminated plate stiffnesses from measured group velocities.
This article extends a previous study for isotropic materials, 14 which demonstrated that with four sensors, the impact location and the group velocity could be uniquely evaluated. It presents an in situ SHM system able to pinpoint the impact source location and to determine the group speed of the flexural Lamb mode A0 in composite plate-like structures. This research work is based on the differences of the wave packets measured by six surface-bonded AE piezoelectric (PZT) sensors, and it can be applied to composite laminates with any lay-up, thickness and anisotropic angular-group velocity pattern. In the first step, the TOAs were obtained through a suitable signal processing based on the magnitude of the squared modulus of continuous wavelet transform (CWT). Then, the coordinates of the impact location and the group speed were determined by solving a set of non-linear equations through a combination of local Newton’s method associated with global unconstrained optimization (line search and polynomial backtracking techniques). Therefore, this algorithm overcomes the limitations of the most impact detection systems, as it does not require a priori knowledge of the anisotropic group velocity as well as the mechanical properties and the orientation of each ply in the laminate. Moreover, the CWT guarantees high accuracy in the time–frequency analysis of the acoustic waveform, since it is able to characterize near Lamb modes. In fact, the group speed is not constant but dependent of the excitation frequency and the heading angle in the x–y plane [V g = V g (f, θ)]. To validate this method, a number of experiments on a quasi-isotropic carbon fibre–reinforced plastic (CFRP) laminate and a sandwich panel were carried out. Figure 1 illustrates the architecture of the impact location algorithm.
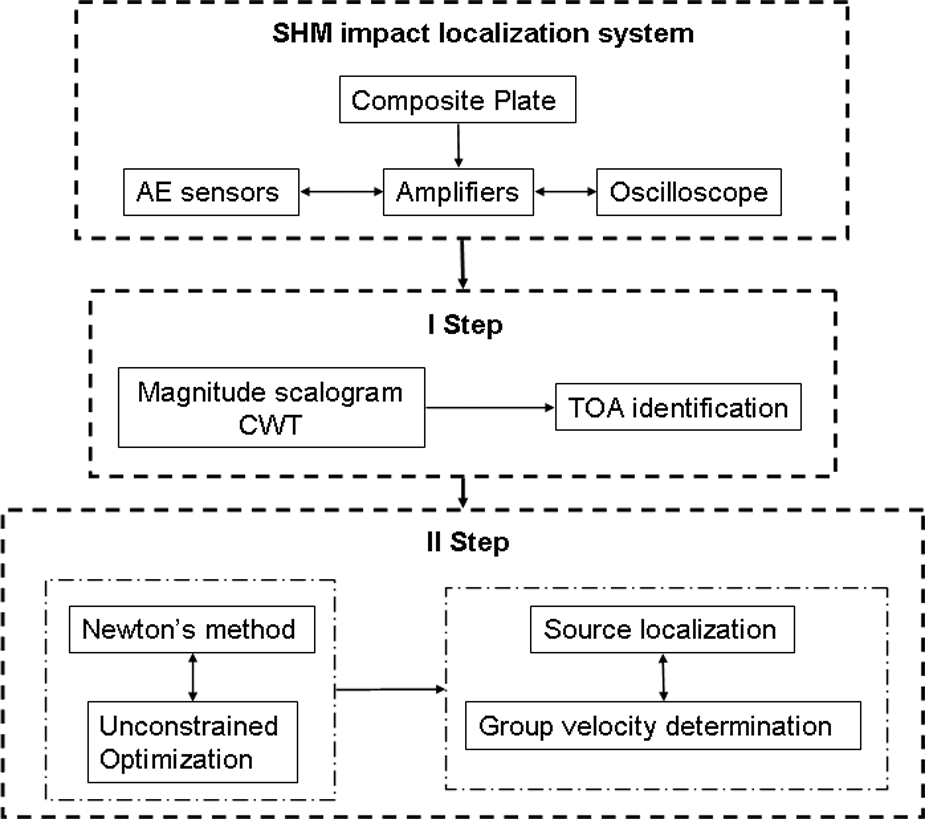
Architecture of the SHM impact localization system.
The layout of the article is as follows: in section ‘Impact localization algorithm’, the algorithm for the impact source localization and the fundamental flexural Lamb wave speed determination is presented. Section ‘TOA identification using the CWT’ describes the procedure for identifying the TOA using the CWT. In section ‘Newton’s method and unconstrained optimization for solving systems of non-linear equations’, the optimization algorithm for obtaining the coordinates of the impact point is discussed. Section ‘Experimental set-up’ reports the experimental set-up, while in section ‘Impact localization results’, the impact source location results for both CFRP and sandwich composite plate are reported. Then, the conclusions of the method adopted are outlined.
Impact localization algorithm
Mathematically, locating an impact source is an inverse problem. Let us consider the impact source point I is at unknown coordinates
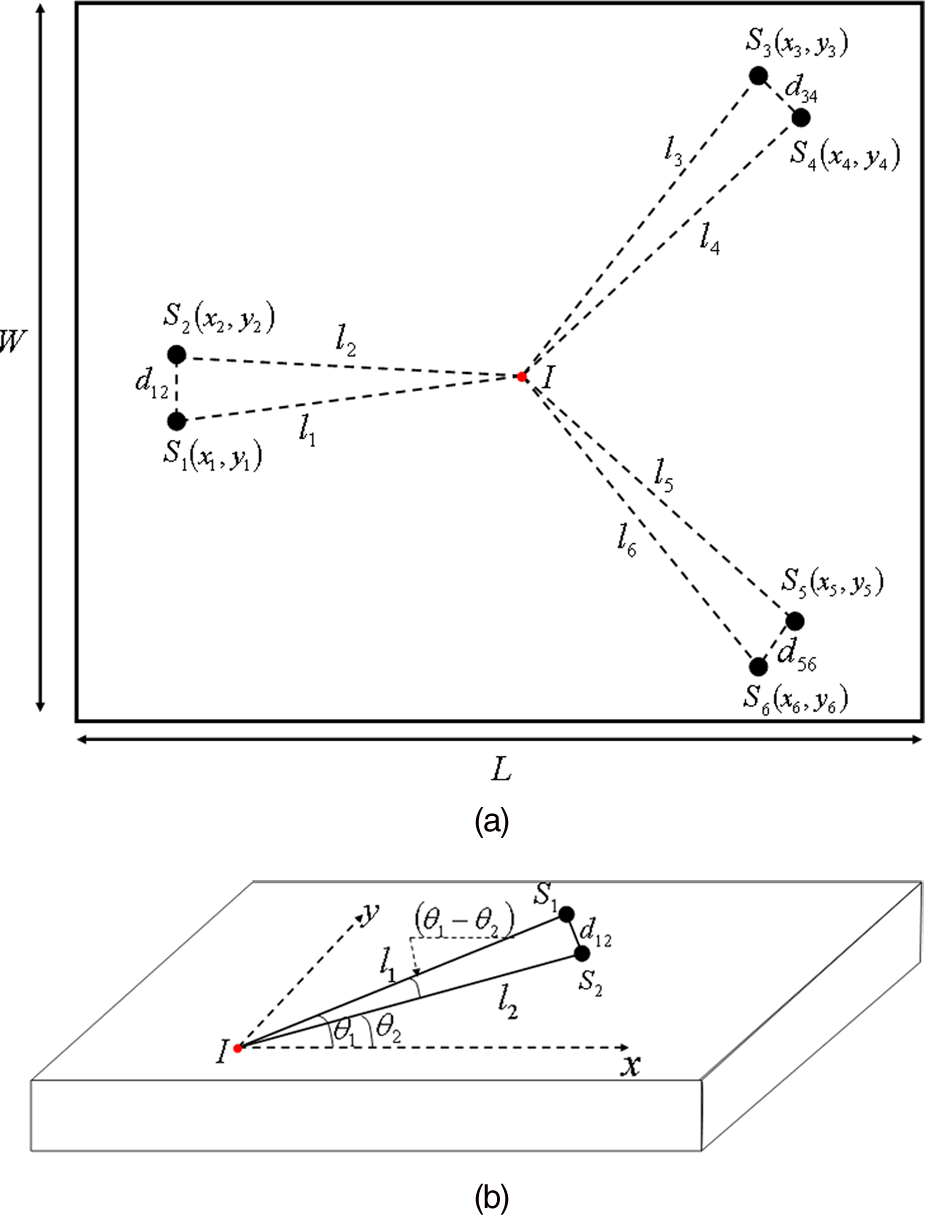
(a) Sensor arrangement for the source location and (b) optimal disposition with short distance of each pair of transducers.
The coordinates of the AE source can be determined by solving the following equations
where

which represents the equation of circumferences with radius

Substituting equation (3) into equation (2), it becomes

The above set of non-linear equations cannot be solved yet since the number of variables is still bigger than the number of equations.
15
Thereby, in order to find a solution of system (4), additional information is needed, that is, an optimal sensor configuration. In the current approach, the sensors were located so that each pair of transducers was relatively close together (see Figure 2(a)). In this manner, any pair will experience approximately the same group speed. Therefore, based on the sensor configuration as depicted in Figure 2(b), if
where d12 is the distance between sensors 1 and 2, l1 is the distance from the impact source and θ1 and θ2 are the heading angles (propagation angles) of the AE in the reference frame. Hence, if
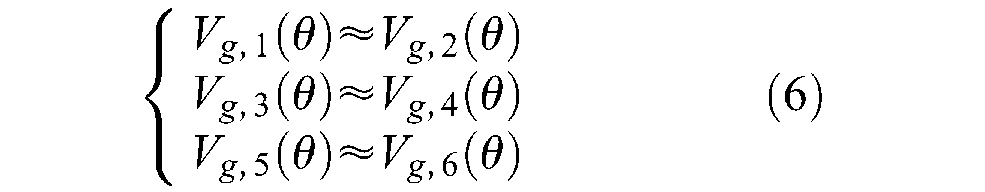
Thereby, system (5) can now be rewritten as
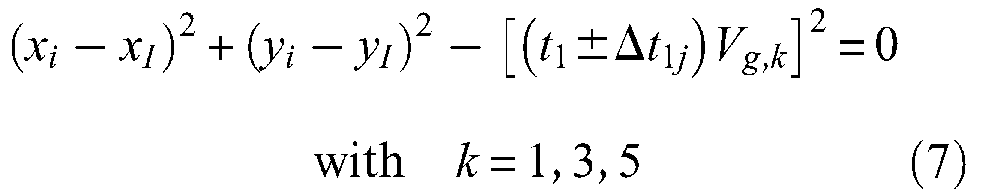
The above system of equations can be also used in structures with complex geometries, as the velocity measured by each pair is defined as an equivalent speed that depends on the path followed by the propagating wave. This path can be a direct line of sight from the sensor to the receiver or a reflected wave from the boundaries of the medium. Source location and group velocity of the flexural Lamb mode can now be calculated by solving the above set of six non-linear equations with the six unknowns
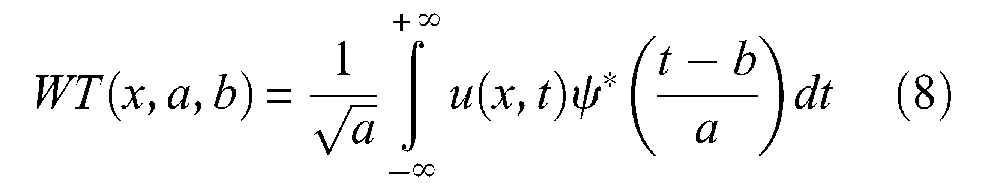
TOA identification using the CWT
The dispersive nature of the flexural Lamb mode and the uncertainty of the noise level can drastically decrease the performance of a source localization system. Hence, a good impact detection method necessitates of a suitable choice of the time–frequency analysis for the TOA. A wavelet transformation method was chosen as it provides a good compromise between time and frequency resolution, and it is able to analyse low and high frequencies at the same time, even respecting the uncertainty principle (also known as the Heisenberg inequality).
16
The CWT is a linear transform that correlates the harmonic waveform
where
A number of mother wavelets existing in the literature have been widely used for the AE localization in isotropic and anisotropic structures.1,2,9 In this study, the complex Morlet wavelet was employed as it is able to separate amplitude and phase, enabling the measurement of instantaneous frequencies and their temporal evolution. The complex Morlet wavelet is expressed by the following equation 16
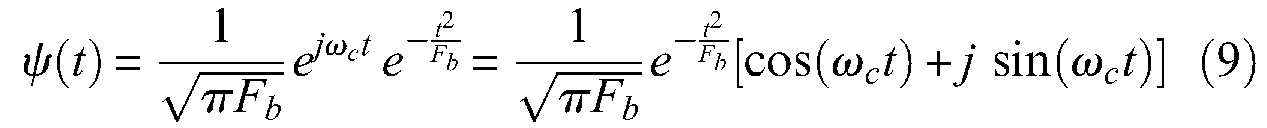
where
The waveforms recorded are analysed in terms of group (energy) velocity–frequency relationship. The group velocity is defined as the velocity of a modulated wave that is constructed considering a time harmonic motion of two waves of unit amplitude with slightly different frequencies

where

Equation (11) is a modulated wave formed by a carrier
Substituting equation (10) in equation (8) using complex Morlet wavelet (equation (8)), and assuming

The squared modulus of the CWT, also called a scalogram, indicates the energy density of the signal at each scale at any time.16,19 Hence, it is able to reveal the highest local energy content of the waveform

Substituting equation (12) and its complex conjugate into equation (13), if

Therefore, equation (14) shows that the squared modulus of the CWT using complex Morlet wavelet reaches its peak value at
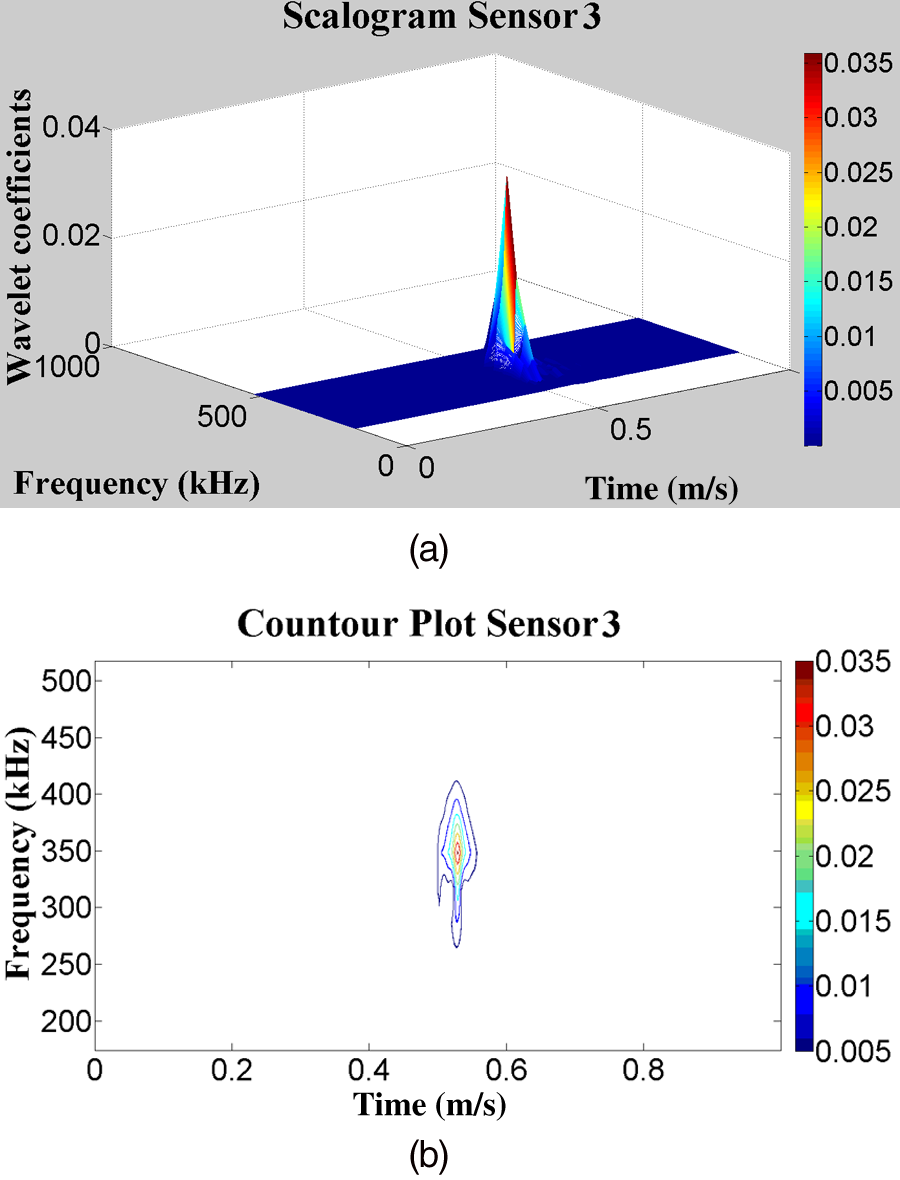
(a) 3D plot of the wavelet scalogram coefficients and (b) associated contour plot of the recorded flexural wave.
As depicted in Figure 3(a), a red patch in the scalogram is representative of the ridge, that is, the local energy content of the waveform recorded. Figure 3(b) shows that the red patch in the contour plot of the scalogram associated with the ridge is achieved at the instantaneous frequency
Newton’s method and unconstrained optimization for solving systems ofnon-linear equations
The method adopted for solving the set of equations (7) was to combine a Newton’s method with an unconstrained optimization. Analogously to Ciampa and Meo, 14 the set of non-linear equations (7) can be expressed as

where

where

Among the class of powerful algorithms for unconstrained optimization, we focused on the line search method and the polynomial backtracking technique
14
because of its simplicity, and because they do not depend on how the Jacobian is obtained. In particular, the function to be minimized (also known as merit function) was the scalar-valued function of

where the factor 1/2 is introduced for convenience. Obviously, any root of h fulfils the identity
Experimental set-up
To validate this algorithm, experimental location tests were conducted on two different composite structures simply supported at the following edges:
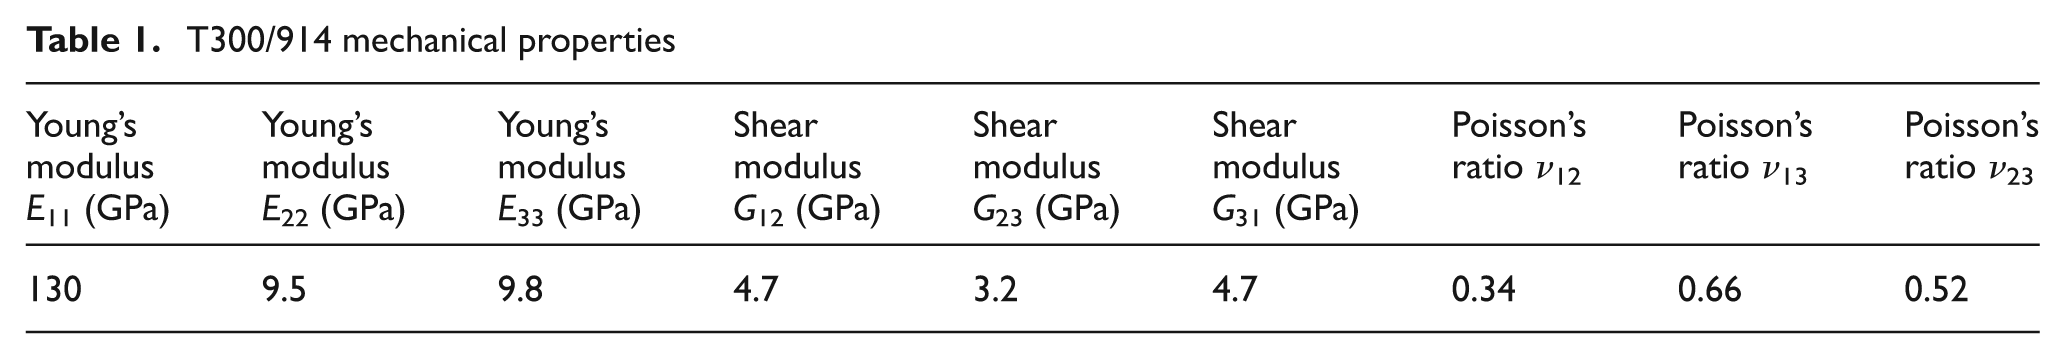
T300/914 CFRP composite laminate with dimensions of 502 mm × 437 mm × 6.94 mm and lay-up sequence of [0/15/30/45/60/75/90]3s (Figure 4(a)). The ply properties are reported in Table 1.
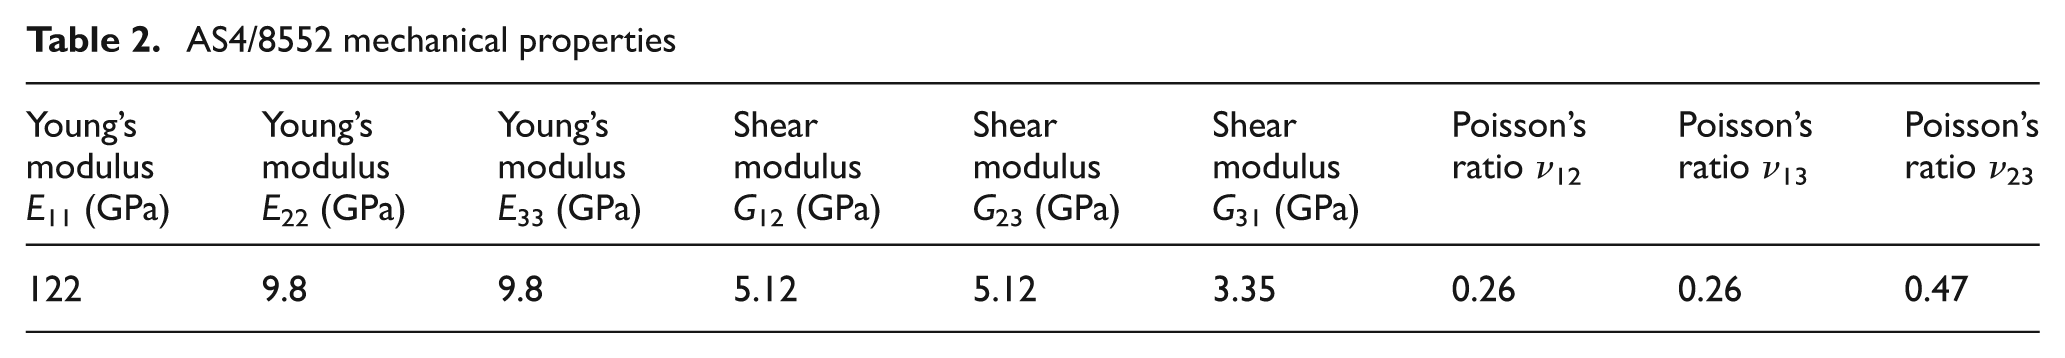
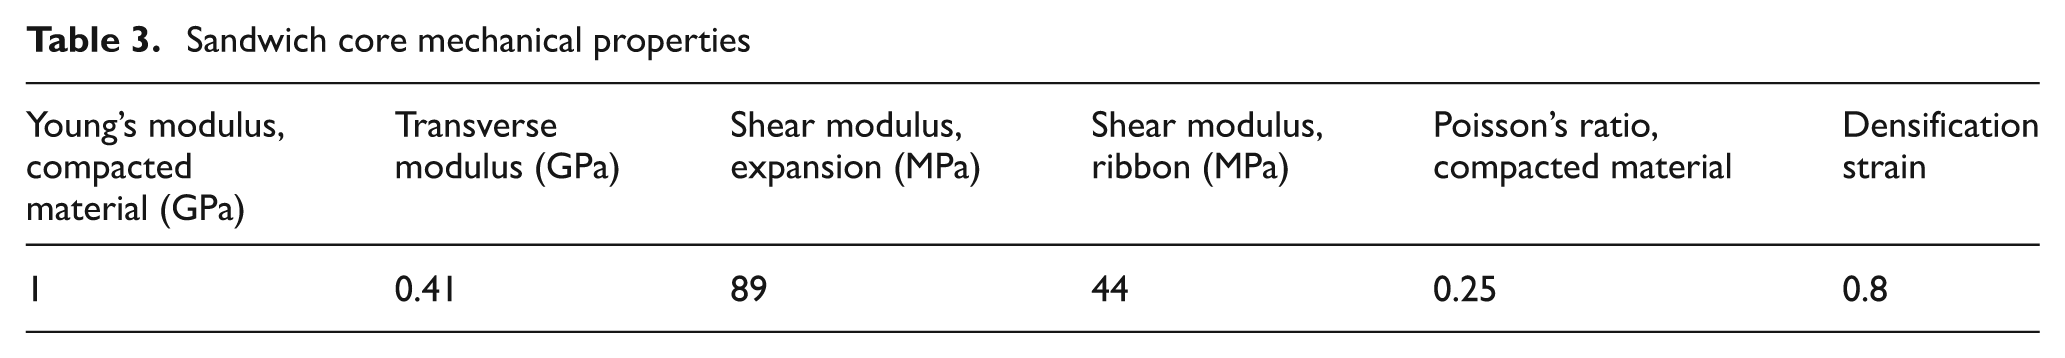
Sandwich composite plate with dimensions of 380 mm long and 254 mm wide (Figure 4(b)). The core used in the sandwich was a 6.35-mm-thick HRH-10-1/8-4.0 Aramid fibre/phenolic resin Nomex. Facing skins (2 mm thick) were made of four plies of AS4/8552 unidirectional carbon/epoxy prepreg composite on both sides of the core with lay-up sequence of [90/45/45/90]. The ply and sandwich properties are reported in Tables 2 and 3.
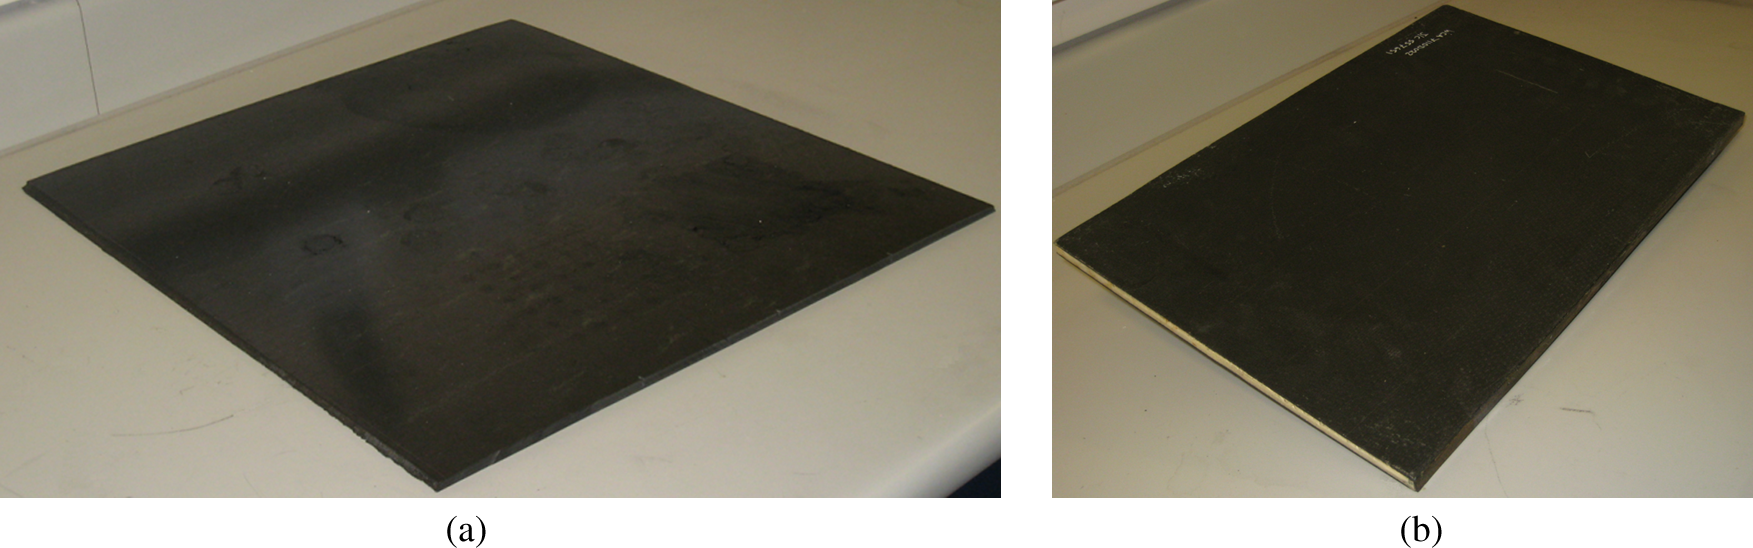
(a) CFRP composite laminate and (b) sandwich plate.
T300/914 mechanical properties
AS4/8552 mechanical properties
Sandwich core mechanical properties
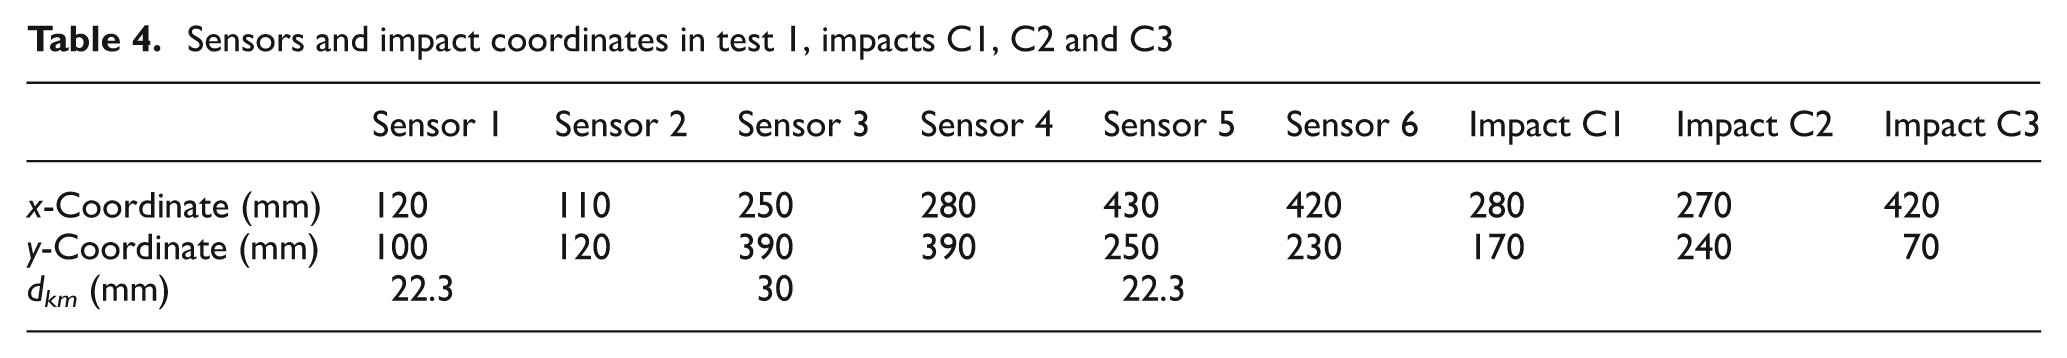
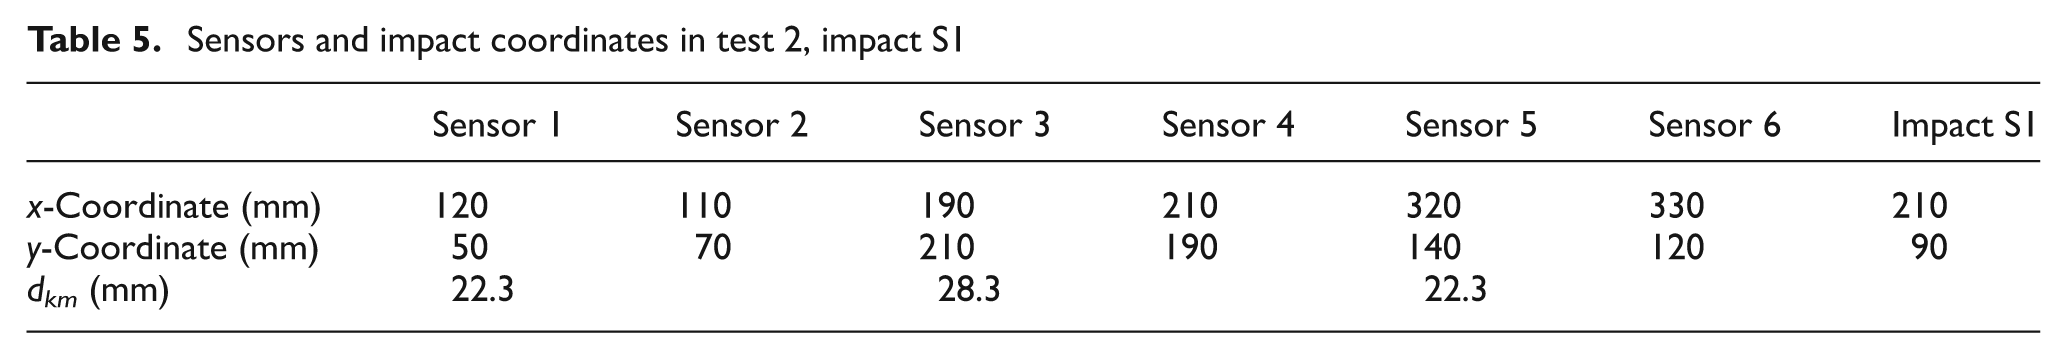
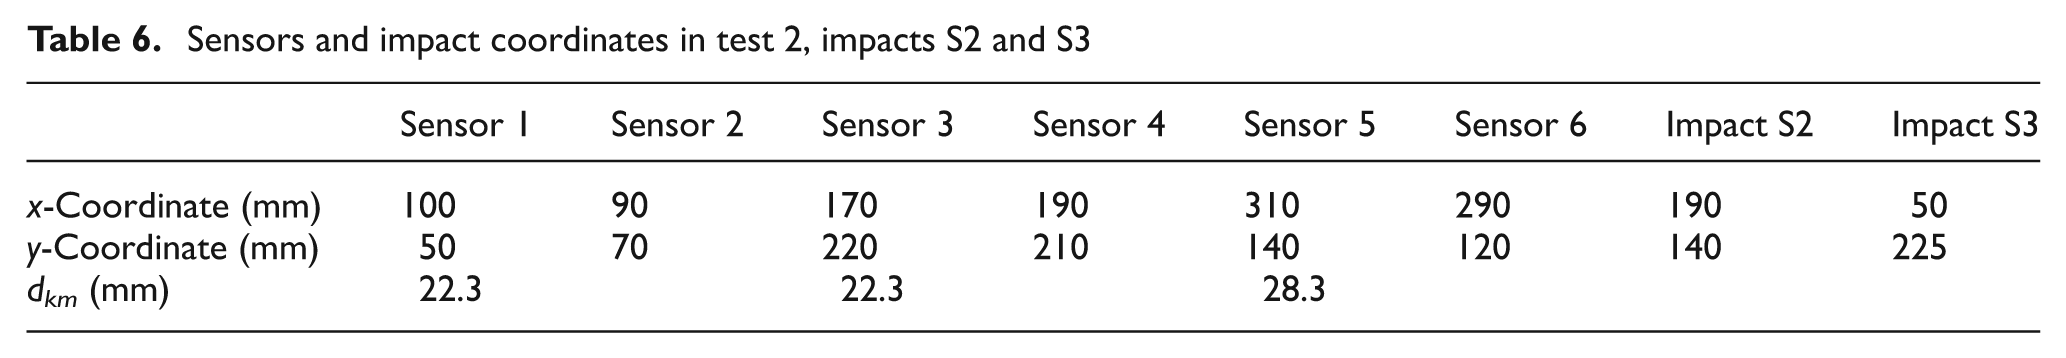
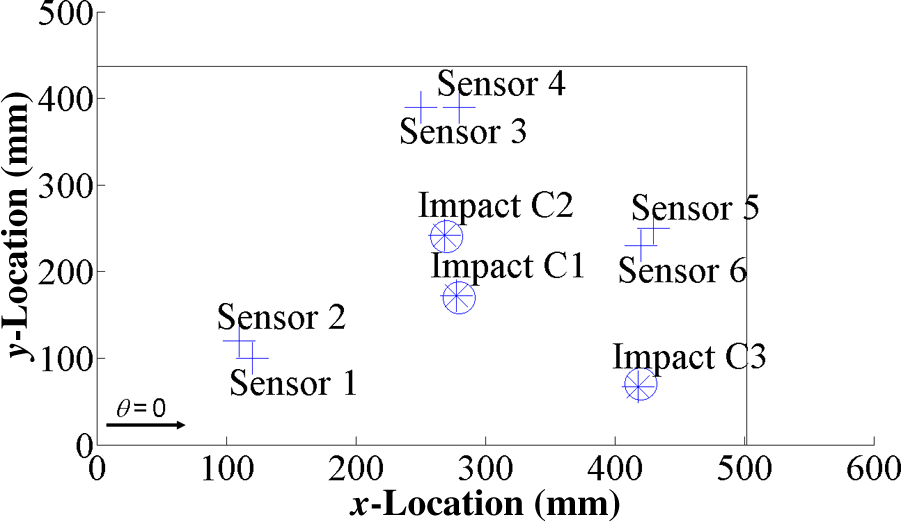
The Lamb waves A0 were generated using a hand-held modal hammer manufactured by Meggit-Endevco and were measured employing six surface-bonded AE sensors with a central frequency of 300 kHz, provided by the courtesy of Airbus UK. Each sensing unit is certified to provide high signal-to-noise ratio (SNR) (approximately 45 dB), and it is composed of AE sensors, preamplifiers, power supplies and pass-band filters, connected by low-noise cables (15 cm length). The gain of the preamplifiers is 40 dB, while the input impedance of the filters is 50 Ω. Outputs of the transducers were connected to pass-band filters with a frequency range between 200 and 400 kHz and then linked to preamplifiers. According to the g31/g32, electromechanical coupling mechanism of the AE sensors, at the mentioned finite bandwidth, only the fundamental antisymmetric Lamb wave A0 was measured. 22 The signals were acquired using two four-channel oscilloscopes with 16 bits of resolution and a sampling rate of 25 MHz. Both systems were synchronized in way that all the transducers were triggered by one of the sensors (master sensor). A MATLAB software code implemented by the authors was written to analyse the waveforms with the wavelet transform and to find the impact location. Sensors location and impact source coordinates are reported in Table 4 for test 1 with CFRP (referred as impacts C1, C2 and C3 in the article) and Tables 5 and 6 for test 2 with sandwich plate (referred as impacts S1, S2 and S3 in the article).
Sensors and impact coordinates in test 1, impacts C1, C2 and C3
Sensors and impact coordinates in test 2, impact S1
Sensors and impact coordinates in test 2, impacts S2 and S3
Impact localization results
Source location results on CFRP laminate
As shown in section ‘TOA identification using the CWT’, the signals were analysed in terms of group velocity–frequency relationship, and the peak of the scalogram was used to indicate the TOA of the Lamb mode A0. The maxima coefficients in the experiments with a quasi-isotropic CFRP plate were found at the instantaneous frequency of 258.77 kHz. Figure 5 illustrates the procedure for extracting the TOA at the above frequency of interest, for the configuration reported in test 1, impact C1. Figure 6 shows the results of the source location for the impacts in test 1.
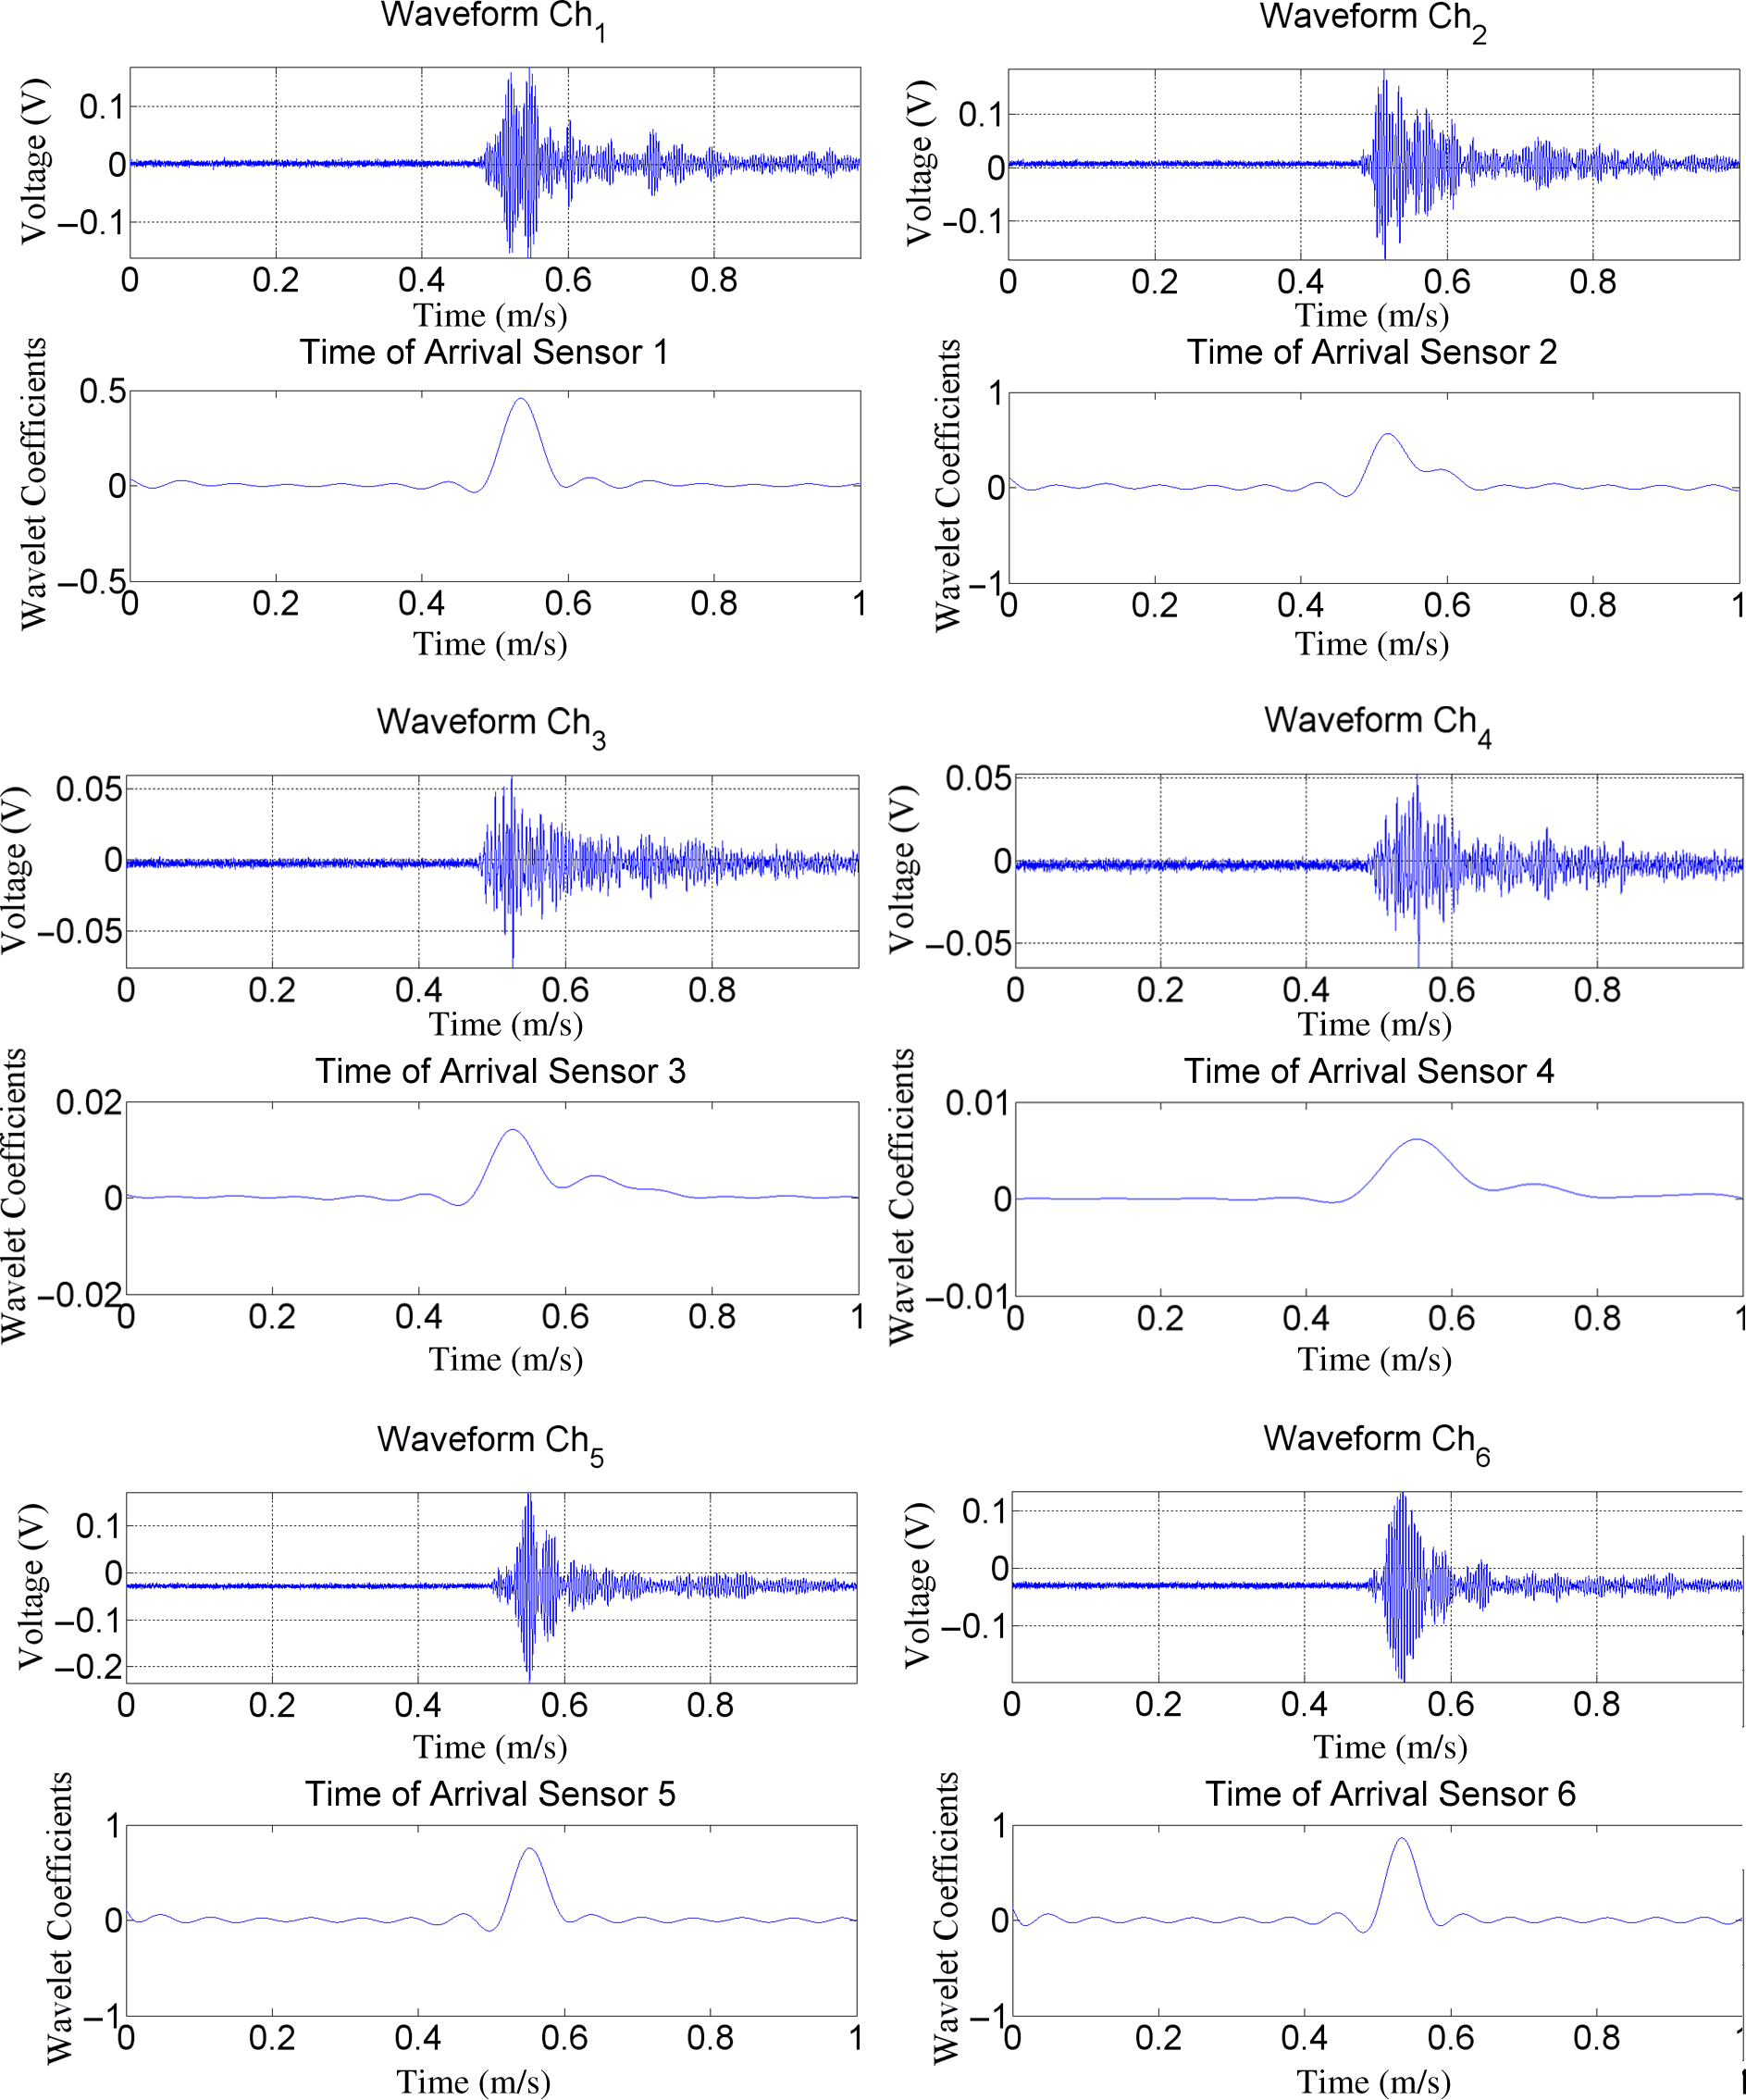
Time histories of the six recorded waveforms (upper side) and the line profile of the scalogram (lower side) at the frequency
Source location results for impacts C1, C2 and C3. The real (o) and calculated (*).
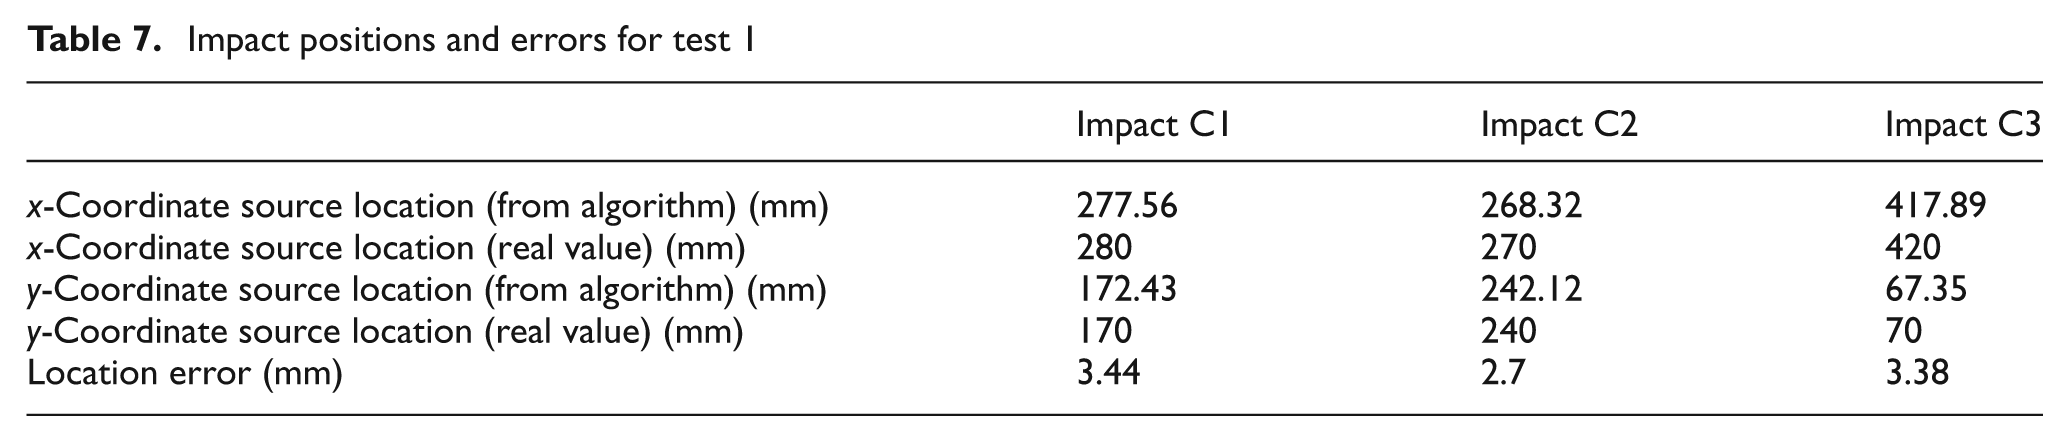
Table 7 depicts the evaluated impact positions and the error as expressed by the following formula
Impact positions and errors for test 1

where
As it can be seen from Table 7, this algorithm provides results with satisfactory accuracy (maximum error in estimation of the coordinates of the impact location was approximately 3 mm) for all the impacts considered, even outside the area defined by the sensors.
Source location results on sandwich panel
The scalogram maxima coefficients in both experiments with the sandwich plate were found at the instantaneous frequency of 348.27 kHz. Figure 7 illustrates the procedure for extracting the TOA at the above frequency of interest, for the configuration reported in test 2, impact S1.
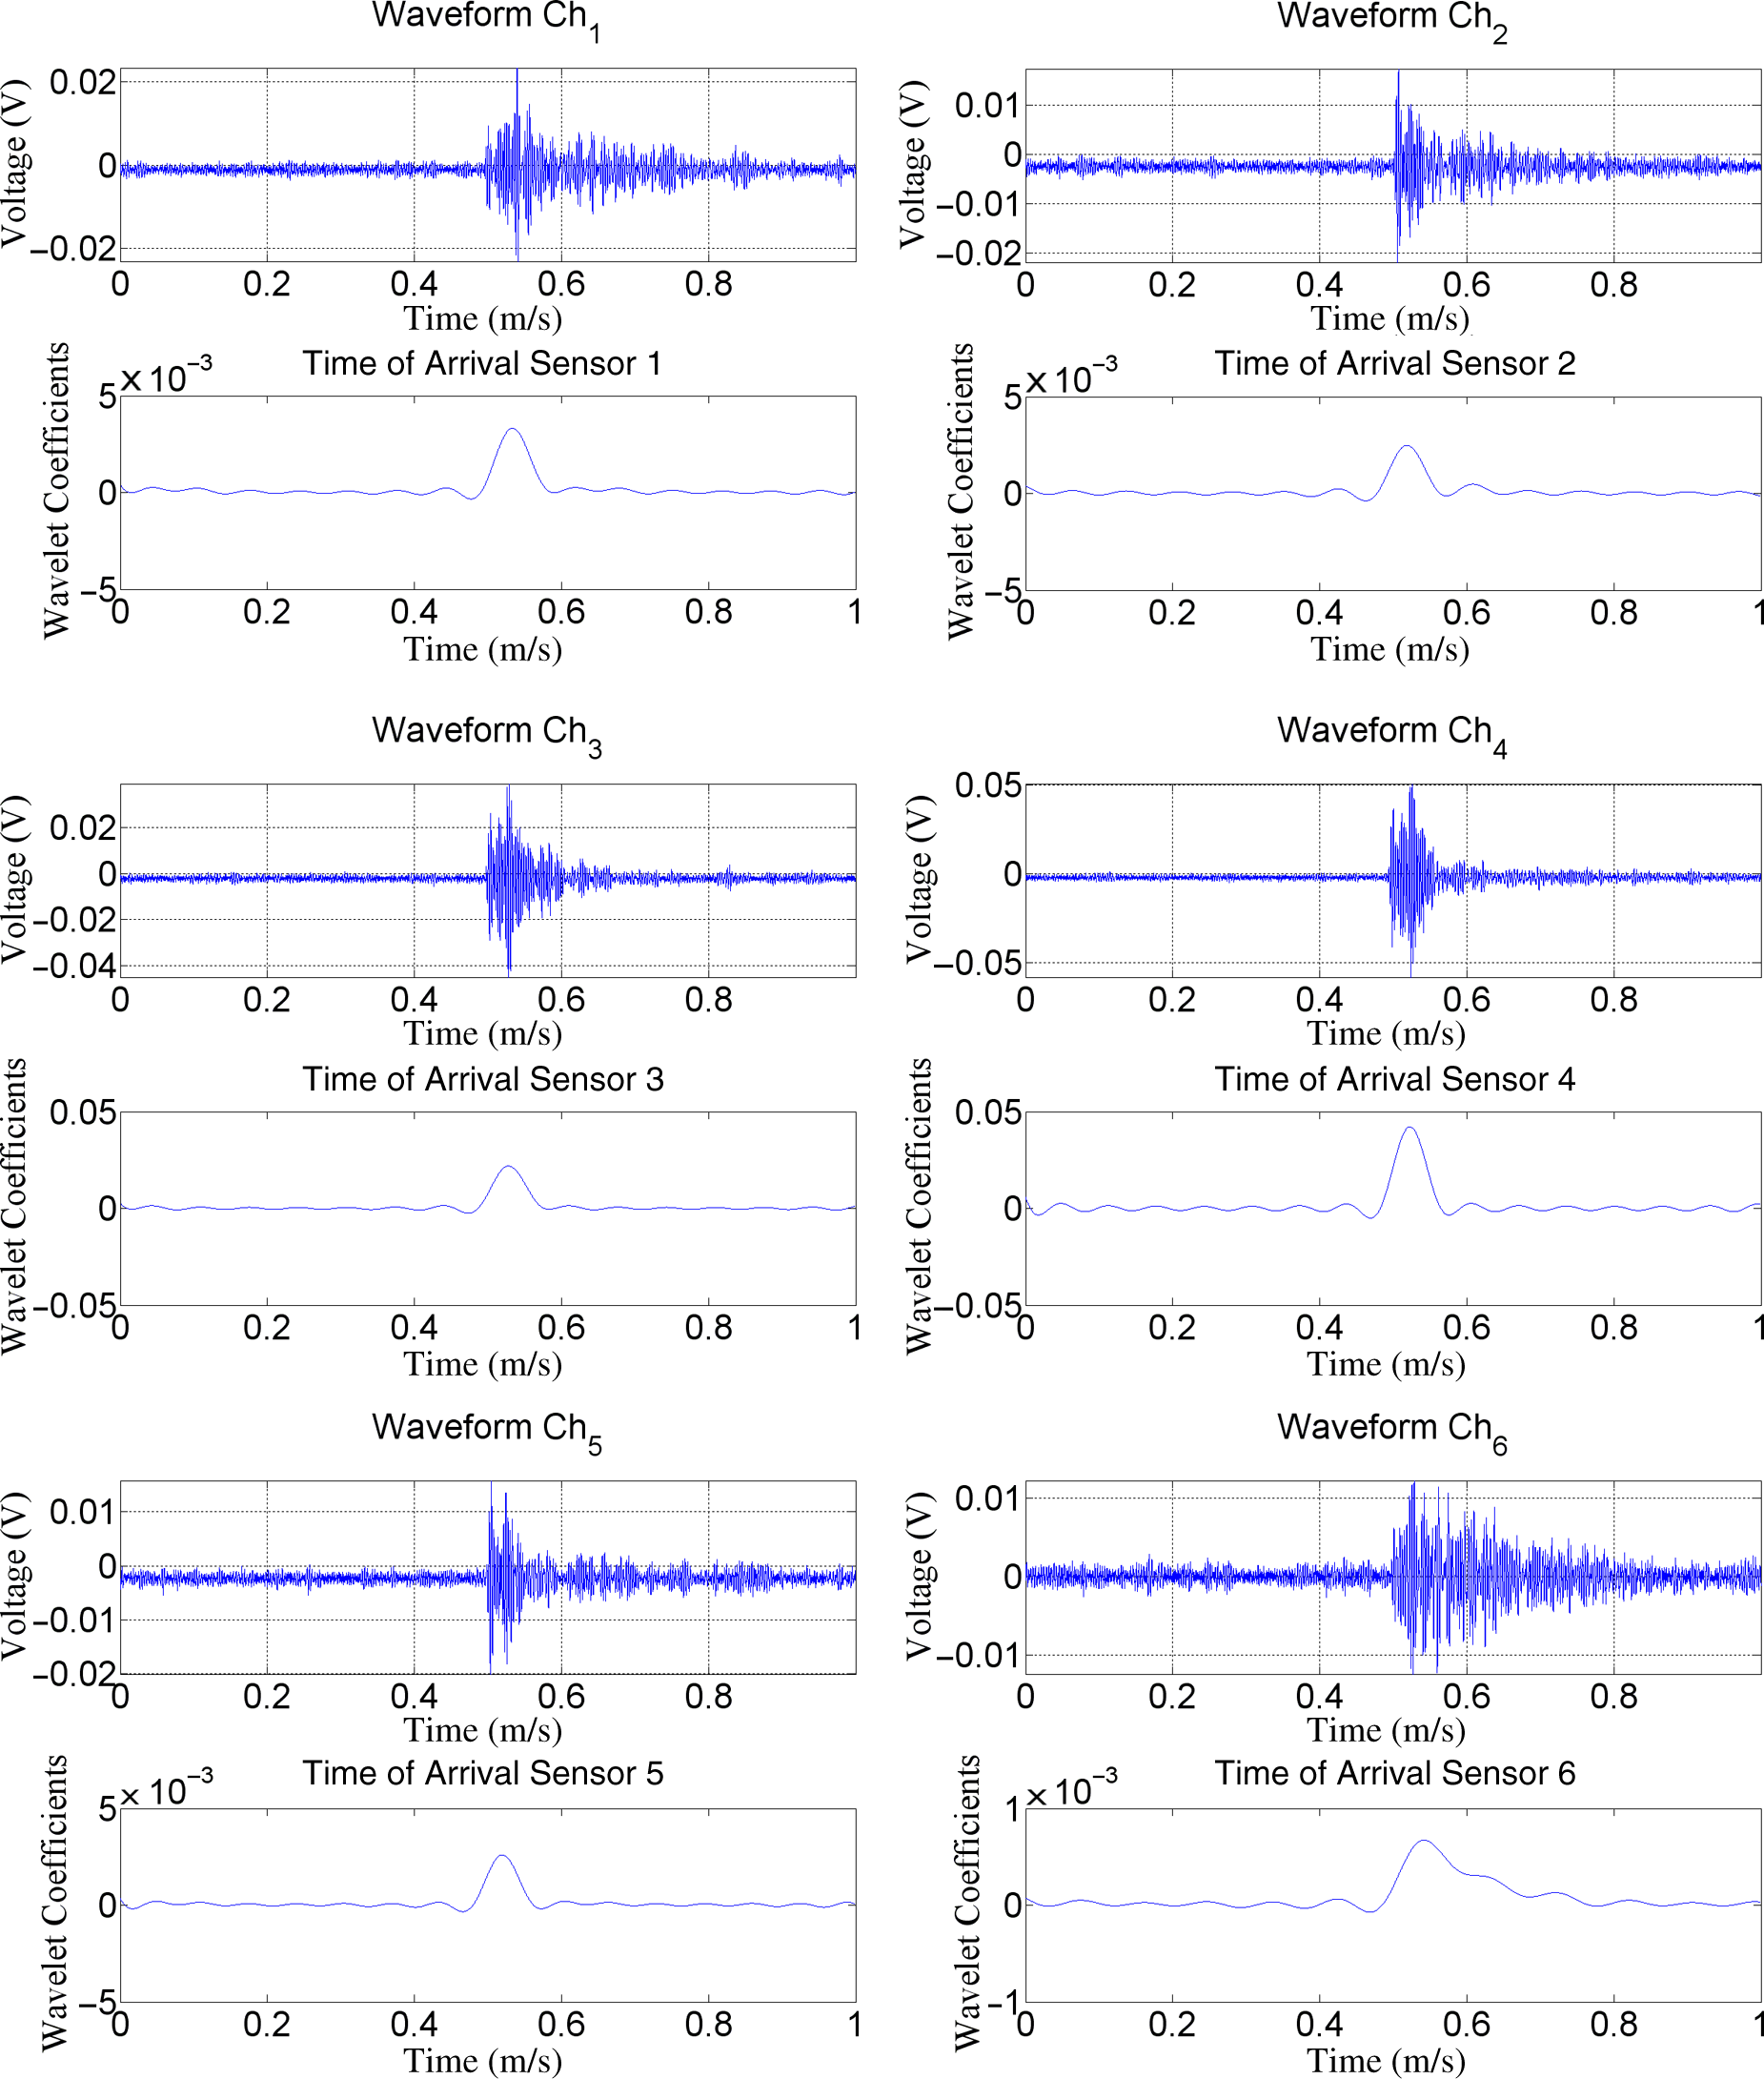
Time histories of the six recorded waveforms (upper side) and the line profile of the scalogram (lower side) at the frequency
Figure 8 shows the results of the source location for both impacts in test 2. As shown in Figure 6, the calculated source location is represented by an open circle (o), while the real one is illustrated by a star symbol (*). Table 8 depicts the evaluated impact positions and the errors.
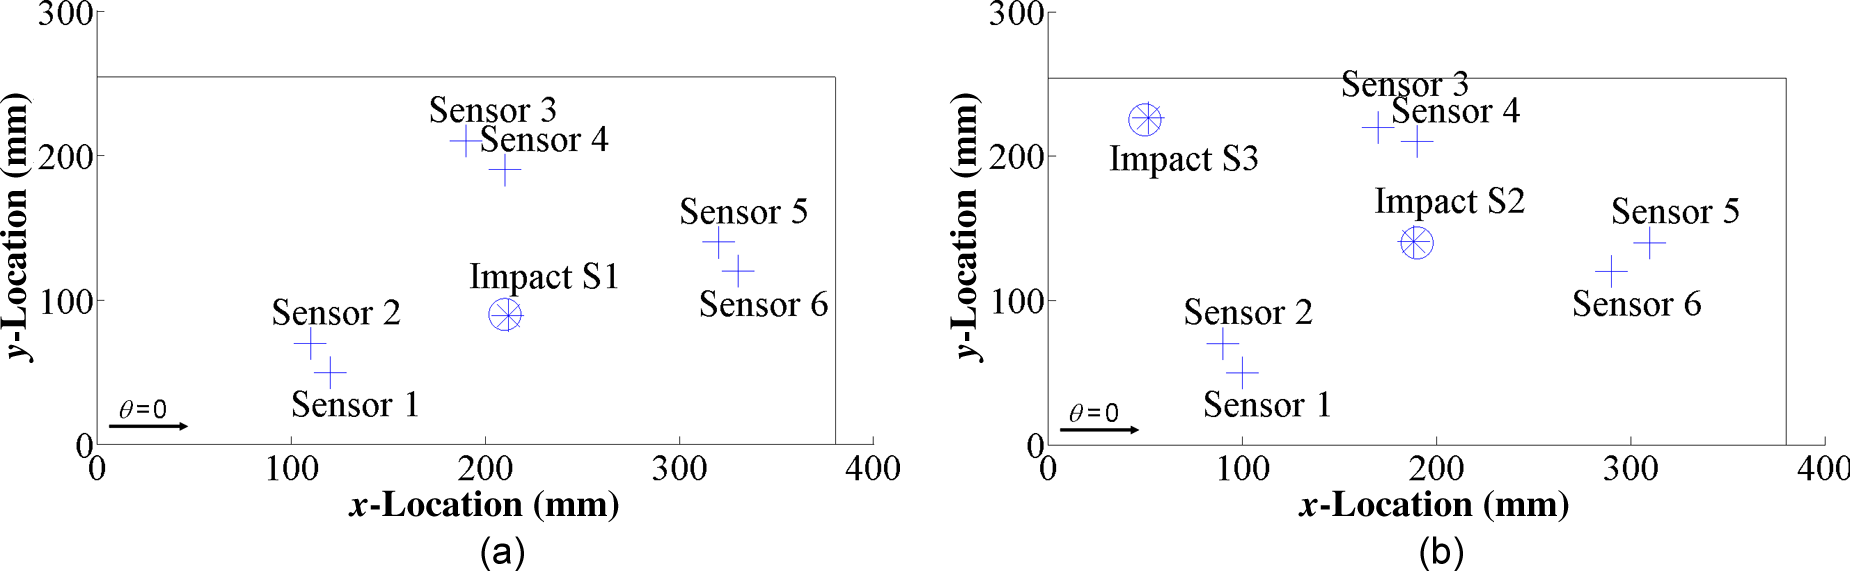
Source location results for impacts (a) S1 and (b) S2 and S3. The real (o) and calculated (*).
Impact positions and errors for test 2
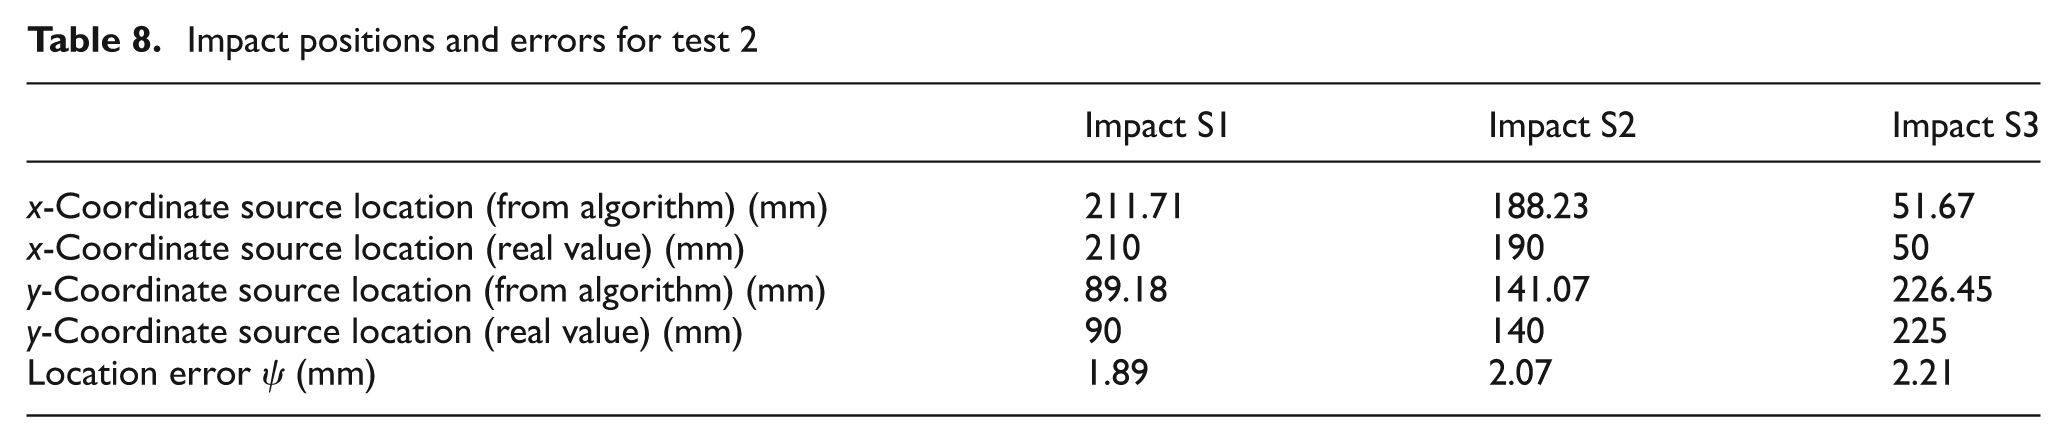
As it can be seen from Table 8, this algorithm generates results with reasonable accuracy (maximum error in estimation of the coordinates of the impact location was approximately 2 mm) even in complex structures as sandwich panels. In the experiments on both CFRP and sandwich plate, according to equation (5), the maximum distance between any pair of sensors was assumed equal to approximately one-third of the distance of the closest transducer from the impact location (e.g. see d34 in Table 6 and l4 in Table 11 for impact S2). It was observed during the test on the sandwich plate that due to the severe attenuation in the resin core, the peak magnitude of the scalogram for each pair of transducers occurred at slightly different frequencies (within a band
Group velocity results on CFRP laminate
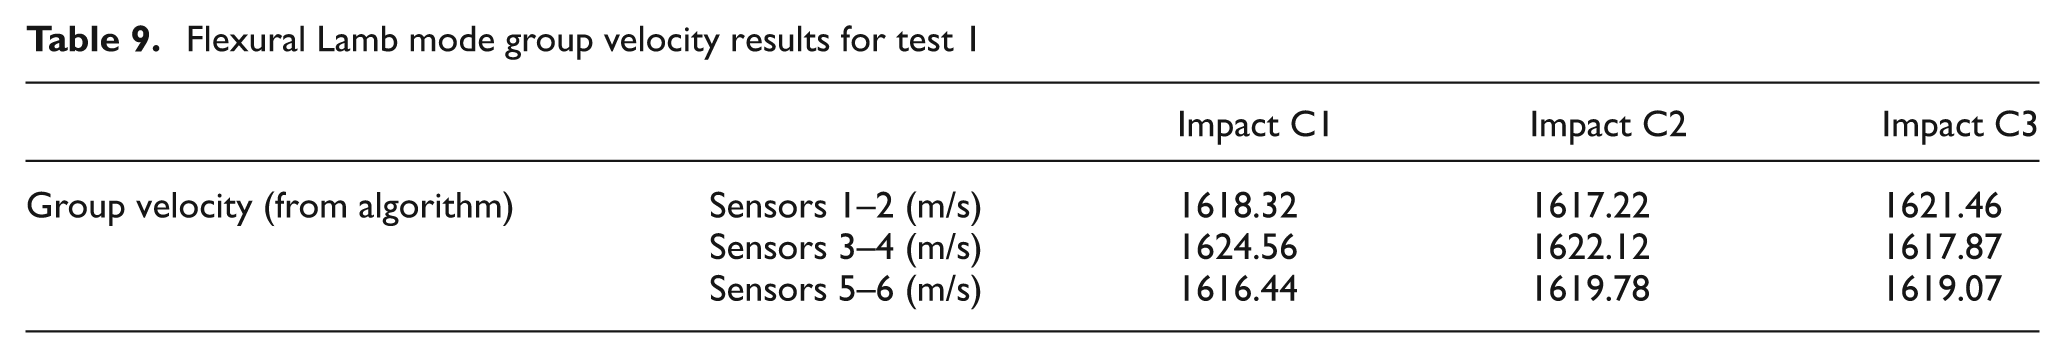
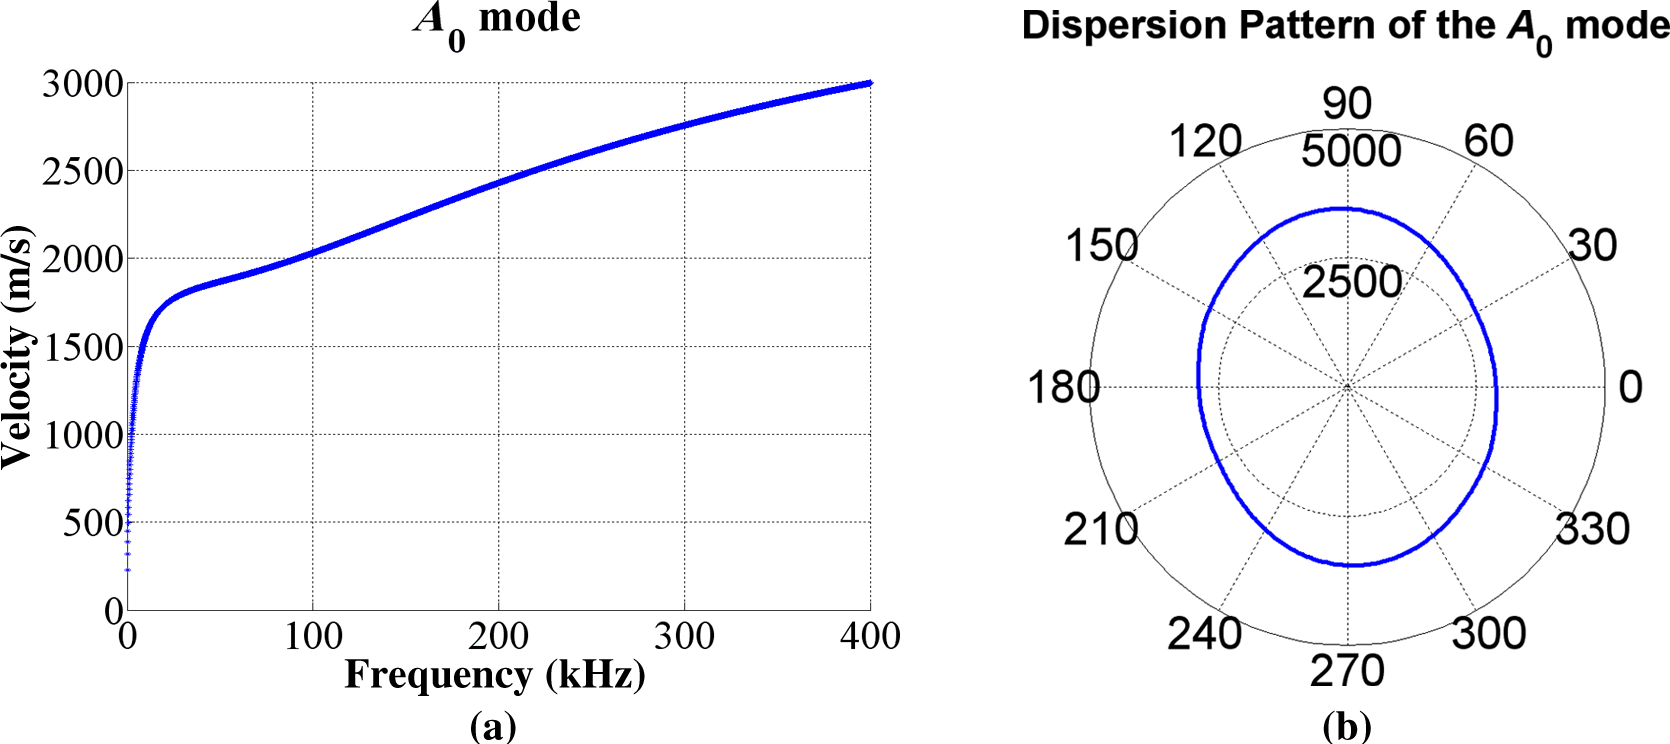
The values of the fundamental flexural Lamb mode A0 obtained from the optimization algorithm were compared with those determined by a semi-analytical finite element (SAFE) approach also known as spectral finite element method (SFEM). The SFEM algorithm for undamped media presented by Barbieri et al. 23 was extended to obtain the dispersion relations of group velocity for the most common composite structures of arbitrary thickness. This technique provides a description of the cross-sectional deformation of a laminate using a finite element discretization of the cross-sectional displacement field. The displacements were approximated as harmonic exponential functions with the shape independent of frequency, and a one-dimensional FE mesh along the thickness was assumed. The characteristic equation (SFEM solution) for free wave propagation was obtained in stable manner from a linear eigenvalue problem in wavenumber k. With this method, the propagating wave field can be predicted for any kind of composite laminate. The approach proposed by Finnveden 24 was used as it allowed obtaining the group velocity at each frequency and wavenumber solution, without the need to calculate the differentiations of two close frequencies and two adjacent wave numbers (see equation (11)). Table 9 provides the values of the group velocities calculated from the algorithm in the CFRP laminate, while Figure 9 illustrates the dispersion curves for the Lamb wave A0 and the angular-dispersion pattern at the instantaneous frequency of 258.77 kHz.
Flexural Lamb mode group velocity results for test 1
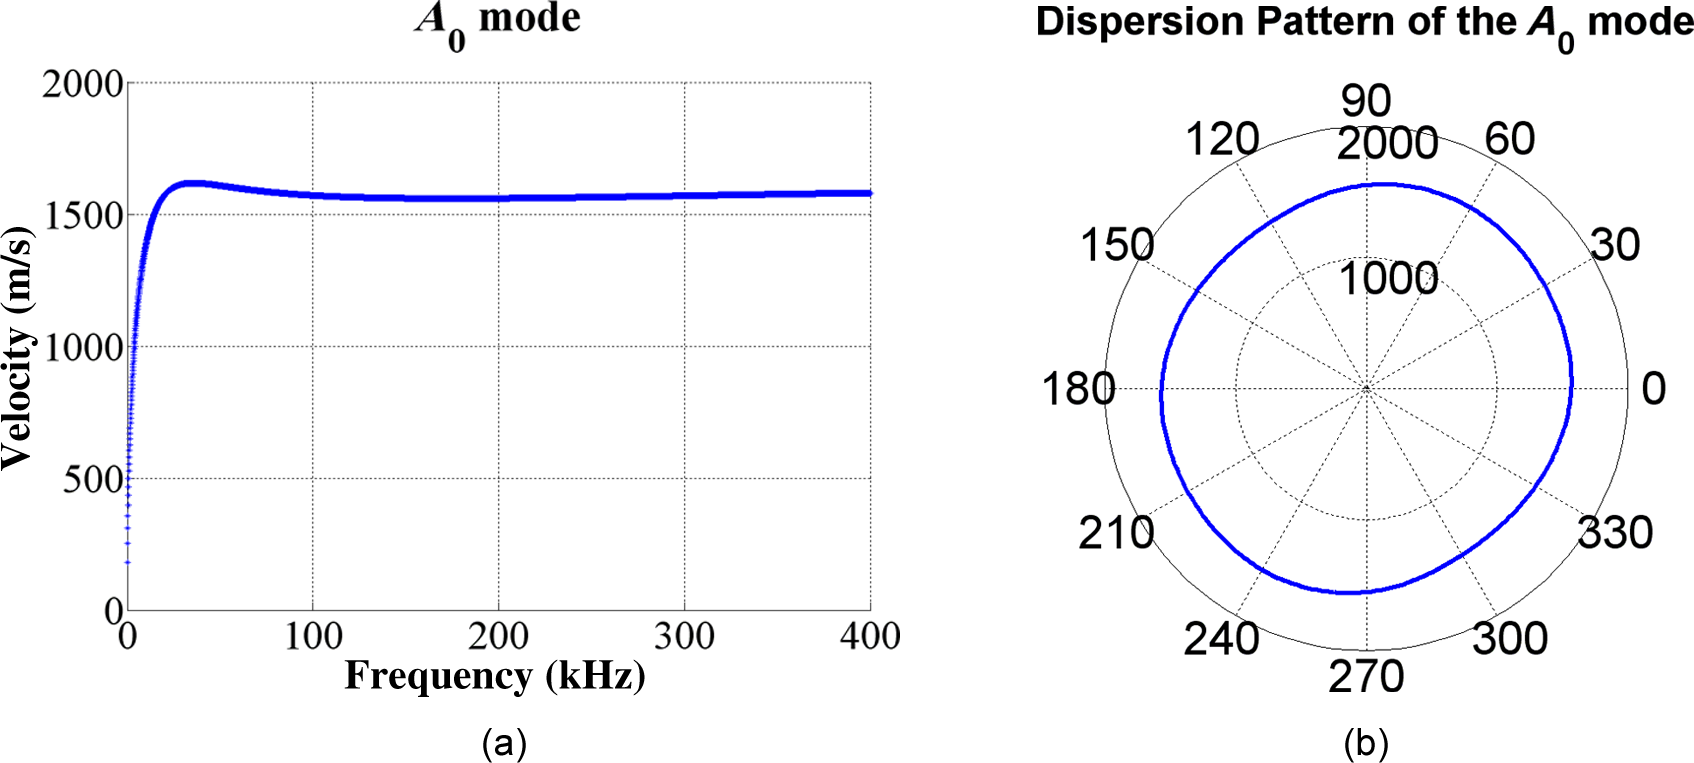
(a) Dispersion curves for the flexural Lamb mode A0 at θ = 0 and (b) angular-group velocity pattern at 258.77 kHz.
According to the quasi-isotropic nature of the CFRP composite plate, the angular-group velocity pattern was nearly circular (Figure 9(b)), and the Lamb mode A0 calculated by the algorithm for any pair of transducers was approximately the same (close to the value of 1620 m/s, that is, the maximum value for A0 reported in Figure 9(a)).
Group velocity results on sandwich plate
In relation to the previous section, the group speed values obtained from the optimization algorithm were compared with those determined by the SFEM for the sandwich plate. Table 10 reports the group velocities calculated from the algorithm, while in Figure 10, the dispersion curves for the Lamb wave A0 and the angular-dispersion pattern at the instantaneous frequency of 348.27 kHz are displayed (see also Appendix for the values of the TOA and the distances between the receivers and the impact point in all the experiments carried out).
Flexural Lamb mode group velocity results for test 2

(a) Dispersion curves for the flexural Lamb mode A0 at θ = 0 and (b) angular-group velocity pattern at 348.27 kHz.
Although the calculated group velocity matched very well with those obtained from the dispersion curves in the CFRP case (Table 9 and Figure 9), for the sandwich plate, the predicted values from the algorithm were slightly different from the reconstructed response provided by the SFEM model (Table 10 and Figure 10). Indeed, as it can be seen from Figure 10(a), the value of the flexural group velocity at 348.27 kHz is approximately 2800 m/s. This is mainly due to the high attenuations in the sandwich core that are not included in the SFEM model.
However, this qualitative comparison of the fundamental flexural velocity was useful to highlight the drawbacks related to the Lamb wave A0 speed evaluation through numerical methods, especially in complex structures (sandwich panel). Therefore, this algorithm proved to be an efficient way to overcome the drawbacks related to the uncertainty of the group estimation provided by the dispersion curves and the limits of a priori prediction with an accurate model of the structural response of complex structures.
Conclusions
This research work shows an in situ SHM method for locating the AE source (impact event) and for determining the velocity of elastic waves in plate-like composite structures. The proposed method is based on the differences of the stress waves measured with high SNR by six surface-attached AE PZT sensors. The peak magnitude of the scalogram was employed to identify the TOA of the flexural Lamb mode A0. The coordinates of the impact location and the group speed were obtained by solving a set of non-linear equations through a combination of local Newton’s iterative method associated with a global unconstrained optimization (line search and polynomial backtracking technique). This algorithm does not require a priori knowledge of the anisotropy angular-group velocity pattern of the AE waveforms as well as the mechanical properties, lay-up and thickness of the structure. The experimental results conducted on a quasi-isotropic CFRP laminate and a sandwich panel showed that the identification of the source location was achieved with satisfactory accuracy (maximum error in estimation of the impact location was approximately 3 mm for quasi-isotropic CFRP panel and nearly 2 mm for sandwich plate). Moreover, a comparison between the group velocities calculated by the algorithm and the values obtained from the dispersion curves through a SFEM method was accomplished.
Footnotes
Appendix
Funding
This study was supported by Airbus UK and Great Western Research.