
Abstract
In this article, the comparison of two noncontact measurement methods dedicated to civil engineering structures’ state examination is presented. The vision-based method computes the displacement field of the analyzed structure by means of the digital image correlation coefficient. The system consists of one or more high-resolution digital cameras mounted on a head or on portable tripods. The developed methodology and created software application embedded in an MS-Windows operating system are presented. The second system measures the deflection of the structures by means of a radar interferometer. In both cases, it is possible to measure many points on the structure simultaneously. This article presents a comparison of the displacement field measurement performed on a field setup, as well as the span of a steel bridge designed for tram traffic. Both systems are described, with special attention given to their application in measurements of civil engineering structures. This article demonstrates a preliminary test performed to verify both of the noncontact systems in relation to high-accuracy measurement devices, the precise surveying level, and the electronic dial indicator of displacement. The experiment was designed intentionally to simulate the geometric conditions of the real structure, but the displacement values were generated and controlled by the operator. As a key study, a steel viaduct subjected to an operational load was measured, as a type of structure for which the observation is required in terms of structural health monitoring. It was subjected to the operational load caused by tram traffic. Both examined systems were applied. The accuracy analysis of both systems was investigated, and the obtained results were discussed.
Keywords
Introduction
Structural health monitoring (SHM) involves the integration of sensors, data transmission, processing, and analysis in order to detect, localize, and assess damage within a structure, which can lead to its failure at the present time or in the future. 1 SHM methods can be divided into two groups: local and global methods. The latter are applied if a global change in the geometry of a structure can be observed. The analysis of the displacement field or mode shapes plays a key role in the evaluation of constructions’ static states and dynamic characteristics.
In bridge engineering, diagnostic tests are complex processes that use broad knowledge of the considered object. Among the various sources of information on the structure state, in addition to the technical and operational documentation and structure inspections, a particularly important role is played by research under load.2,3 Analysis of structure response may be related to the static or dynamic test loads. This can be performed for new structures before putting them into operation, as well as for previously used structures in order to determine the current structure condition, for example, after repair. However, tests during operation are often conducted with randomly varying loads and may be a useful basis for experimental modal analysis.4,5
In order to assess the correctness of their work and condition, structures are submitted to static loads. 6 The results of regularly repeated static tests allow the comprehensive evaluation of changes, which can indicate the appearance of damage, often difficult to reveal with other methods. A separate problem is the analysis of bridge response under dynamic loads. The detection of changes in the dynamic characteristics of structures may be used to discover bridge defects, including deformation, destruction, or loss of material continuity.
Each bridge structure investigated under operational loads demands individually designed procedures of regular tests to investigate its condition. The concepts of monitoring systems must take into consideration a few items: the structure type, operational conditions, and the rate of degradation processes. The techniques that are applied to determine the response of the loaded structure are very diverse.
Nowadays, a wide variety of measurement techniques, which are based on displacement measures, are applied in the monitoring of bridge deformations and vibrations. 7 Among them are surveying techniques: global positioning system (GPS) or global navigation satellite system (GNSS) and electro-optical instruments. The satellite technique is particularly useful in the dynamic measurements of long-span bridges, which are submitted to displacements of several centimeters.8,9 However, the accuracy of about ±1 cm in the horizontal direction (and ±2 cm in the vertical direction) may be disturbed by some effects. An error of a few centimeters may be caused by multiple signal reflections from construction elements that cause the multipath effect, the improper modeling of ionospheric and tropospheric delay, and the unfavorable configuration and visibility of satellites. On the contrary, measurements made by total stations or digital levels are not disturbed with these effects and enable deflection measurements with an accuracy better than 0.2 mm.10,11 Nevertheless, this technique cannot be applied in bad weather conditions that limit visibility or to perform the dynamic measurements because of the low sampling rate.
Other devices, used particularly in dynamic measurements, are electronic sensors such as accelerometers, displacement transducers (e.g. linear variable differential transformer (LVDT) and laser beam), and strain gauges. 12 These devices have to be mounted directly on the structure and require connection with reference points to determine the absolute displacements. 11 In the case of displacement transducers, a fixed base is necessary to measure relative displacements. On the contrary, the accuracy of data obtained with accelerometers depends strongly on sampling rate, internal noise of a device, sample length, and frequency content of the signal. In order to determine the displacement values, a double integration of acceleration data must be calculated. This process, however, requires the use of digital filtering and the definition of the initial conditions. Their improper assumption may lead to errors in displacement calculation. 13 Therefore, it is recommended to avoid the integration process and to use the appropriate device for direct measurement of the required quantity. 14
A significant drawback of all the above-mentioned methods is the necessity of fixing sensors or additional devices directly to the examined parts of objects. In many practical cases, it may be very difficult or even impossible on account of the working conditions. Moreover, they provide only discrete information of structure displacement. To get full information about the position of the structure, it is necessary to install a number of sensors or make measurements at many points. Therefore, there is a necessity for the design and implementation of noncontact measurement systems. Two noninvasive techniques, which allow the displacement measurements at many points simultaneously, are described in detail below.
The first technique is radar interferometry. It is widely used for imaging changes in the earth’s surface by satellites. 15 Recently, it has also been used in ground-based imaging. It can provide information about the movements of surfaces, such as slopes or landslides, 16 and also enables the static and dynamic tests of engineering structures.
The ground-based synthetic radar aperture (GBSAR) technique has been developed since 2000. 17 Its main applications are land surface topography imaging, and land deformation monitoring. The radar used in this technique performs the measurement by sending a modulated wave and analyzing the returning signal reflected from the object. The radial component of the object displacement is observed as a phase change of the returning signal.
The first implementation of the GBSAR technique was the linear synthetic aperture (LISA) radar, used for measurement of static bridge deflection or deformation of building façades, among others.17,18 The concept of using the ground-based radar to study the dynamics of structures was proposed by Pieraccini et al. 19 in 2004. In further research, the appropriate frequency of the carrier wave was investigated. The higher the frequency, the higher the sensitivity of the displacement measurement, but the lower the range arising from the phase ambiguity. The commercial version of the system, named “Image by Interferometric Survey” (IBIS), implemented in 2007, adopts the center frequency of 17.2 GHz (Ku-band of microwaves) as a compromise. This means that the maximum displacement, unambiguously determinable, is equal to ±4.36 mm (±1/4 of the wavelength). Greater values require methods for removing the ambiguity phase. 20 Due to its features, the IBIS system may be applied in static and dynamic monitoring of structures, especially of elongated shape, including bridges and towers.21,22
The second technique is digital image correlation, applied in vision-based systems (VBs). The vision systems can be a good alternative to contact type transducers23–26 as easy to use, accurate, low cost, and universal tool systems, which can be applied in vibration and deformation measurements. Nowadays, an increase in the availability of vision systems using digital image correlation for the measurement of displacements, strains, and stresses of objects has been observed on the world markets. The most important companies offering vision measurement systems existing at present on the market are Correlated Solution, GOM, LIMESS Messtechnik & Software, Dantec Dynamics, and Metris (Krypton 9000).27–34 The mentioned commercially available vision systems are not dedicated to large-scale civil engineering structure monitoring. They can perform only manual measurements and have to be operated by a skilled user. They cannot be easily used for fully automatic long-term monitoring of the structure. Some of the systems belong to active vision devices that involve additional sources of radiation, making them expensive. However, the passive devices require special geometric markers or random texture and cannot carry out measurements without the object’s preparation. Researchers have proposed many solutions for the systems dedicated to civil engineering state evaluation.
In a previous article by Olaszek, 35 the method of geometric marker’s displacement tracking is presented. The proposed method was applied for the measurement of a bridge’s vibrations and displacements under static and dynamic loads. The subpixel technique of tracking was introduced. An additional reference point was placed on the bridge’s structural element in order to correct errors induced by the vibration of the camera. The marker had the shape of a circle, and its centroid was tracked during investigation. A different monitoring system for bridges was presented in a previous article by Lee and Shinozuka. 36 The system was applied for train bridge state examination. The 1 MPixPointGrey Fleas2 camera was used for observation of the geometric marker’s displacement. The positions of the tracked marker’s centroid generated the trajectory of the measurement point of the bridge, which was subjected to dynamic loads. The second device, a Canon S7 camera with a lens with a focal length equal to f = 140 mm, was applied to observe the girder’s deflection. Yoneyama et al. 37 proposed a method of bridge deflection measurement using digital image correlation. The camera’s position was fixed. The random speckle pattern was placed on the analyzed plane of the structure. The examination of the structure’s deflection was carried out during a loading test. The load of 20 tons was provided by a truck. The authors reported that the standard deviation (SD) of the absolute difference between the displacements measured by a vision system and a network of tensometers was 0.31 mm. In a previous article by Tung et al., 38 the method of crack detection in masonry walls was presented. The deflection measurement was carried out by means of a digital image correlation coefficient. In the experimental tests, the wall was subjected to compressive stresses. The initiation and growth of the cracks were observed. The cracks were detected as places in which the correlation coefficient decreased its value abruptly. Kujawińska et al. 39 proposed a hybrid, distributed system dedicated to construction monitoring. The images were acquired by two types of optical sensors: one- or two-camera systems using digital image correlation as a measurement technique and an infrared camera. The fusion of data from two types of sensors allowed the efficiency of the structure’s monitoring to be increased. Part of the measurement system, using cameras and the digital image correlation method, was applied in the monitoring of the elements of civil engineering constructions, and in the art gallery for paintings’ state observation. 40 Canon EOS 5D Mark II cameras were applied as image acquisition devices. Kujawińska et al. 41 proposed an intelligent, hybrid vision system consisting of optical sensors and a server controlling the operation of all measurement devices. The first sensor is an active device and consists of a structured light projector and charge-coupled device (CCD) camera. The device reconstructs the geometry of objects in the form of a cloud of points. The second device makes use of the Moire Pattern analysis. The pattern, consisting of parallel lines, is placed on the flat surface of the structure. When the construction is under the load, it deforms along with the pattern. The reference pattern is superimposed on the image of the deformed pattern. The interference phenomenon creates the Moire Pattern, carrying information about the deformation. Devices of the system were used for monitoring of the structural elements of the Temple of Divine Providence in Poland. An SHM system for bridge monitoring was presented in the study by Zaurin. 42 The system consists of a digital camera and a set of strain sensors. The vision part of the system is used for monitoring the traffic on the bridge by detecting, tracking, and classifying vehicles on the bridge. The contact sensors measure the strains and displacements of the construction’s elements. The registered data are correlated with images from the cameras. The SHM system detects abnormal states, such as exceeding of the strain thresholds.
In this article, the developed vision system and image processing methods dedicated to in-plane measurement of civil engineering structure displacement fields are presented. The developed vision system presented is characterized by many novel features with respect to the existing systems. First, it is dedicated to large-scale civil engineering structures, which have two basic modes of operations. It can be used as a manual measurement device, like the other commercially available systems, by a skilled user. On the contrary, it can be part of a fully automatic measurement system used for long-term monitoring of the structure. The method makes it possible to acquire the images of the construction from two distinct points in space, which makes the use of costly positioning devices unnecessary. Moreover, if the analyzed structure has a highly random texture, the method can be applied even without a special set of markers. The system can operate with inexpensive single-lens reflex (SLR) digital cameras, which reduces the cost of the system’s installation on the object even further.
This article presents the results of the preliminary experiment performed on an anti-flood embankment, the field test on a tram viaduct deflected under the weight of passing vehicles and also the comparison of the data acquired by the radar interferometer (RI), and the developed VB. The preliminary tests were performed to verify the mutual compatibility of methods in relation to the reference methods. As the key study, the tram viaduct under load conditions was investigated in order to verify the usefulness and the compatibility of the deflections determined by both systems. The obtained results were submitted to statistical assessment in order to evaluate the correlation and accuracy of methods. For the preliminary test, the SD of differences and the Pearson correlation coefficient were calculated. In the main experiment, the Bland–Altman test was employed.
Ground-based RI
The IBIS system was developed by the Italian company IDS in order to monitor the movements of land masses and engineering structures. The IBIS-S version is applied to measure the displacements of buildings, of which one dimension is significantly larger than others, that is, tall buildings, towers, or bridge structures.
The system is based on the Ku-band radar, which generates, transmits, and receives electromagnetic waves of 17.2 GHz central frequency. Basing on the signals reflected from elements of a tested structure, their displacements can be determined. The most important abilities of the system are the remote measurement of range up to 1000 m and sampling rate up to 200 Hz. 21 The direct access to the structure is not necessary, and many points may be observed simultaneously. The detailed description of the applied radar techniques can be found in the previous studies.15–22 The most important features, necessary to explain tests presented in this article, are summarized below.
The bandwidth used by the radar is B = 200 MHz (from 17.1 to 17.3 GHz). In special cases, it can be expanded to 300 MHz. This allows the maximum range resolution ΔR = 0.5 m to be obtained. The concept of range resolution shall be understood as the minimum separation between two points on the structure at which they may be observed as different points. This means the ability to observe points on the structure separated by not less than 50 cm along the radial direction, that is, direction of wave propagation (Figure 1). If the distance between reflecting points is smaller than ΔR, they are treated as one point. The single interval of ΔR is called a range bin. Selection of range bins for further analysis is carried out based on the range profile. This is a graph that shows the echo intensity, expressed in decibel as the signal-to-noise ratio (SNR), in relation to the distance to the observed point.
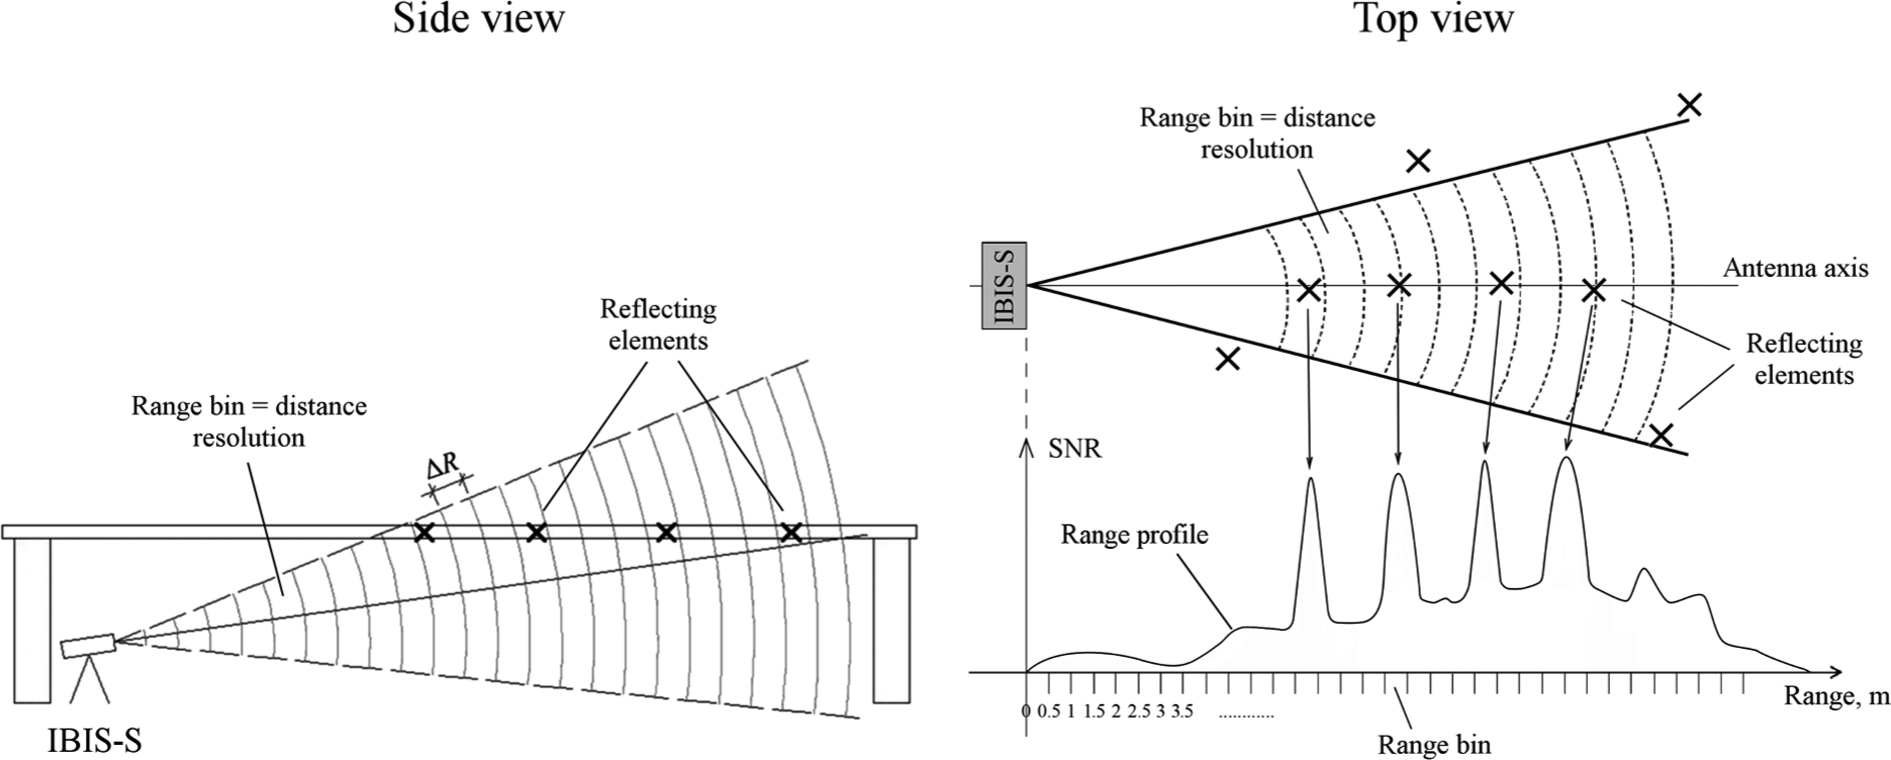
Ability of observing many points (range bins) on the tested structure according to the radar range resolution.
Two radar techniques are implemented in the IBIS-S system: microwave interferometry and stepped-frequency continuous wave (SFCW) modulation. The first one allows high accuracy of displacement measurement to be obtained. Displacement of the observed point in the direction of wave propagation causes the phase difference between signals received by the radar at different times. The value of radial displacement dR can be written as

where λ is the wavelength and Δϕ is the phase difference.
An important fact is that the IBIS-S is a one-dimensional (1D) system. The high accuracy of the displacement measurement is related to the radial direction (radar–object). If the movement occurs in the other direction, an assumption is required to calculate the real displacement value. For example, to calculate the dV value from the dR measured, the H and D distances have to be known, for example, using surveying methods, and only the vertical movement of the observed point must be assumed. To calculate the dV value, dR must be multiplied by the projection factor p, which is p = D/H (Figure 2).
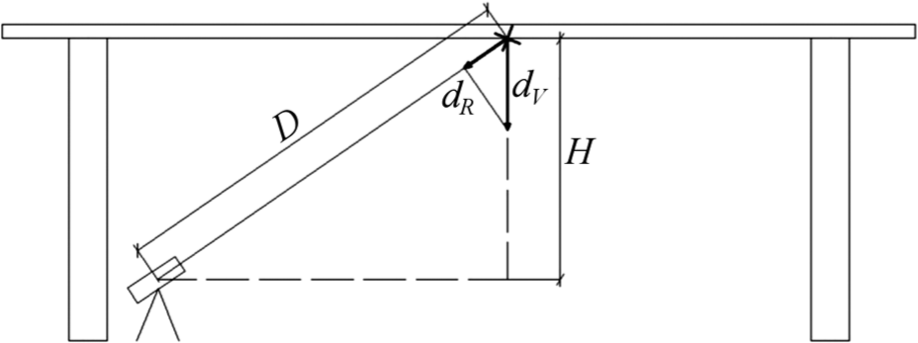
Relation between radial and vertical displacements.
It should be noted that the accuracy of displacement measurement refers to the radial (line-of-sight) direction. The conversion causes a decrease in the accuracy of the determined real displacements. This is particularly unfavorable for low, but long-span bridges, for which often p > 4. 43 The most preferred ratio p = 1, obtained by the accordance of dV and dR vectors, is difficult to achieve in the field, especially for bridges above rivers, and practically eliminates the possibility of observing a lot of points at the same time.
The second technique is SFCW modulation, which allows the measurement of many points on the structure at the same time. The radar wave, reaching the observed structure, is scattered on the construction elements. Subsequently reflected signals are subjected to the appropriate processing to obtain the displacement values. In order to increase the reflectivity of a structure or to point at selected places, it is possible to use microwave reflectors installed on the structure. This requires, however, direct access to the structure and may be difficult in practice, especially for high tower structures.
The IBIS radar transmits signals in the form of short pulses. The relation between pulse duration τ and the used microwave bandwidth B can be written as τ·B = 1. According to equation (2), shorter pulse duration τ means the higher range resolution ΔR can be obtained:

where c is the speed of light.
Improving the range resolution ΔR value is reached by reducing the value of τ or increasing the value of B. SFCW radars, instead of using short pulses, achieve the wide bandwidth through the stepped, linear increase of discrete frequency Δf values. Bandwidth can be expressed as

where N is the number of discrete frequency values within the bandwidth B (Figure 3).
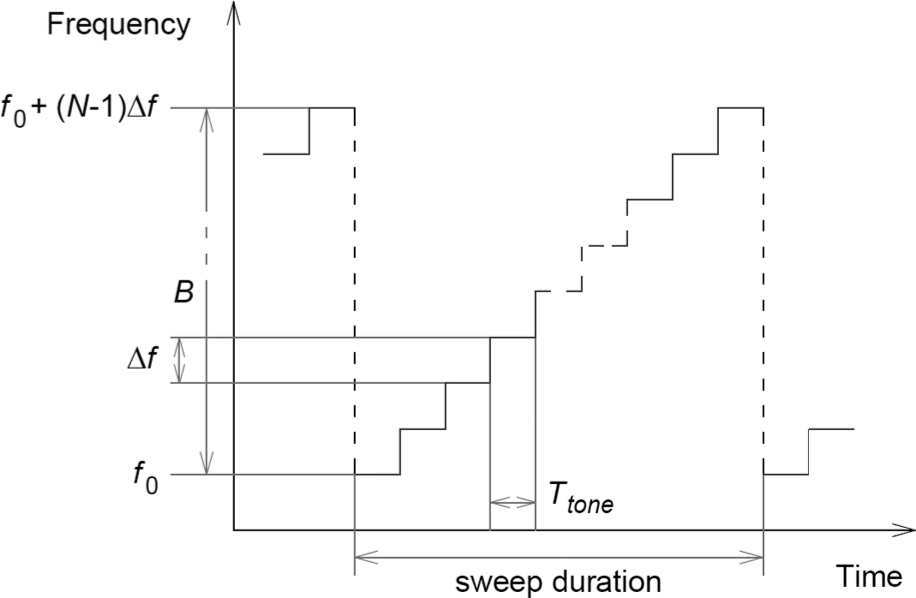
Relation between frequency and time in SFCW modulation.
Excluding the impact of changing weather conditions and the effect of signal multipath, the radial displacement measurement accuracy is 0.1 mm in typical conditions. 19 However, the low SNR value, occurring for structures that weakly reflect the radar wave, decreases the accuracy of displacement determination. 20
Vision-based in-plane deflection measurement method
The developed vision-based method of the in-plane deflection measurement consists of the following steps: system calibration, image acquisition, and deflection measurement using the digital image correlation coefficient (Figure 4). Additionally, perspective distortion removal can be carried out if the images of the structure are captured from different points in space. The system is calibrated by calculation of the scale coefficient αmm/pix from an object with known geometric dimensions. The scale coefficient gives information about the length corresponding to one pixel on the image. In the next step, the reference image and one or more images of the construction under the load are acquired. If the photographs are taken from distinct points in space, the homography transformation
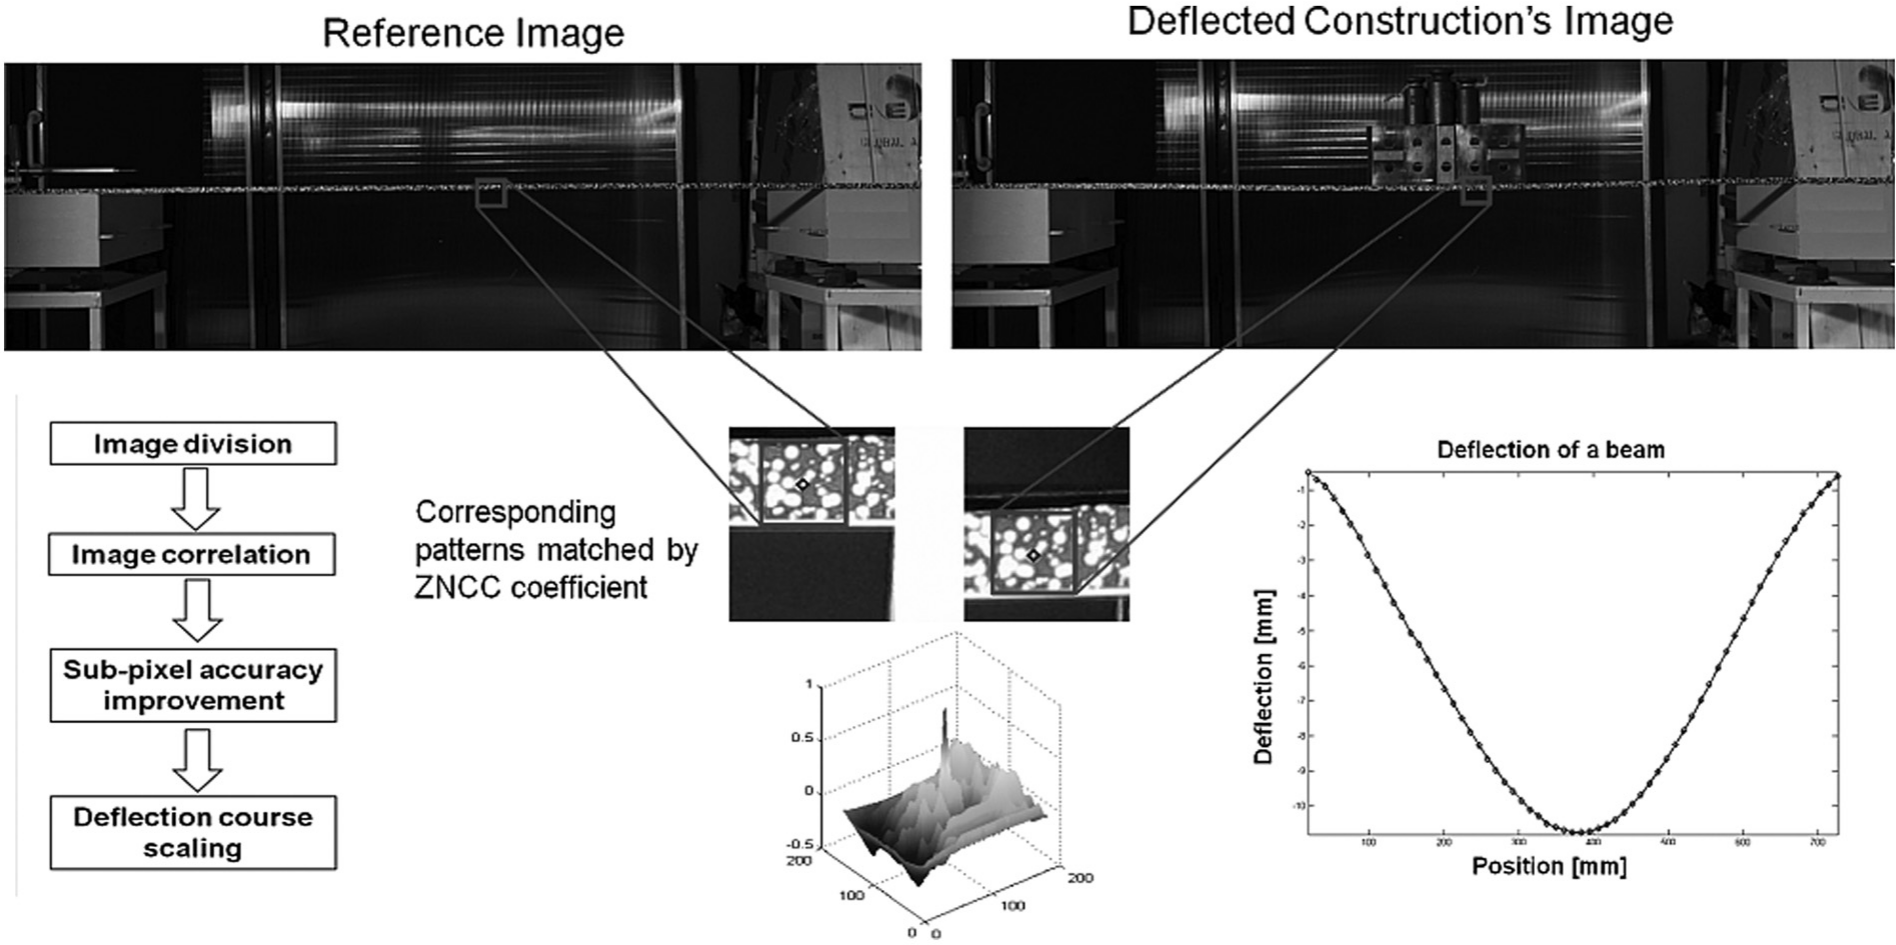
Digital image correlation applied to the deflection measurement. The displacement of the intensity pattern is found by ZNCC coefficient. The method applied to all span of the beam results in the deflection curve.
The procedure of camera calibration is carried to obtain intrinsic calibration matrix
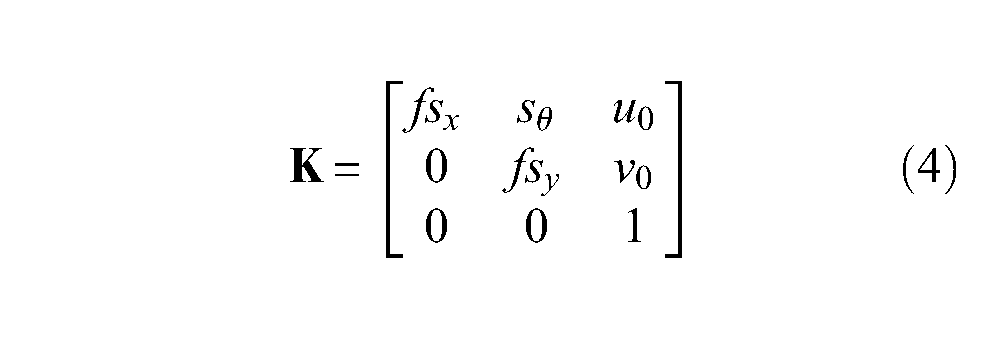
where f is the focal length of the lens; u0, v0 are coordinates of the principal point; sx, sy are the size of the pixel along horizontal and vertical directions, respectively; and sθ is a skew coefficient of the pixels. The chessboard planar pattern with black and white squares, even number of rows and odd number of columns, is used. The set of radial and tangential lens distortion coefficients is also calculated by means of internal calibration. It is assumed that distortions exhibited by lens can be modeled by fourth degree polynomial given by the following equation (5)
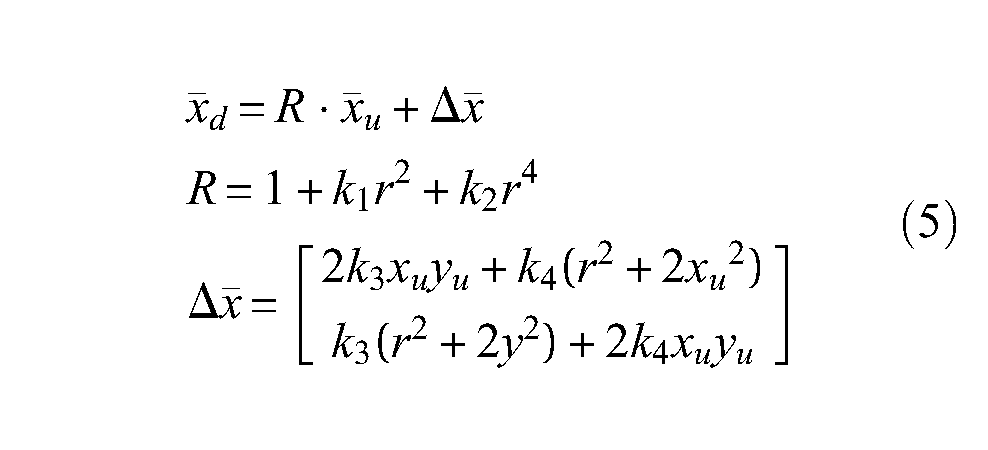
where
After computation of distortion coefficients, lens distortions can be removed from the image of the construction. It must be done in order to reduce the measurement error of the vision-based method.
The scale coefficient αmm/pix is computed from an object on the scene with known geometric dimensions. The value of αmm/pix can be obtained from planar circular or rectangular marker or from the certified length standard. The scale calibration introduces Hough transform50,51 for circle detection and high-accuracy ellipse fitting technique.
In general, the digital image correlation method consists of the following three steps: object preparation, acquisition of the object’s image before and after loading, and processing the acquired images to obtain the displacement field. The speckle pattern on the structure’s surface can be a natural texture or an artificially made special random intensity pattern attached to the structure or painted on it. The object’s surface must be planar flat, and the out-of-plane motion of the object during loading should be negligible. The basic principle of digital image correlation is matching of the same image path between the two images acquired before and after deformation.52–57 In order to compute the displacement of a construction’s point, a square or rectangular reference subset of pixels centered at a point is chosen from the reference image and used to match its corresponding location in the deformed image. Assuming that deformations of the object are small, only the local search is performed. The matching is carried out by searching for the peak position of the correlation coefficient function over the search window. In the developed method, the zero-mean normalized cross correlation (ZNCC) has been chosen as a correlation criterion. This coefficient is more robust and is not sensitive to changes in the scene’s illumination. The ZNCC coefficient is given by equation (6).58,59
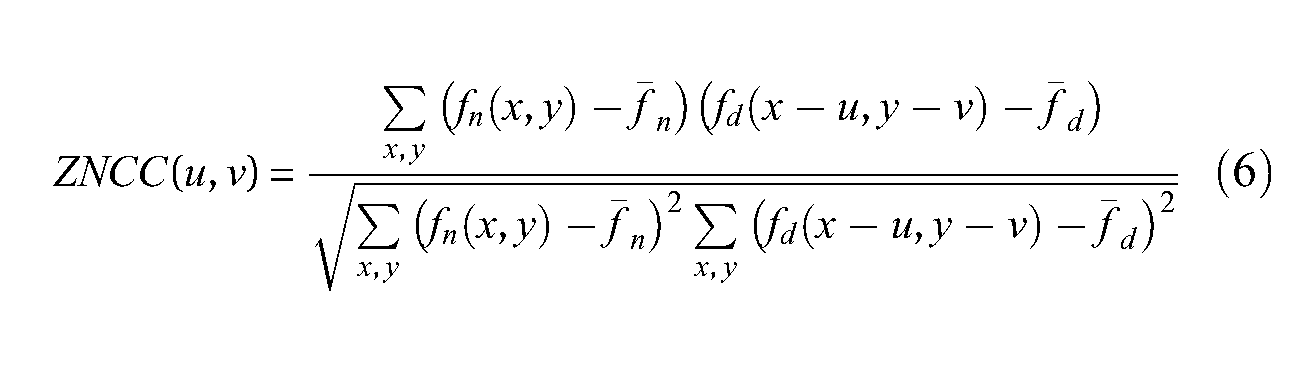
where fn(x, y) is an intensity value for a pixel with coordinates (x, y) on the reference image;
In the process of deflection measurement, the reference image of the part of interest of the unloaded construction is divided into set of rectangular intensity patterns, whose centers are taken as measurement points (Figures 4 and 5). Each of the pattern is matched with a corresponding pixel subset on the image of the loaded structure by means of the ZNCC coefficient. The displacement vector for each of the measurement point is computed as difference between calculated positions of the pattern on two images. The method performed on all points of interest gives a complete displacement field of the analyzed object.
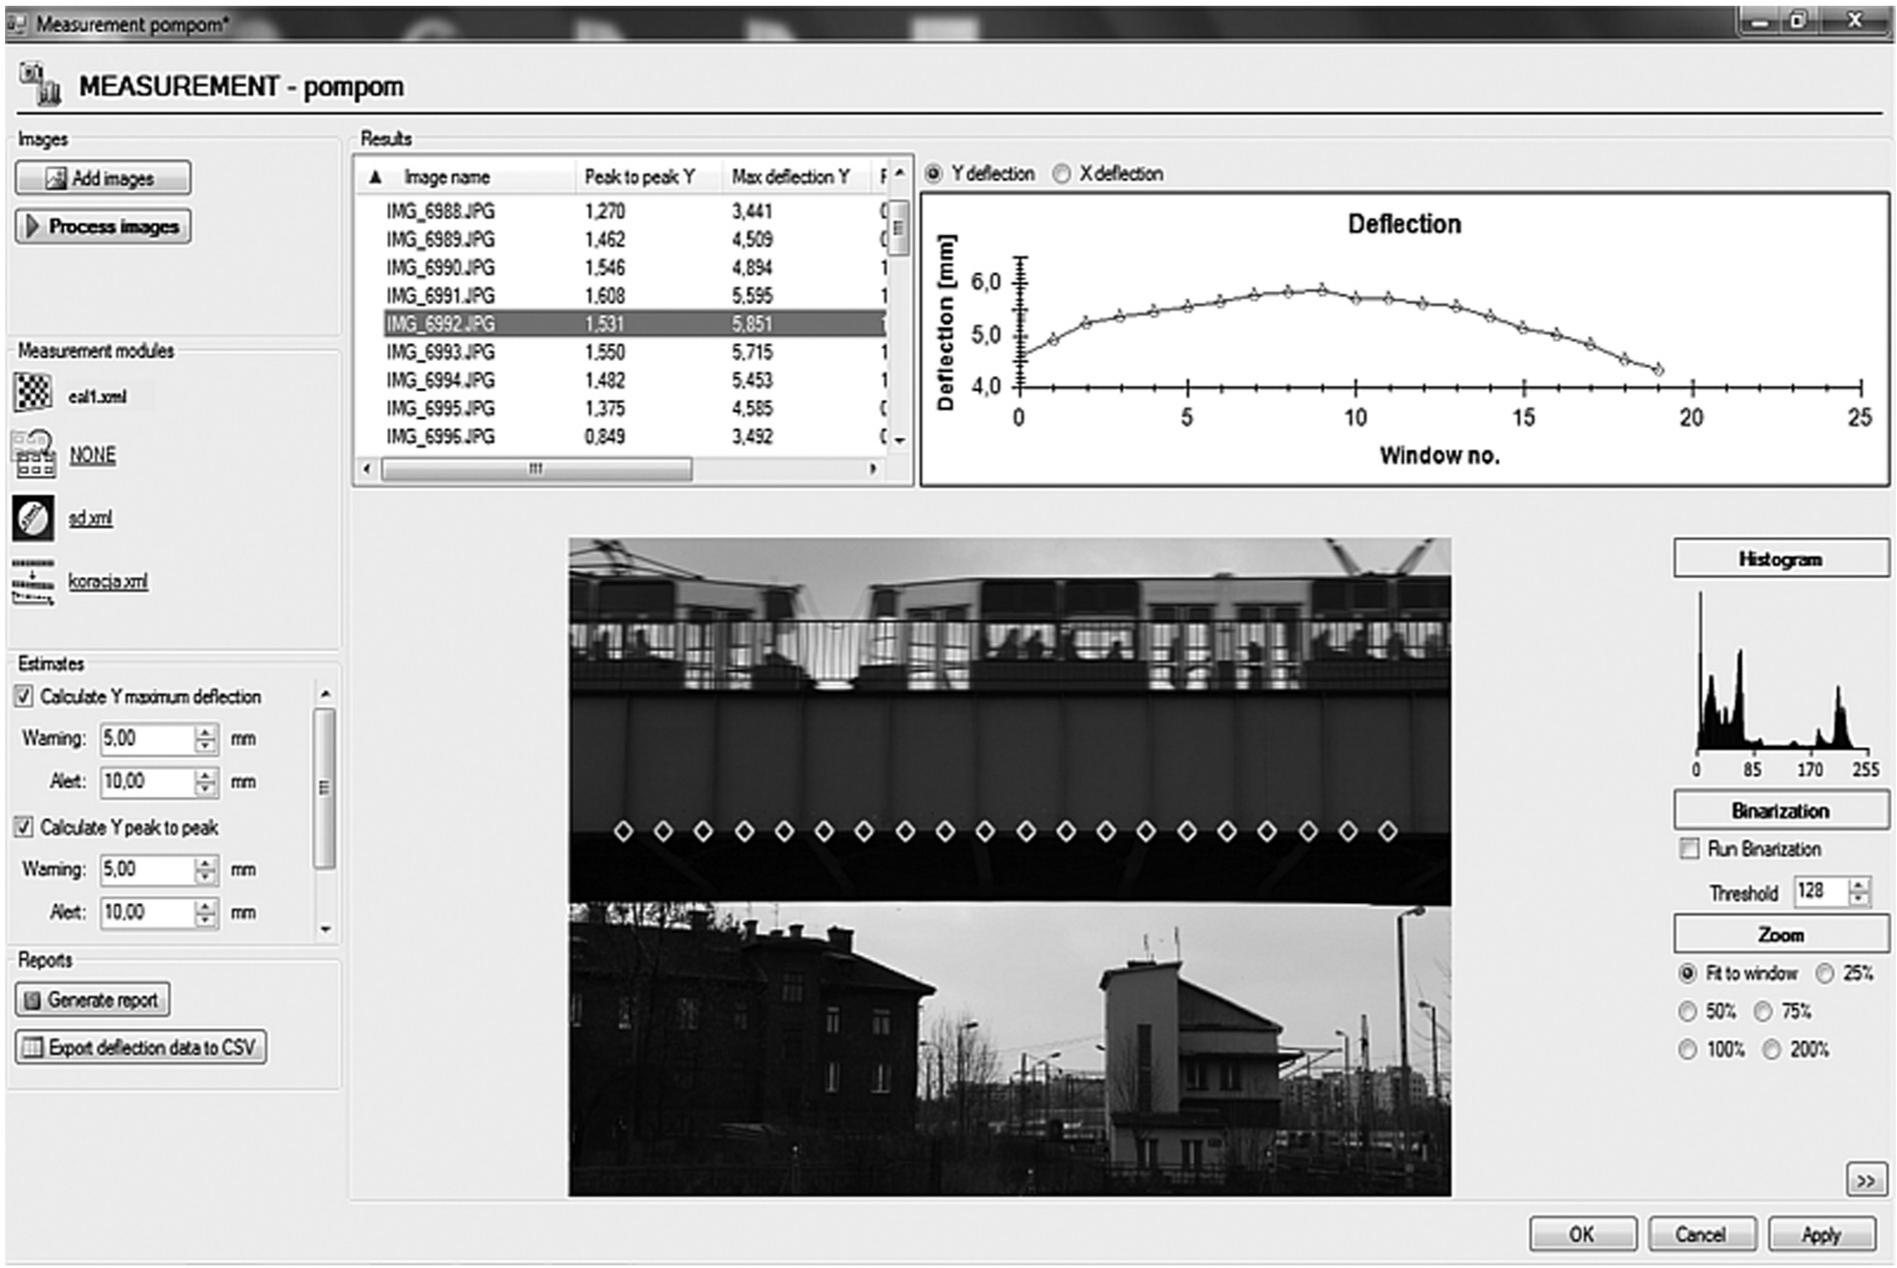
The developed software for vision-based measurement of construction’s deflections.
Correlation coefficient computes the position of the pixel on discrete pixel grid on the image. When the subpixel methods are introduced, one can interpolate position of the pixel to floating point value, which increases measurement accuracy up to 0.01–0.1 parts of pixel. Developed algorithm takes integer value of pixel’s position given by correlation coefficient and fits a second-degree polynomial into the four-element neighborhood of the pixel. The new subpixel location of the correlation coefficient maximum is the point for which the fitted parabola has its maximum value. An overview of the mentioned deflection measurement is presented in Figure 4.
Software for the construction’s deflection measurement
The developed software enables construction deflection measurement using digital SLR cameras for remote image acquisition and provides image processing algorithms to calculate the displacement field (Figure 5). The software implementation has been developed in the C++/C# programing environment. ED-SDK libraries provided by Canon have been used to control one or more cameras in the system. Two modes of operation are available: online and off-line. In the first case, the user specifies the date and number of measurements and then the system works fully automatically carrying out the image acquisition and deflection measurement. The off-line mode provides analysis of the images stored on hard disk. There are two methods of deflection calculation implemented in the software: in the first one, the user can specify points in which the measurement will be carried out. The displacement field is computed in these sets of points only. However, one can use the dense measurement method in which one specifies N—the number of points between the selected ones. The program automatically divides the structure between the user specified points into N equally spaced measurement locations. The result browser module carries out the visualization of calculated curves of deflection and report generation in popular formats, such as PDF, XML, CSV, and TXT. An additional feature of the software is detection of exceeding the allowed level of a deflection and the sending of alerts to a client by an e-mail.
Preliminary tests
Determination of the reference method in the laboratory
Before conducting measurement of the real structure deformation, it was decided to perform a preliminary test. This was carried out in order to measure the user-defined displacements of selected points of the investigated structure and to control them using different devices. For this purpose, a heavy photographic tripod with adjustable head height was used. A special platform was attached to the upper surface of the tripod head. This was the base for fixing the microwave reflector and a plate covered with the pattern used for digital image analysis during measurements. The aim of this experiment was not only the comparison of the presented methods but also the determination of their actual accuracy in relation to the precise devices. Therefore, the vertical movement of the tripod head was controlled using the Helios DIGI-MET electronic dial indicator (DI), which ensures the measurement range of 50 mm and the SD of 0.01 mm (and the maximum permissible error of 0.02 mm). In order to perform an additional control of displacement and stability of the whole construction, a Carl Zeiss Jena Ni002 precise analog surveying level was used together with the glass surveying staff (usually used in industrial surveying), which was attached to the moving platform. Its SD equals ±0.2 mm/km of double-run leveling. This gives ±0.09 mm error for the performed displacements (Figure 6).
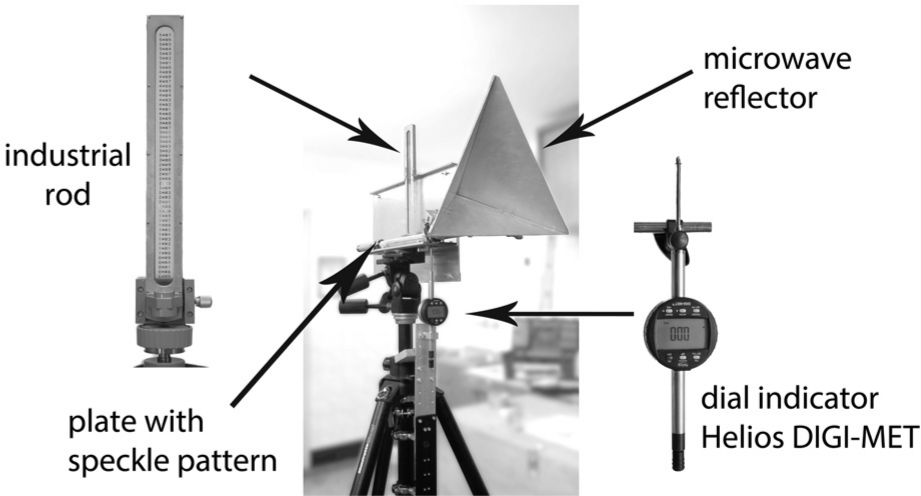
A moving platform constructed for the preliminary test.
In the case of such precise measurements, the geometric conditions of the created measurement system are important. The Leica TCR407 total station was used to control whether the attached platform was perpendicular to the tripod vertical axis. Moreover, the condition to set the DI axis in parallel to the performed displacements was achieved.
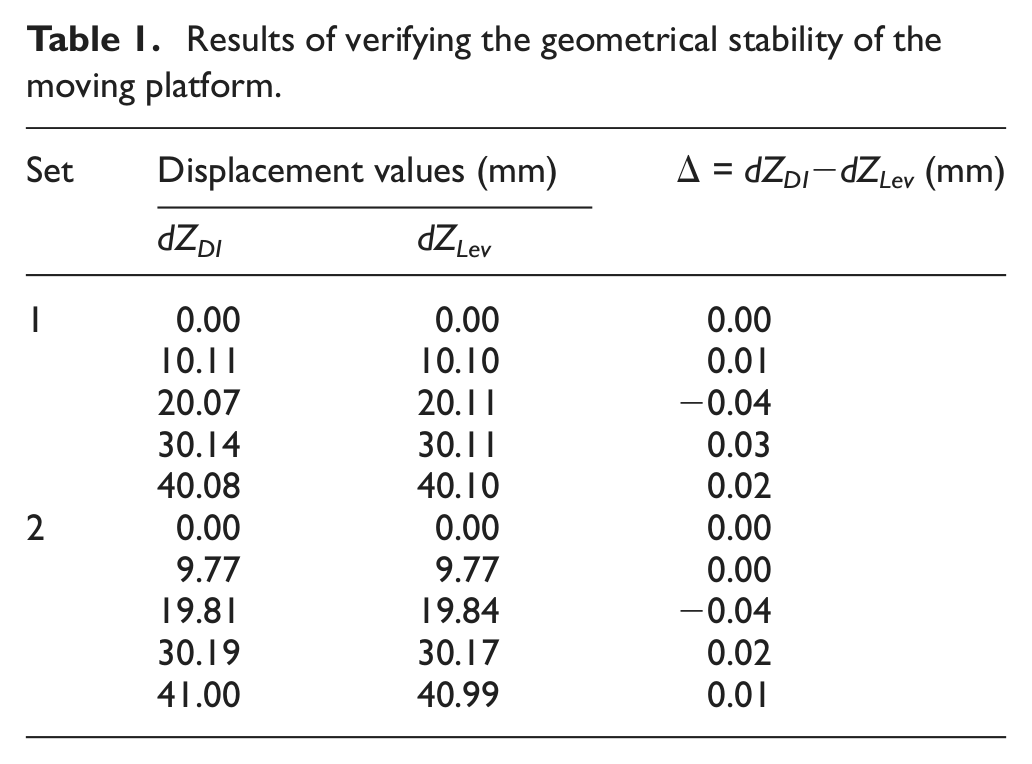
In order to verify the correctness of the displacement sensor attachment and the mutual compatibility of the two reference instruments, an independent test was carried out in the laboratory. The tripod head, together with the glass staff (and microwave reflector—to simulate real conditions), was moved vertically over a distance of 40 mm (not more than the DI range) with increments of 10 mm. The displacement values were recorded with the DIGI-MET DI and the Ni002 level. The level values are marked by the Lev symbol and the DI values by the DI symbol, and dZ means the vertical displacement.
This measuring procedure was performed twice. The results are presented in Table 1.
Results of verifying the geometrical stability of the moving platform.
In order to evaluate the agreement of both methods, the SD of differences between the recorded displacements was calculated, using the method of observation pairs:
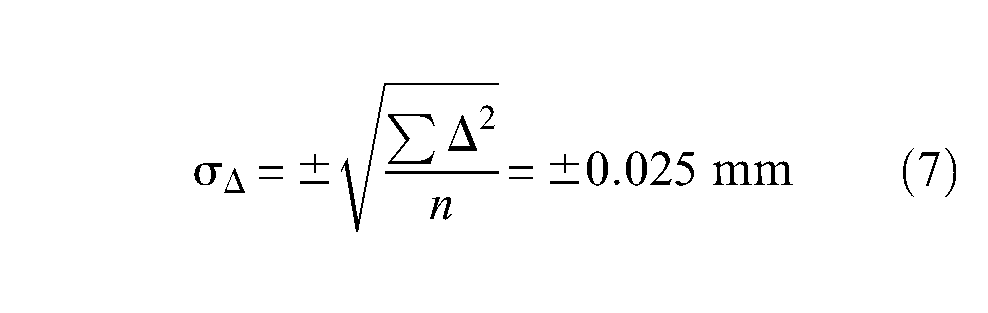
where n is the number of measured displacements.
The Pearson product-moment correlation coefficient r was also determined:
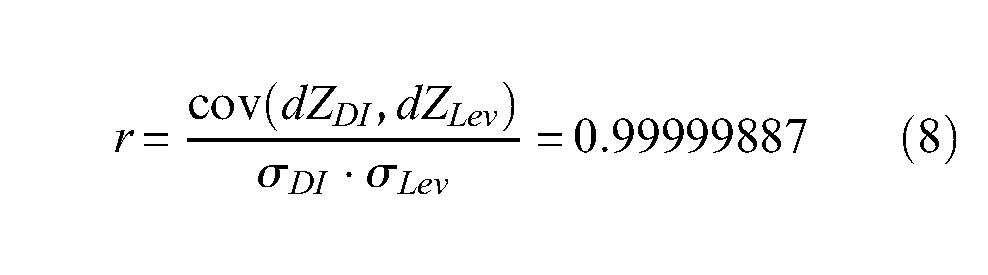
where cov(dZDI, dZLev) is the covariance movements from both measurement methods and σ(dZ) is the SD of measured displacement.
The obtained results fully confirm the high compatibility of the two instruments and their use in checking the accuracy of displacements determined by the radar or VB.
Simulation of measurement
The geometry of test required to simulate the creation of the typical conditions that occur when measuring the deflection of a bridge structure span (Figure 7, shown from a side view, and Figure 8). Therefore, the main part of the preliminary test was performed on an anti-flood embankment. The construction simulating displacements of the real structure was set at the top of the embankment, while the RI was located beneath. The horizontal distance between the radar and the microwave reflector was 9.92 m (d2 in Figure 8) and the height difference was 4.26 m. For this setup, the projection factor p equaled 2.5365. This was the initial value. For every position of the moving platform, the actual value of p was calculated.
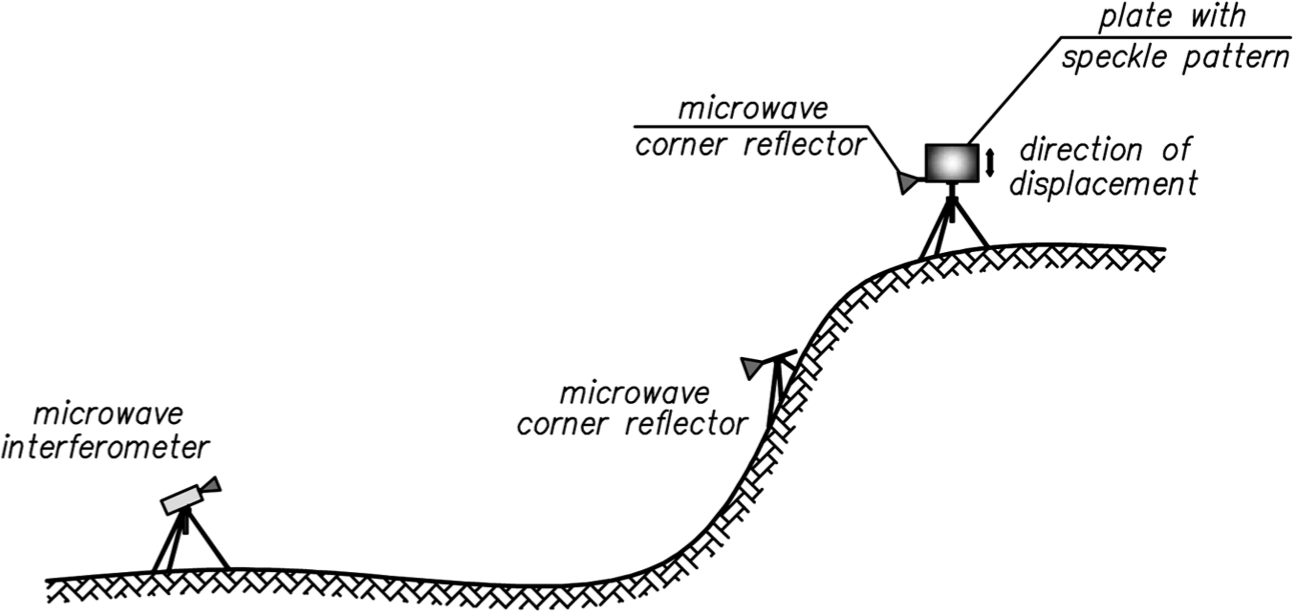
Field test equipment arrangement (side view).
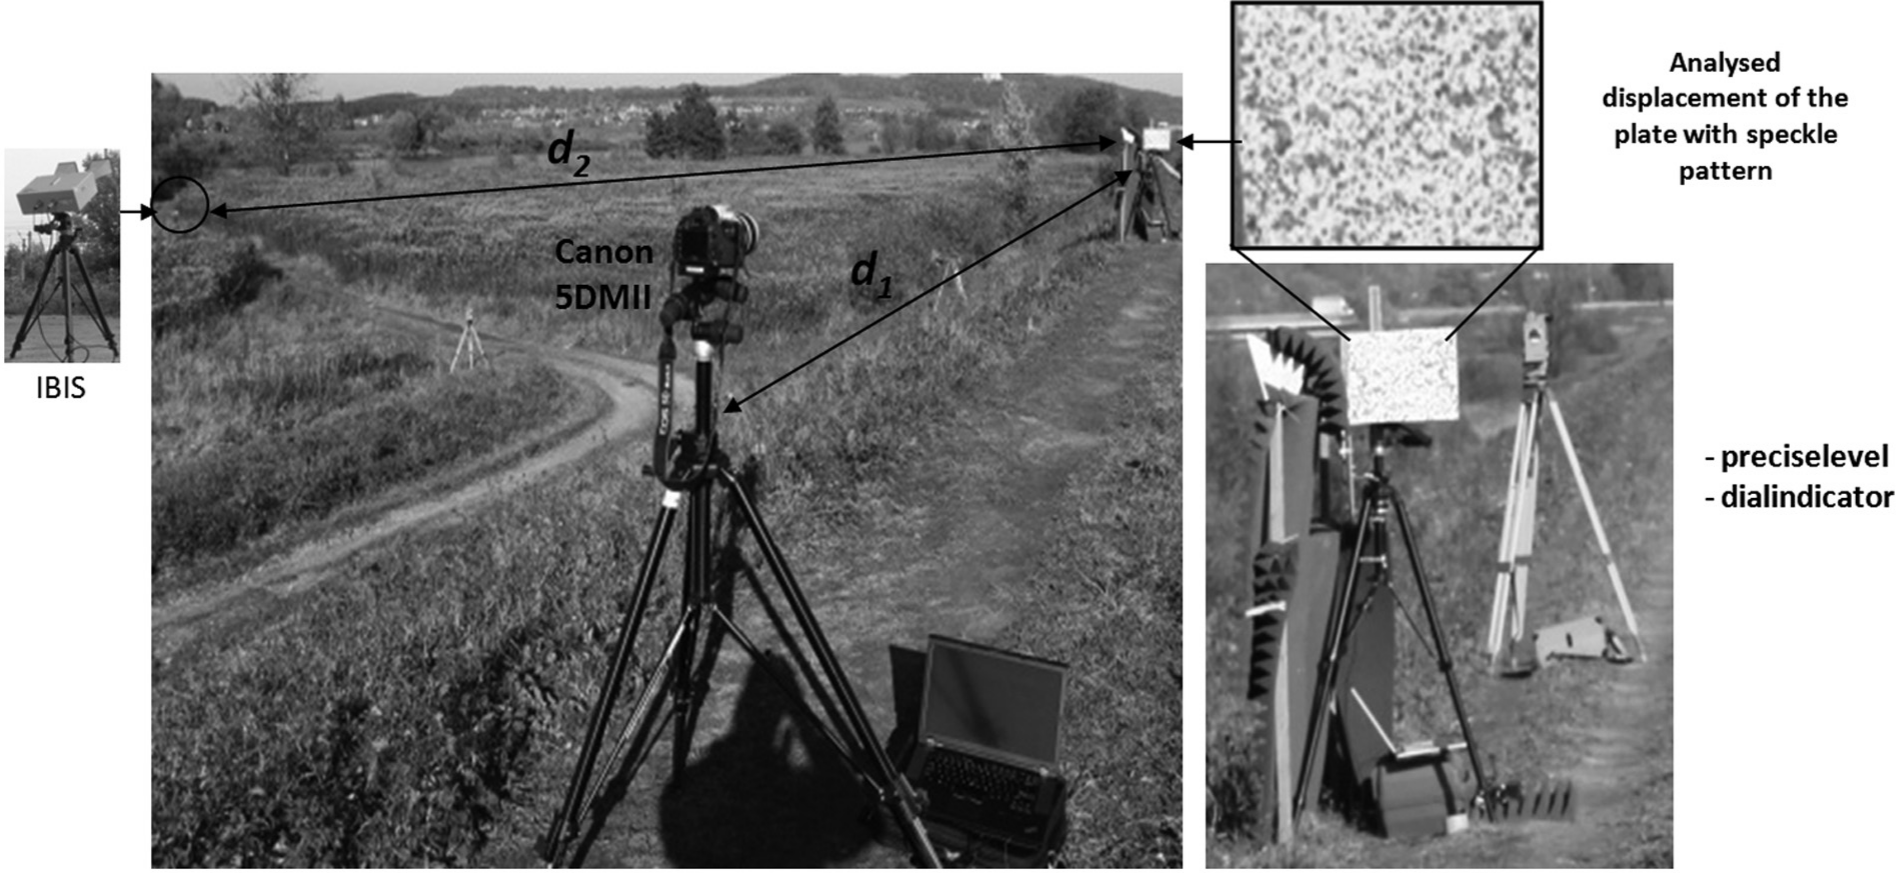
Field test equipment arrangement.
During the field tests, a flat aluminum plate of the dimensions 0.42 m × 0.30 m was fixed to the moving platform. The random intensity pattern was placed on the measured plane of the plate. Photographs of the object were acquired by a system of a Canon 5D Mark II digital camera with 21.1 Mpixel image resolution and a Canon 24–70 mm f/2.8 L lens with focal length f≈ 70 mm adjusted. The position of the camera was fixed in space. The camera had its optical axis at the height of the displaced plate and perpendicular to it in order to ensure the uniform imaging scale. The distance between the camera and the plate was 15.4 m (d1 in Figure 8). Regarding scene illumination, there were natural lighting conditions with sunlight and cloudy variations, so there was no need for artificial lighting.
For the purposes of an independent verification of both measurement systems (radar and vision based), an electronic DI and precise Ni002 level were used. The mutual agreement of the precise NI002 level and the DIGI-MET DI had been previously confirmed. A schematic layout of all elements of the measurement system is shown in Figure 8.
In the case of the vision system, the scale coefficient was computed from an object on the scene with known geometric dimensions. 44 The value of 1.53 mm/pix was obtained from an image of the certified surveying staff using a WizScale module of the developed software.
As in the case of laboratory tests, in this experiment, the displacements were generated at the range of 45 mm (four movements of 10 mm and the last movement of 5 mm). The measurement was performed in two steps. The first three runs of the moving platform were performed in the following directions: downward, upward, and downward. Displacements were observed by three devices: precise level (Lev), DI, and RI (Table 2, tests no. 1–3). In the second step, two runs were performed (downward and upward). Displacements were measured additionally by the VB (Table 2, tests no. 4 and 5). In total, five runs of five displacements were carried out.
Vertical displacements of the moving platform recorded by the systems.
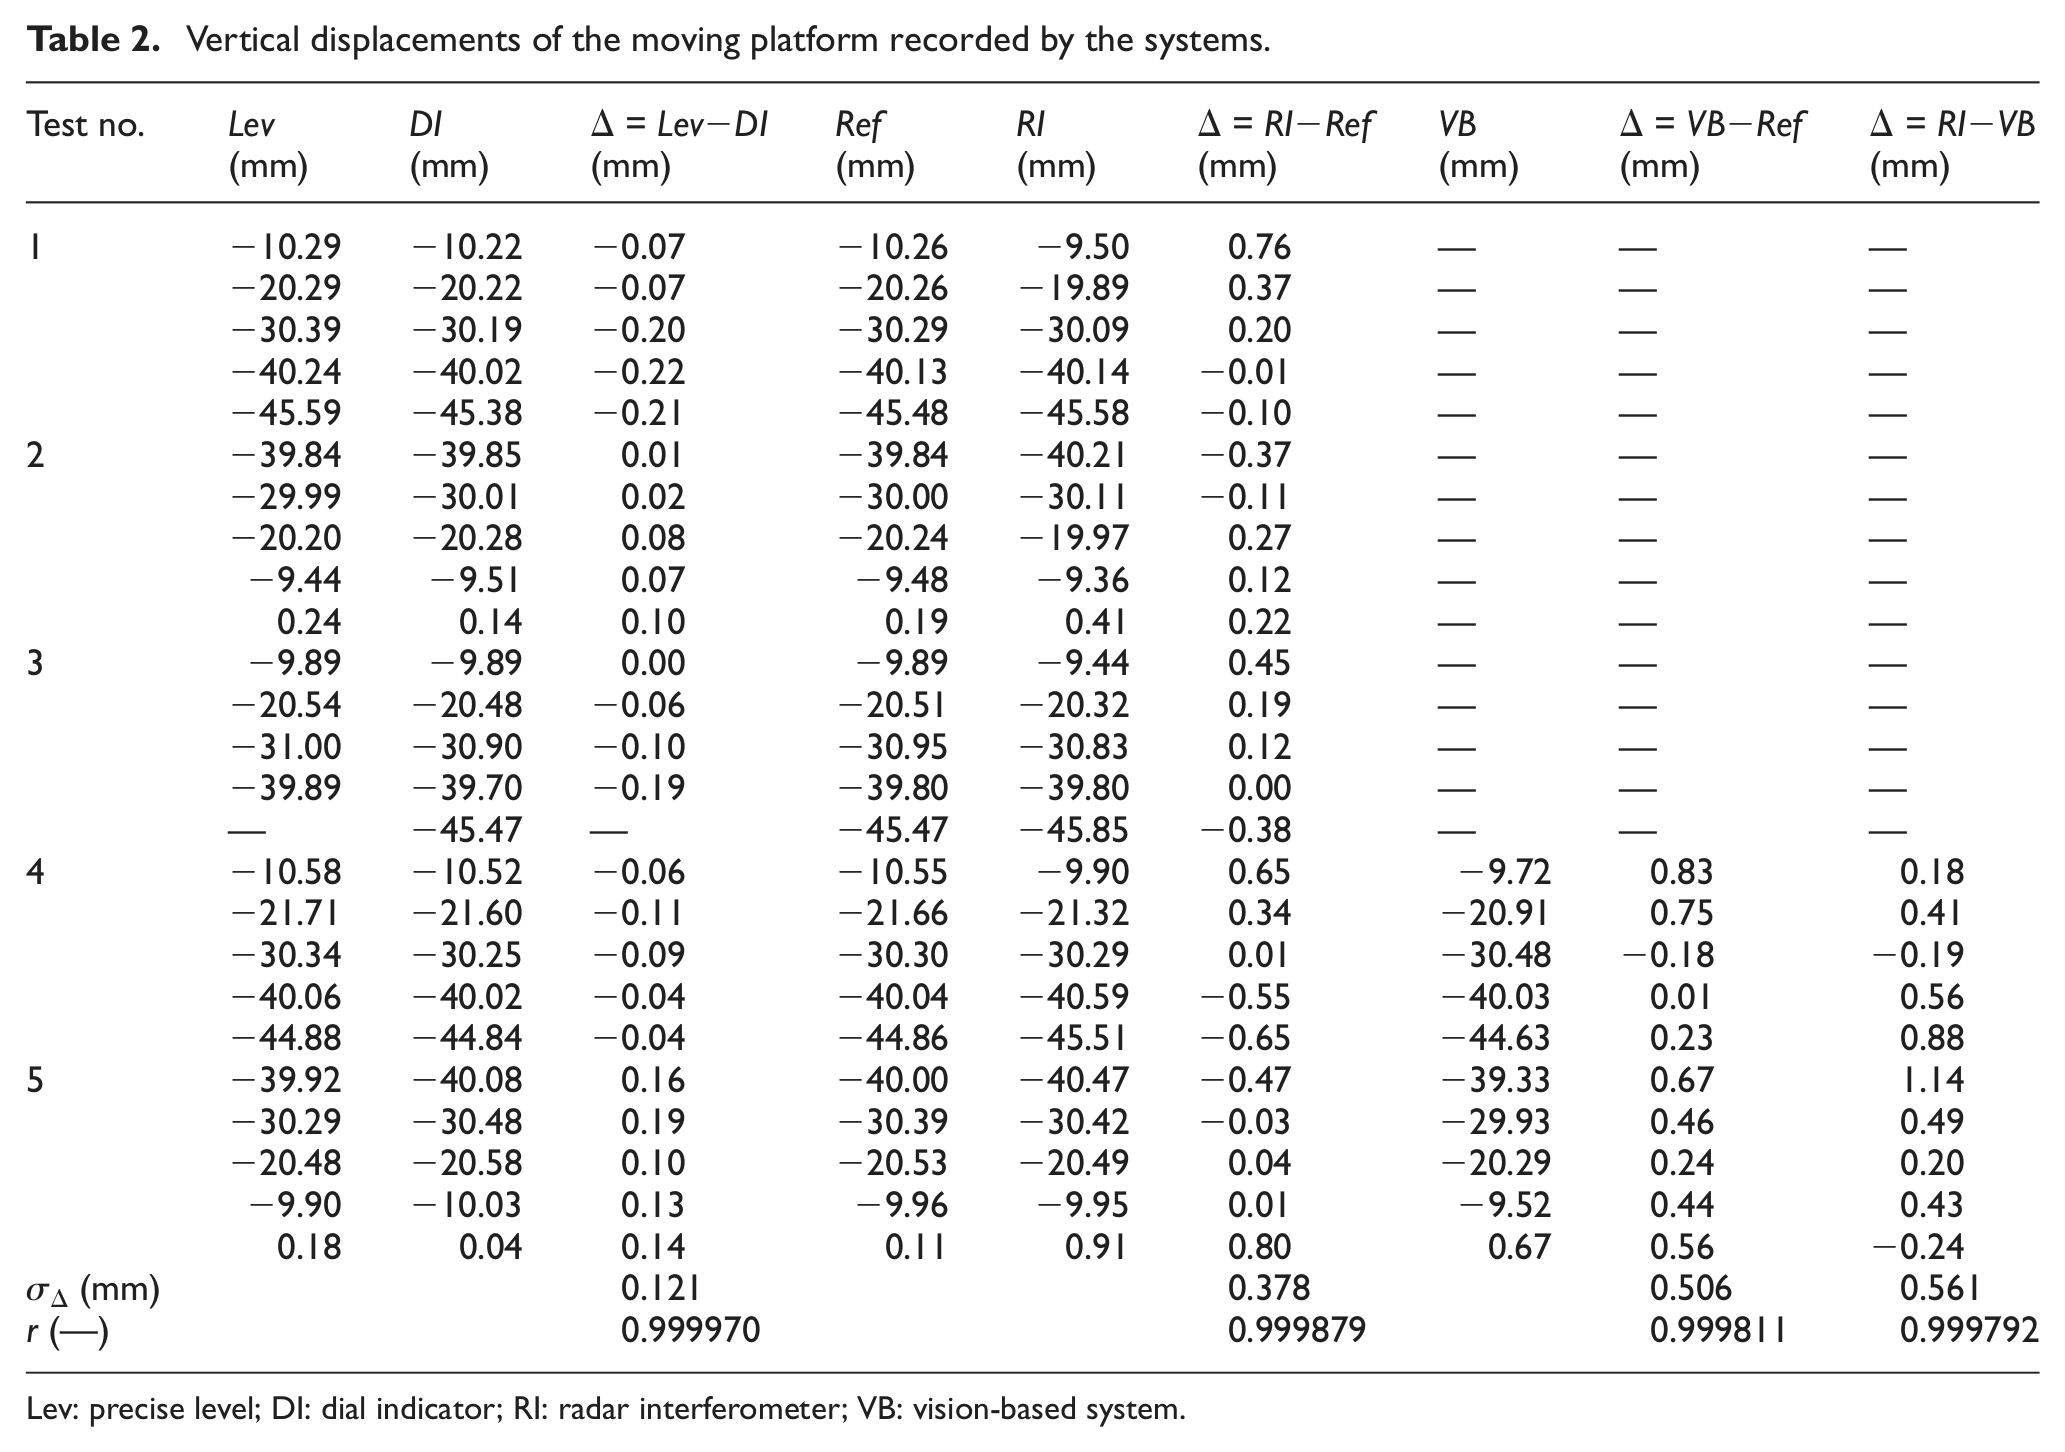
Lev: precise level; DI: dial indicator; RI: radar interferometer; VB: vision-based system.
The values of displacements recorded by the Lev, DI, RI, and VB systems are presented in Table 2. Due to the high agreement of Lev and DI results, their averages were assumed as the reference displacement values: Ref = (Lev+DI)/2. Moreover, the differences Δ between displacements obtained by different methods were calculated in Table 2. Four groups of differences were determined:
Level versus DI (both assumed later as the reference);
RI in relation to the reference;
VB in relation to the reference;
RI in relation to the VB.
The SDs σΔ of four groups of differences were also calculated according to equation (7). They are presented in the last row of Table 2.
All determined correlation coefficients indicate good agreement of measurement results (more than 99.96%). Their values indicate the highest compatibility of results obtained by the Lev and the DI. This confirms the correct selection of these devices as reference sensors. The r coefficients in the last row of Table 2 (in columns 7, 9, 10) show lower compatibility of the VB and RI systems.
Key study—tram viaduct
Field test
In order to perform the final verification of both noncontact measurement techniques, an experiment was performed on a real engineering structure. The test involved monitoring of a 28-m-long steel span (Figure 9), which is part of a tram viaduct. The observed deflections were forced by trams of various mass, periodically passing in the south–north direction. The span deflections were measured with two devices: an IBIS-S RI and a VB (in the following tables marked as RI and VB, respectively). Span displacement measurements were performed from two radar positions relative to the structure and a constant camera position.
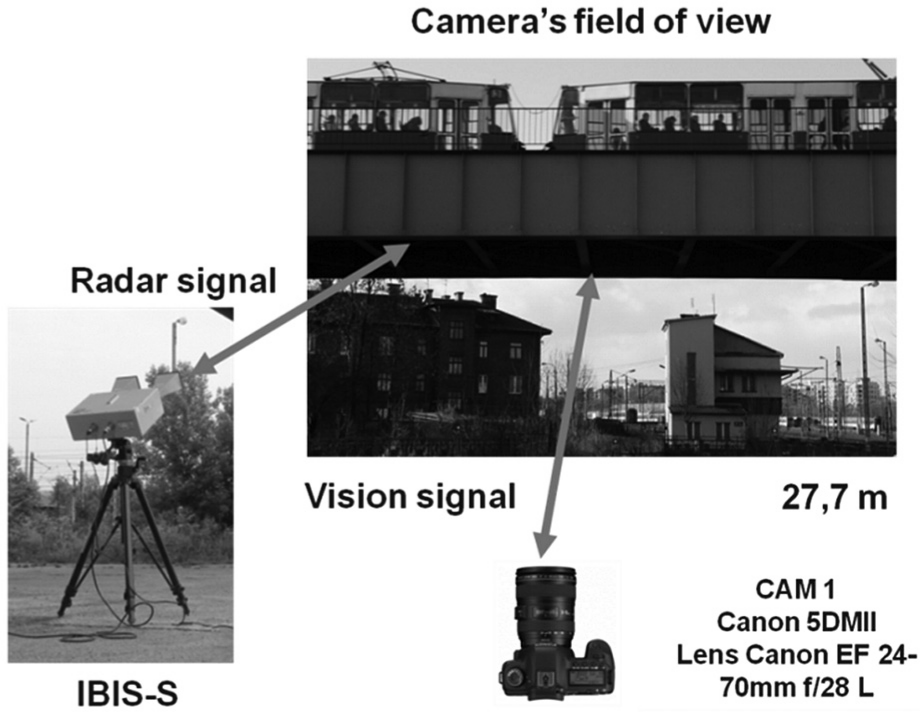
The measurement setup consisting of a digital SLR camera and IBIS-S radar interferometer.
The main part of the VB is a Canon EOS 5D Mark II SLR full-frame digital camera. The camera was equipped with a Canon EF 24–70 mm f/2.8 L lens set to work with approximately 50 mm of focal length. The lens was focused at infinity, and the shutter speed was set to 1/100 s at f = 18 aperture. The high value of aperture was set intentionally to obtain a large depth of field, bearing in mind that the shutter speed was high enough to get blur-free images. The camera was situated at the distance of 27.77 m from the side plane of the span to set the projection of the lens center in the midspan of the bridge. In order to obtain a uniform scale in the entire field of view (covering 14.5 m of the span), the lens axis was aimed at a perpendicular direction to the span axis. The shutter was triggered 3.9 times per second to record the full tram passing with the image series.
In addition, the continuous deflection measurement was performed using the IBIS-S radar. 11 In order to record the bridge span deflections with this device, the radar unit was located in the vicinity of the line of pillars. During the first five recorded runs (runs no. 11–15, Table 3) the radar was placed in the bridge girder plane, while during the next three runs (runs no. 21–23, Table 4), it was set directly under the track-way axis.
Deflections of 10 points (for the first radar position) measured by the RI and VB systems and differences between results.
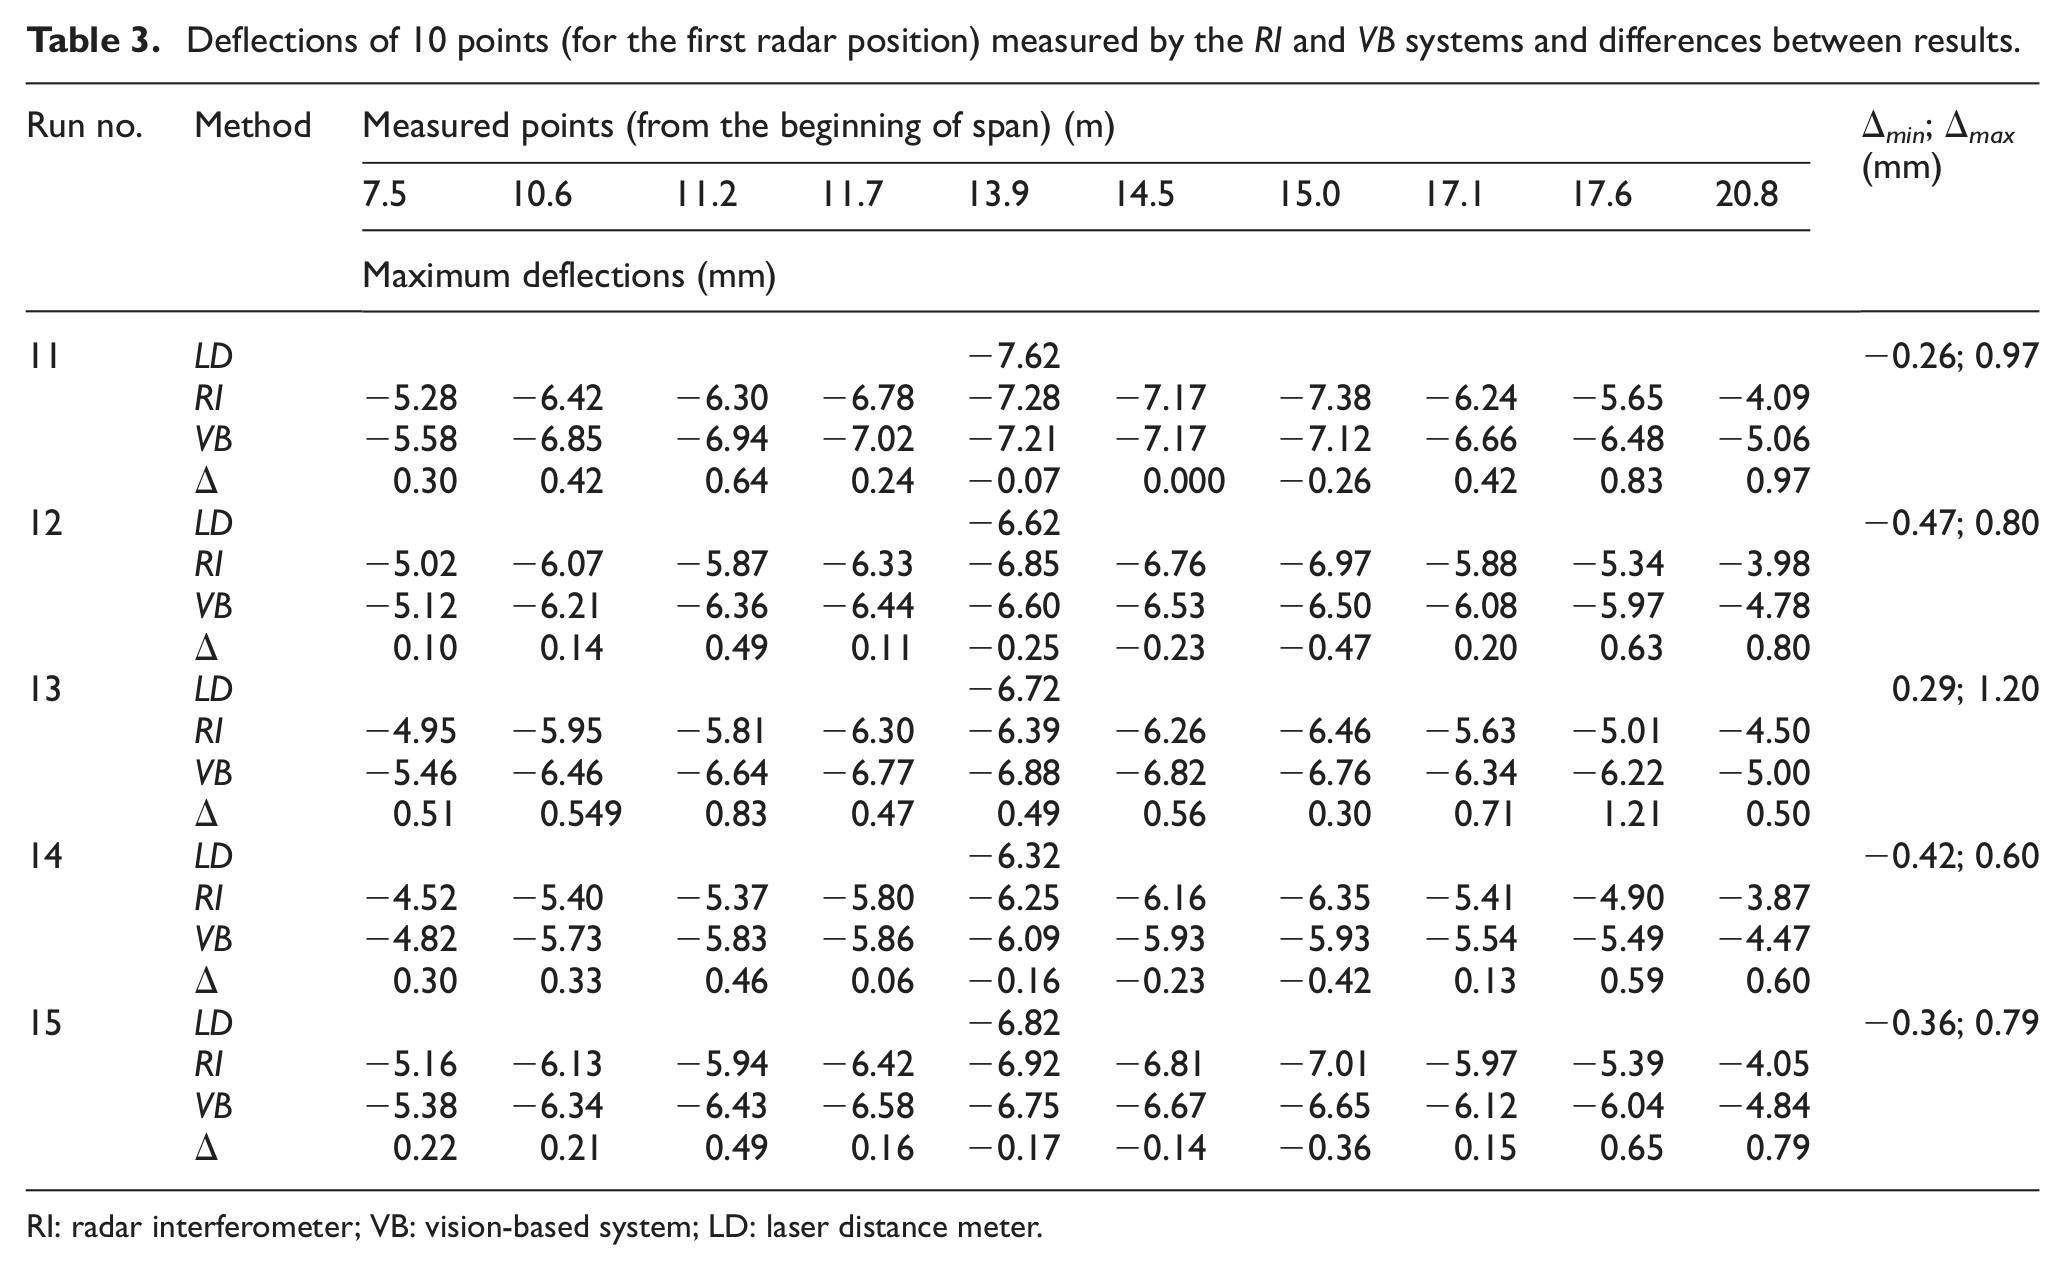
RI: radar interferometer; VB: vision-based system; LD: laser distance meter.
Deflections of 14 points (for the second radar position) measured by the RI and VB systems and differences between results.
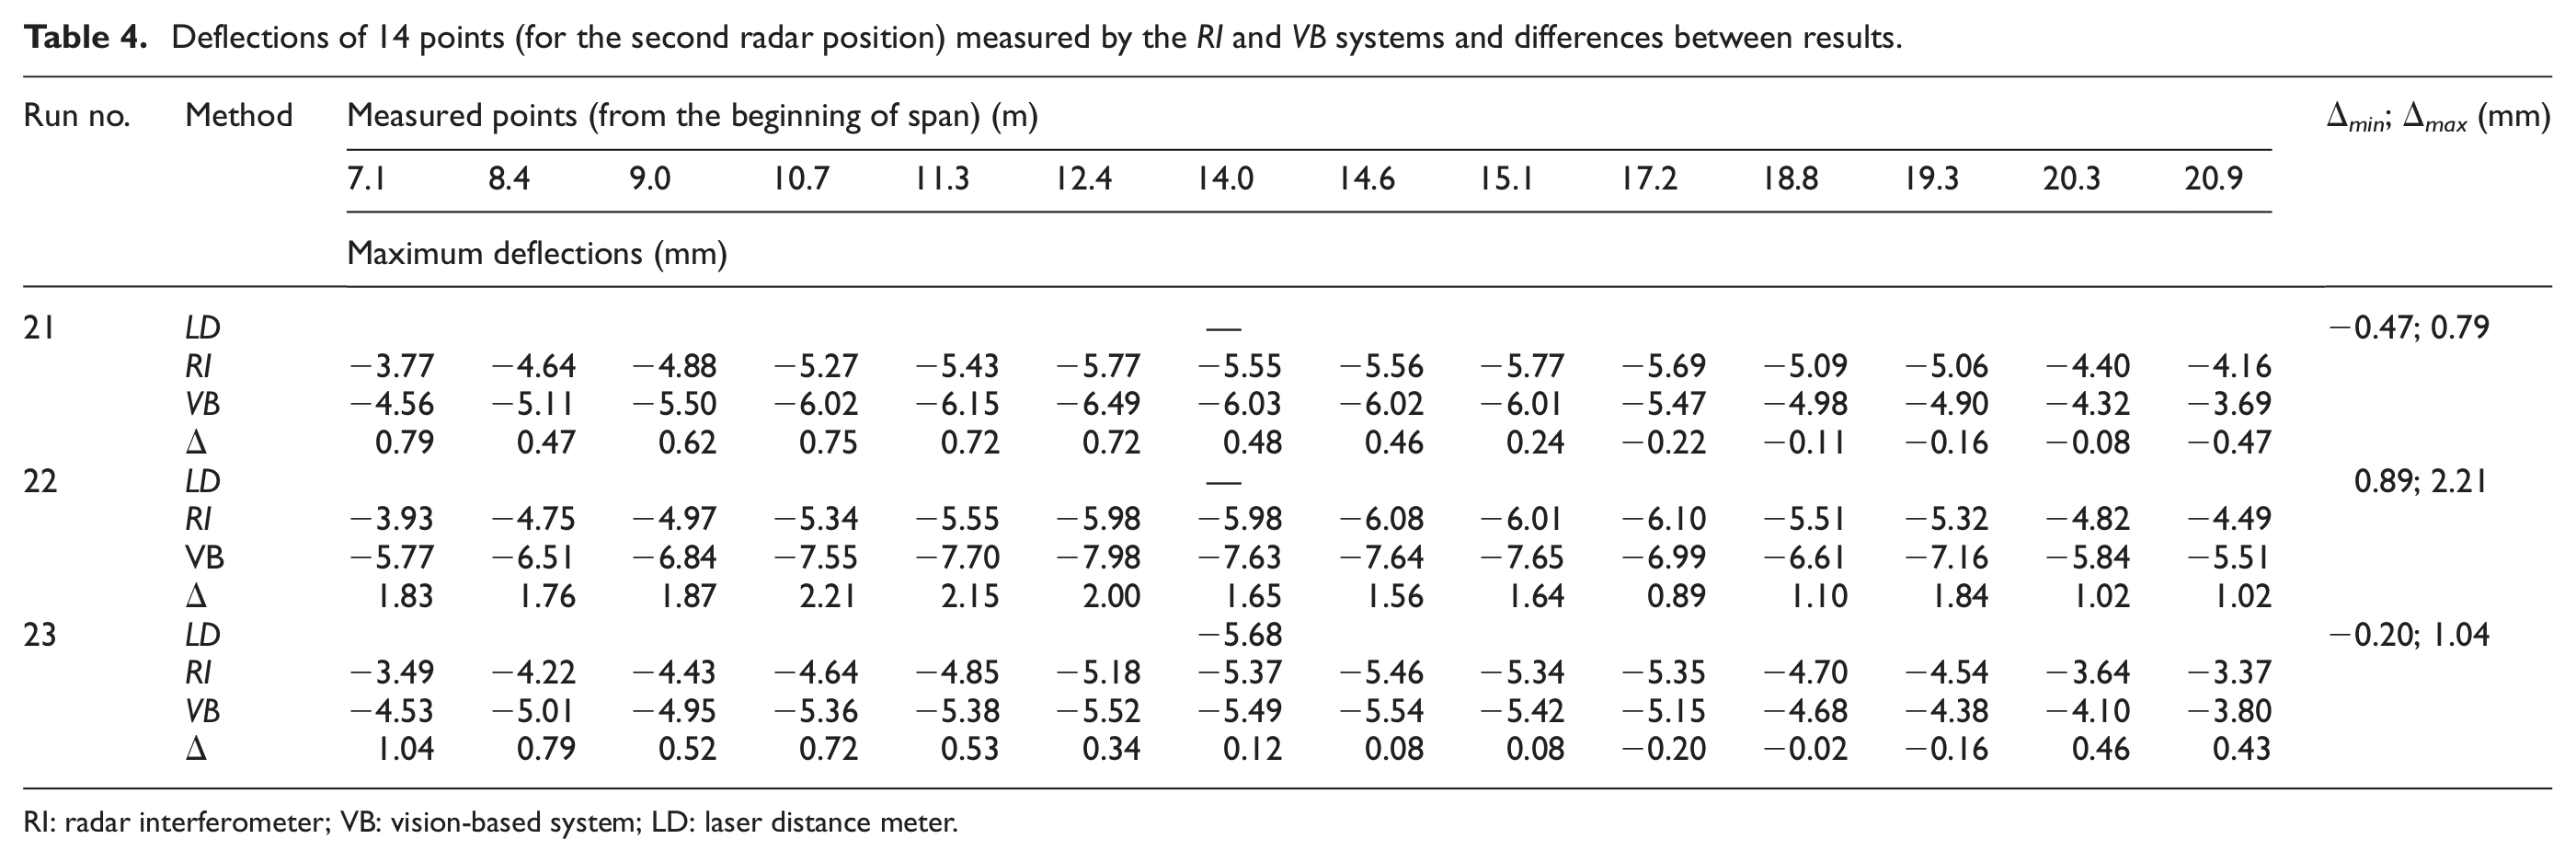
RI: radar interferometer; VB: vision-based system; LD: laser distance meter.
The independent control of measured deflections of the center part of the investigated girder was carried out with a Leica DISTO D8 laser distance meter. By connecting it in the online mode to a computer, it was possible to record measurements continuously at a frequency of 2 Hz.
In the field, the lens axis was not exactly perpendicular to the span axis. This effect may be eliminated with analytical methods. The orientation and position of the camera are described by the external orientation elements. In the described case, there were three local terrain coordinates X, Y, Z, and three angles: 60
ω—vertical angle of the camera axis tilt;
ϕ—horizontal angle that describes the camera direction in the coordinate system (azimuth);
κ—angle of fiducial plane rotation.
Knowledge of external orientation elements allows the reconstruction of the spatial position of the camera relative to the structure and thus the corrections necessary to obtain proper displacements of the tested structure. The determination of orientation elements was performed by the close-range terrestrial photogrammetry procedure involving capturing the pair of converging images with the basis equaled approximately one-fourth of the distance to the observed bridge. Both the targets fixed to tripods and elements of optical noise covering the bridge span were used as control points. All points were measured in a uniform coordinate system using the Leica TCRA1102+ total station.
Based on the knowledge of the local terrain coordinates, for the pair of images, it was possible to calculate the components of vectors in the spatial coordinate system of images. The relation between the spatial coordinates and the vector components is given by the formula:
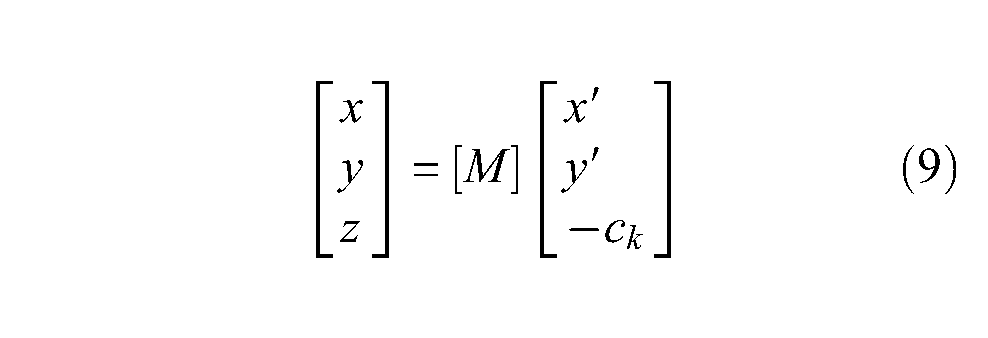
where M is the transformation matrix given by
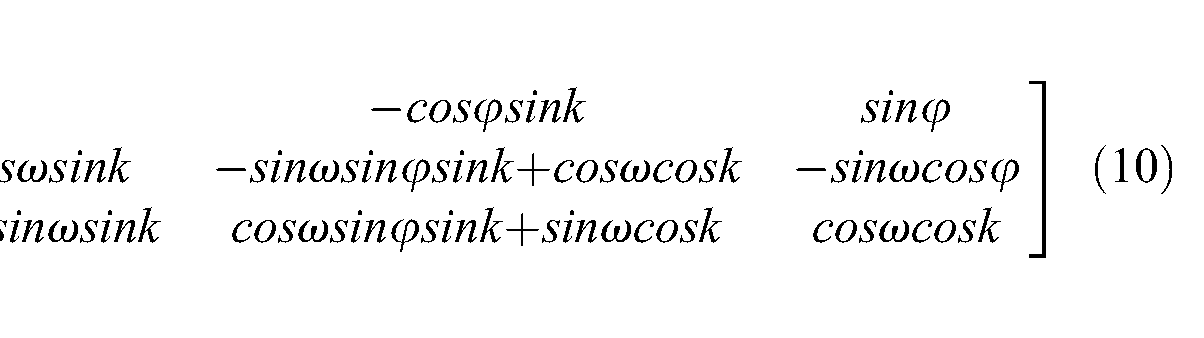
where
After adjustment of the internal orientation, the deflection of the tested span can be expressed by the formula:

where ΔZ is the beam deflection, Y is the distance from the object; Δz is the image representation of the beam deflection.
Basically, this type of measurement method is used if it is possible to direct the camera axis perpendicularly to the plane of the occurring deformation. In practice, it must be assumed that the component of deformation in the direction of the camera axis is not present or negligible. This situation occurred in the described cases, because the plane deformation of the viaduct was almost perpendicular to the axis of the camera and the movement occurred in the longitudinal vertical plane of the structure. Therefore, both of the 1D systems—IBIS-S and vision-based—observed the same deflections of span.
In the first radar position, the displacements measured by the radar were analyzed for 10 points of the span. The position of the points is shown in Table 3. For these points, the SNR value (describing their intensity of reflection) is from 56.1 to 85.5 dB. In the second radar position, the displacements measured by the radar were analyzed for 14 points of the span. The position of the points is shown in Table 4. For these points, the SNR value is from 57.7 to 82.7 dB. Figures 10 and 11 present the results of measurements performed with the RI and VB systems during a single run recorded from the first radar position. Displacements recorded by the VB system are determined for places, which correspond to the points (range bins) observed by the RI system. This was performed by identifying and calculating these places in acquired digital images. Slight differences may arise only from selection of the proper points submitted to correlation calculation in the software during processing the data from the VB system.
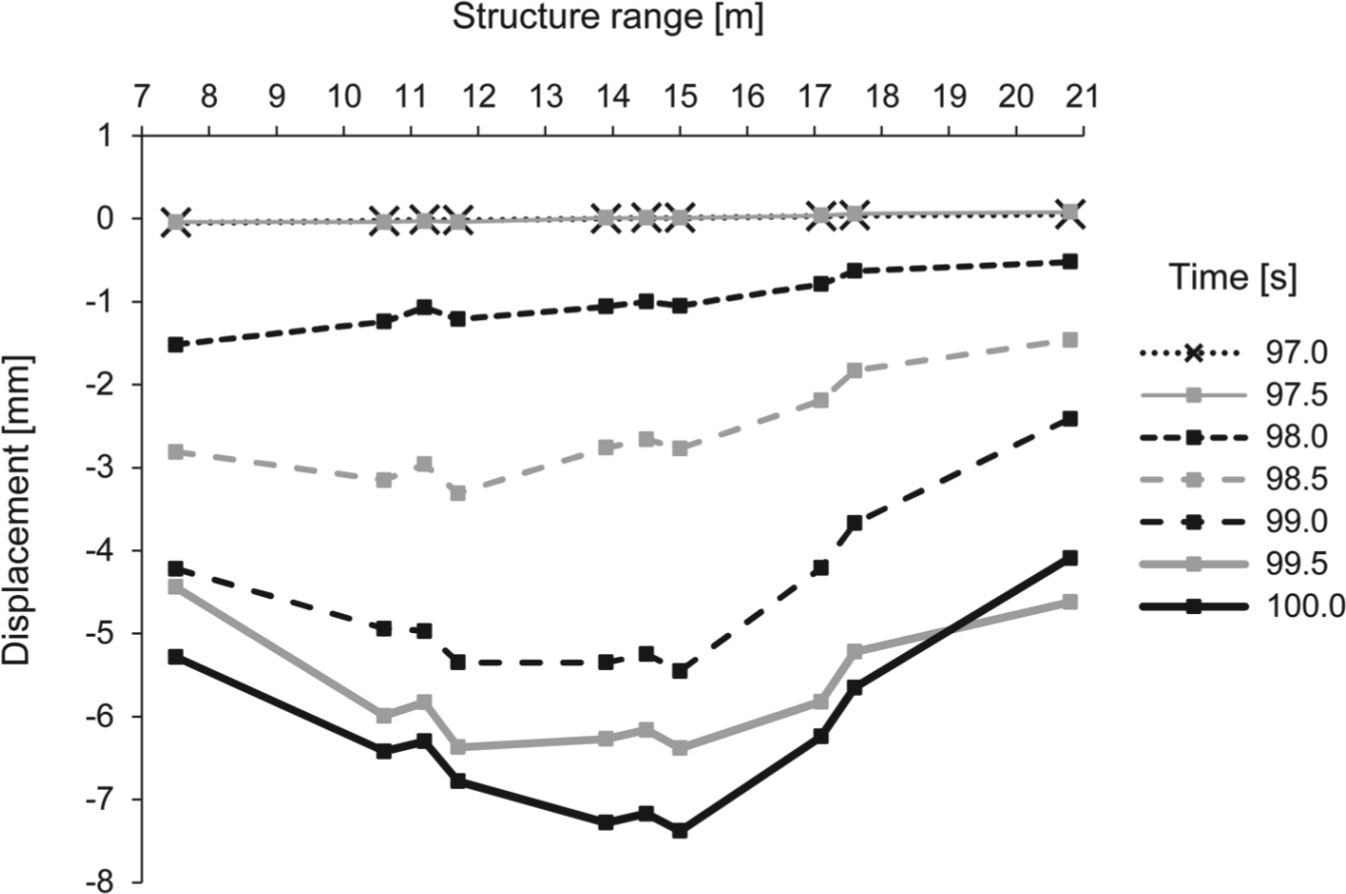
Graph of the deflected bridge span obtained from the RI system illustrated every 0.5 s (observed points are marked).
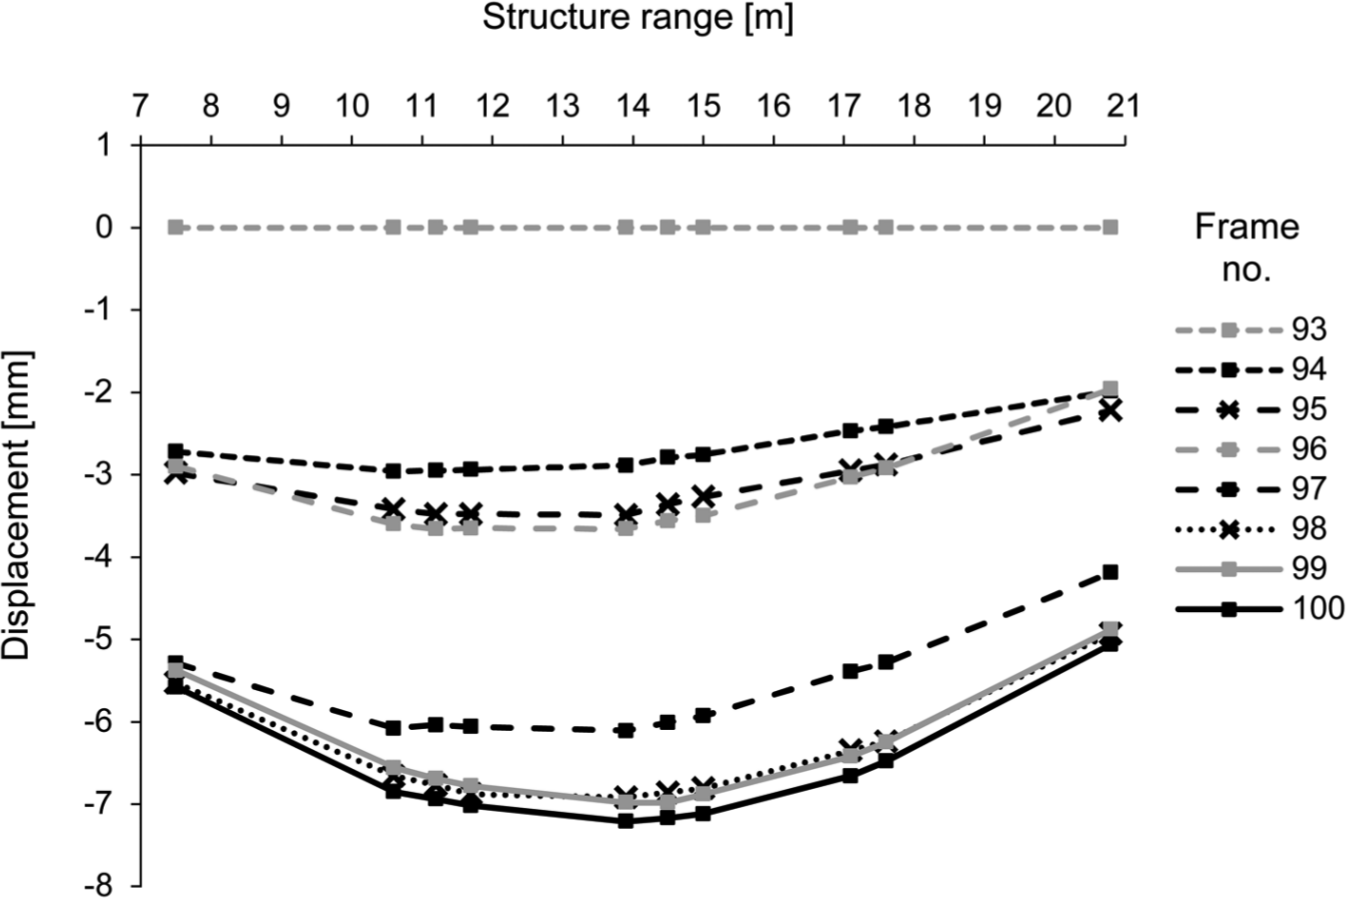
Graph of the deflected bridge span obtained from the VB system illustrated every frame (observed points are marked).
Tables 3 and 4 contain the comparison of maximum deflection obtained from the RI and VB systems for all observed points. The differences between the methods are calculated as Δ = VB−RI. The minimum and maximum value of the Δ set is presented for all runs for the first (Table 3) and second (Table 4) radar position. In addition, the values of maximum deflection of the central span point, measured by the laser distance meter (LD), are also shown. All runs were observed during loading of the closer track-way.
Statistical assessment of results
The aim of the assessment based on statistical models is the evaluation of compatibility of two measuring methods: radar interferometry and vision-based. Calculations were carried out as follows.
The linear relation between the results of both methods was verified.
The regression coefficient (the derivative of the previously determined linear model) was calculated as a necessity condition of method compatibility.
The equality of the mean values from the RI data and VB data was calculated.
The equality of the SD values from the RI data and VB data was calculated.
The compatibility of methods was calculated using the Bland–Altman test.
The following calculations were made for a sample run (no. 13). The values of linear regression for all eight runs are presented in Table 5. Initially, the compatibility between span deflections obtained from the RI and VB systems was verified by examining the existence of a linear correlation coefficient between the results for the corresponding points of span. For a sample run observed from the second radar position, a linear relation is described by a slope coefficient, which is 1.100 with ±0.193 SD, and the intercept coefficient 0.208 mm. In the discussed linear model, representing the relationship between the results obtained with two systems, the residual standard error is 0.439 mm on 12 degrees of freedom. The value of the correlation coefficient is 0.730 (multiple R2).61,62
Results of statistical assessment for all eight observed runs.
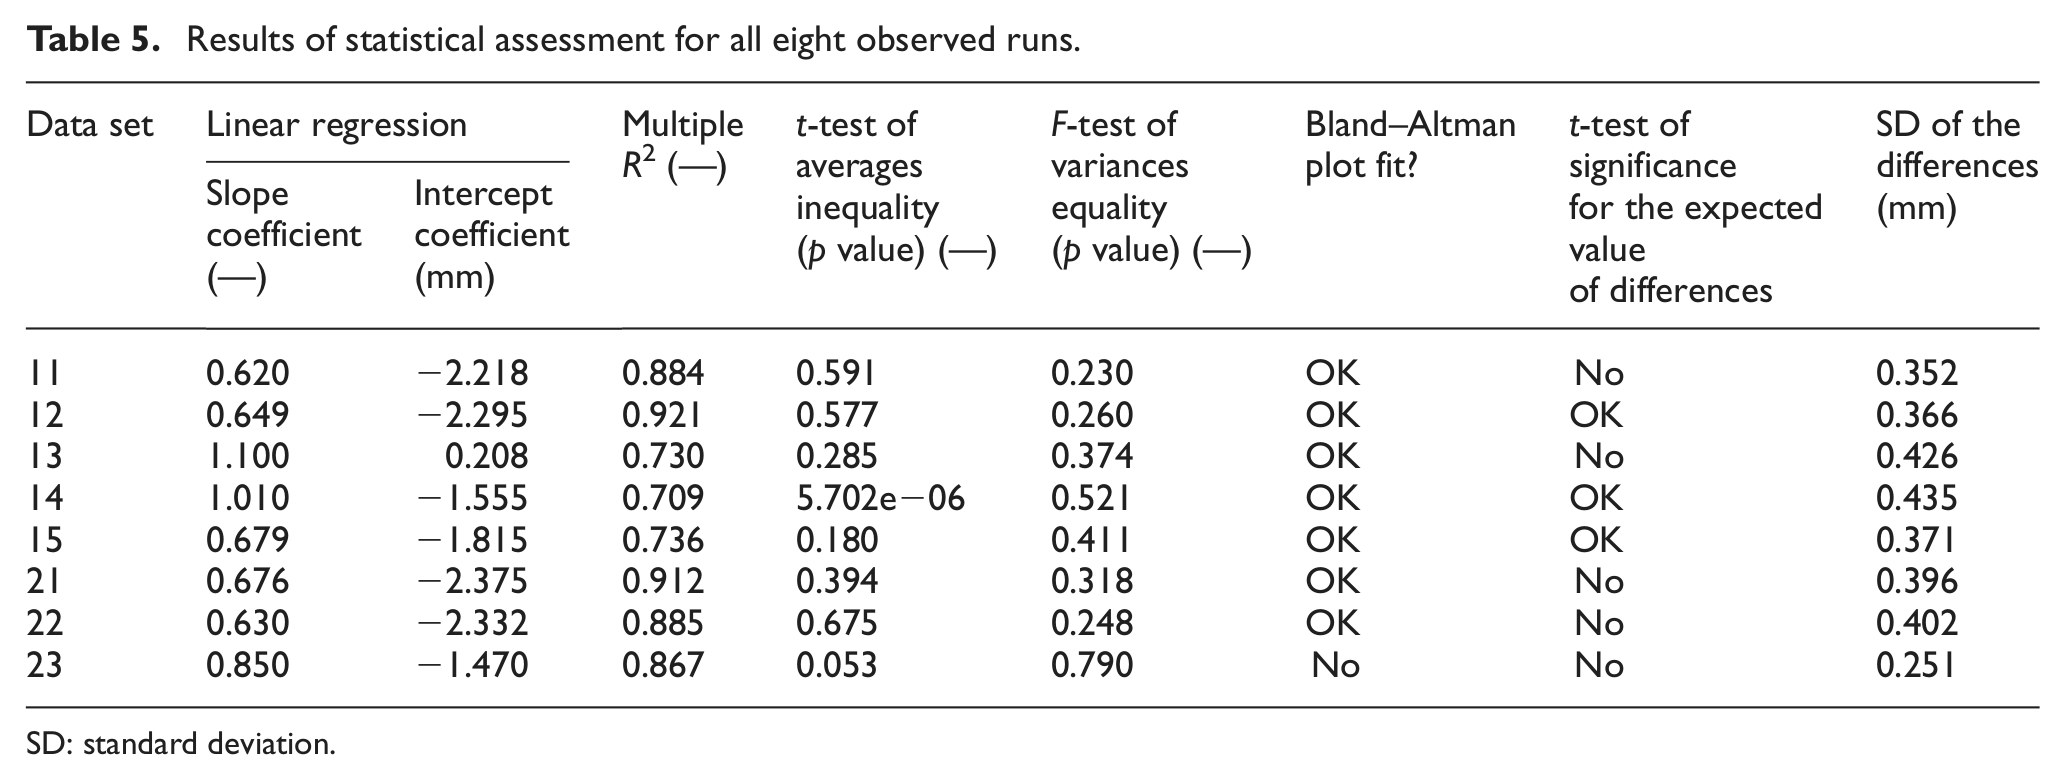
SD: standard deviation.
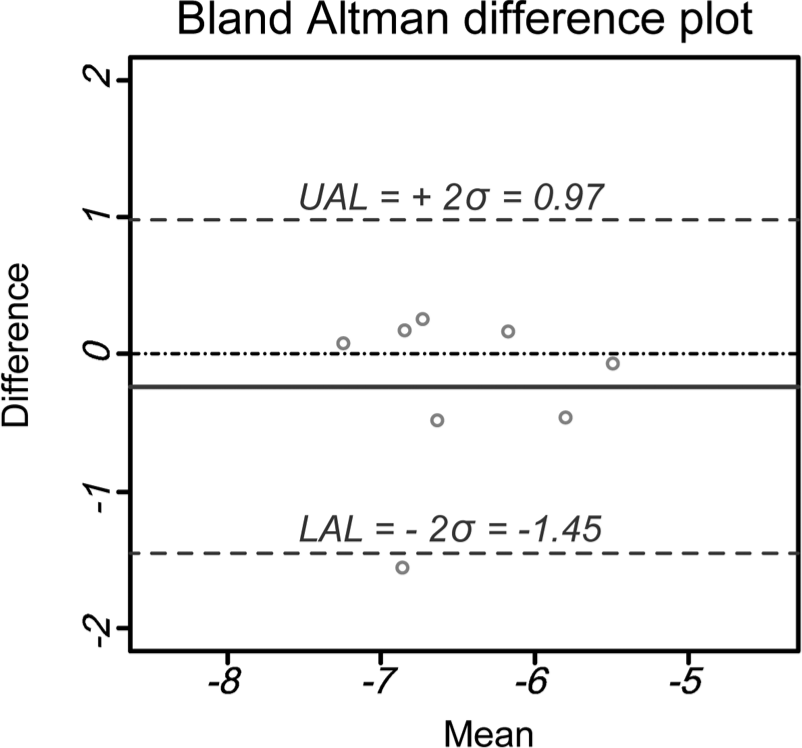
The next step was to test the hypothesis of equality of means. Due to the lack of assumptions about variances, the Welch two sample t-test was used.63,64 The calculated p-value is 0.285 (higher than the assumed level of significance 0.05), so there is no reason to reject the null hypothesis. Similarly, the equality of variances was tested on the basis of the Fisher–Snedecor F-test. A good result of the p-value, equaling 0.374, was obtained. The results of both tests allow the acceptance of the null hypotheses of equality of means and variances. In order to assess the compatibility of the data from the RI and VB systems, they were compared using the Bland–Altman test.65,66 The results are illustrated in Figure 12. The horizontal axis contains the vector of means (RI+VB)/2 and the vertical axis contains the vector of differences RI−VB. The upper agreement limit (UAL) and lower agreement limit (LAL) indicate the ±2σ value, where σ means the SD of differences.
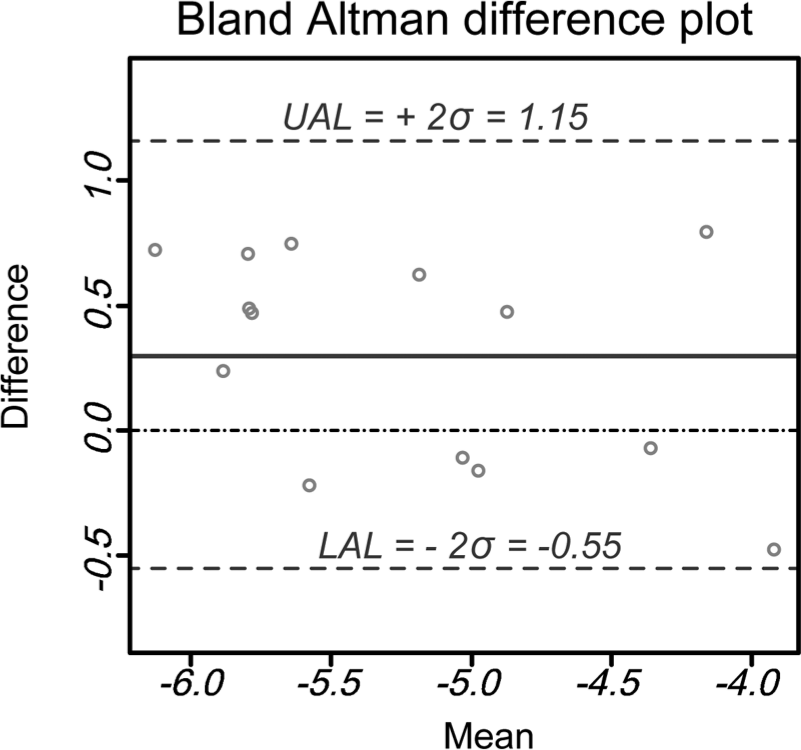
Bland–Altman plot for a sample run (no. 13).
Afterward, the test of the distribution compatibility with the normal distribution for pairs of observation differences was performed. The obtained result (p-value = 0.0835) is close to the level of significance of the test. Therefore, it can be examined with the standard t-test, which assumes that the sample has a normal distribution. As a result, the p value = 0.0206 was obtained. This is lower than the assumed level of significance level. Thus, it suggests that there is a systematic shift between methods, so they are not compatible. In the same way, as presented above, all eight runs were analyzed. The results are summarized in Table 5.
For all eight analyzed cases, the test of significance of correlation between variables gave a positive result. Therefore, there is a correlation between results from both methods, but the systems do not shift the results in relation to each other in only three out of eight cases. The calculation of the relation between the RI and VB methods was also performed for the values of maximum deflection of the midpoint of the span for all eight runs (Figure 13).The horizontal axis contains the vector of means of maximum deflections, and the vertical axis contains the vector of differences of maximum deflections. The UAL and LAL indicate the ±2σ value, where σ means the SD of differences of maximum deflections.
Bland–Altman plot for maximum deflections of all eight runs.
The expected value is zero. According to the data related to the maximum span deflections (Figure 13), the compatibility of methods can be concluded.
Conclusion
The developed vision measurement system based on the digital image correlation coefficient enables assessment of a structure’s static states under a load during inspections, as well as continuous deflection monitoring, to be carried out using the change in the shape of deflection curve analysis. The main advantages of the proposed methods (embedded in the developed vision system) are the simplicity of the measurement, the possibility of obtaining a dense field of a deflection using only one acquisition device, the application of commonly available digital cameras, the easy image acquisition process that can be performed from different points in space, as well as the fast and easy analysis and interpretation of measurement results. The method can be applied to the structures with a texture in the form of noise or natural texture of materials as well as in the case where special markers are available. The developed vision system is applied with user-friendly software, which can help one to quickly assess the state of the construction during inspection. Furthermore, the developed software tool provides a high level of measurement process automation, accomplished through operations such as image acquisition, image preprocessing, and analysis. The system monitors the state of the structure and informs the user when the critical level of measurement estimates has been exceeded and a message can be sent by an e-mail. The system provides high measurement density without the application of active optical methods.
On the contrary, the radar interferometry can also be used to measure the deflection of the structures. The RI enables the observation of many points on the structure simultaneously in the remote mode, without direct access to the structure. It provides the high sampling frequency, especially useful for dynamic tests. In addition, the system is independent on weather conditions.
The accuracy assessment is a key factor in the performance of such kinds of systems. The performed field tests allow the determination of the applicability of the proposed vision-based technique for measuring the deflection of civil engineering constructions. The vision system measurement resulted in data that matched the points’ displacement registered by the RI.
The preliminary test arranged to simulate the displacements of the observed point of the defined values enabled the accuracy of both systems to be calculated. The SD of the differences amounted to 0.38 mm for the RI and 0.51 mm for the VB. The mutual accuracy of both methods was 0.56 mm. All examined methods indicated a correlation of 99.96%. As a result of the obtained correlation, the key test on the tram viaduct was performed. The obtained graphs of deflection of the central point seem to indicate the greater advantage of the VB. The curve of deflection acquired by this system becomes more accurate and smoother than by radar interferometry. The irregular shape of the radar results arises from the uncertainty of the points reflecting the radar wave. However, a theoretical, regular graph may be fitted into this data. It must also be noted that the RI is a 1D system. This means that, for low structures, results may be worse because of the unfavorable projection factor, so users must be careful to avoid improper scaling of displacements. In the main test, the SD of the differences for the maximum deflection of the bridge span was designated by a VB and RI and equaled 0.61 mm. On the basis of performed tests, the usefulness of both systems for displacement measurements was found for the purposes required in terms of SHM.
Footnotes
Declaration of conflicting interests
The authors declare that there is no conflict of interest.
Funding
The research was supported by the OPIE project No: 01.01.02-00-013/08 co-financing by ERDF within a frame of Operational Program Innovative Economy and MNiSW (Polish Ministry of Science and Higher Education) under grant N N526 158838.