
Abstract
This article presents experimental verification on damage identification of a substructure using a wavelet-domain response reconstruction technique. The response reconstruction is based on the unit impulse response function in the wavelet domain to form a transformation matrix between two different sets of time-domain response vectors. The initial finite element model updating is performed to achieve an accurate model in the intact stage as a baseline, and measured acceleration responses from the damaged substructure are used for the damage identification. Substructure damage identification is conducted by minimizing the discrepancy between a measured response vector and the reconstructed one. A dynamic response sensitivity-based model updating method is used for the identification of the target substructure. Local damage is identified as a change in the elemental stiffness factors. The adaptive Tikhonov regularization technique is adopted to improve the identification results with measured responses including measurement and environmental noises in laboratory. Experimental studies on a 7-storey plane frame structure are conducted to investigate the accuracy of the presented response reconstruction technique and the performance of substructure damage identification approach. Good response reconstruction accuracy is obtained with the baseline model, and the introduced damages in the substructure can be identified effectively. The damage locations are identified correctly with a close estimation of damage extents.
Keywords
Introduction
Civil infrastructures deteriorate with time and will continuously accumulate damage during their services due to material deterioration, natural hazard, and harsh conditions such as earthquakes, storms, fires, long-term fatigues, and corrosions. Such unnoticed and uncorrected anomalies could potentially produce more damage and finally lead to catastrophic structural failures with a huge loss of properties and human lives. Therefore, the interest to monitor a structure for detecting local damage at an early stage is prevailing throughout the civil engineering community. Collected data from the structures and subsequent data mining analysis would indicate the existence of damage, detect the potential damage, and help management authorities to make quick and timely decisions on whether the repair, partial replacement, or demolition activities are necessary.
Early approaches were based on correlating numerical models with measured modal properties from undamaged and damaged structures. Doebling et al. 1 and Carden and Fanning 2 have presented comprehensive reviews on damage detection from structural vibration characteristics. The basic idea is that the measured modal parameters (frequencies, mode shapes, and modal damping, etc.) are functions of the physical properties of the structure (mass, damping, and stiffness). Therefore, changes in the physical properties, such as reductions in stiffness resulting from local anomalies, will cause detectable changes in these modal properties. Significant work has been done in the detection of local damage in structures using these changes, such as frequency, 3 mode shape, 4 mode shape curvature,5,6 flexibility, 7 frequency response function, 8 and so on. Later, the finite element model updating methods were developed to identify unknown structural parameters of civil structures and to determine structural damage. These methods aim to minimize the discrepancies between the numerical and experimental modal data 9 or time-domain dynamic responses 10 by adjusting the unknown system parameters of the finite element model.
Recently, substructural condition assessment approaches are popular and attractive because the number of unknown parameters to be identified can be reduced, and the computational convergence and efficiency is improved with a fewer number of system degrees of freedom (DOFs) involved in the inverse analysis. Koh et al. 11 proposed a substructure approach to estimate the stiffness and damping coefficients of structures from measured dynamic responses using the extended Kalman filter with a weighted global iteration algorithm. Other substructural identification methods for the estimation of local damages were developed using the autoregressive-moving-average model (ARMAX) model with the sequential prediction error method 12 and using a backpropagation neural network. 13 Recently, Koh et al. 14 adopted the genetic algorithm (GA) approach to conduct the substructural system identification in which the response measurements at the interface DOFs were assumed known and the calculated inertia forces from these responses were taken as the input to the substructure of interest. Tee et al. 15 presented two system identification methods at the substructural level on identifying the first-order and second-order models. A strategy that used model condensation and recovery in identifying substructural parameters was proposed. 16
In the above-mentioned substructural identification work, measurements at the interface DOFs between substructures are required, and they are treated as input excitations to the substructure of interest. However, it may not always be possible to measure all the responses at the interface DOFs, particularly for those rotational DOFs. Therefore, a substructural method in the frequency domain without using interface measurements was proposed by employing the GA approach for identification. 17 On the other hand, other researchers18,19 explored the simultaneous identification of both the input and system parameters in substructural condition assessment. The number of measurements was found to have a significant influence on identifying the interface forces and system parameters simultaneously because a sufficient number of identification equations should be provided. The accuracy of damage identification depends on the accuracy of identified forces, and the computational load would also be intensive with this approach. Previous studies also included the substructure damage detection or model updating with frequency-domain information.20,21
It is interesting and desirable for practical engineering applications that the condition assessment for a large-scale or a complex structure may be conducted by dividing the full structure into several smaller substructures for independent studies one at a time in the inverse analysis. This article attempts to eliminate the restraint of requiring the measurement information or identifying interface forces at interface DOFs of a substructure by using a wavelet-domain response reconstruction technique. The relationship between two sets of time-domain response vectors from the substructure can be formulated with the unit impulse response (UIR) function calculated from the finite element model of the substructure. Measured time-domain acceleration responses will be used directly for identification without the need to perform the integration and derivation of vibration signals to avoid any additional errors. Numerical studies on the substructure damage identification approach with the wavelet-domain response reconstruction technique have been conducted. 22 Experimental verifications will be conducted to further validate the approach for substructure response reconstruction and damage identification in this article. The accuracy of the wavelet-domain response reconstruction in the substructure will be investigated with the experimental testing data. Initial model updating is performed to adjust the analytical finite element model to match the experimental model. Two damage scenarios are introduced into the structure, and dynamic tests are conducted separately. A limited number of acceleration responses from the substructure in the damaged state will be measured and used for the identification. The damage identification is conducted purely in the target substructure by minimizing the difference between the measured and reconstructed response vectors, and only the elemental stiffness factors of the target substructure are formulated in the identification algorithm resulting in a much reduced dimension in the inverse problem.
Response reconstruction in wavelet domain
The response reconstruction in a full structure and in a substructure has been developed and validated in frequency domain. 23 The responses are required to be transformed from time domain into frequency domain with the fast Fourier transform (FFT) technique. FFT has been a valuable tool for the analysis of vibration signals. However, leakage, end effects and aliasing occur in the forward FFT process. Filtering, windowing and ensemble-averaging techniques are often employed to alleviate these deficiencies with some success. Nevertheless, these errors in the FFT process still exist which may lead to a reduction in the accuracy of subsequent analysis. Such disadvantage can be overcome in the wavelet analysis which provides an alternative significant tool in signal analysis.
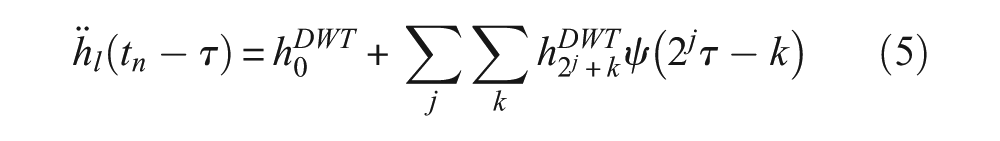
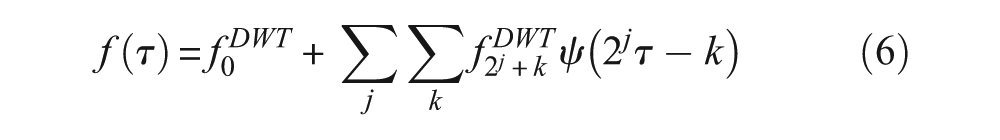
Wavelet transform is based on the idea that any signal can be broken down into a series of local basis functions called wavelets. Any particular local feature of a signal can be analyzed based on the scale and translation characteristics of wavelets. Therefore, the wavelet transform can reflect both time and frequency-domain information. Later, the response reconstruction is developed in the wavelet domain to avoid the above-mentioned errors. 24 This is briefly introduced in the following sections.
Dynamic analysis of a structure
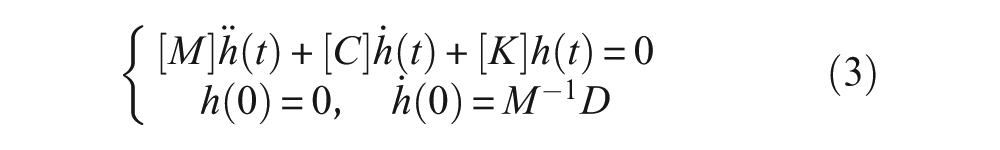
The general equation of motion of a damped structure with N-DOFs can be written as

where [M], [C], and [K] are the
Input–output relationship in wavelet domain of a structure
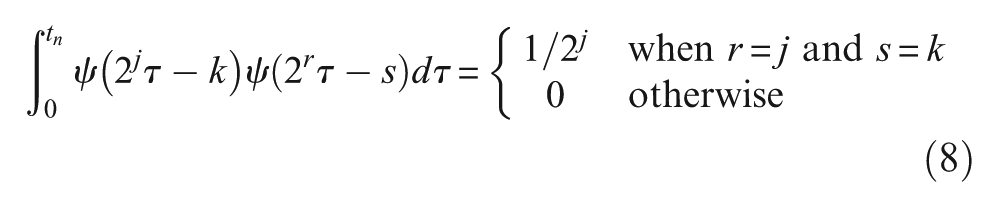
The UIR is the response function of the system under the input of a unit pulse. It is an intrinsic function of the structural system. Traditionally, FFT is used to extract the impulse response data or Markov parameters by an inverse FFT of the frequency response curves obtained from the measured input and output. 25 It has been reported that the impulse response data are extracted via the wavelet transform from known measured responses and input excitation information to avoid errors in the Fourier transformation process of both the input and output signals. 26 Recently, the impulse response function has been derived analytically from the general equation of motion. 27 The equation of motion of a damped structural system under the unit impulse excitation is

where
where
When the structural system is under general excitation f (t) with zero initial conditions, the acceleration response
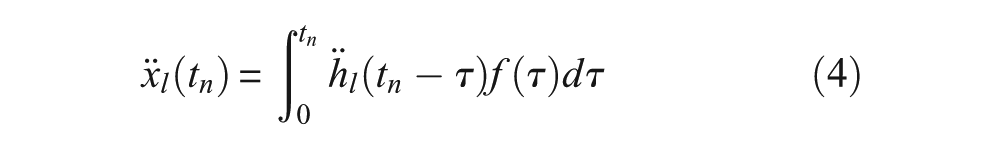
in which
where

the following formula can be derived

in which
For the entire time history data, for example,

in which
and
Response reconstruction in a target substructure
When a substructure of the structure subjects to both applied external excitation forces and interface forces from adjacent substructures, the dynamic acceleration response of the substructure can be represented in wavelet domain in terms of equation (12)

where
The measured responses from the substructure are divided into two sets, noted as the first-set response vector
in which
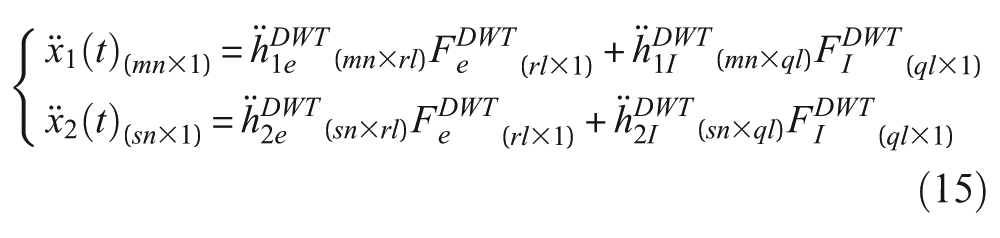
When the number of measurements in the first-set is at least equal or larger than the number of interface forces on the substructure, the following equation can be obtained from the first row of equation (15)

in which “+” denotes the pseudo-inverse of a matrix. Substituting equation (16) into the second row of equation (15), we have

where


Transformation matrix
Substructure damage identification
The Fourier transform is advantageous in capturing frequency characteristics, while the wavelet transform preserves the temporal properties of a signal record during both the forward and inverse wavelet transforms. It has been reported 30 that the deconvolution using the wavelet-domain method for system identification shows advantages over that using the frequency- or time-domain method since the wavelet-domain method does not exhibit the rank-deficiency or ill-conditioning in the computation of pseudo-inverse of a matrix, and this is a key attribute of the proposed wavelet-based damage identification approach.
In this study, a dynamic response sensitivity-based finite element model updating method
31
is used for substructural damage identification. The damage is assumed only related to a stiffness reduction such as a change in the elastic modulus of a specific element. The mass matrix is assumed to be unchanged before and after the damage. The elemental stiffness factors in the initial structural finite element model are iteratively updated to minimize the difference vector
Damage model
The initially linear-elastic structure is assumed to remain linear-elastic after the occurrence of small local damage. The damaged system stiffness matrix
where
Damage identification algorithm
The objective function of the damage identification algorithm is defined as the difference between two sets of response vectors

where
The dynamic response sensitivity-based model updating method 31 without considering the second- and higher-order effects has been used to perform the damage detection in a full structure, and it is adopted here to identify the damage of the target substructure as

where
The iterative updating method requires the sensitivity matrix
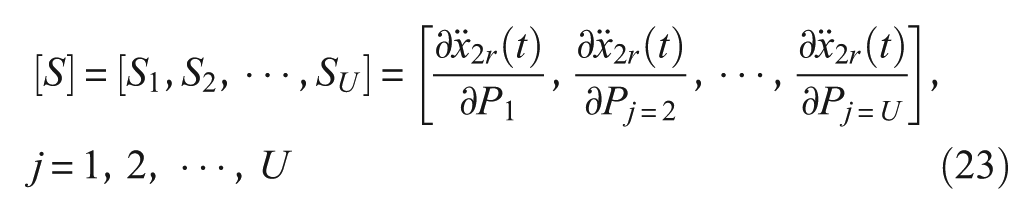

where
Iterative damage identification procedure
Acceleration responses from the substructure in the damaged state will be used to identify the elemental stiffness factors
Step 1: Acquire the dynamic acceleration responses at the first-set
Step 2: Compute the UIR matrices
Step 3: The vector of response difference
Step 4: Obtain the perturbation vector of elemental stiffness factors
Step 5: The vector of elemental stiffness factors is iteratively updated with

where
In the above iterative scheme for substructure damage identification, it should be noticed that (a) the information of the responses and forces at the interface DOFs of the substructure are not necessarily required; (b) the finite element model of the intact target substructure and a limited set of acceleration measurements from the damaged substructure are needed in the damage identification; (c) only the elemental stiffness factors of the target substructure are formulated in the identification algorithm resulting in a much reduced dimension in the inverse problem; and (d) information such as the finite element model and measurements from the rest of the structure other than the target substructure is not required in the identification.
Experimental verification
The wavelet-domain response reconstruction and its use for substructure damage identification have been presented. Experimental studies will be conducted in this article to further validate and demonstrate the performance of the presented response reconstruction and substructural damage identification approach. A fabricated structure with model uncertainties provides measured acceleration responses including measurement and environmental noises in the laboratory for the following experimental verifications.
Experimental setup
A 7-storey steel frame is designed and fabricated in the laboratory. The column of the frame has a total height of 2.1 m with 0.3 m each storey. The length of the beam is 0.5 m. The cross-sections of the column and beam elements are measured as
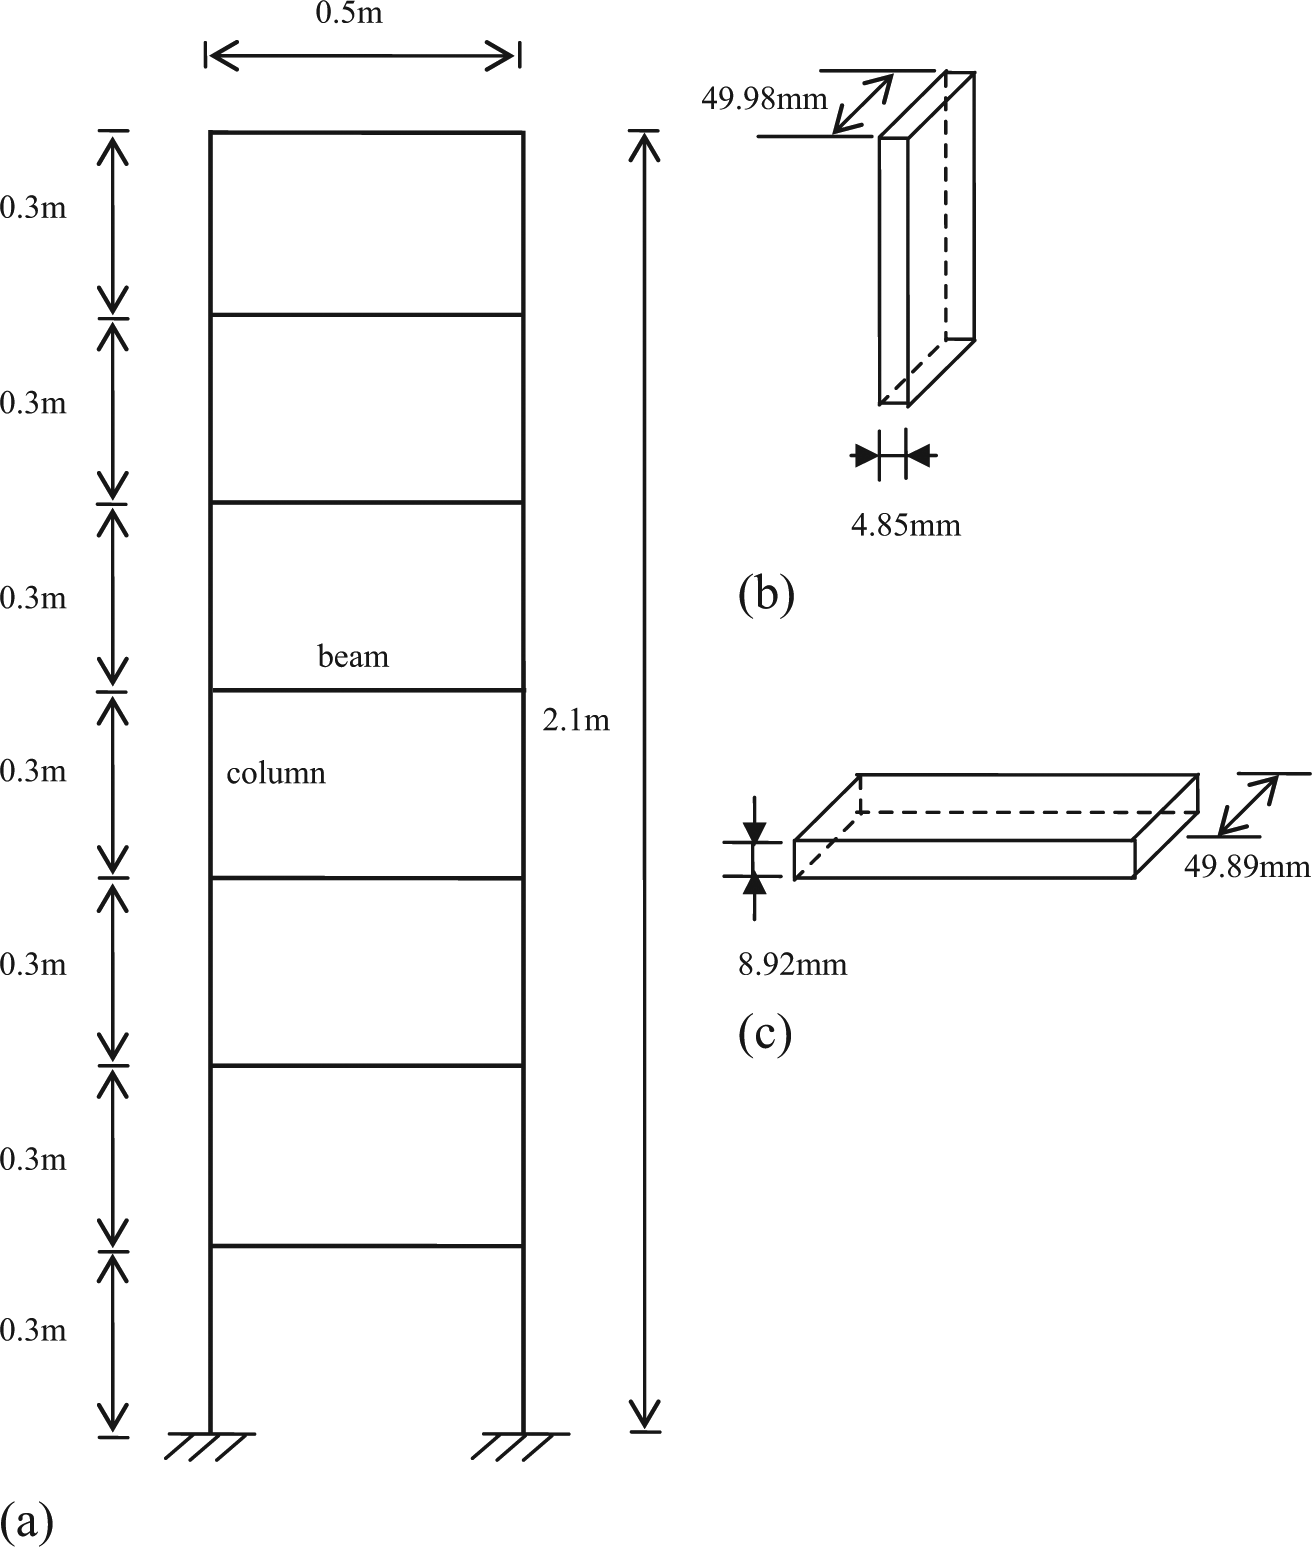
Dimensions of the steel frame structure: (a) plan view of the frame, (b) dimensions of the column, and (c) dimensions of the beam.
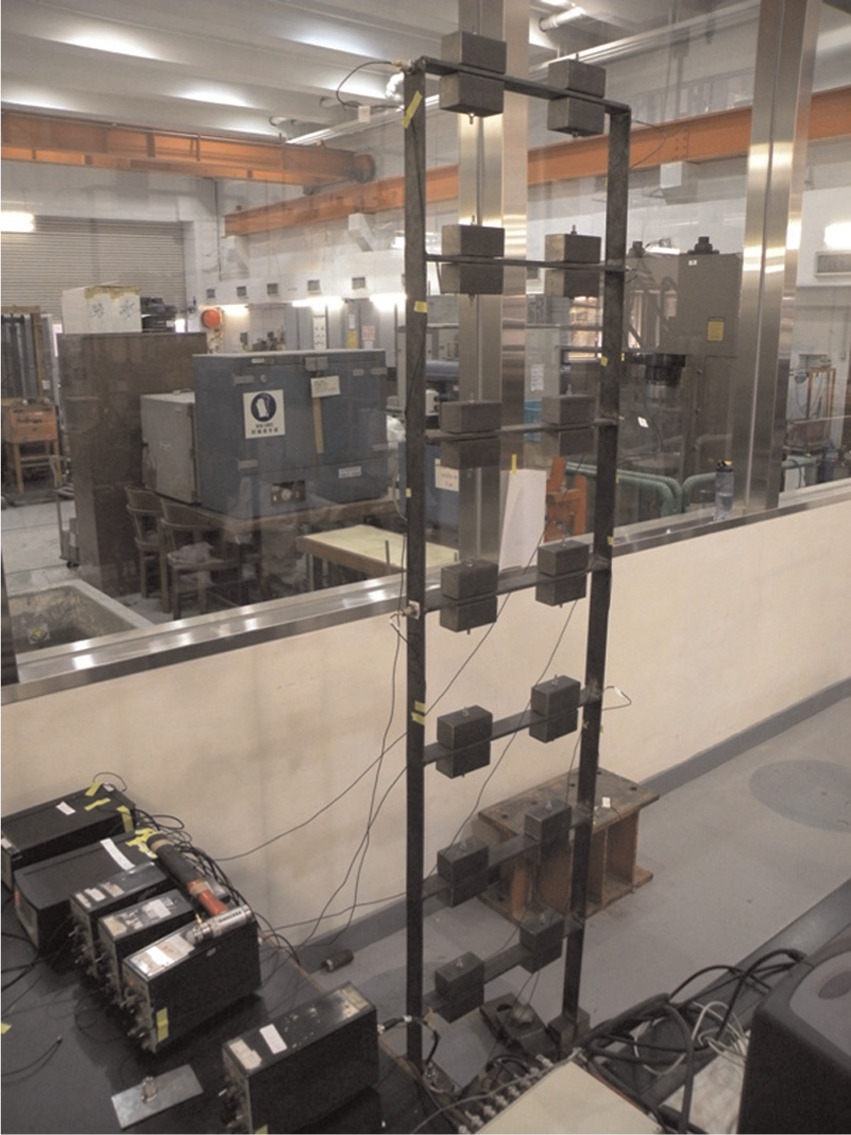
The laboratory steel frame model.
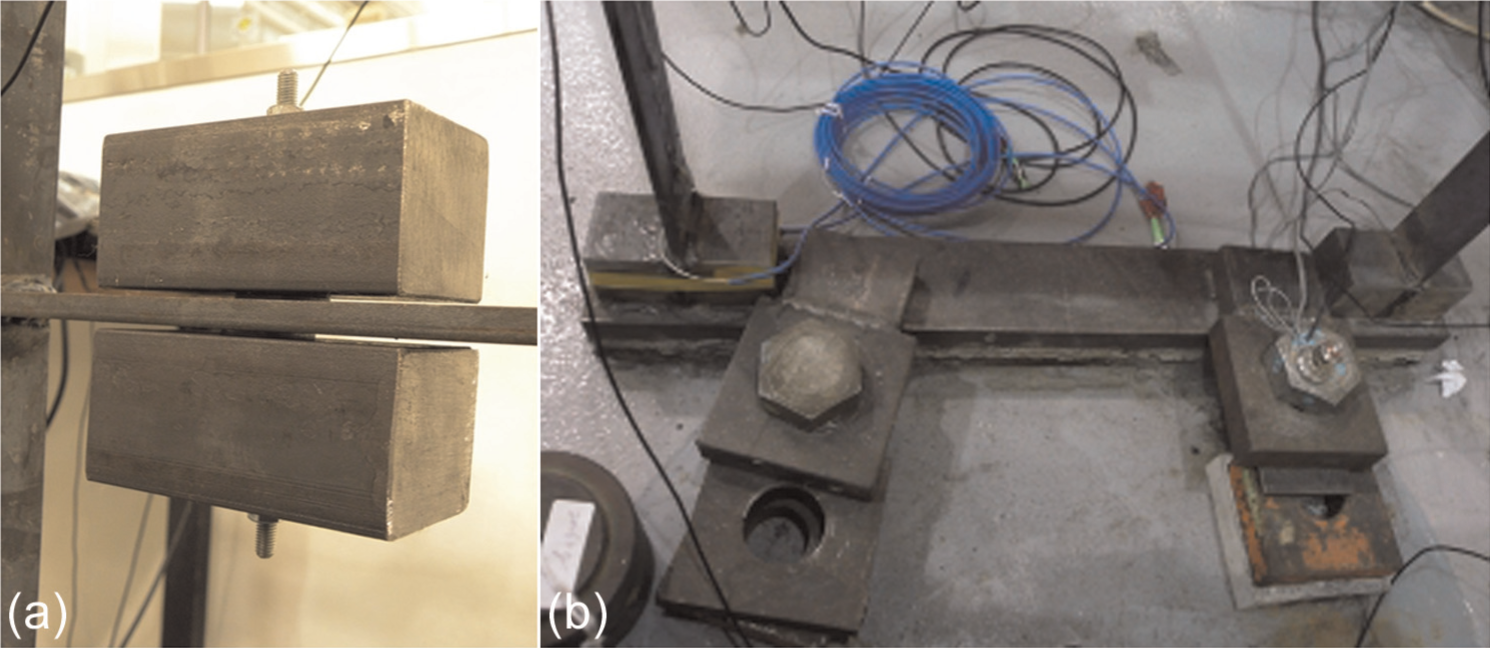
Steel mass blocks and support of the frame: (a) a pair of mass blocks and (b) support of the frame structure.
Model B&K 3023 and KD 1010 accelerometers are used in the laboratory dynamic tests to collect the acceleration responses of the structure. A SINOCERA LC-04A hammer with a rubber tip is used to generate the excitation. The use of the rubber tip is to produce a more uniform, low-frequency component in the impact force since this structure has the analytical fundamental frequency of 2.54 Hz. National Instruments (NI) data acquisition board is used to support the above equipment, and DEWESoft data acquisition software is employed to communicate with the NI system, such as debugging the setup of sensors, displaying the recording signals, configuring the sampling rate, and storing the measured data into the computer. The data recording computer and data acquisition board are electrically grounded to reduce the disturbance of alternating current (AC) power effect on the measured signals.
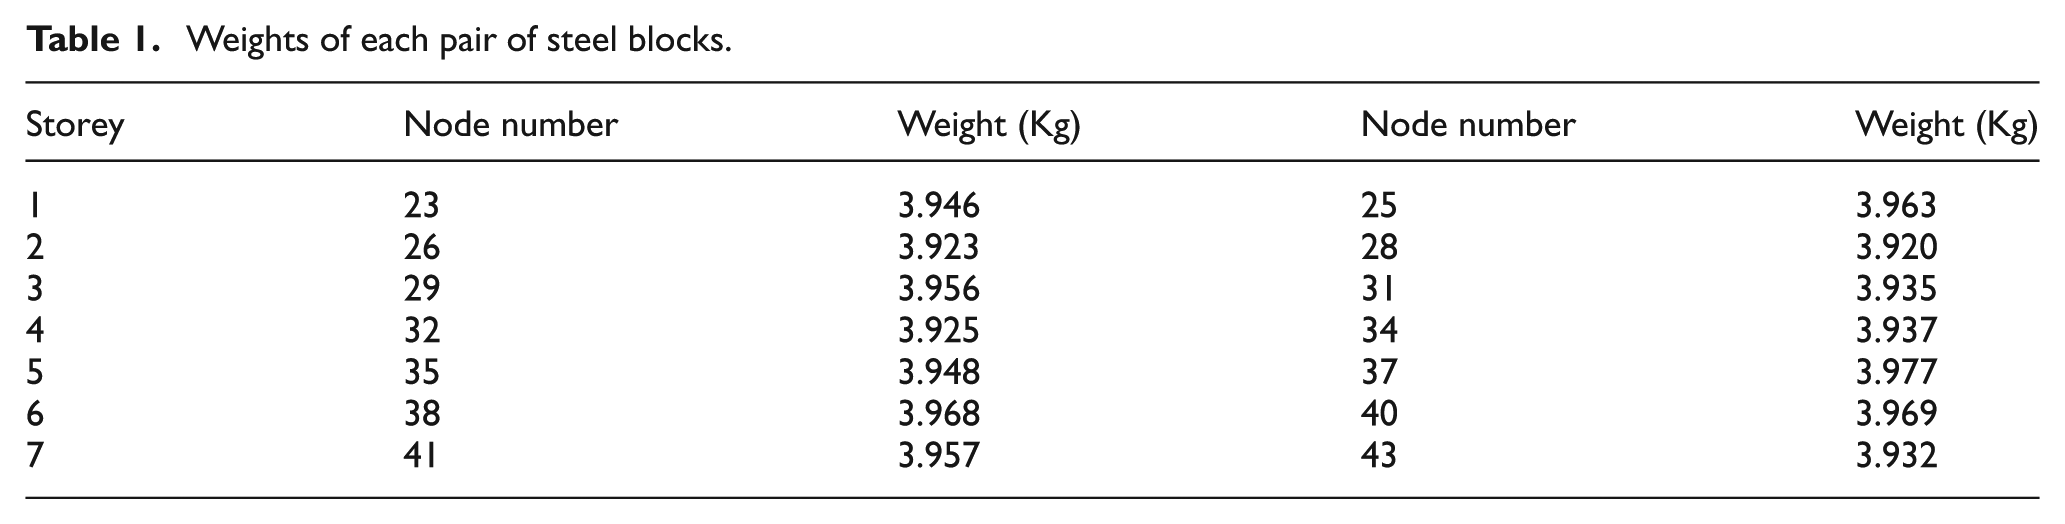
Figure 4 shows the finite element model of the whole frame structure. It consists of 65 nodes and 70 planar frame elements. The weights of steel blocks are added at the corresponding nodes of the finite element model as concentrated masses as shown in Table 1. Each node has three DOFs (two translational displacements
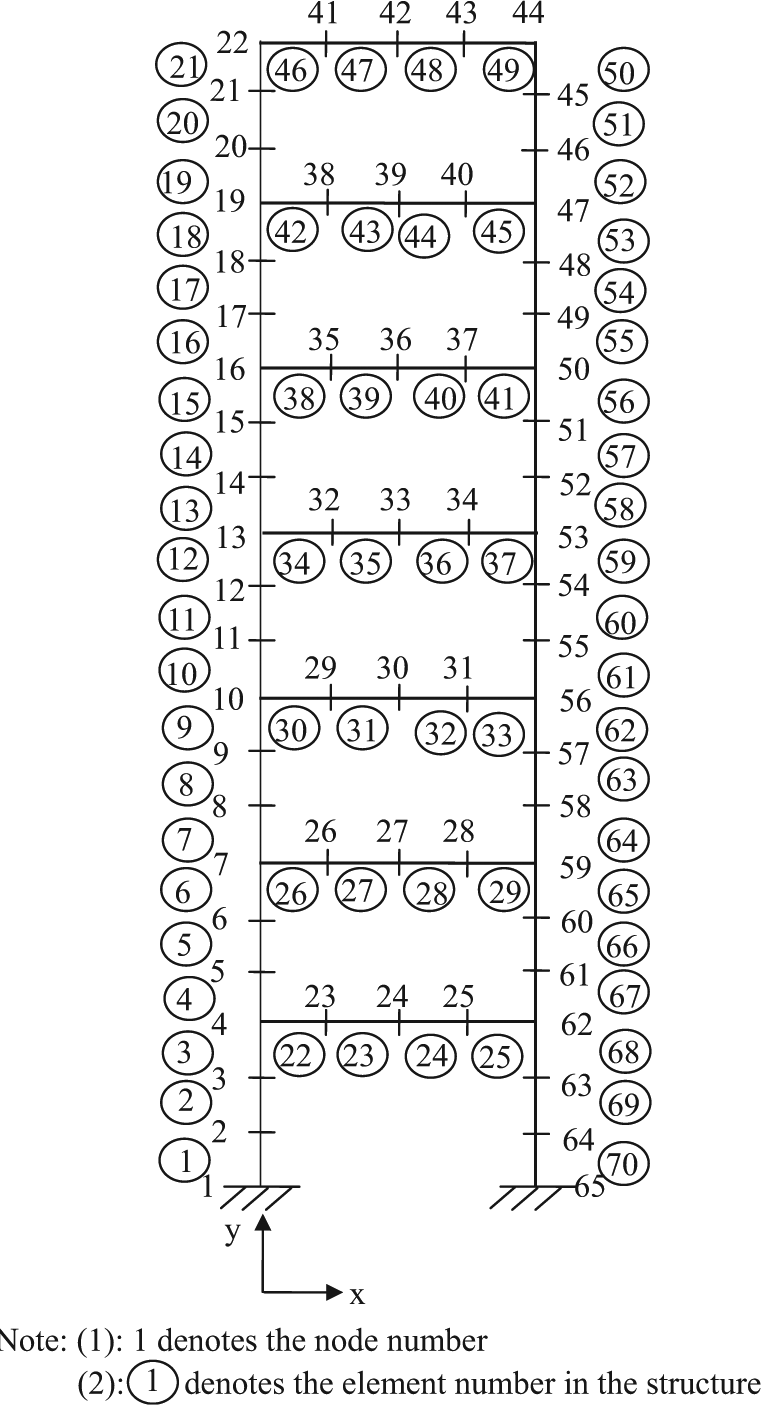
Finite element model of the steel frame structure.
Weights of each pair of steel blocks.
Initial finite element model updating
Initial finite element model updating is conducted to minimize the discrepancies between the analytical finite element model and the experimental model in the laboratory. The model updating process is conducted based on a two-stage procedure. In the first-stage model updating, the elastic modulus of each element and stiffness values of restraints at the two supports are selected as parameters to be updated. The dimensions and mass densities are measured in situ, and they are not included as the updating parameters. Eight sensors are deployed in the hammer tests with one defined as the reference sensor and the others are placed at all the joints between the columns and beams in separate tests. Experimental modal analysis is performed to extract the natural frequencies and modal shapes of the frame structures from the measured acceleration responses. Natural frequencies are obtained by the peak-picking method, and mode shapes are obtained by comparing the amplitude of Fourier spectrum of the dynamic response at a specific location with that of the reference point. The natural frequencies and mode shape values of the first seven modes are obtained. The frequencies and mode shapes of the first seven modes are shown in Figure 5.
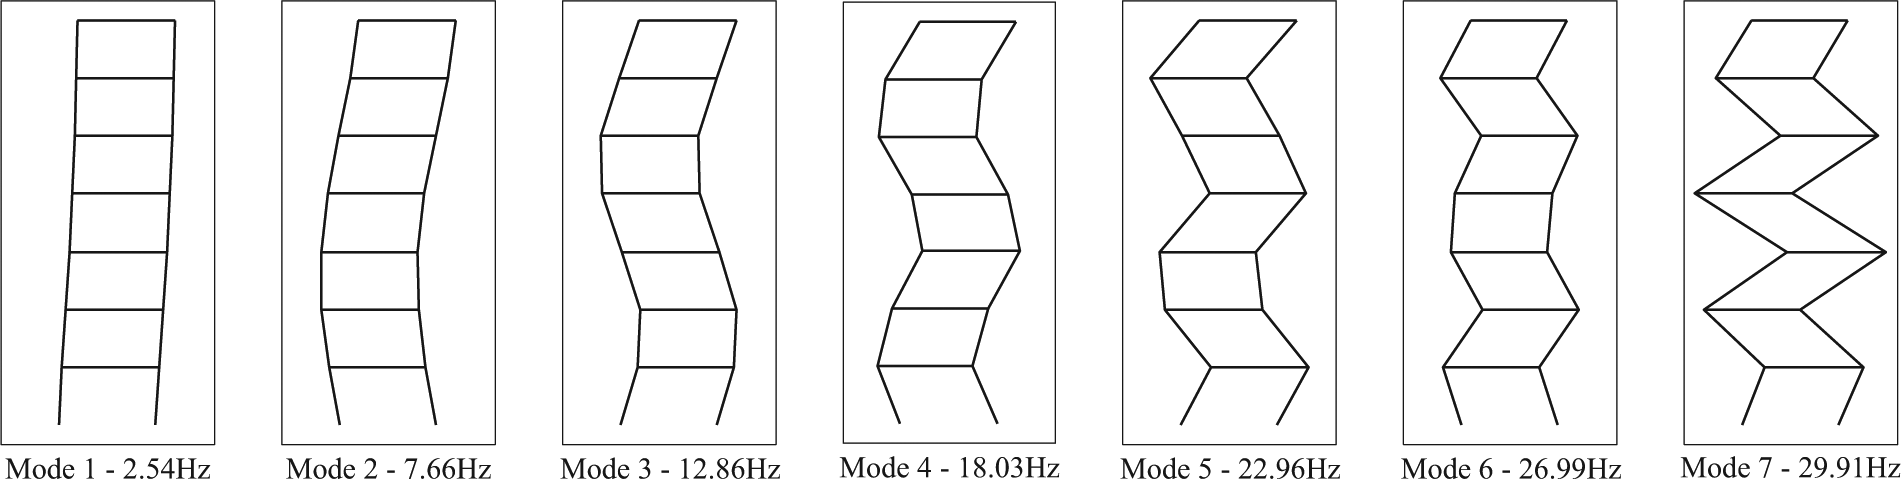
Measured mode shapes of the original laboratory frame structure.
The difference between the frequencies and mode shapes calculated from the analytical finite element model and the experimental measured ones is minimized with the first-order modal sensitivity-based updating method.
35
It should be noted that seven measured frequencies and
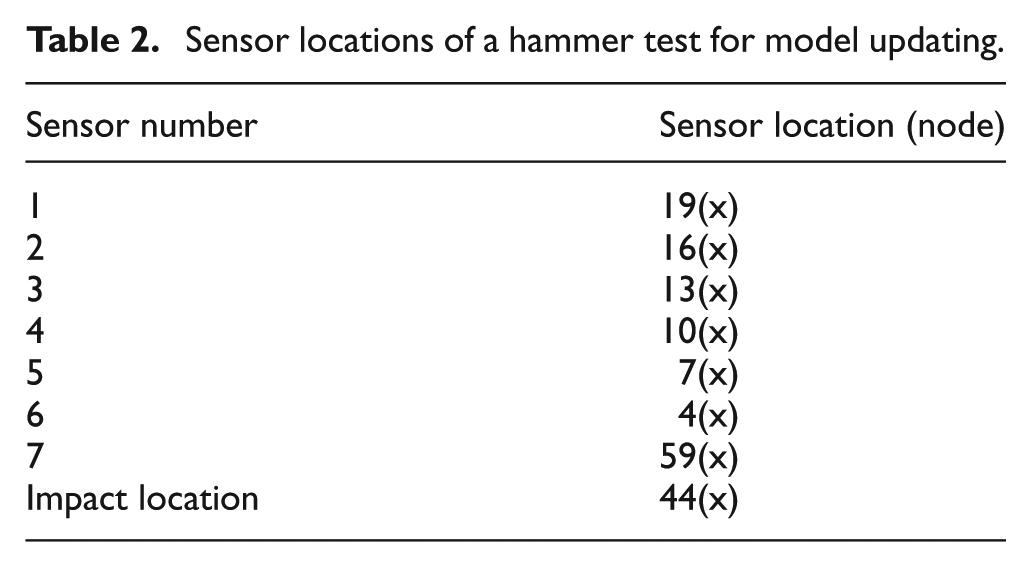
Based on the updated results obtained above, the second-stage model updating further refines the updated model by using the dynamic response sensitivity method. 31 The objective of this stage model updating is to match the calculated dynamic responses from the finite element model to the measured ones as closely as possible with the measured available impact force. The elastic modulus of all the elements of the frame is selected in the second-stage updating process. Measured responses from seven sensors on hammer excitation of the frame at the seventh floor level are used in this model updating. The seven sensor locations are listed in Table 2. Response data in the first 2 s are used in the model updating. Figure 6(a) and (b) shows the dynamic response at Node 13(x) in time domain and frequency domain, respectively. The dynamic response takes more than 40 s to damp down close to zero, indicating that the frame structure is only slightly damped. The Fourier spectrum shows that the frequency response after 35 Hz is very small. Therefore, the original response data are filtered using a low-pass filter with a cutoff frequency of 36 Hz to remove the higher frequency response and noise effect. Rayleigh damping is assumed in this study. The first two damping ratios of the intact frame structure are obtained from the half-power bandwidth method, 36 and they are calculated as 0.0017 and 0.0012 for the first two modes, respectively. Since the laboratory testing model used pure steel (low damping ratio normally less than 0.01) to construct both the column and beam elements and no any braces and dampers are installed in the steel frame model, these identified modal damping ratios are such small.
Sensor locations of a hammer test for model updating.
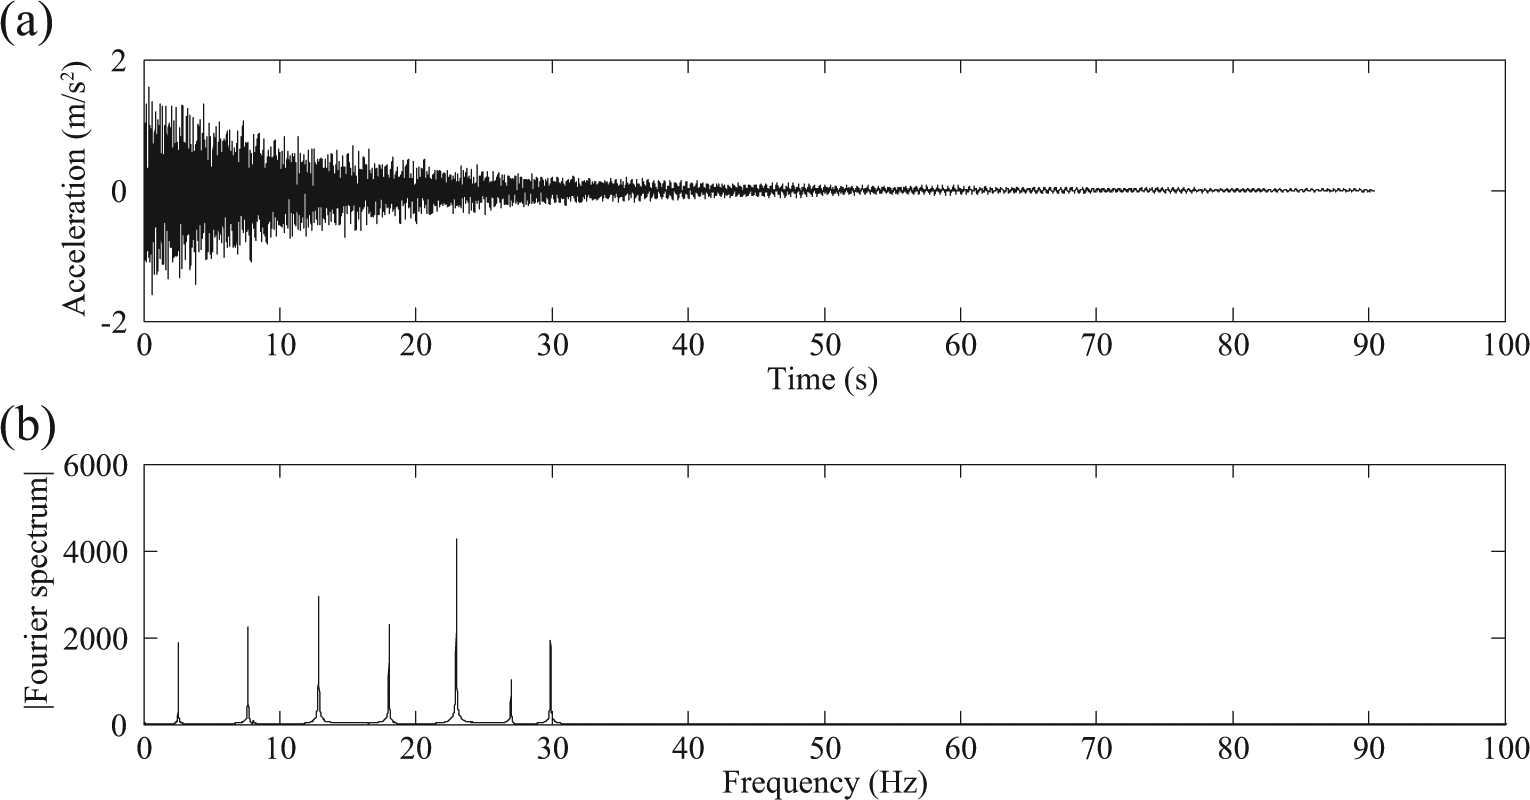
Time- and frequency-domain responses at Node 13(x) of a hammer test: (a) response in time domain and (b) response in frequency domain.
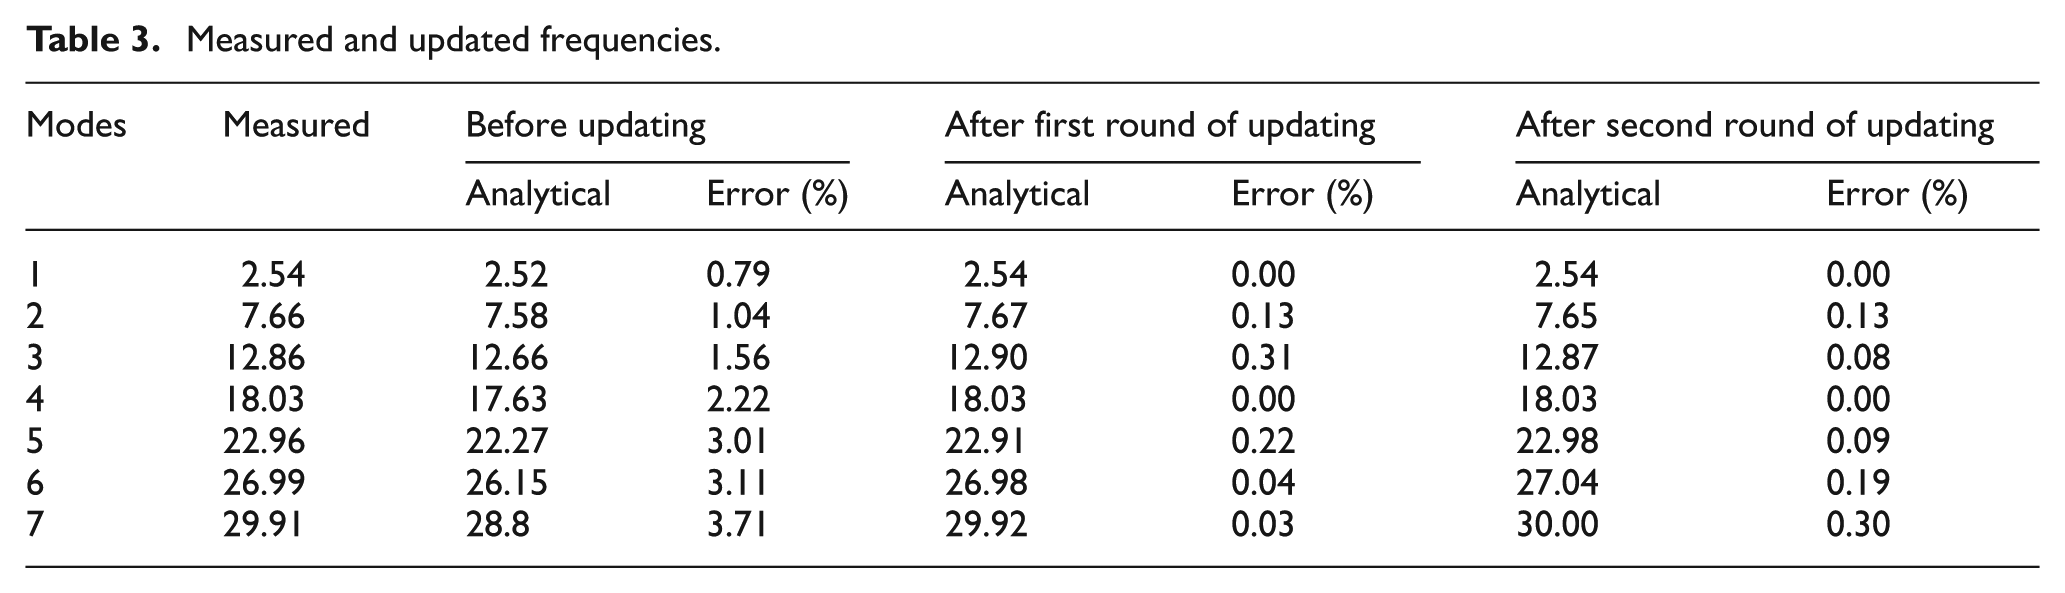
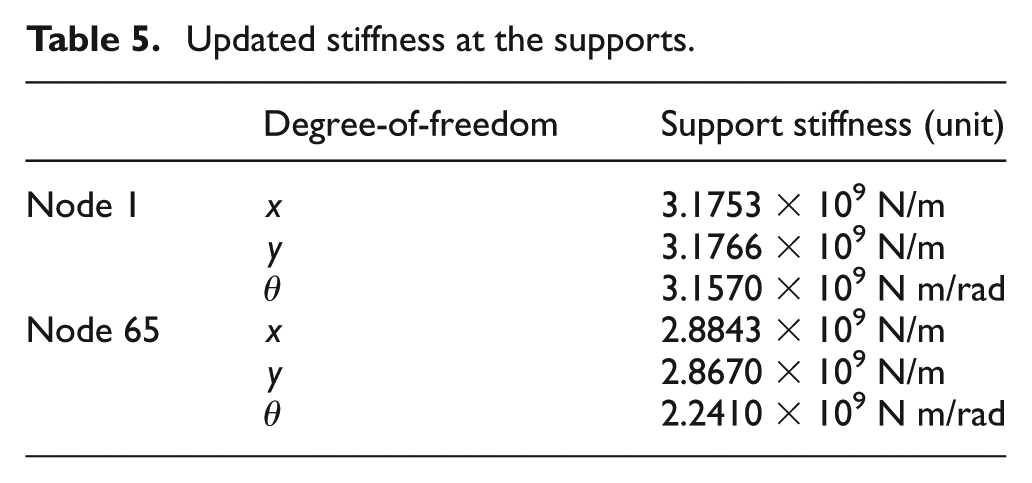
Tables 3 and 4 show the measured and analytical frequencies after updating, and modal assurance criterion (MAC) values before and after updating. It is found that the frequencies from the analytical finite element model after updating are very close to the measured ones and the MAC values of the first seven modes are almost equal to unity. Table 5 shows the updated stiffnesses of supports at Nodes 1 and 65 of the frame structure. Figure 7 shows the measured response and calculated one at Node 13(x) from the finite element model after the second-round updating. The relative error between these two responses is 2.31% for the first 2 s. It can be concluded that the updated model matches the experimental model well in both the modal information and the vibration responses. This updated finite element model is then used as the baseline model in the following studies of dynamic response reconstruction and damage identification. The stiffness reduction in a specific element can be identified as the change in the elemental stiffness factors with respect to the baseline model.
Measured and updated frequencies.
MAC values before and after updating.
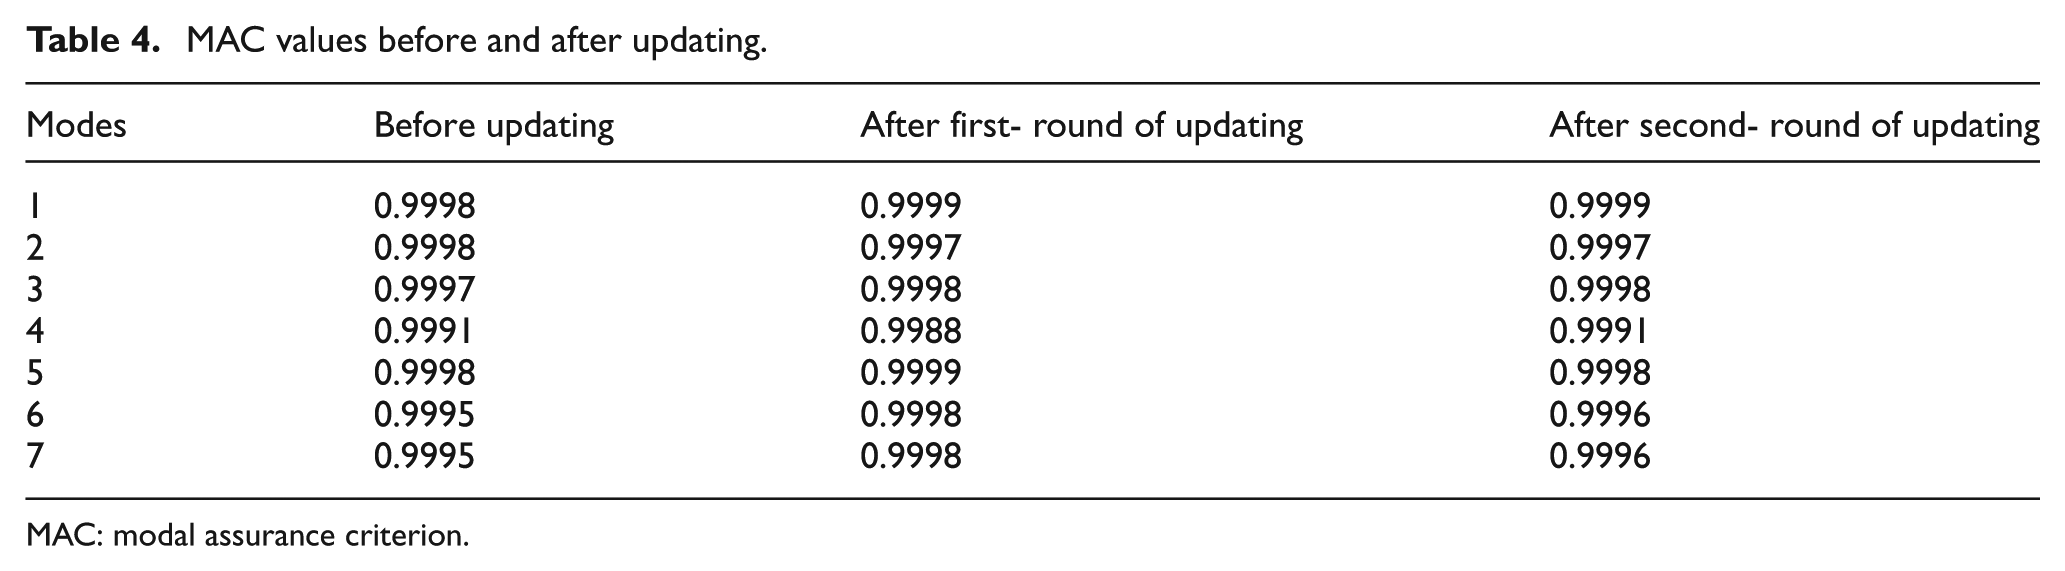
MAC: modal assurance criterion.
Updated stiffness at the supports.
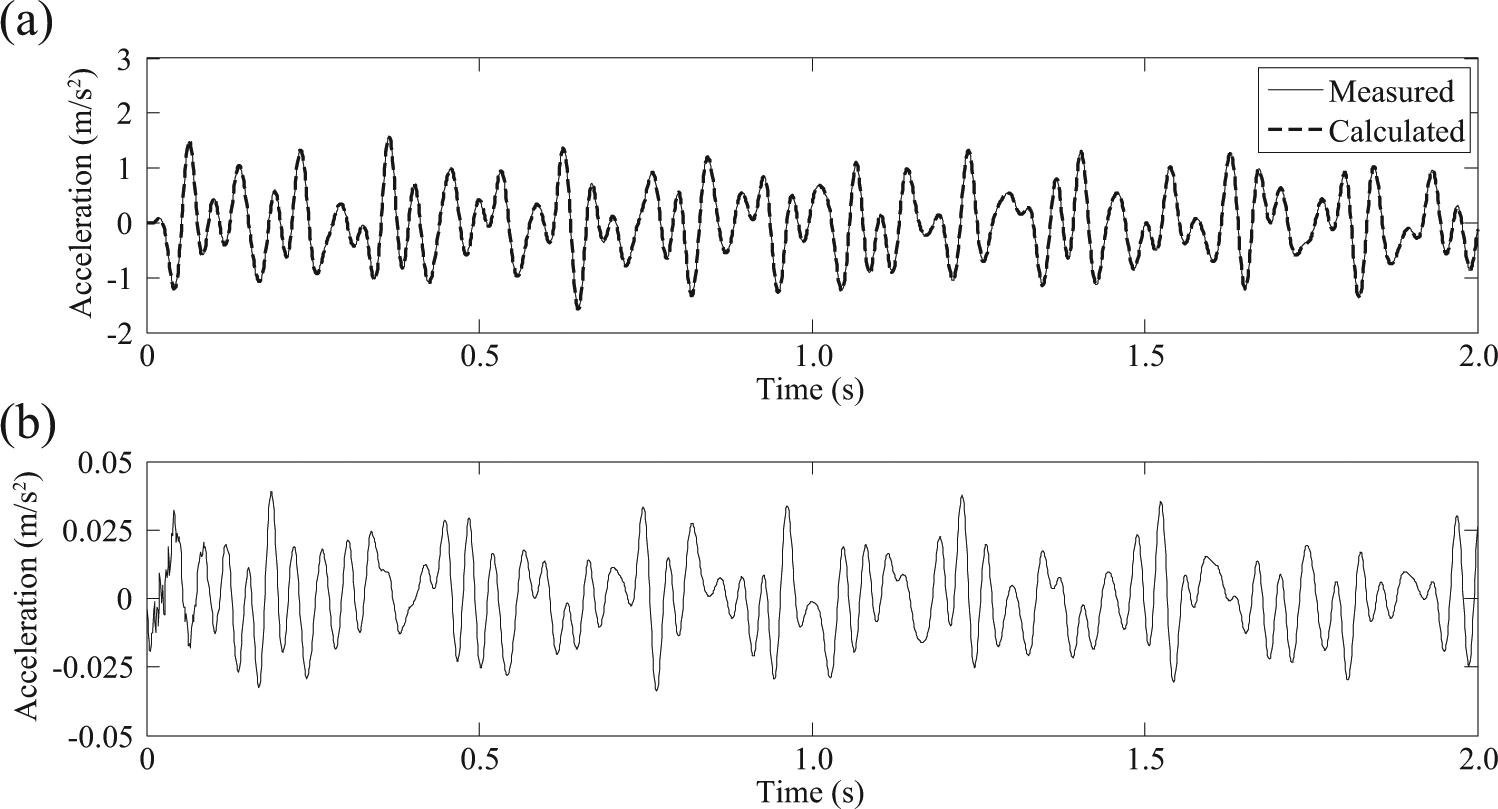
Measured and calculated responses at Node 13(x) after updating: (a) measured and calculated responses and (b) error between the measured and calculated responses.
Response reconstruction in intact model
Figure 8 shows the target substructure adopted for this study and the external excitation locates at the top of the frame structure. The target substructure includes the 3rd to 7th storeys of the frame with 43 nodes and 46 elements.
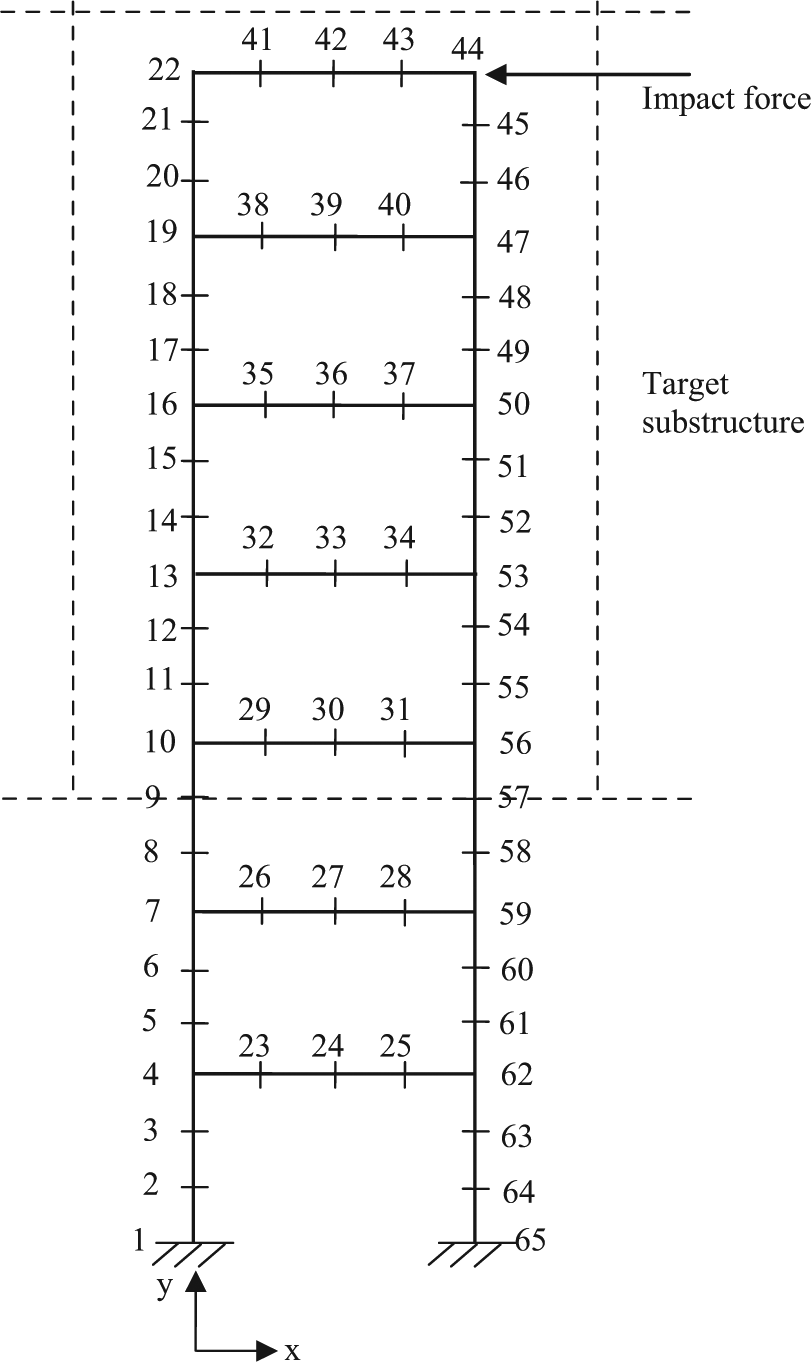
The target substructure for response reconstruction in the intact model.
Case A: external excitation available
When only the finite element model of the substructure is available and the number of measurements in the first-set is equal to or larger than the number of interface forces of the substructure, equation (17) can be used to conduct the response reconstruction in the substructure. The target substructure as shown in Figure 8 has six interface forces, and therefore, at least six measurements should be included in the first-set response vector. Recorded response data from six sensor locations at Nodes 10(x), 13(x), 19(x), 47(x), 50(x), and 53(x) are taken in the first-set response vector to predict the second-set response at Node 16(x). The measured hammer impact force is used in the response reconstruction. The sampling rate is 1000 Hz and sampled data within 1 s are used. Figure 9(a) and (b) shows the response reconstruction result and the error vector between measured and reconstructed responses, respectively. It can be noted that the reconstructed response almost overlap with the measured one with a relative error less than 3.53%, indicating the response reconstruction accuracy is good.
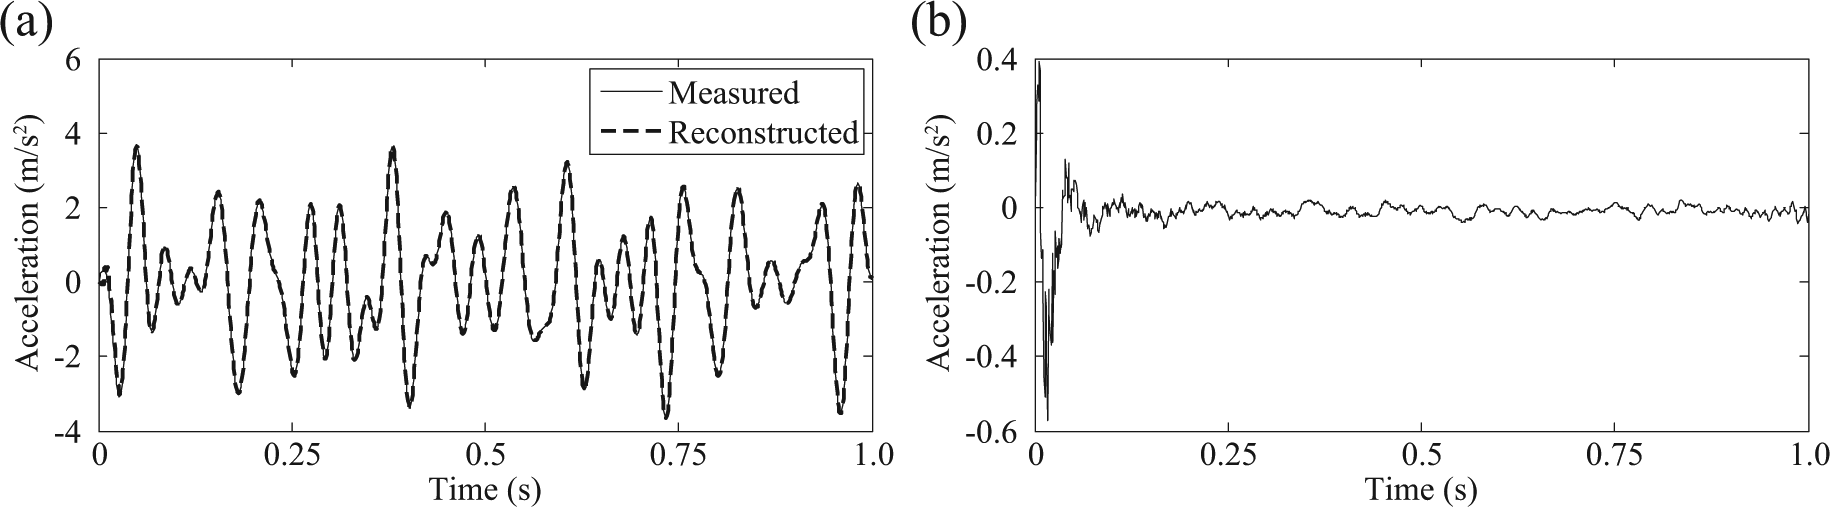
Measured and reconstructed responses in the second-set response vector (Case A): (a) response in the second-set from wavelet-domain method and (b) error in the response reconstruction.
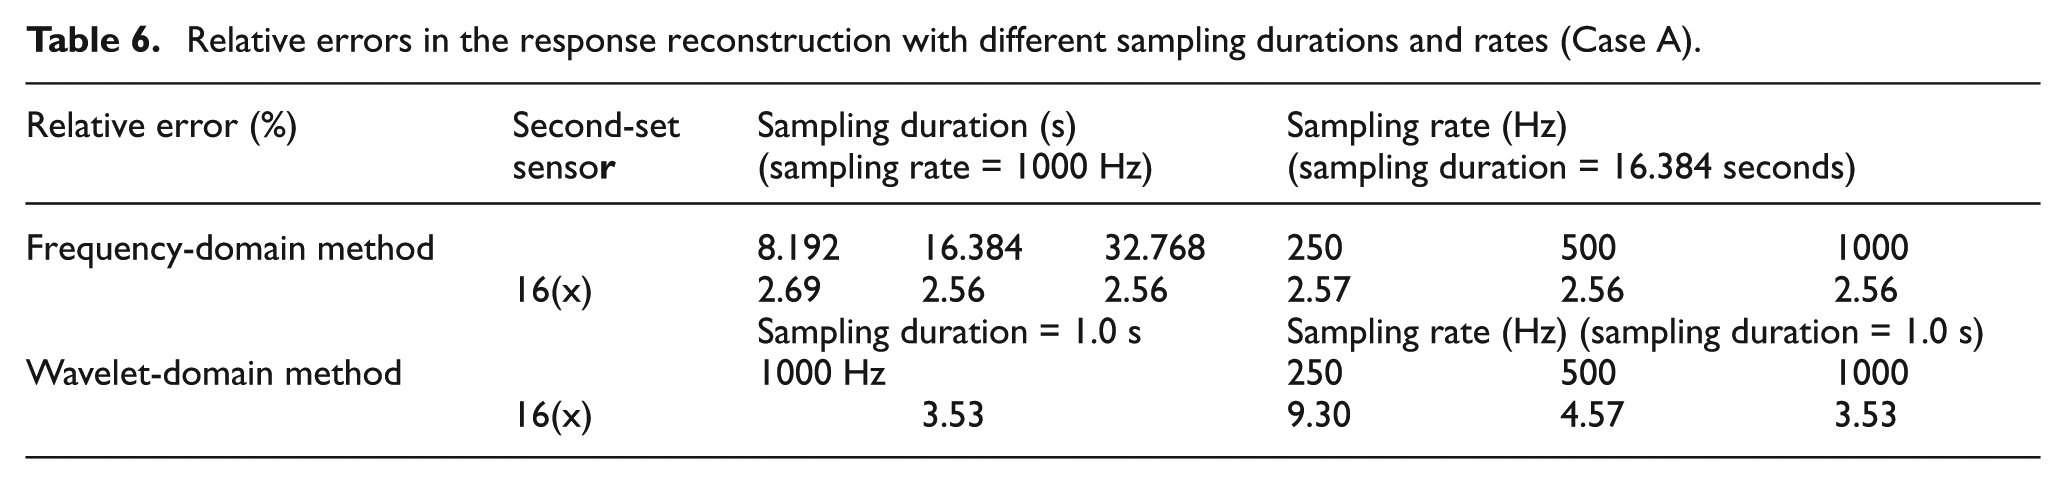
Several important factors associated with the substructure response reconstruction, for example, sampling duration and sampling rate, are investigated to see how they affect the response reconstruction accuracy. When investigating the effect of sampling duration, the sampling rate is kept constant at 1000 Hz. When the sampling rate varies, the sampling duration is equal to 16.384 s. However, only the reconstruction errors within the first 1-s data are calculated with the wavelet-domain response reconstruction due to the intensive computational load for a long time period. Table 6 shows the relative errors in the response reconstruction results with different sampling rates and durations. Compared with the response reconstruction with frequency-domain method, 23 the presented response reconstruction technique in wavelet domain has a good accuracy with the sampling rate equal to 1000 Hz. For the cases with 250 Hz and 500 Hz, the response reconstruction with wavelet-domain method has larger errors than frequency-domain method. It can be observed from Figure 9 that the errors are mainly located at the beginning of signals as oscillations usually due to the discontinuity of measured data for the analysis and the error in the calculation of pseudo-inverse in equation (18). This also contributes the relatively high errors for the wavelet-domain response reconstruction with a lower sampling rate.
Relative errors in the response reconstruction with different sampling durations and rates (Case A).
Case B: external excitation not available
When the external excitation is not available, the response reconstruction can be conducted by taking both the external force and interface forces as unknown excitations to the substructure. It should be noticed that the number of measured responses in the first-set should be larger than the sum of the external excitations and interface forces on the substructure in this case. In this study, there are one impact force and six interface forces on the substructure. A sensor placement configuration is adopted with seven measurements in the first-set at Nodes 10(x), 13(x), 19(x), 22(x), 47(x), 50(x), and 53(x), and one measurement in the second-set at Node 16(x). The sampled data in 1 s with the sampling rate 1000 Hz are used. Measured and reconstructed responses in the second-set are shown in Figure 10(a). The error vector in the response reconstruction result is shown in Figure 10(b). It demonstrated that a good accuracy of response reconstruction is achieved with a relative error of 2.58%. The effect of sampling duration and rate is investigated and the relative errors between measured and reconstruction responses are shown in Table 7. It can be found from Table 7 that both frequency and wavelet-domain methods give good response reconstruction accuracy in this case at different sampling durations and rates.
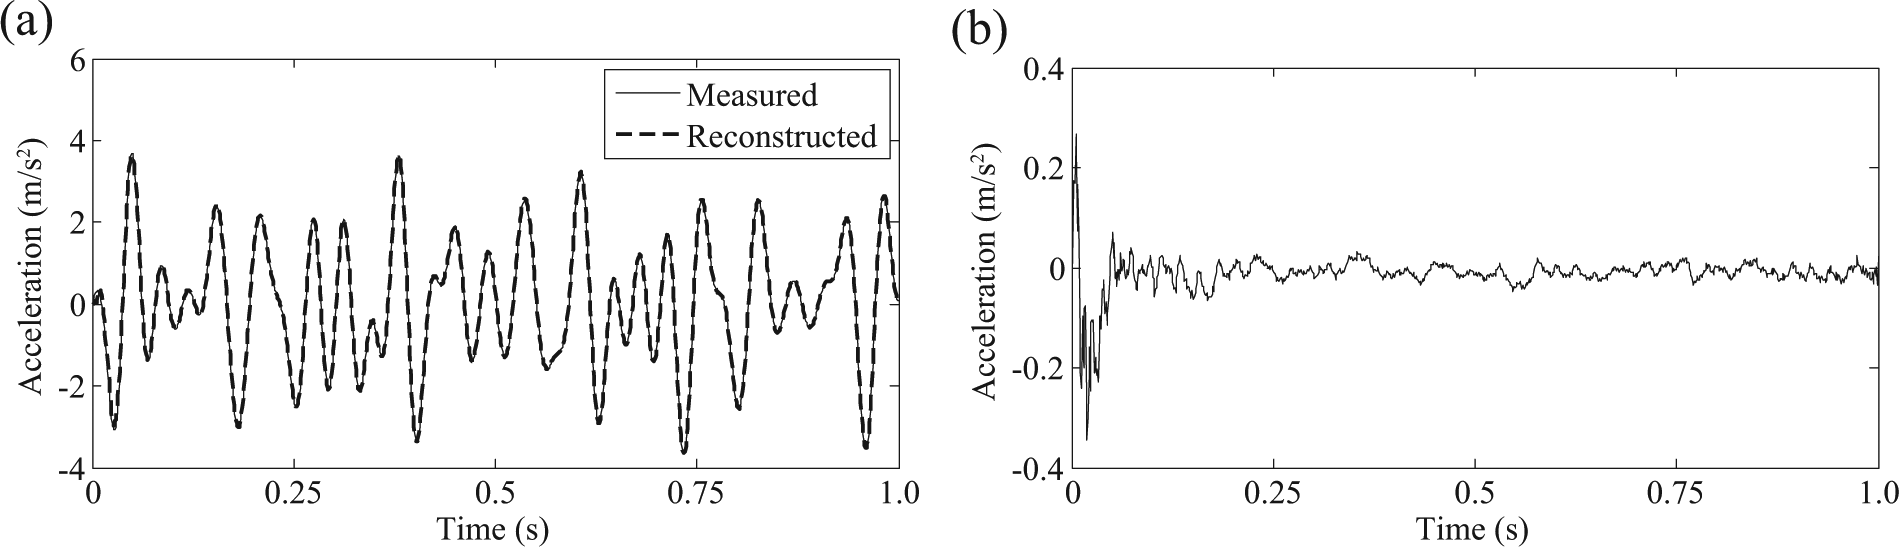
Measured and reconstructed responses in the second-set response vector (Case B): (a) response in the second-set from wavelet-domain method and (b) error in the response reconstruction.
Relative errors in the response reconstruction with different sampling durations and rates (Case B).

Substructure damage identification
Figure 11 shows the target substructure adopted for damage identification. A total of 68 elements are involved in the inverse analysis to investigate the robustness of the presented substructure damage identification approach. The length of each finite element in the frame structure is 100 mm, and the damage was introduced in the element as two cuts with width
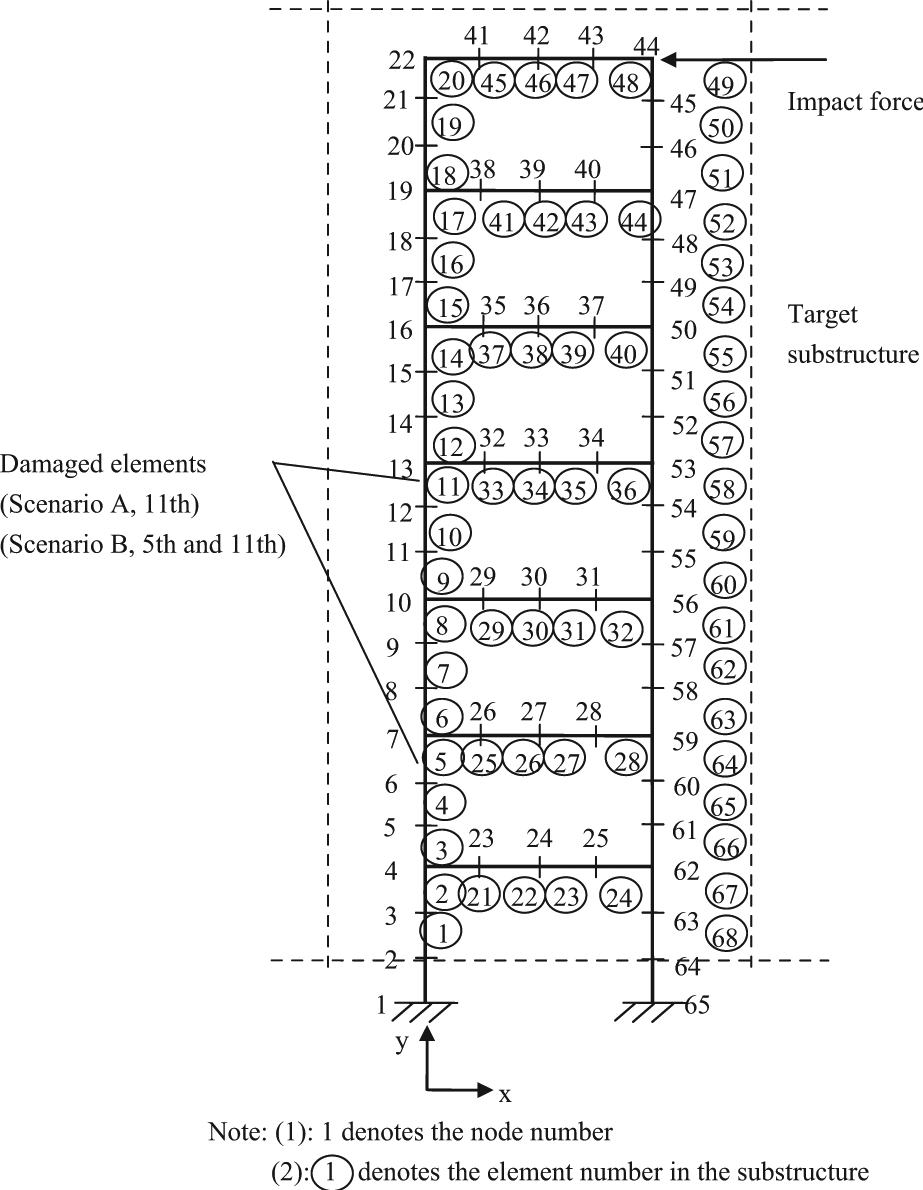
Finite element model of the target substructure in the damage identification.
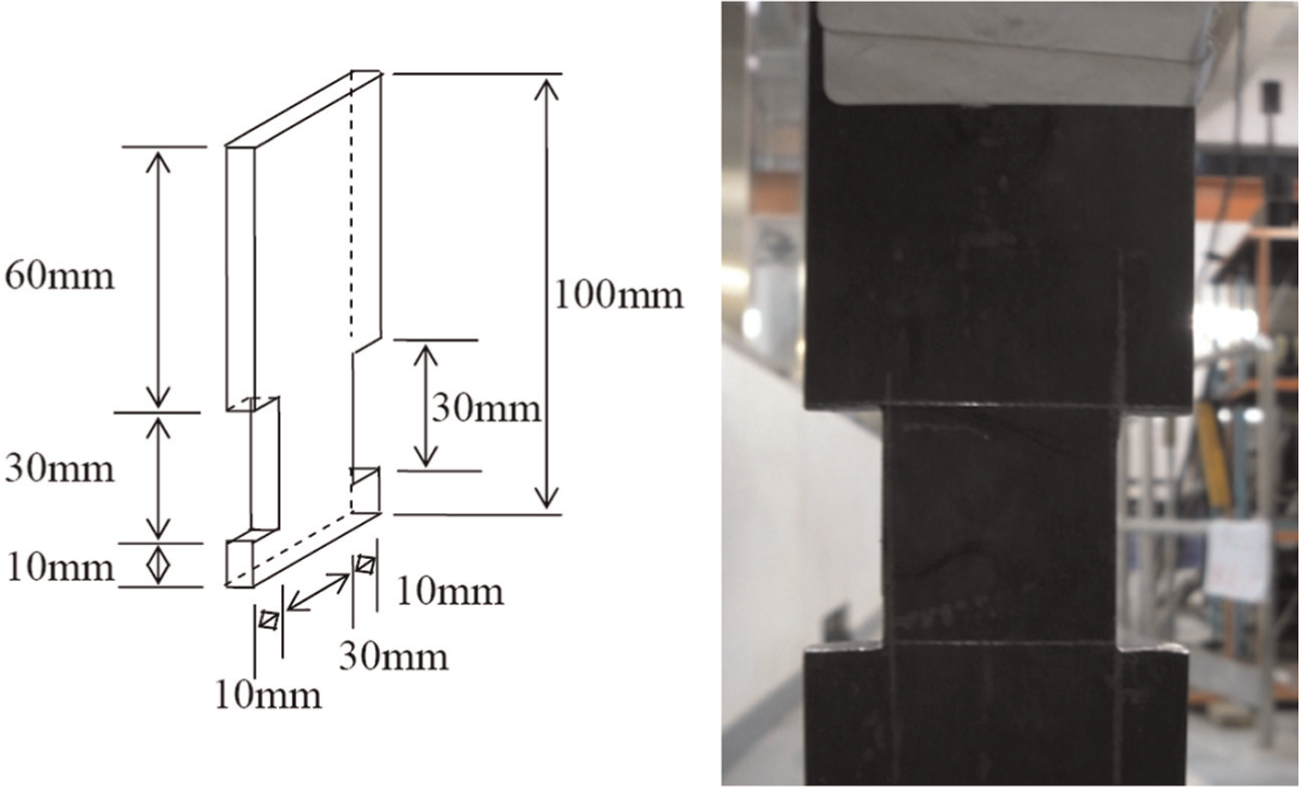
Width and depth of the cut in the damaged element.
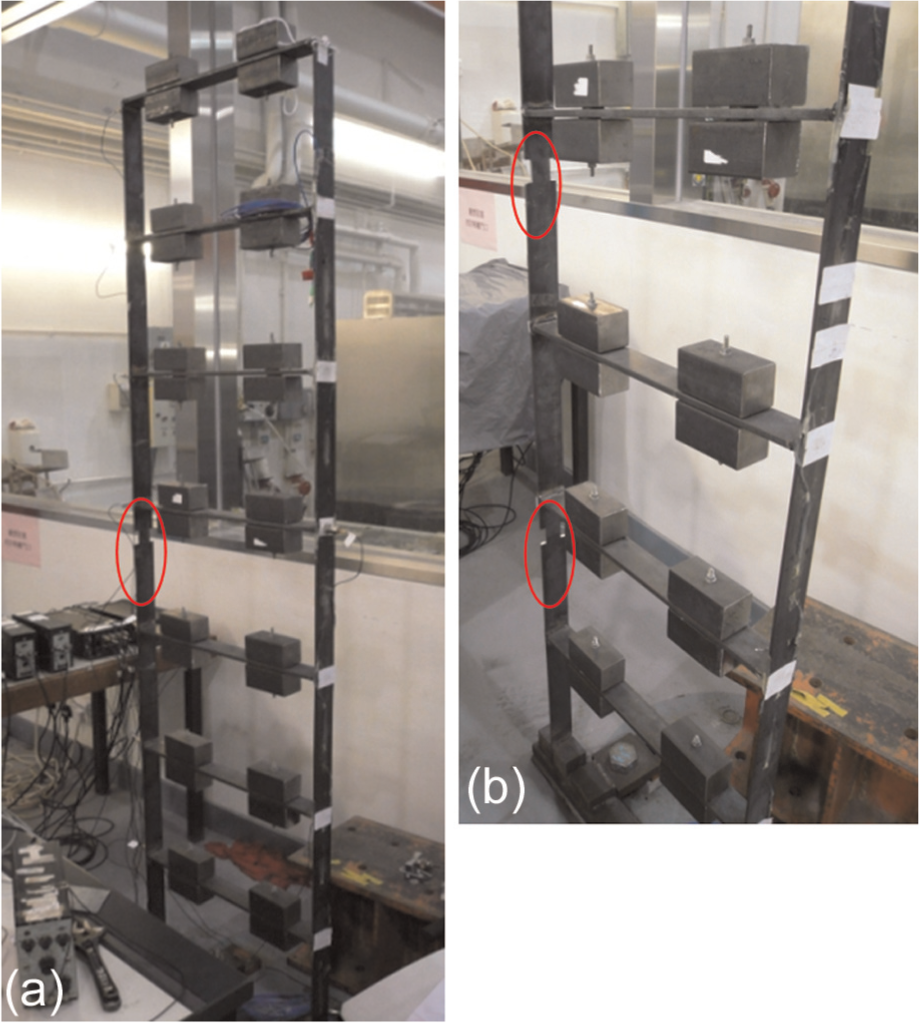
Introduced damage scenarios in the frame structure: (a) Damage Scenario A and (b) Damage Scenario B.
Scenario A
Two sensor placement configurations listed in Table 8, denoted as SP1 and SP2, are defined in this study. The number of measurement in the first-set response vector of SP1 and SP2 is eight, which is larger than the sum of the number of interface forces and the number of hammer impact force. One sensor in the second-set of SP1 is placed close to the damage location and two sensors in the second-set of SP2 are deployed far away from the damaged element. These two sensor placement configurations are designed to investigate the performance of the proposed damage identification approach with different sensor placements in the second-set. The first two natural frequencies of the damaged frame structure with a single damaged element are extracted from the Fourier spectrum of the measured responses as 2.54 Hz and 7.66 Hz, and the first two damping ratios are computed as 0.0019 and 0.0013 for the first two modes, respectively. Rayleigh damping is assumed in this study, and the experimental Rayleigh damping coefficients are computed.
Sensor placement configurations of Scenario A.
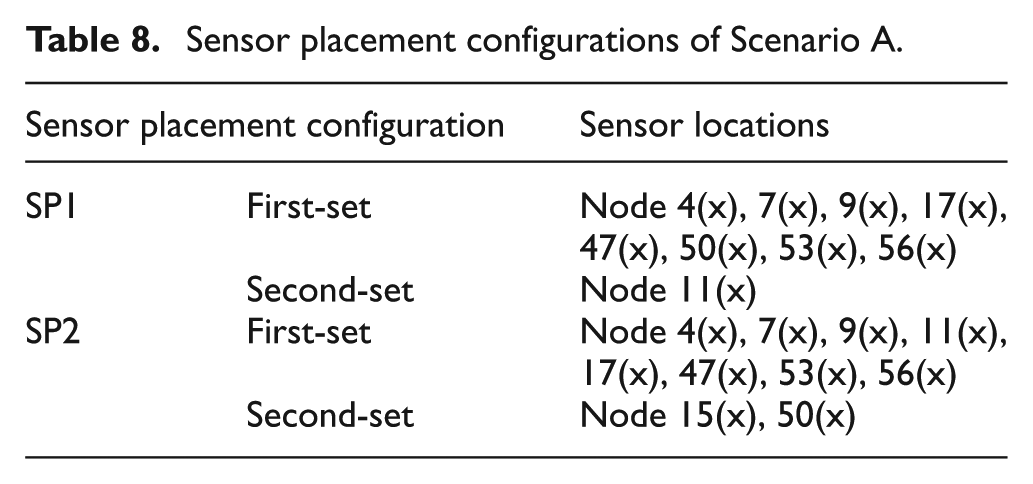
Figure 14 shows the identification results with SP1 and SP2 for Scenario A. The location of the damaged element can be detected clearly in the 11th element from both sensor placements and the identified extents are 10.67% and 6% from SP1 and SP2, respectively. SP1 gives better and more accurate identification results, and it is observed that more false positives exist in the identification results with SP2 because the sensors in the second-set of SP2 are further away from the damaged element. It is found that less number of iterations (6 iterations) is required with SP1 for convergence compared with SP2 (8 iterations) as the sensor locations in the second-set of SP1 are closer to the damaged element. It can be observed from the identification results with SP1 that a false identification is identified at the 12th element which is around 5% because this element is just close to the true damaged element. For the identification results with SP1, a false identification around 4.5% is located at the 58th element, which is the same floor of the damage but in the opposite column. The experimental model is close to a shear-type building with both columns contributing to the storey stiffness of the frame structure, but it is not an exact one. This can be verified from the higher local modes of the frame structures that columns provide the storey stiffness instead of bending. These mode shapes are not shown in this article due to page limit, and such behavior would explain why the stiffness in the element at the same floor but on the other column is wrongly identified as damaged. It should be noted that more than 2 h are required for an iteration with a Core 2 2.4G computer of 8G memory.
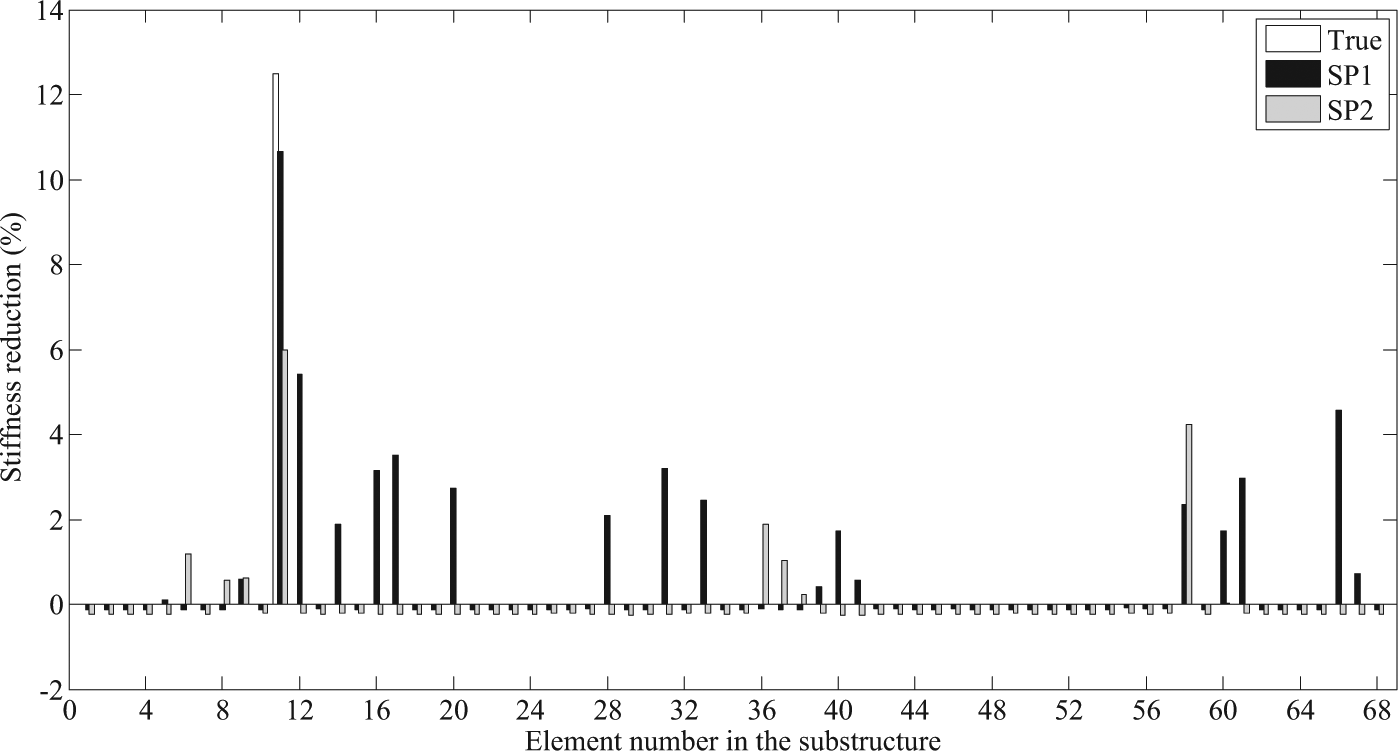
Damage identification results of Scenario A.
Scenario B
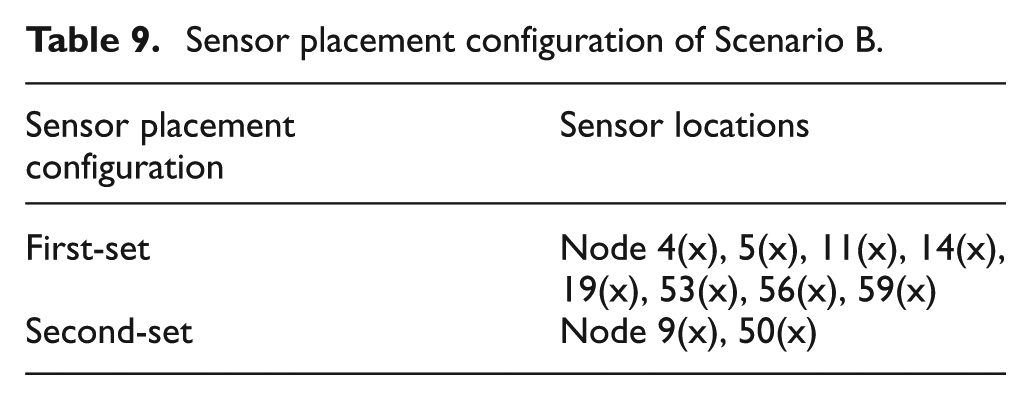
The sensor placement in Table 9 is used for damage identification for Scenario B. The sensor location in the second-set response vector is not close to the true damaged elements. The first two natural frequencies of the frame structure with multi-damage are, respectively, 2.54 Hz and 7.63 Hz, and the first two damping ratios are computed as 0.0016 and 0.0013, respectively. Very minor changes are observed in these frequencies and damping ratios with one more damaged element introduced in the frame structure indicating the stiffness reductions are not so significant on the structure. Figure 15 shows the identification results with nine iterations. The identified extents of local damages in the 5th and 11th elements are 11.7% and 9.42%, respectively, which are close to true values. Several false identifications are located in the 3rd, 8th, 29th, 40th, and 63rd elements. It should be noticed that these elements are mainly distributed in the 2nd and 3rd storey of the frame structure.
Sensor placement configuration of Scenario B.
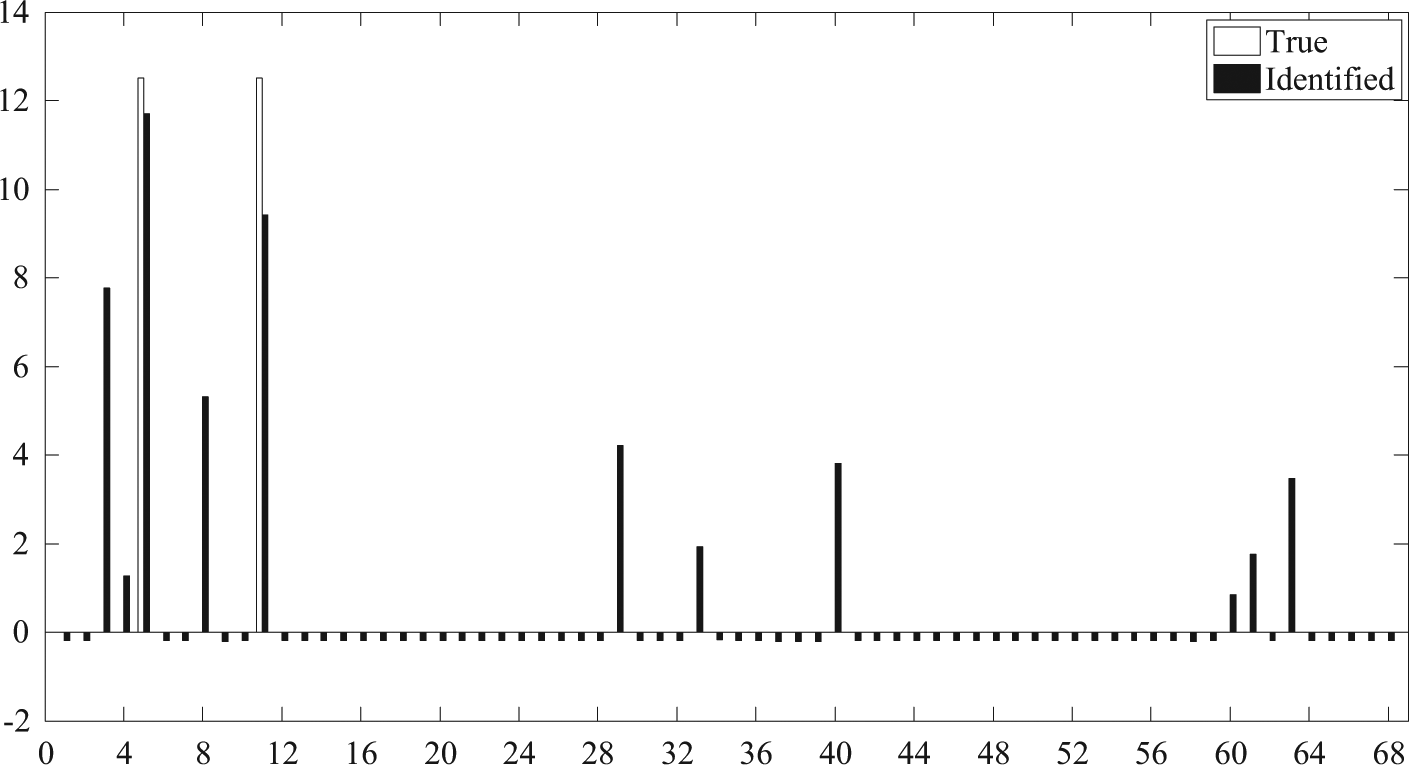
Damage identification results of Scenario B.
Experimental studies demonstrate that the presented wavelet-domain response reconstruction has a good accuracy with different sampling durations and rates, and the substructure damage identification approach can identify the damage locations accurately with a close estimation on the damage extents.
Concluding remarks
This article presents experimental verifications on a substructural response reconstruction and damage identification approach. The response reconstruction is based on the transmissibility matrix in wavelet domain, which is formulated with the UIR function. The damage identification is conducted by minimizing the difference between the measured and reconstructed response vectors. Measured acceleration responses from the target substructure in the damaged state and the finite element model of the initial intact substructure are used in the identification algorithm. The information of responses and forces at the interface DOFs is not required. A dynamic response sensitivity-based method is used for the damage identification.
A 7-storey steel frame is fabricated in the laboratory and measured acceleration response data from hammer tests are used for the initial finite element model updating. The updated finite element model is considered as the baseline model and two damage scenarios are introduced in the experimental tests, namely, a single damage scenario and a multi-damage scenario. Measured response data from the damaged substructure are used for the damage identification. Good accuracy of response reconstruction in a target substructure is achieved. Identification results demonstrated local damages in the substructure are identified effectively. The locations of the damage are detected accurately, and the stiffness reductions in the damaged elements of the target substructure are identified close to the true values but normally underestimated compared with the actual damage values. This is probably because the designed frame structure is close to a shear-type building, and the stiffness at the same storey but on the other column is also identified with a small stiffness reduction.
Footnotes
Declaration of conflicting interests
The authors declare that there is no conflict of interest.
Funding
The authors gratefully acknowledge the financial support provided by Australia’s Cooperative Research Centre (CRC) for Infrastructure and Engineering Asset Management (CIEAM-II, Project No. 3104), “Supporting Infrastructure Management by Combining Sensors and Asset Information Models,” and Australian Research Council Discovery Early Career Researcher Award DE140101741, “Development of a Self-powered Wireless Sensor Network from Renewable Energy for Integrated Structural Health Monitoring and Diagnosis.”