
Abstract
Tomographic methods such as electrical impedance tomography have tremendous potential for electrical conductivity-based structural health monitoring, damage identification, strain sensing, and environmental/corrosion sensing as evidenced by a growing body of literature employing electrical impedance tomography. However, electrical impedance tomography also has important limitations preventing its widespread acceptance such as requiring burdensome computational resources not available to on-board structural health monitoring and often difficult to obtain initial estimates of conductivity distributions. We herein overcome these limitations by developing a novel electrical impedance tomography reconstruction algorithm with substantially abated computational requirements and independent of initial estimates. This method is predicated on the difference between two sets of observed voltages being due to a difference in resistivity that is constrained to be a summation of two-dimensional sine waves. This method is first explored analytically and then demonstrated experimentally on three different materials. This approach is an important advancement to the state of the art because it overcomes critical limitations of electrical impedance tomography thereby substantially facilitating the viability of electrical impedance tomography for real structural health monitoring applications.
Keywords
Introduction
Electrical impedance tomography (EIT) has recently garnered considerable attention for applications in structural health monitoring (SHM) such as damage identification in composite or meta-materials,1–9 damage identification in cementitious structures,10–14 damage identification in thin films,1,2,11,15,16 strain sensing,16,17 and environmental/corrosion sensing.15,18 The supposition in such applications is that changes in electrical conductivity coincide with mechanical perturbations such as loss or removal of material, strain, or fracture. Conductivity changes are then imaged and mechanical perturbations located via EIT. This type of tomography has considerable potential for SHM applications because it is low-cost, non-invasive, and can spatially resolve both the location and geometry of the mechanical perturbation.
Quite generally, conductivity-based health monitoring methods that employ EIT can be categorized by the sensing element. That is, either the structure has self-sensing capabilities itself or some sensing layer/coating is applied to the structure. We first discuss the use of EIT on structures with self-sensing capabilities and then structures with sensing layers/coatings.
Utilizing structures for self-sensing was initially approached in fiber-reinforced composites constructed of conductive fibers such as graphite or carbon19–23 using resistance change or interpolation methods. Baltopoulos et al. 3 extended this idea to tomographic imaging and employed EIT on carbon fiber composites. Thostenson and Chou 24 further extended the concept of conductivity-based self-sensing to fiber-reinforced composites manufactured with non-conductive fibers through the addition of nanofillers to the matrix material. Here, the nanofillers act as an integrated sensing network. That is, because nanofillers depend on well-connected nanofiller networks for electrical conductivity, damage that severs the network or strain that reorients the nanofillers will manifest as a conductivity loss or change. Considering first nanocomposites without reinforcing fibers, Tallman et al. 7 used EIT for through-hole detection in a carbon nanofiber (CNF)/epoxy coupon. Tallman et al. 17 also successfully demonstrated the ability of EIT to detect strain-induced conductivity changes in highly flexible CNF/polyurethane (PU) nanocomposites. Next, considering the use of EIT on nanocomposites with reinforcing fibers, Tallman et al. 8 employed EIT to locate both through-hole damage and impact damage in glass fiber/epoxy laminates manufactured with carbon black (CB) filler via EIT. Baltopoulos et al. 4 investigated the use of tomography for the identification of through-hole and indentation damage in glass fiber/epoxy laminates manufactured with carbon nanotube (CNT) fillers. And, similar to Tallman et al., 8 Gallo and Thostenson 5 also later explored EIT for through-hole and impact damage identification in glass fiber/epoxy laminates manufactured with nanofillers albeit with CNT nanofillers and more electrodes.
A complete discussion of conductivity-based SHM must include recent resistance change methods. This is particularly pertinent for nanofiller-modified composites because these material systems have been studied for self-sensing SHM from both tomographic and resistance change perspectives. Unlike tomographic methods which make use of physics-based models to estimate a conductivity distribution, resistance change methods measure the resistance between measurement points before and after damage. Damage is then correlated with large resistance changes. Resistance changes between electrodes can also be weighted and interpolated to provide a more continuous mapping. Compared to tomographic methods, resistance change methods provide less spatially rich data on damage location and geometry but have the benefit of significantly reduced computational overhead. Naghashpour and Van Hoa25,26 located both through-hole and impact damage in both glass fiber and carbon fiber composites manufactured with nanocomposite matrices via resistance change methods. Zhang et al. 27 developed a method for resistance mapping based on weighted interpolation of resistance changes measured both in-plane and through-thickness measurements and located damage in glass fiber laminates modified by CB. Viets et al. 28 located damage in glass fiber/epoxy laminates manufactured with CB and copper chloride filler via interpolated resistance change methods. Finally, Gungor and Bakis 29 utilized electrodes spanning the length of glass fiber/epoxy laminates modified with CB filler to take through-thickness measurements in order to locate indentation damage.
The use of tomography for SHM on self-sensing structures is not limited to composite materials. EIT has been studied for use on cementitious structures to detect damage and moisture.10,13,14,18 Hou and Lynch 10 first explored strain and bending-induced crack damage in cementitious structures via surface imaging using EIT. Karhunen et al. 14 identified steel rods, steel bars, and plastic plates in a three-dimensional EIT process. Karhunen et al. 13 also detected cracks and crack-like defects in cement structures. Finally, Hallaji et al. 18 used EIT to monitor unsaturated moisture flow in cementitious materials.
Turning our attention now to the use of tomography on sensing layers and coatings, Hou et al. 15 and Loh et al. 16 fabricated CNT sensing skins using layer-by-layer fabrication. Applied to substrates, impacts, strains, mechanical etching, and pH buffers were adeptly identified via EIT-imaged conductivity changes. Loyola et al. 1 extended this sensing layer approach to glass-fiber-reinforced composites in which the sensing layers were spray-deposited directly upon the glass fiber mats. EIT was then employed to locate both through-hole and impact damage. Hallaji et al. 12 applied copper paint to cementitious structures and used EIT with total variation regularization to generate high-quality images of crack damage. Hallaji and Pour-Ghaz 11 also explored the use of silver paint as a sensing skin for damage detection and SHM in cementitious structures via EIT.
The preceding discussion demonstrates quite thoroughly that there is indeed a growing interest in tomography for conductivity or resistivity-based SHM and sensing. However, EIT has important limitations detrimental to its widespread embrace. First, it is computationally expensive. This imaging technique requires the formation and inversion of a large, non-sparse matrix known as the sensitivity matrix. Many on-board health monitoring modules simply will not have sufficient computational resources to perform such memory-intensive operations except on exceedingly coarse meshes resulting in rough, indistinct images. While some algorithms such as the maximum a priori (MAP) method can be solved using a sensitivity matrix calculated offline, these methods still require a suitable initial estimate of the conductivity distribution. This brings to light a second important limitation of EIT for SHM, the necessity of an initial estimate of the conductivity distribution. Especially for nanocomposite-based structures with low nanofiller volume fractions, obtaining an accurate estimate of the conductivity distribution is a formidable challenge. This is because nanocomposite conductivity follows an exponential trend as a function of filler volume fraction with significant changes in conductivity near the percolation threshold. Therefore, slight variations in filler volume fraction near the percolation threshold can result in substantial changes in conductivity. There is, however, considerable interest in producing nanocomposites near the percolation threshold because the greatest strain sensitivity is often achieved there. Furthermore, the accuracy of initial conductivity or resistivity estimates may be further diminished by factors such as non-uniform nanofiller dispersion.
In light of the interest in EIT for SHM and the outlined limitations, we identify potential to advance the state of the art. That is, we herein develop a novel EIT algorithm that requires significantly less computational effort and does not require an initial conductivity distribution estimate. These advancements will enable EIT to be employed in venues such as on-board SHM with limited computational resources and uncertain conductivity distributions. Especially considering the computational ease of the previously described resistance change methods for SHM, tomographic methods very much need advancements such as we develop in this research in order to maintain viability for on-board SHM. In the following, the standard EIT formulation is first presented to provide the reader with background on how our method is novel. Our sine wave constrained reconstruction method is then detailed. Next, the potential of our approach is explored analytically. The accuracy of our approach is then demonstrated by making use of experimental data previously published by the authors. This demonstration concretely proves that our method can be applied to several different materials thereby solidifying its independence from an initial estimate. And, finally, we end with a brief summary and conclusions.
Formulation of sine wave constrained EIT
Forward problem
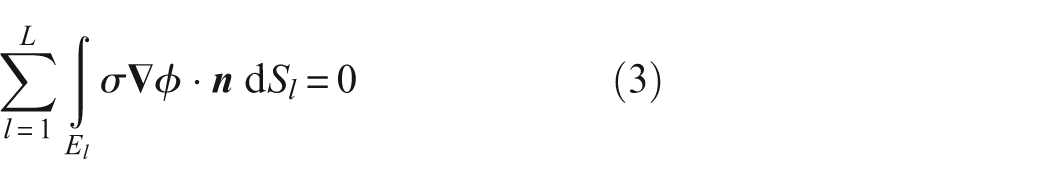
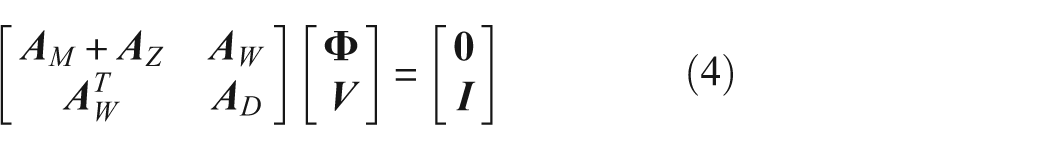
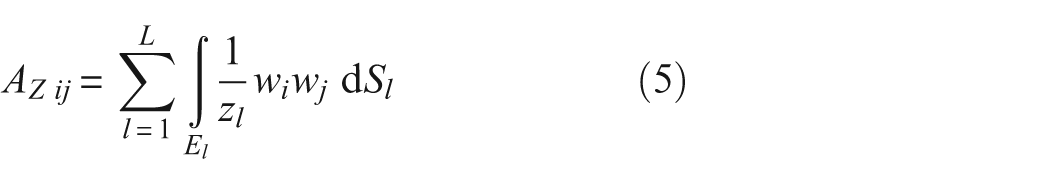
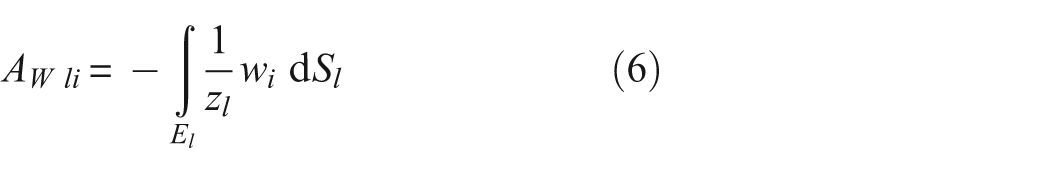
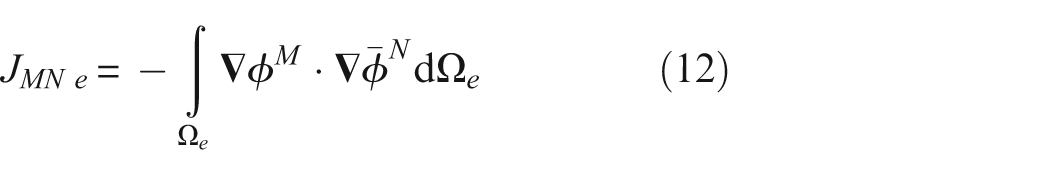
EIT endeavors to find the conductivity distribution of a domain that minimizes the difference between a vector of experimentally measured boundary voltages and another vector of analytically predicted boundary voltages. 30 The process of analytically predicting boundary voltages for a given conductivity distribution is known as the forward problem. Procedurally, current is injected between neighboring electrode pairs while the resulting voltage is measured between electrode pairs not actively involved in the current injection. This process is depicted in Figure 1. This injection and measurement process continues until all electrode pairs have received a current injection. Computationally, the forward problem begins with Laplace’s equation which governs the relationship between currents and voltages for steady-state diffusion as shown below in equation (1).

Here,

Above,
In the preceding,
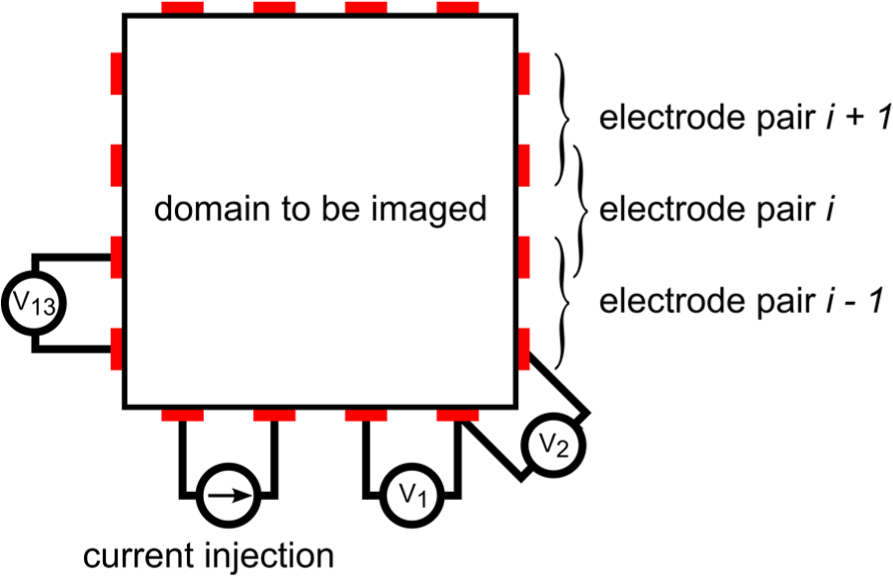
Schematic representation of EIT measurement process. Current is injected between neighboring electrode pairs while the resulting voltage is measured between neighboring electrode pairs not actively involved in the injection. All electrode pairs receive a current injection.
Standard EIT inverse problem
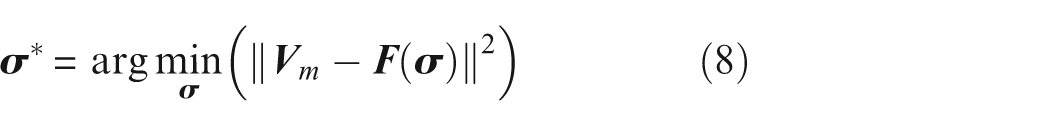
The inverse problem is the process of recovering a conductivity distribution,
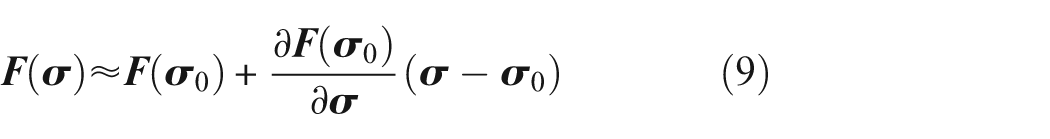
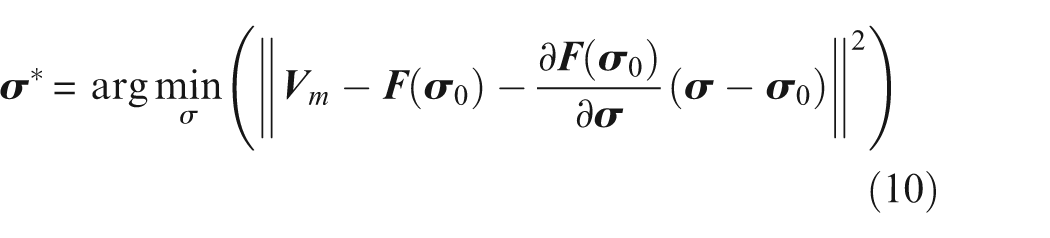
By additionally substituting
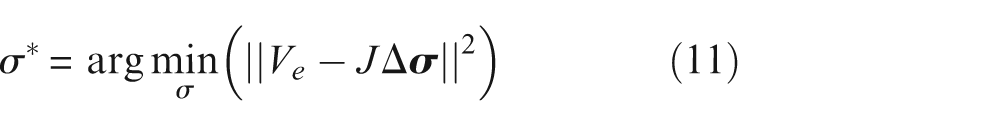
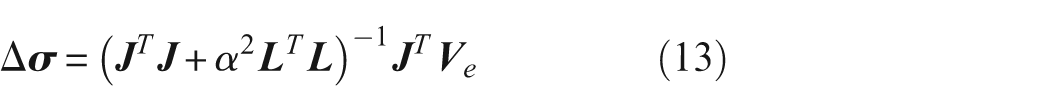
Lastly, the conductivity distribution is updated iteratively as
Sine wave constrained EIT inverse problem
The sine wave constrained EIT method herein detailed endeavors to find an isotropic resistivity distribution that gives rise to an observed change in boundary voltages. It is worth noting that constrained approaches have been explored in medical imaging by making use of data obtained from magnetic resonance imaging
31
and an approximation of the prior covariance matrix by simulated samples of feasible conductivities.
32
Resistivity,

In the preceding equation, the measured or observed voltages,
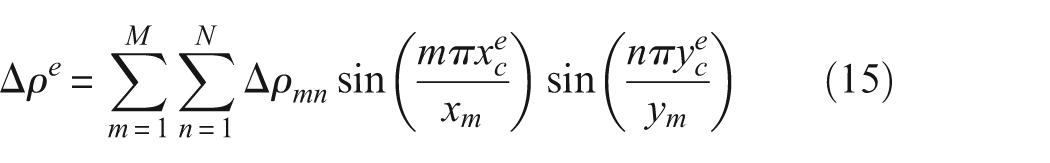
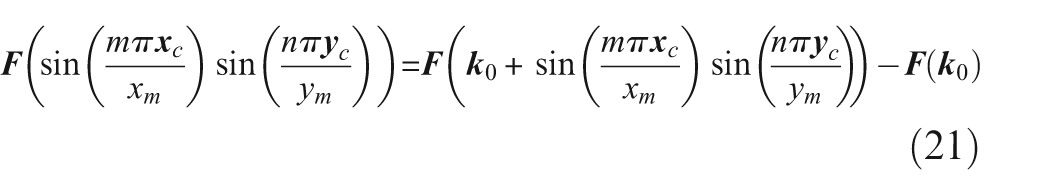
Three key insights are made here. First, we constrain the resistivity distribution to be the summation of a series of two-dimensional sine waves as shown in equation (15) where
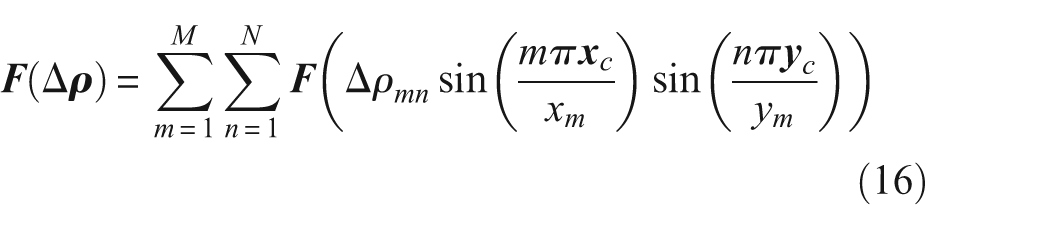
Second, because this formulation is in resistivity, the forward operator can likewise be expressed as a summation as shown in equation (16).
And third, because
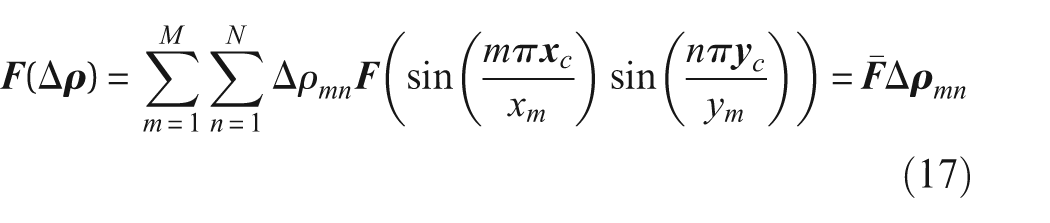
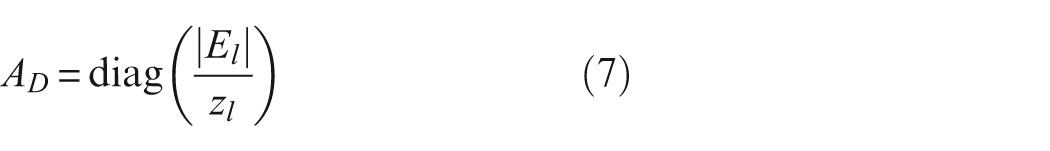
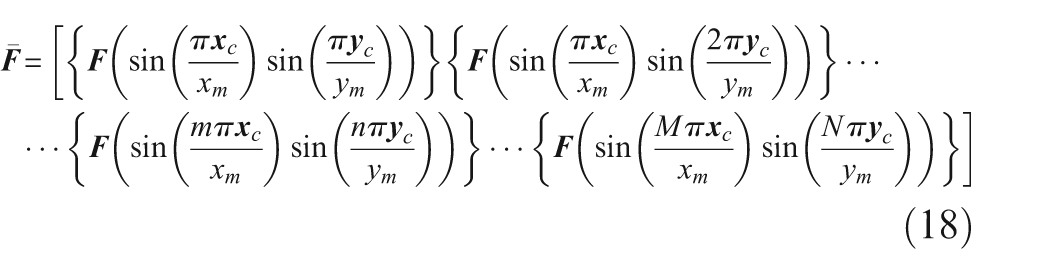
A bar has been placed over the matrix on the right-hand side of equation (17) to distinguish it from the forward operator which returns a vector. The columns of
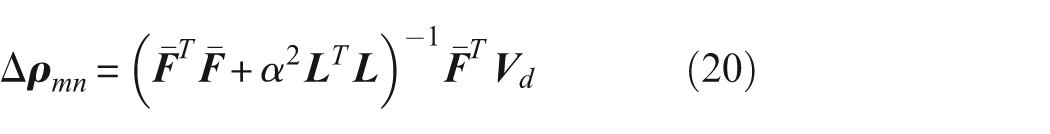
Equation (14) can now be restated as shown in equation (19). Regularization is still employed as shown in equation (20) to penalize highly oscillatory solutions where

The simplicity of equation (19) belies some remarkable aspects of this formulation of the inverse problem. First, the vector to be recovered,
Formation of
While the basic form of
Analytical investigation of sine wave constrained EIT
In order to more thoroughly explore the potential of sine wave constrained EIT, we conduct analytical simulations in which the EIT algorithm endeavors to reproduce the resistivity distribution of a reference finite element mesh. Consistent with good inverse problem practices, the reference mesh is more refined (∼130,000 elements) than the reconstruction mesh (∼2000 elements). This ensures that there exists no assemblage of elements in the reconstruction mesh that can exactly reproduce the actual resistivity distribution of the reference mesh. The initial voltage measurements are made on a mesh of uniform resistivity with ρ = 1000 Ω-m, and the resistivity distribution used to generate the second set of voltage measurements is depicted in Figure 2. The difference between these two sets of voltage measurements is used to form
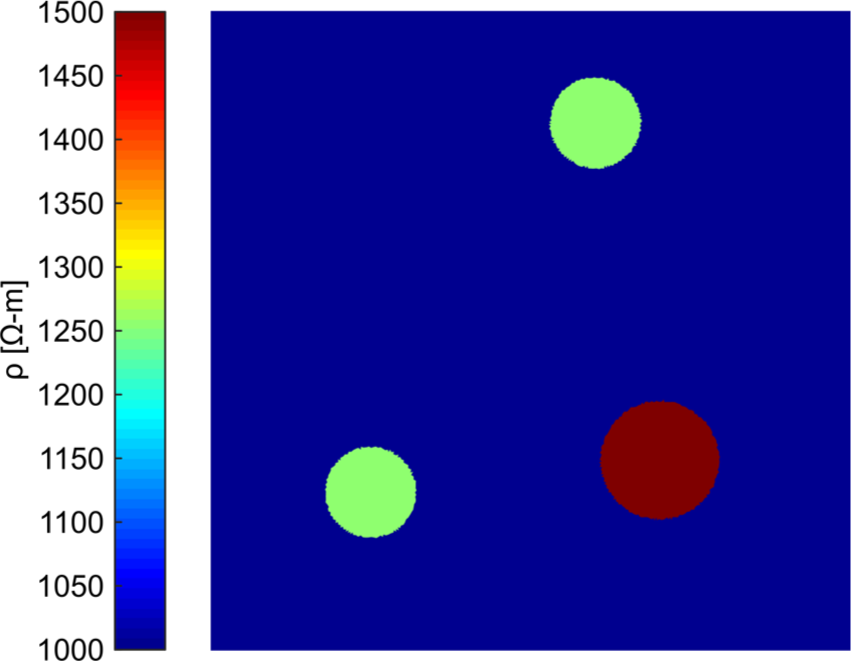
Reference mesh to be reconstructed via the proposed sine wave constrained EIT method. This highly refined mesh uses ~130,000 elements and is a unit square.
A unit current injection is used in these simulations on a unit square domain with 16 electrodes. Simulations are conducted using M = N = 3, 6, 9, 12, 15, and 18. Both the influence of the number of sine waves used and the rank of the matrix to be inverted,
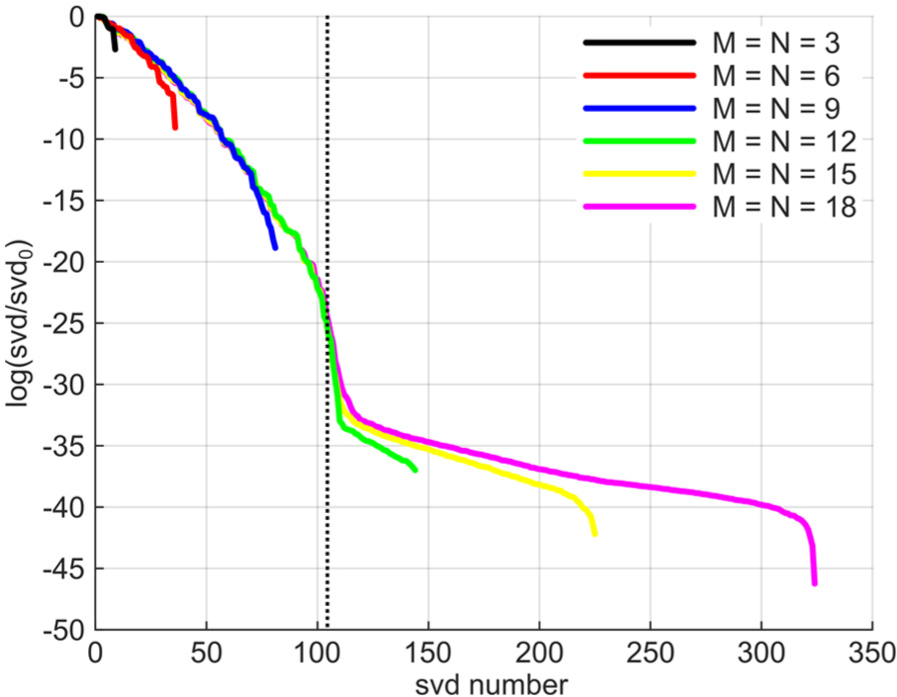
SVD analysis of
It is observed in Figure 3 that the rank of
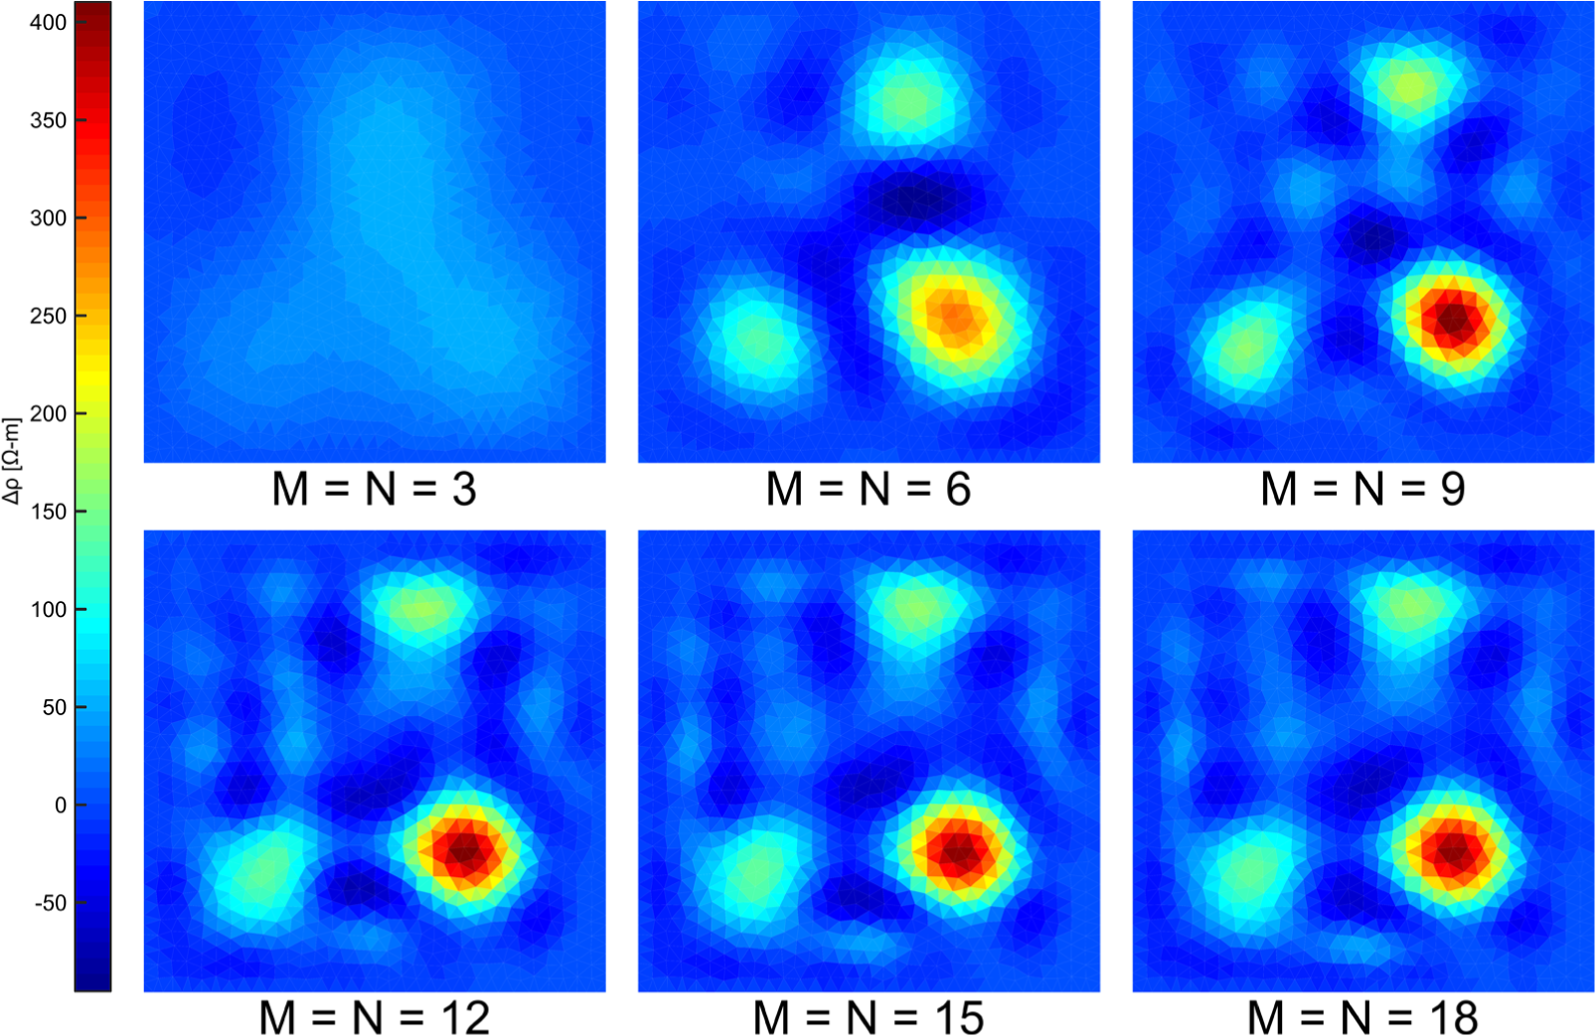
Reconstruction of reference mesh via sine wave constrained EIT with an increasing number of sine waves. Note, first, that with sufficiently many sine waves, the proposed method accurately reproduces the difference between a reference mesh of uniform resistivity and the reference mesh depicted previously. Second, consistent with the results of the SVD analysis, the image quality does not much improve beyond
Experimental verification
The sine wave constrained EIT method is tested experimentally by making use of data published previously by the authors.7,8,17 More specifically, to test the versatility of the proposed method, we consider three different materials with three different resistivity artifacts: through-hole identification in CNF/epoxy,
7
impact identification in a glass fiber/epoxy laminate manufactured with CB filler,
8
and strain identification in CNF/PU.
17
We also demonstrate the ability of sine wave constrained EIT to reproduce resistivity distributions on extremely refined meshes. The purpose of demonstrating our method on such refined meshes is to show that the computational requirements of our sine wave constrained approach are so reduced that images can be produced on exceedingly refined meshes far beyond the capabilities of standard EIT with access to reasonable computational resources. In the following, the number of sine waves used in the reconstruction is selected such that
CNF/epoxy with through-hole damage
First, a CNF/epoxy nanocomposite coupon is considered. This coupon was manufactured with 1 wt% CNFs, measured 54 mm × 52 mm × 5 mm, and instrumented with 16 electrodes. Further manufacturing and experimental details can be found in Tallman et al. 7 A single 6.35-mm-diameter hole was drilled through the CNF/epoxy as indicated by the black circle in Figure 5. We observe here that the proposed sine wave constrained EIT formulation accurately locates the through-hole location. There is a positive change in resistivity because of the removal of conductive material.
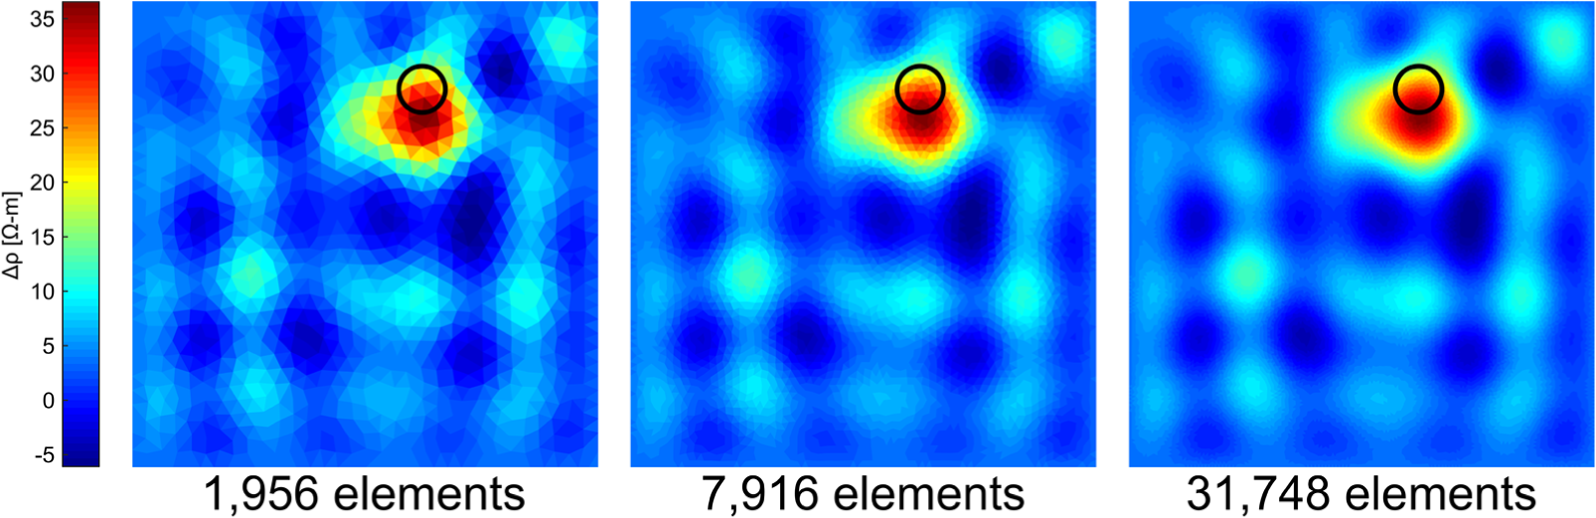
Through-hole damage identification in CNF/epoxy via sine wave constrained EIT with increasingly refined meshes. The black circle denotes the true damage size and location.
Glass fiber/epoxy laminate with CB filler and impact damage
Next, the ability of sine wave constrained EIT to detect impact damage to a structural composite manufactured with CB filler is demonstrated. This composite was manufactured with unidirectional E-glass (225 g/m2 areal weight), 0.5 wt% high-structure CB filler, a stacking sequence of [[0/90]6/0]s, and measured 101 mm × 152 mm × 4 mm. The plate was then instrumented with 16 electrodes and impacted via drop-tower at 50 J. Further manufacturing and experimental data can be found in Tallman et al. 8 The impacted plate as well as the damage identification via sine wave constrained EIT is shown in Figure 6. It can be seen that the method herein purported not only captures the impact location but also captures a ridge of resistivity change running lengthwise along the plate. This change corresponds with the crack damage induced by the impact which can be visibly seen originating from the impact location in the image of the plate. There is a positive resistivity change in this case because the impact has fractured the epoxy in the neighborhood of the impact and the crack thereby severing the underlying nanofiller network and increasing the resistivity.
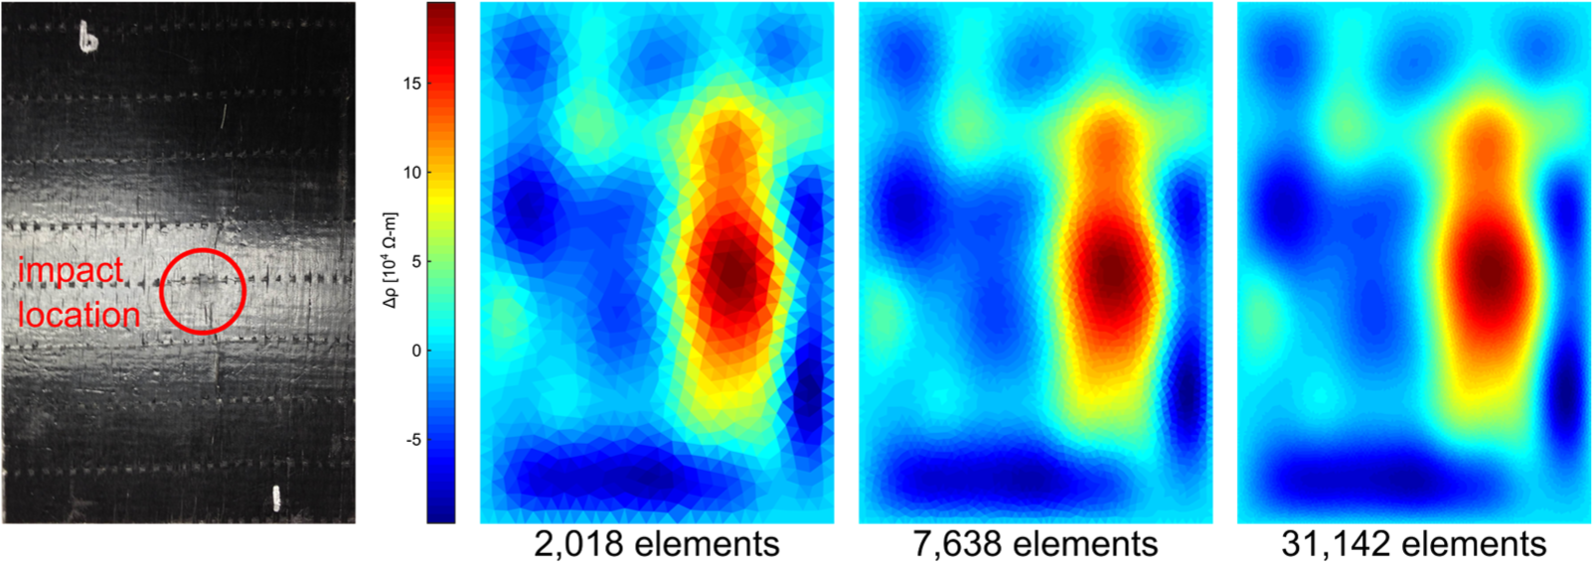
Left: post-impacted glass fiber/epoxy plate. Right: impact damage identification in a glass fiber/epoxy laminate with CB filler via sine wave constrained EIT with increasingly refined meshes.
CNF/PU with distributed strain
Finally, we demonstrate the ability of sine wave constrained EIT to detect changes in resistivity due to strain. A CNF/PU sample measuring 25.4 mm × 25.4 mm × 2.5 mm was manufactured with 10.5 wt% CNF. Three bonded glass marbles were placed on the CNF/PU and a 1.2-kg mass was then rested atop the marbles. After an hour, boundary voltage measurements were collected using a 28-electrode system as shown in Figure 7. Further manufacturing and experimental details can be found in Tallman et al. 17 EIT with constrained sine wave solutions successfully captures and accurately discerns between all three points of contact as shown in Figure 7. Unlike the previous two examples, we observe a negative change in resistivity here. This is because the compressive strain induced by the marble indenters caused the nanofillers to become more proximate. This increased proximity leads to an increased percolation probability, filler volume fraction, and, most importantly, decreased tunneling resistance between nanofillers. These factors result in a net increase in electrical conductivity in the region of contact which is synonymous to a net decrease in resistivity.
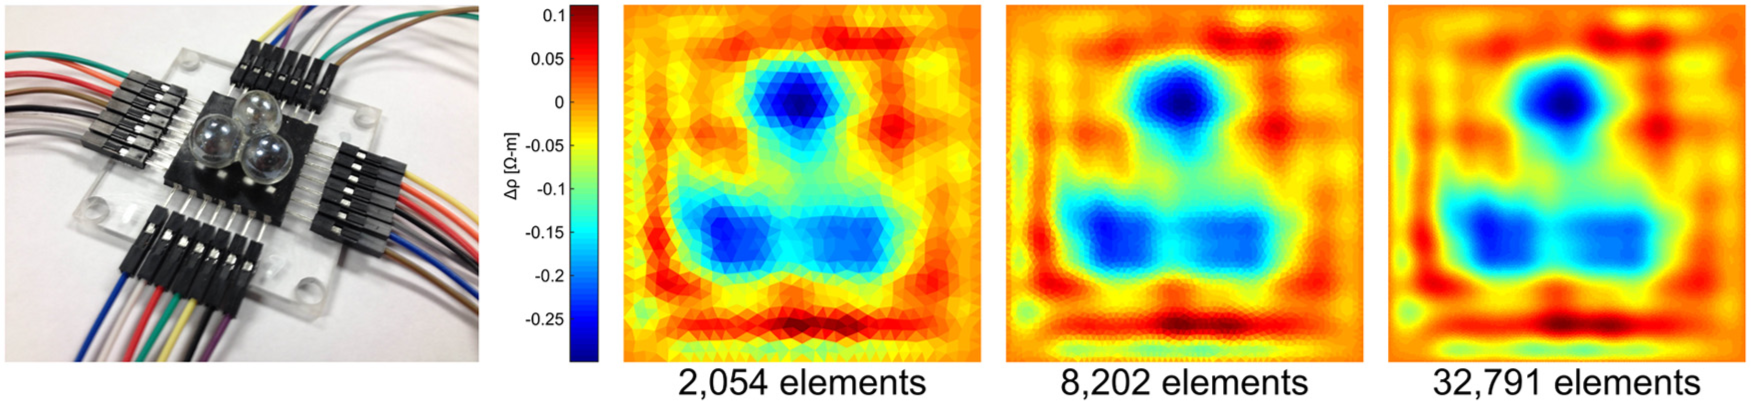
Left: experimental setup of CNF/PU with marble indenters. Right: strain identification in CNF/PU via sine wave constrained EIT with increasingly refined meshes.
Summary, discussion, and conclusion
This article has developed a novel method of recovering resistivity distributions for given boundary voltage data. This has been done by restricting the solution to be the summation of two-dimensional sine waves and seeking to recover the coefficients of the sine waves. With this formulation, the computational requirements the EIT inverse problem are substantially abated thereby enabling reconstructions on exceedingly refined meshes beyond the capabilities of the standard EIT inverse problem with access to reasonable computational resources. This also greatly facilitates the viability of EIT for on-board SHM with limited computational resources. Furthermore, the EIT formulation herein presented is independent of an initial resistivity distribution estimate. This makes the method much more practical to be applied to systems in which the resistive/conductive properties might not be known with certainty such as nanocomposite-based structures.
For each material system considered, the sine wave constrained EIT method was demonstrated on meshes of approximately 2000, 8000, and 32,000 elements. At these levels of mesh refinement, the non-sparse matrices to be inverted by the standard EIT method would have been approximately 4 million, 64 million, and 1024 million entries, respectively. Conversely, the constrained sine wave method for 16 electrodes required the inversion of a non-sparse matrix with 100 entries regardless of mesh refinement. Similarly, for 28 electrodes, the constrained sine wave method required the inversion of a non-sparse matrix with 324 entries. This represents a substantial decrease in computational effort.
Compared to Tallman et al.,7,8,17 resistivity images in Figures 5–7 show a greater amount of noise despite using the same voltage data. While the noise in Figures 5–7 is certainly not enough to detract from the detection of damage or strain, the difference is noteworthy nonetheless. This may be a consequence of the regularization parameter employed. More specifically, here, a weighted diagonal regularization matrix was used to penalize highly oscillatory solutions. In Tallman et al.,7,8,17 however, a discrete Laplace operator was used for regularization in order to promote smoothness. Future work should therefore endeavor to investigate more sophisticated regularization techniques to address the needs of both controlling highly oscillatory solutions while simultaneously abating noise.
It is well known that standard EIT struggles with capturing sharp conductivity contrasts (although total variation methods have been developed to this end). Building on intuition afforded to us by Fourier series, adding more high-frequency terms to the sine wave constrained method may be able to overcome this limitation. However, it was also found that the rank of the sine wave constrained inverse problem is dictated by the number of electrodes used. This implies that including more frequency terms in the reconstruction will not necessarily produce a better image. In light of these considerations, an interesting direction of future study may be to investigate how to include more high-frequency terms in the sine wave constrained method despite the rank limitation.
In conclusion, based on our success applying sine wave constrained EIT to several material systems to detect different resistivity anomalies, we believe this approach has considerable potential to lead to the integration of EIT on real SHM systems because of the significantly abated computational requirements and independence from initial conductivity/resistivity estimates. Future work should continue to refine the method by addressing the points described above.
Footnotes
Declaration of conflicting interests
The author(s) declared no potential conflicts of interest with respect to the research, authorship, and/or publication of this article.
Funding
This research was supported by the National Science Foundation (CMMI-DS-1232436).