
Abstract
Pseudo-excitation approach is a recently developed vibration-based damage detection method, exhibiting some appealing features for structural health monitoring applications. However, two main bottlenecking problems, that is, dense measurement points and venerable noise immunity, hamper its use in practical applications. This article tackles these problems by proposing a novel method based on sparse virtual element boundary measurement using metal-core piezoelectric fiber sensors. Different from the local “point-by-point” interrogation modality used in the original pseudo-excitation approach, the proposed method divides the entire structure into several virtual elements to construct a damage location index, describing the damage-induced dynamic perturbation in the corresponding virtual element. To avoid the high-order derivative calculation, which is mainly responsible to the low noise robustness of the original pseudo-excitation approach, metal-core piezoelectric fiber sensors are used to directly measure the surface strains, but only at the virtual element boundaries, leading to a significantly reduced number of measurement points. Experiment is designed and carried out using a cantilever beam, in which a 10-metal-core piezoelectric fiber sensor array is embedded in the structure. Along with the sparse laser Doppler vibrometer measurement, a normalized damage location index is constructed. Results demonstrate that the proposed method not only enhances the noise robustness but also allows a significant reduction in the number of measurement points.
Keywords
Introduction
As one of the most studied techniques, vibration-based damage detection examines the changes in structural vibration signatures to detect the damages.1–4 Vibration-based techniques are shown to exhibit some appealing features, including low cost and potential to be used for online structural health monitoring (SHM). Among existing methods, various vibration signatures have been used to construct the damage index, such as mode shapes,5,6 eigen-frequencies, 7 transfer matrices, 8 electro-mechanical impedances, 9 modal curvatures,10,11 and nonlinear characteristics. 12 Notably, “Pseudo-excitation” (PE) approach is recently developed to detect the structural damage by examining the damage-induced perturbation to the local equation of motion.13–15 Compared with other vibration-based damage detection methods, PE approach requires no prior knowledge on the baseline signals, overall structural model, or boundary conditions. Furthermore, due to its “point-by-point” local interrogation nature, the PE approach can be applied to a complex system, 16 through the interrogation of its components like beams, plates, and shells.
The original version of the PE approach defines the damage location index by a “strong” formulation based on the local equation of motion. Its effectiveness suffers from two main bottlenecking problems: (1) high-order derivative terms over displacement are involved. For example, d4w(x)/dx4 is used in the damage detection of a beam element (where w(x) is the flexural vibration displacement at the position x). For implementation, this high-order derivative is achieved by the finite difference calculation, which makes the method venerable to the measurement noise. (2). The “point-by-point” inspection strategy and the finite difference calculation require a large number of measurement points, increasing the processing difficulty and hampering system integration as smart structures having self-detecting capability.
To address these problems, a sparse virtual element boundary measurement (VEBM)-based “weak” formulation is proposed in this article. The so-called weak formulation uses the weighted integration of the damage location index in the “strong” formulation to quantify the damage within a small region. By doing so, the inspection strategy is shifted from “point-by-point” to “region-by-region.” The previous work has proven that the noise immunity of PE approach can be improved from “strong” to “weak” modality. 17 However, it still requires the calculation of the fourth-order derivative over the displacement and dense measurement points. As a further improvement, sparse VEBM-based “weak” formulation divides the entire structure into several virtual elements (VEs). By selecting a suitable excitation frequency, the final form of the damage location index only requires the evaluation of a few physical quantities at the boundaries of the VEs, thus significantly reducing the number of the measurement points. Furthermore, to avoid the calculation of high-order terms, a distributed metal-core piezoelectric fiber 18 (MPF) array is used for direct strain measurement. As a smart material with small size, MPF is suitable to measure the surface strain in a wide frequency band. 19 For improving the effectiveness of the MPF, a 10-MPF smart layer is packaged according to the experimental requirements. With the measurement data obtained by the MPFs and the displacements at VE boundaries captured by a laser Doppler vibrometer (LDV), a satisfactory detection is achieved through sparse measurement. Compared with the “strong” formulation, the noise immunity capacity is also greatly enhanced.
This article is organized as follows. First, the VEBM-based “weak” formulation is derived. Second, numerical simulations are carried out to validate the proposed method. Third, a 10-MPF sensor array is designed, manufactured, and embedded into a test beam. Experiments are then carried out to calibrate the MPFs, followed by damage detection validations. Compared with its “strong” formulation counterpart, the superiority of the proposed technique is demonstrated.
Damage detection algorithm
Principle
For illustrating the principle of the PE approach, an Euler–Bernoulli beam component with homogeneous isotropic material properties is taken as an example. As shown by Case 1 in Figure 1, the basic idea of the PE approach is to examine the equation of motion governing the vibration of the structural component. 13 A damage location index in such a one-dimensional structural component, denoted by DLI(x), can be defined by calculating the damage-induced perturbation as
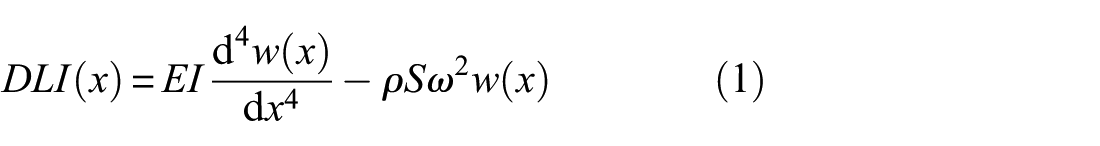
where w(x) is the steady vibration displacement of the beam at the position x; E, I, ρ, and S are the modulus of elasticity, cross-sectional moment of inertia, density of material, and cross-sectional area of the beam in healthy situation, respectively; and ω is the angular vibration frequency of the excitation. Considering a local area in the beam component without any external excitation, DLI(x) = 0 in the intact region, but different from zero within the damage zone that corresponds to a PE induced by the damage. DLI(x), in its primary form defined by equation (1) is called “strong” formulation, which evaluates the damage at each point on the beam component. By scanning the whole structure, the damage position can be identified where unexpected peaks appear in the curve of DLI(x). However, due to the fourth-order derivative over the vibration displacement, which is numerically obtained through the finite difference calculation scheme, the evaluation of DLI(x) requires very dense measurement and leads to low noise immunity when applied in practice.
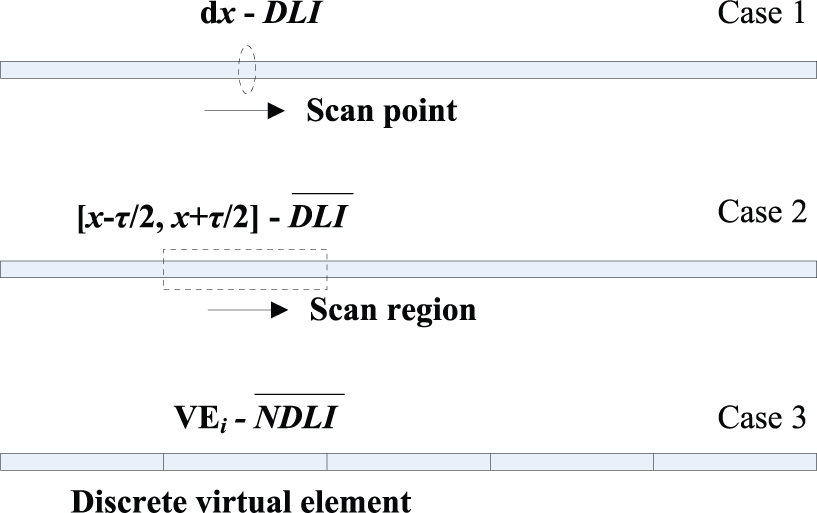
Schematic diagram illustrating the principle of PE approach.
In order to enhance the robustness against measurement noise and uncertainty of the PE approach, a “weak” formulation 17 is developed by integrating the damage location index of the “strong” formulation within an interval [xc − τ/2, xc + τ/2], as
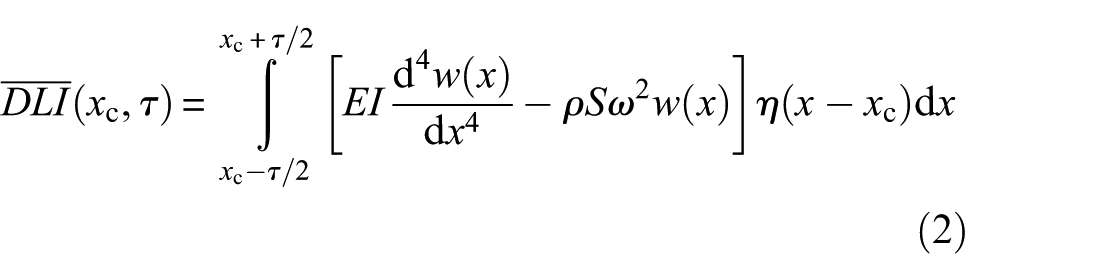
where
To take a step further, the fourth-order derivative of w(x) in equation (2) can be gradually transferred to the weight function η(x) by integration by part as
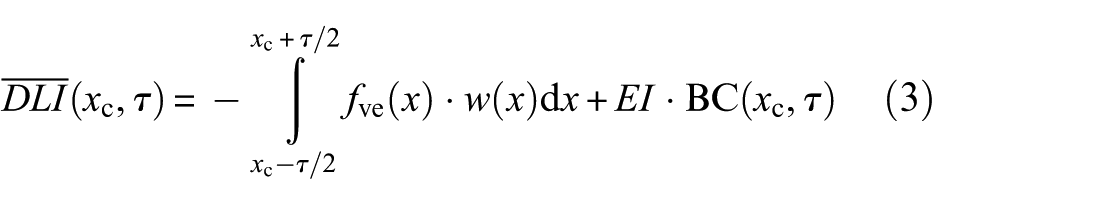
where fve(x) is the virtual force applied on the corresponding interval which is called VE and BC(xc, τ) is the boundary terms of the VE
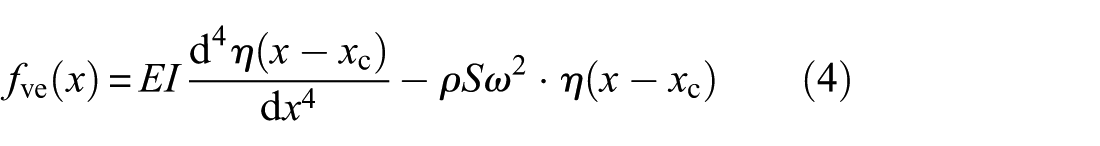
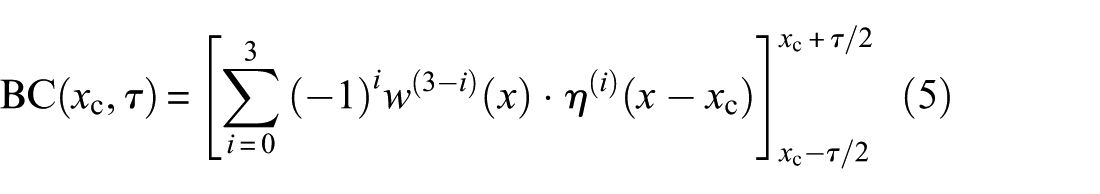
In the above expressions, the VE shares the same material properties as the real beam element and has a length τ. From equation (4), η(x) can be regarded as the displacement under the virtual force fve(x). The boundary terms BC(xc, τ) is the sum of a series of products of w(x) and η(x) of different derivative orders. The derivative orders are denoted by the superscript (i) in equation (5). For further removing w(x) and avoiding w(1) and w(3) in equation (3), η(x) should satisfy the following conditions

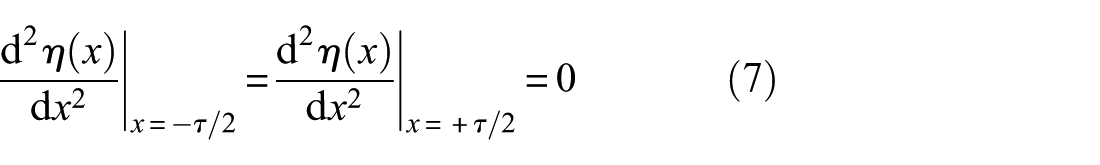

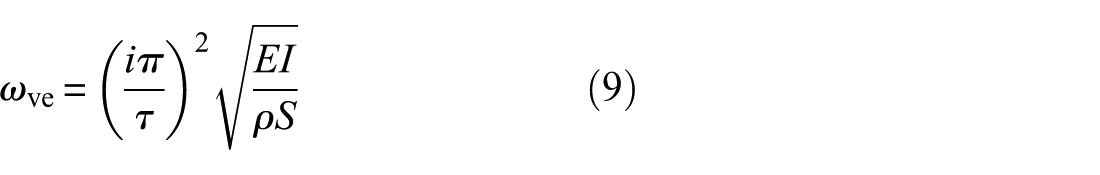
The above set of equations and the boundary conditions state that η(x) can be regarded as the free vibration response of the corresponding VE, which is a simply supported beam at both ends. Thus, when the excitation frequency equals to the ith natural frequency of the VE
the normalized damage location index of the “weak” formulation can be simplified as
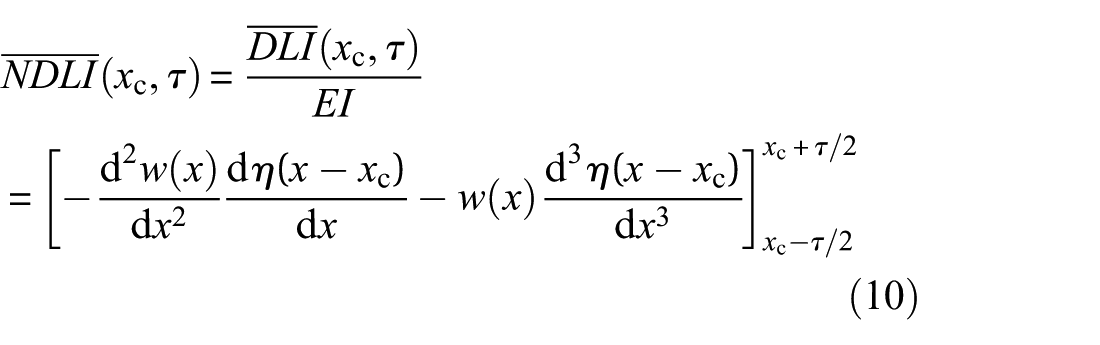
where η(x) is the ith mode shape
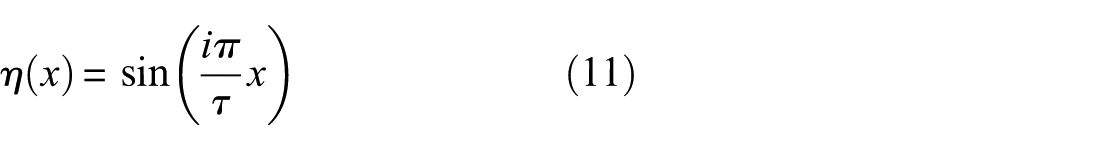
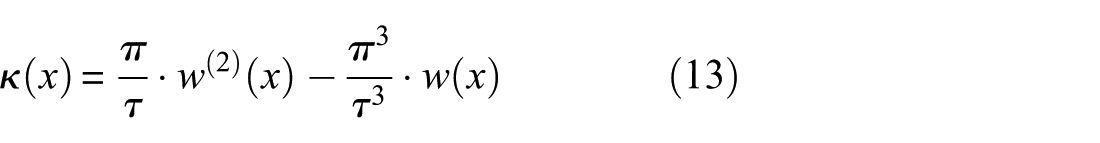
Taking the first natural frequency of the VE as an example,

where
As a special case of
According to equation (12), although
From Case 1 to 3, the deriving procedure is based on the Euler–Bernoulli beam model. However, the same derivation can be extended to a plate structural component, in which the full field displacement measurement can be reduced to the displacement and strain measurements at VE edges as discussed in Zhang et al. 20 For a more general structure with complex equation of motion, a calibration procedure is needed to model the structural vibration.
Numerical simulations
Considering an Euler–Bernoulli cantilever beam as shown in Figure 2, the elastic modulus E is 68.9 GPa and the density ρ is 2700 kg/m3. A damage, with a width of 2 mm and a depth of 2 mm, is located at x = 225 mm (referring to Figure 2 for the coordinate system). For validating the VEBM-based “weak” formulation, the length of VE is set as 60 mm. A harmonic point-excitation force is applied at x = 601 mm and the excitation frequency is 3180 Hz, corresponding to the first natural frequency of the VE, estimated using equation (9). The flexural displacement w(x) can be obtained through the finite element (FE) simulation using the commercial FE code ABAQUS®. The structure is modeled by the beam element with the size of 1 mm, amounting to a total of 605 elements. The steady vibration displacement w(x) at each element node is shown in Figure 3.

Schematic of a cantilever beam with an artificial damage.
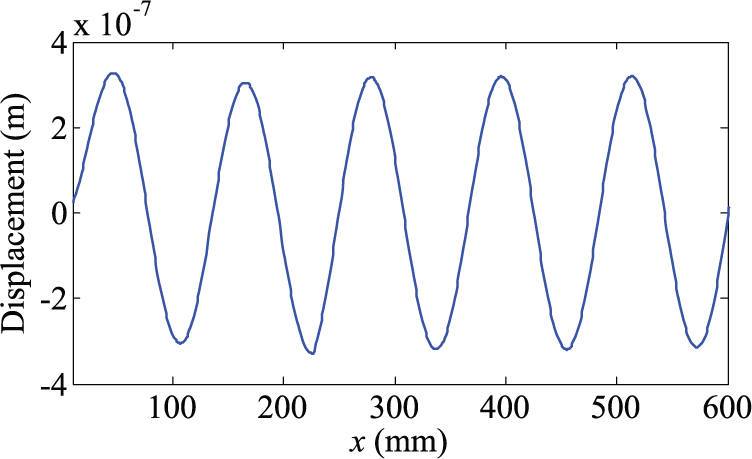
Steady vibration displacement obtained by the FE method.
Taking the same inspection strategy as

Equation (14) demonstrates that κ(x) is a periodic function of the position x and the wavelength of the function κ(x) equals to twice the length of VE in the healthy beam region. On the contrary, when the interval [x − τ/2, x + τ/2] includes damage, in addition to the abrupt changes in
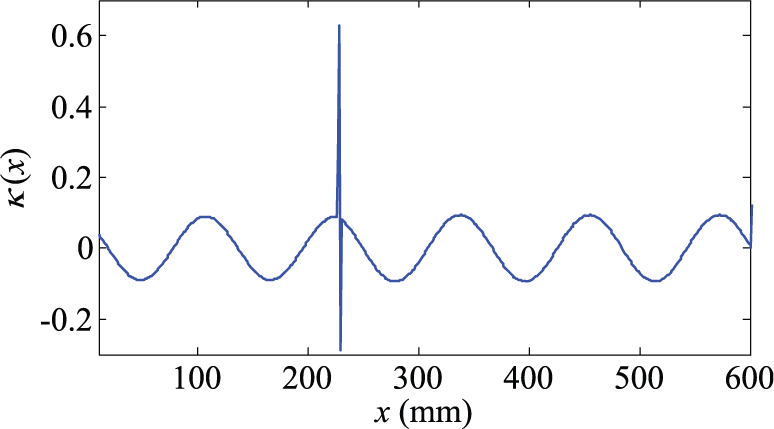
κ(x) calculated by w(x) in the FE method.
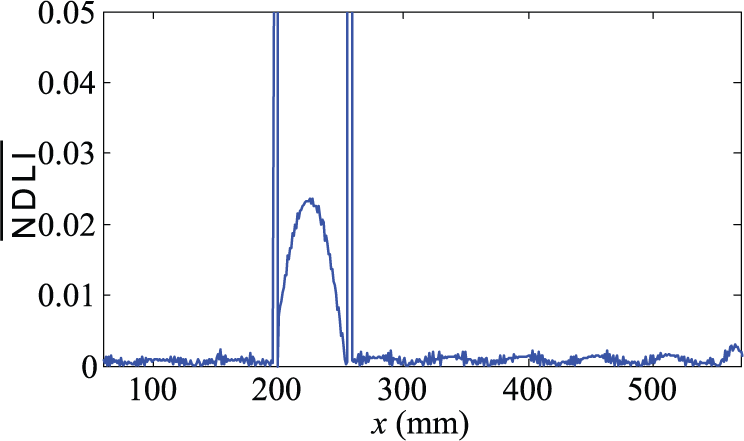
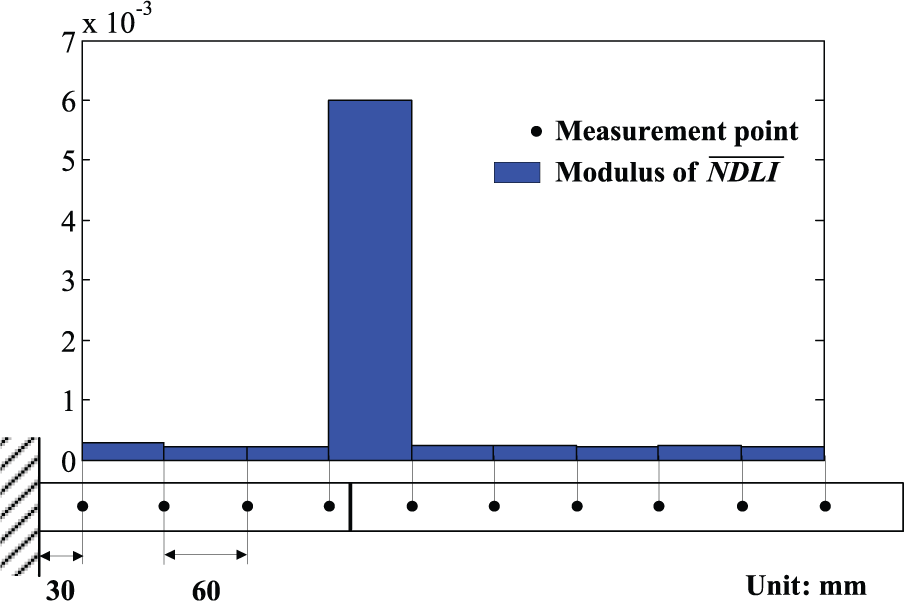
For reducing the measurement points, a sparse VEBM-based damage detection method using
Depending on the inspection accuracy, the beam component can be divided into several VEs, of equal length τ. In the present simulation, the inspection region [30, 570] is discretized into nine VEs.
The displacements and their second-order derivatives at the boundaries of the VEs should be measured under the steady excitation at the excitation frequency calculated by equation (9).
MPF-based smart layer
For implementation of the VEBM-based damage detection, both the displacements and the strains at the boundaries of the VEs should be measured under the steady vibration. In order to achieve a better spatial resolution of the damage detection, the VEs with small length are required, at the expenses increasing the excitation frequency. Therefore, MPFs are subsequently integrated with the structure to directly measure the surface strains at high frequencies.
MPF transducers
MPFs were first fabricated using the extrusion method in 2003. 21 A single MPF includes three parts: metal (Pt) core, surface electrode, and piezoelectric ceramic fiber, as shown in Figure 7(a). With the metal core inside the piezoelectric ceramic fiber, the MPF overcomes the brittleness of the conventional piezoelectric fibers and can be used as a sensor or actuator conveniently with two electrodes: the metal core and surface electrode. Compared with the strain gauges, the MPF inherits the advantages of the piezoelectric material that creates direct conversion of mechanical energy into electric energy without the need for the complex signal conditioners or the Wheatstone bridges. Therefore, the MPF can be used to measure the surface strain, especially for high-frequency vibration application.
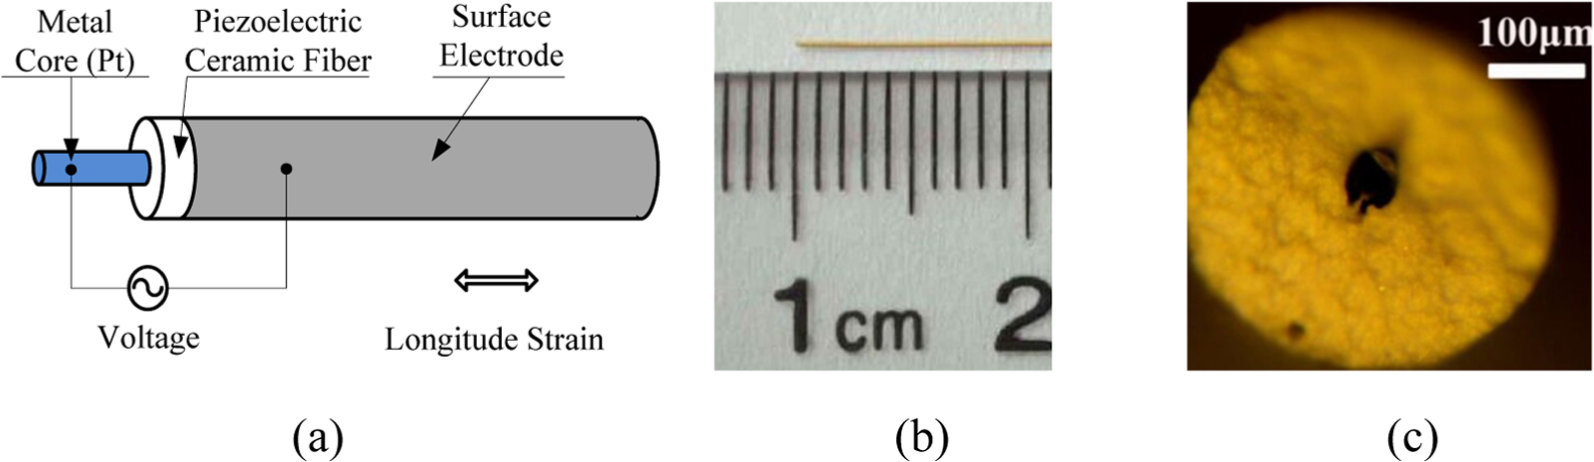
Single MPF details (a) schematic diagram, (b) side view, and (c) sectional view.
Considering that the length of the MPF used in this article is 10 mm as shown in Figure 7(b), the diameter of the MPF can be ignored, which varies from 300 to 400 µm as illustrated in Figure 7(c). Therefore, the response voltage of the MPF, only related with the surface strain along the sensor length direction, can be expressed as 22
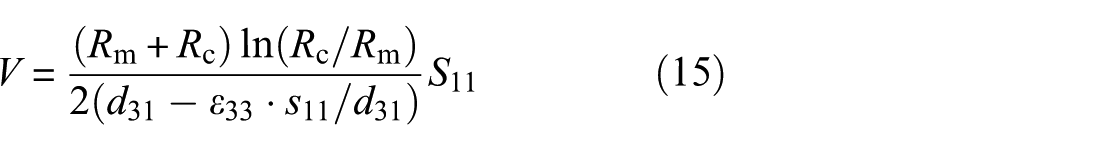
where Rm and Rc are the radii of the metal core and the piezoelectric fiber, respectively. d31 is the piezoelectric coefficient, ε33 is the dielectric coefficient, s11 is the elastic coefficient, and S11 is the average surface strain. The subscript 1 represents the length direction of the MPF and the polarization direction 3 is the radius direction of the MPF. According to equation (15), the response voltage is proportional to the average strain along the MPF length direction. Notably, if the MPF is used to measure the surface strain of an Euler–Bernoulli beam, the corresponding second-order derivative of the displacement can be calculated as
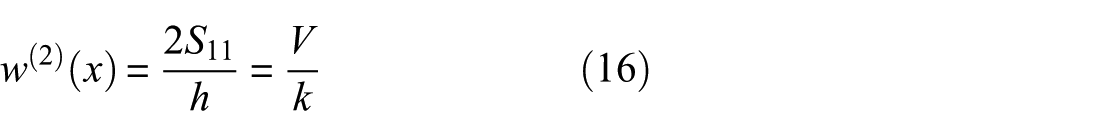
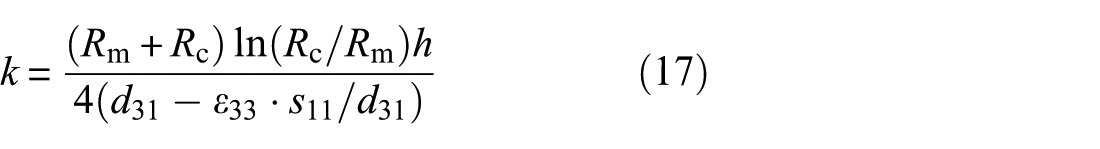
where h is the thickness of the beam and k is the sensitivity, relating the response voltage with w(2), expressed as
Package processing
According to the principle of the VEBM-based “weak” formulation, a series of w(2) located at distributed positions with the same distance τ are required to construct the normalized damage location index. In order to simplify the process of installing the MPFs onto the structure one by one and improve the integrity of the structure to be monitored, a MPF sensor array is designed and fabricated by packing the MPFs to form a smart layer. This packaging process is widely used in Lamb wave-based SHM techniques.23,24 As shown in Figure 8, the primary constituents of the smart layer include polyimide film, MPFs, and the flexible printed circuit. The distance between the adjacent MPFs is fixed by the flexible printed circuit. In this article, 10 MPFs are used, directly placed onto the structure by pasting the smart layer with the epoxy adhesive. The 10 response signals can be obtained through a standard 20-pin port.
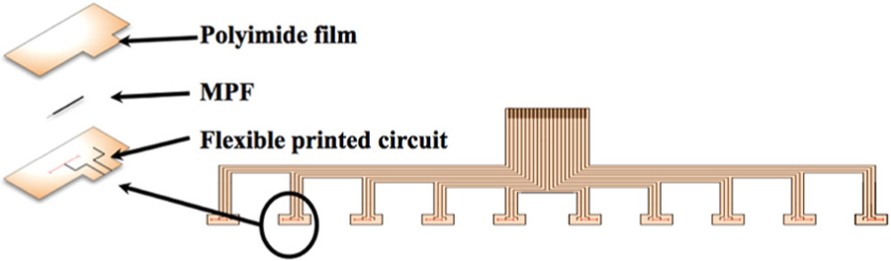
Schematic of a 10-MPF-based smart layer.
Experimental validations
Experimental setup
Experimental validation is subsequently carried out to identify the artificial damage (2 mm in depth and 2 mm in width at x = 225 mm) in a cantilever beam that is made of aluminum 6061. The dimensions and physical parameters of the beam are the same as the ones used in the numerical simulation as shown in Figure 2. The beam is fixed on a testing table (NEWPORT® ST-UT2) as shown in Figure 9. The excitation signal is magnified through a power amplifier (B&K® 2718) and then applied to an electro-mechanical shaker (B&K® 4809) to provide a harmonic point-force excitation to the structure at x = 601 mm. Considering that the length of the VE is 60 mm that is the interval of the adjacent MPFs, the excitation frequency is set as 3180 Hz, corresponding to the first natural frequency of the VE. Two measurement systems are used in this experiment, including a scanning LDV (Polytec® PSV-400B) to measure the out-of-plane displacement and MPFs to obtain the second-order derivatives of the displacement, both only at the VE boundaries. The response voltages of the MPFs are amplified through a voltage amplifier and acquired by a multi-channel oscilloscope.
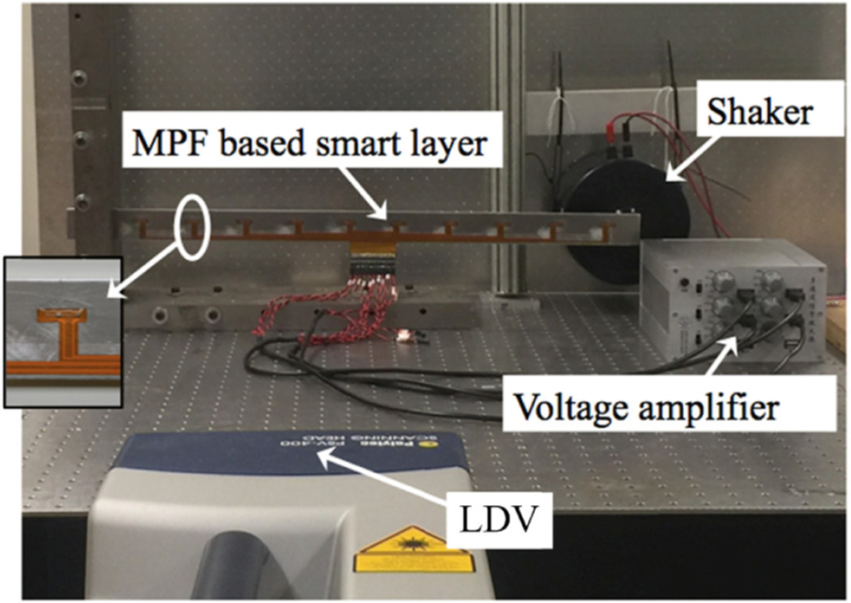
Experimental setup.
Sensor calibration
To measure the second-order derivatives of the displacement through the MPFs, a calibration procedure is carried out to obtain the sensitivity k in equation (16). Three steps are followed:
The displacement w(xi) at the position of the ith MPF is first measured by LDV under the steady vibration, as well as the displacements at two positions adjacent to this MPF. The second-order derivative of the displacement can be calculated by means of the finite difference as
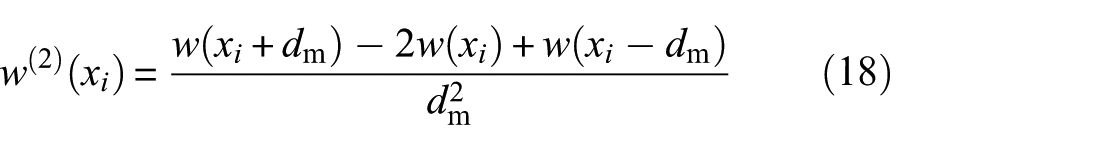
where xi is the position of the ith MPF, and dm is the interval of the measurement points.
The response of the MPF in time domain is measured and the amplitude at the excitation frequency can be obtained through fast Fourier transform (FFT).
The sensitivity k of each MPF can be calibrated as the quotient of the amplitude divided by the w(2).
Taking MPF 1 in Figure 2 as an example, the steady response at 3180 Hz is shown in Figure 10(a). Due to the measurement noise, the amplitude is difficult to obtain from the response in time domain. According to the results of the FFT in Figure 10(b), the amplitude at the excitation frequency can be identified as 5.2 mV. With the measured displacements by the LDV, w(2) at the position of MPF 1 can be calculated as a benchmark to calibrate the sensitivity k of MPF 1.
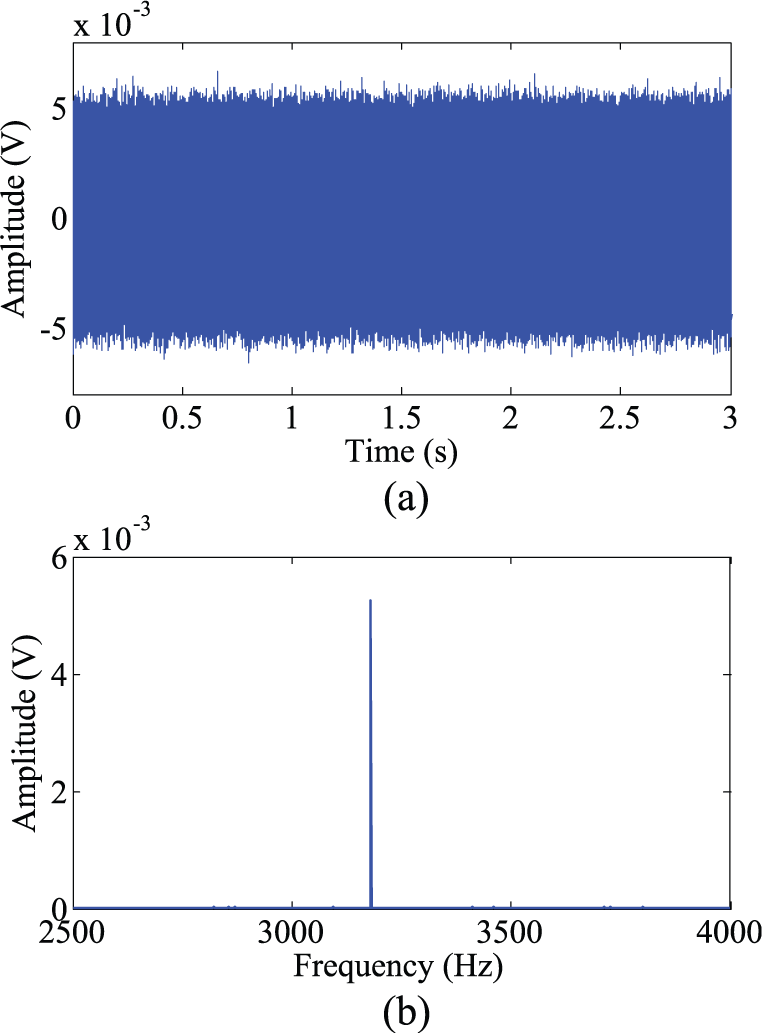
Response of MPF 1 in (a) time domain and (b) frequency domain.
Result and discussion
For validating the proposed method, the “strong” formulation is first applied to detect the damage in the experiment. With the displacement shown in Figure 11, DLI(x) fails to delineate the damage position as illustrated in Figure 12. The fourth-order derivative of the displacement in equation (1) is calculated through the finite difference, which is expressed as
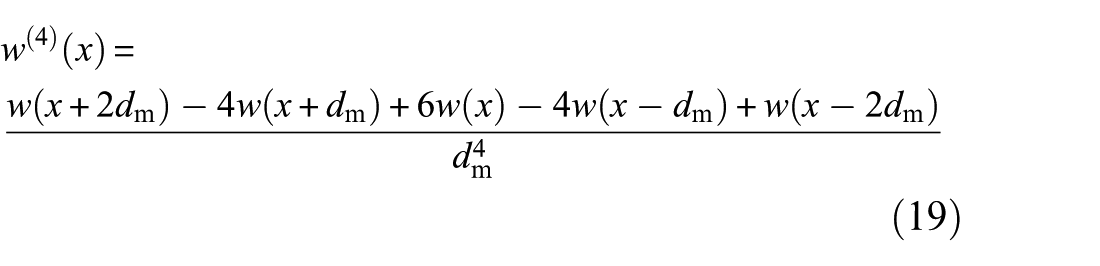
Note that, w(4)(x), in the absence of noise, can achieve an accurate approximation through the finite difference, when the measurement interval dm is small. However, equation (19) is sensitive to the measurement noise. With decreasing dm, the measurement noise is also enhanced, which masks the damage-induced changes in DLI(x), in agreement with the previous analyses.
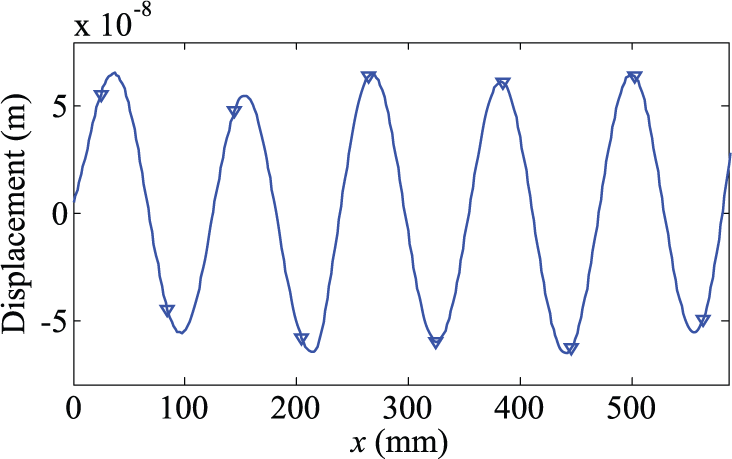
Vibration displacement obtained in the experiment.
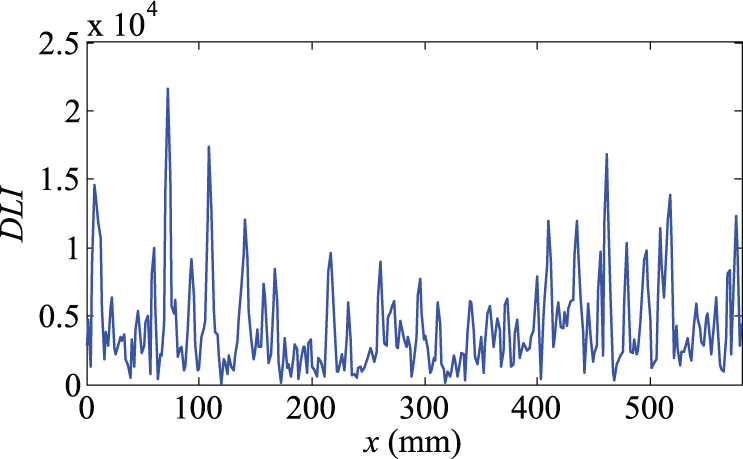
Damage detection using “strong” formulation.
The beam is then segmented into nine VEs of τ = 60 mm long each, separated by 10 MPFs. Compared with the “strong” formulation in Figure 12, the number of measurement points is reduced from more than 300 to only 10 within the inspection range from x = 30 mm to x = 570 mm. The displacements at the VE boundaries are obtained through the LDV as shown in Figure 11 with the marks “∇.”w(2) are measured by the MPFs, with results tabulated in Table 1 along with w. Using equation (12),
Data at VE boundaries using in VEBM-based “weak” formulation.
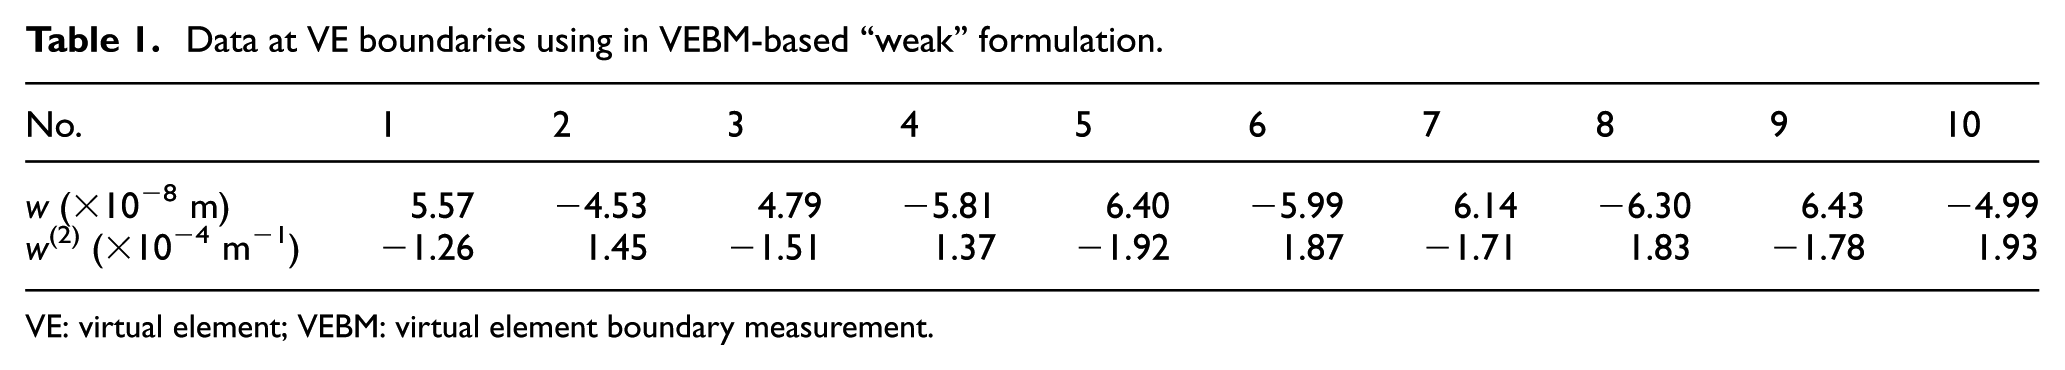
VE: virtual element; VEBM: virtual element boundary measurement.
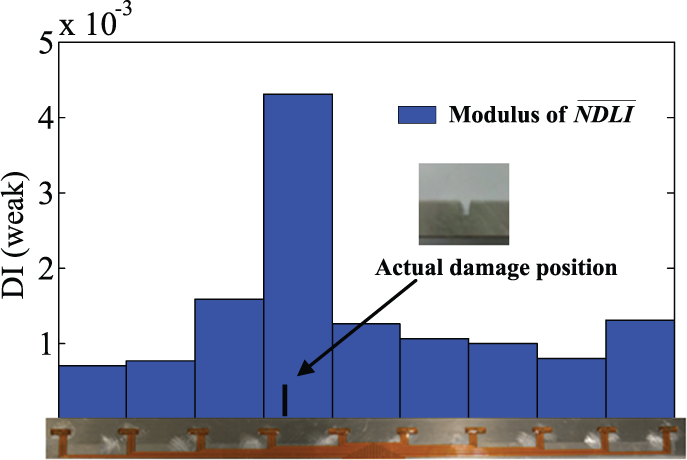
Damage detection using VEBM-based “weak” formulation.
Conclusion
As a vibration-based damage detection method, the original “strong” formulation of the PE approach shows obvious drawbacks, such as high sensitivity to the measurement noise and the need for a large amount of the measurement points. To tackle these problems, a VEBM-based “weak” formulation using MPFs is presented in this article. The proposed method can be regarded as a retrofitted and improved version of the “strong” PE formulation, shifting the detection philosophy from “point-by-point” to “region-by-region.” By tuning the excitation frequency to the natural frequency of the VE, VEBM-based “weak” formulation only requires the parameters at the VE boundaries to be evaluated, leading to a sparse measurement with much reduced measurement cost. By the same token, the robustness of the technique against measurement noise and uncertainty is greatly enhanced. As a piezoelectric strain sensor with small size, MPF is used to be embedded with the structure. With a high sensitivity over a wide frequency range, MPFs can directly measure the second-order derivatives of the displacement at the VE boundaries with a distributed array configuration. Along with the displacements measured by the LDV, the proposed method is experimentally shown to be able to detect the damage position with a satisfactory accuracy through sparse measurement.
Footnotes
Declaration of Conflicting Interests
The author(s) declared no potential conflicts of interest with respect to the research, authorship, and/or publication of this article.
Funding
The author(s) disclosed receipt of the following financial support for the research, authorship, and/or publication of this article: This work was supported partially by the National Natural Science Foundations of China (No. 11272272). Authors wish to acknowledge the support given to them by the Hong Kong Polytechnic University (Research Grant G-YK14) and the NUAA State Key Laboratory Program under Grant MCMS-0514K01. The first author acknowledges a project funded by the priority academic program development of Jiangsu higher education institutions (PAPD).