
Abstract
A cantilever beam with a breathing crack is studied to detect the crack and evaluate the crack depth using entropy measures. During the vibration in engineering structures, fatigue cracks undergo the status from close-to-open (and open-to-close) repetitively leading to a crack breathing phenomenon. Entropy is a measure, which can quantify the complexity or irregularity in system dynamics, and hence employed to quantify the bi-linearity/irregularity of the vibration response, which is induced by the breathing phenomenon of a crack. A mathematical model of harmonically excited unit length steel cantilever beam with a breathing crack located near the fixed end is established, and an iterative numerical method is applied to generate accurate time domain vibration responses. The steady-state time domain vibration signals are pre-processed with wavelet transformation, and the bi-linearity/irregularity of the vibration signals due to breathing effect is then successfully quantified using both sample entropy and quantized approximation of sample entropy to detect and estimate the crack depth. It is observed that the method is capable of identifying crack depths even at very early stages of 3% of the beam thickness with significant increment in the entropy values (more than 200%) compared to the healthy beam. In addition, experimental studies are conducted, and the simulation results are in good agreement with the experimental results. The proposed technique can also be applied to damage identification in other types of structures, such as plates and shells.
Keywords
Introduction
Identification of structural damages, which refers to detection and evaluation of these damages such as cracks, notches, and delaminations, especially at their earliest stage, is a vital process in engineering to avoid calamitous and irreparable damages. Bearing this in mind for the last few decades, structural health monitoring (SHM) with different damage identification techniques has been a largely concerned field of study for numerous researches from both industrial and academic communities. Local damage detection methods which are mostly referred to as non-destructive tests (NDTs), such as X-ray test, ultrasonic, and magnetic particle test, have been proven to be unsuitable in particular cases due to long inspection times, 1 expensiveness of some methods, inability to reach the damaged area, and most importantly they are not capable of online real-time continuous detection of damages. 1 As a result, new research frontiers in SHM have turned toward global vibration-based structural damage detection, with the intention of continuous online real-time identification of these damages at the earliest stage with greater accuracy.
Vibration signals of a structure carries great amount of information about the healthiness of that particular structure. Numerous reviews2–5 can be found in the literature on vibration-based damage detection methodologies proposed in the past several decades. Although many vibration-based structural damage detection techniques and methodologies have been proposed, their development can mainly be divided into two types: traditional and modern. 6 The traditional type refers to damage detection solely depending on the direct changes in the modal parameters of the structure, such as modal frequencies,7–9 modal shapes,10,11 and frequency response functions.12,13 These methods generally require experimental measures, which require multifarious instruments or manual operation, therefore, traditional type of techniques are not convenient for online damage detection. 6 They have shown lesser sensitivity to initial stages of the damages and possess more dependence on the properties of the individual structures limiting them in expanding to universal methodologies. On the other hand, modern types depend on the online measured responses of the structure and use signal processing techniques and intelligent damage identification agents such as artificial neural networks (ANNs)14–16 and genetic algorithms (GAs) for damage identification.17,18 Wavelet analysis is also a popular signal processing method used in damage detection.19,20 The advantages of modern type techniques are as follows: higher sensitivity to initial damage stages, online measurements avoid operational halts of the system, and has higher flexibility in expanding these techniques as universal methodologies. This study also presents a modern vibration-based identification technique for fatigue cracks.
Fatigue cracks are the most frequent structural damage type observed in many occasions. Many studies have been carried out on the dynamic response of fatigue cracks, in an attempt to find viable vibration-based methods for health monitoring. The crack models used in these studies fall into two categories: open crack models and breathing crack models. 8 In open crack models, the crack is considered to remain open during the vibration and it is the most widely used21,22 modeling technique to avoid the complexity resulting from bi-linearity of the breathing crack models. These models are less sensitive to smaller crack depths23–26 and lead to lesser crack severity predictions than what they really are. 27 Therefore, recent studies8,28–30 are more in the favor of breathing models, which mitigates those problems by mimicking the real open–close phenomenon of the fatigue cracks called breathing effect. A mathematical modeling technique combined with an iterative process has been developed by Wu 31 and the method claims generating accurate reproduction of bi-linear dynamic properties of breathing fatigue cracks computationally. The same modeling technique is used in this study to generate time series vibrational signals of a breathing crack cantilever beam. Breathing process of fatigue cracks results in weak bi-linearity in the dynamic response of the structure introducing irregularities to the response.
Entropy is a measure, which can quantify the complexity or irregularity in system dynamics, and numerous entropy measures have been introduced since its introduction into dynamic systems by Kolmogorov32,33 and Sinai. 34 Higher the complexity of a dynamic response of a given system, higher the entropy values are. Evaluation of complexity values of time series data based on entropy measures are well studied in different disciplines including biomedical studies,35,36 in characterizing human motion, 37 image processing,38,39 in financial market studies, 40 and so on. In the damage detection perspective, in the recent studies, various entropy measures are being applied in rotary machines to diagnose various damages. Yan and Gao 41 have employed approximate entropy (ApEn) as a diagnosis tool to identify the different deterioration phases under several damage modes of rolling-element bearings. The authors claim more than 200% increment in ApEn values even under light damages to the bearings. Zhang et al. 42 have introduced multi-scale entropy (MSE) measures for the first time in fault diagnosis. The mentioned work has been able to produce better results with MSE over single scale-based entropy measures. Similar bearing fault diagnosis has been done using permutation entropy (PE) 43 and multi-scale permutation entropy (MPE) 44 with improved accuracies.
From the literature review, only few research works have been carried out on structural damage detection using entropy as a tool. Yang et al. 45 have employed entropy measures in detection of cracks in beam-like structures. However, the direct employment of entropy measures has limited their crack identification methodology to show promising results only with larger crack depths. The entropy itself is found to be not quite sensitive for the crack detection. In this study, the sensitivity of the detecting technique to smaller cracks using entropy measures is further improved by introducing wavelet transformation (WT), which is a feature magnification technique. The WT is an efficient technique to amplify the perturbations or irregularities in signals19,46 and can be used as a pre-data processor prior to entropy calculations to quantify the structural damages. Ren and Sun 47 introduced the wavelet entropy technique to notch detection in structures. The variation of wavelet entropy on an I-beam, at the moment when the notch damage happens, was studied. However, the results can only depict successful detection of the damage at the instance it happens; the method lacks in damage detection and severity estimation during its operation with an existing damage.
To tackle the current challenges, the objectives of this article are as follows: (1) to realize high-sensitivity detection and evaluation of an existing crack at its initial stages for the first time using entropy, (2) to prove the efficiency of the proposed method on crack detection with experimental studies, and (3) to improve the computational efficiency for continuous online real-time crack detection process with quantized approximation of sample entropy (QASE). Sample entropy (SampEn) is a result of continuous studies on mitigating two major problems in experimental data: noise and lesser number of data available. Moreover, SampEn provides an improved evaluation of time series regularity. 36 Therefore, SampEn can be employed as the main tool in high-sensitivity crack identification process. The QASE is developed to improve the computational efficiency of SampEn. 48 In section “Methodology of damage identification with entropy” of the article, the overall methodology is introduced including mathematical model of the beam vibration with breathing crack, as well as brief introductions to SampEn, QASE, and WT. Experimental setup is described in section “Experimental setup.” Simulation results and discussions of crack identification by entropies combined with WT, process speed-up with QASE, and comparison of numerical and experimental results are given in section “Results and discussions.”
Methodology of damage identification with entropy
To demonstrate the viability of the proposed methodology to identify breathing cracks in structures based on time domain vibration signals, a vibrating cantilever beam with a breathing crack (near the fixed end) is studied. A diagram of the beam structure is shown in Figure 1.
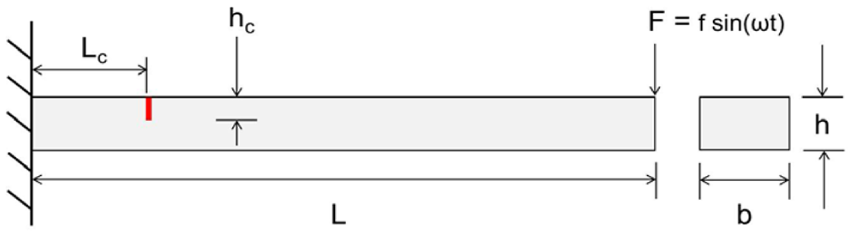
Cantilever beam with a breathing crack.
The beam is considered as an ASTM A36 steel beam of a unit length (in meters). The cross section is
The overall process of crack depth identification
Breathing phenomenon of the fatigue cracks introduces the repetitive crack opening/closing and the change of the structure stiffness during the vibration leading to weak bi-linearity in the dynamic response of the beam. This imposes irregularities/perturbations in the vibration signals, which can be quantified by the entropies of these signals. It is actually a measure of crack severity since these irregularities are directly related to the depth of the crack. It is noted that entropy itself is not sufficient enough to correlate the severity of the crack because of the weak signatures of the perturbations generated by the breathing cracks. However, once these weak perturbations are magnified using WT, those correlations can be easily found using the entropy measures of respective wavelet-transformed vibration signals. This proposed method is illustrated in Figure 2.
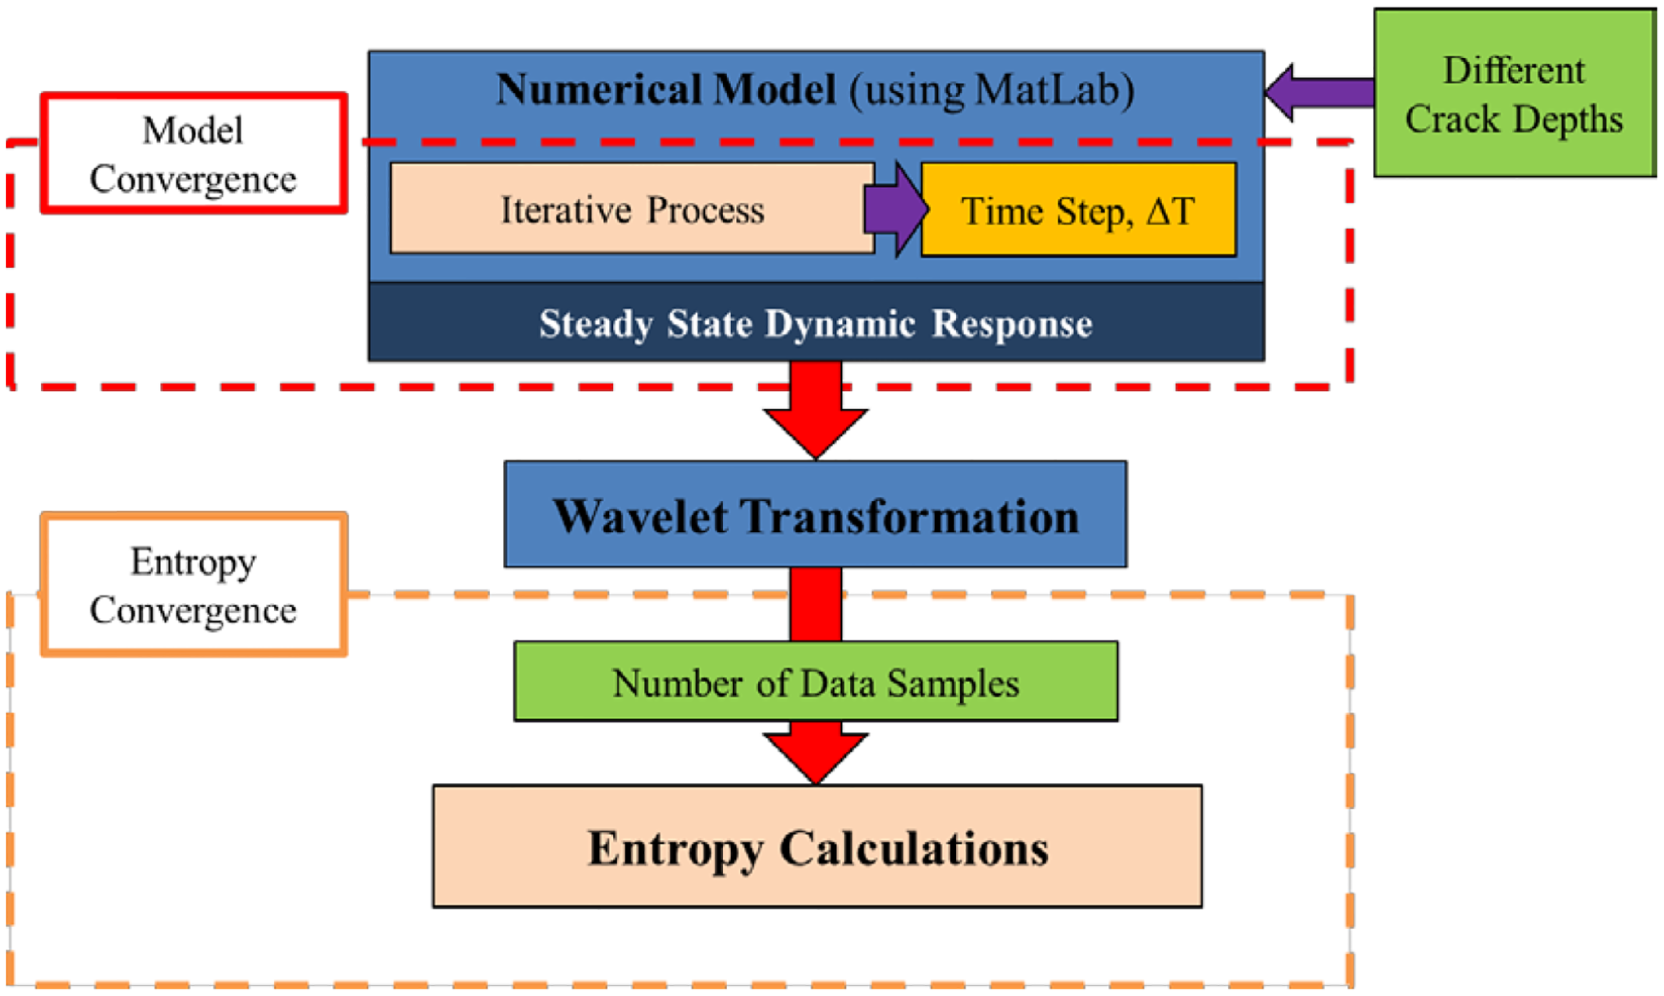
Flow chart of overall crack identification process.
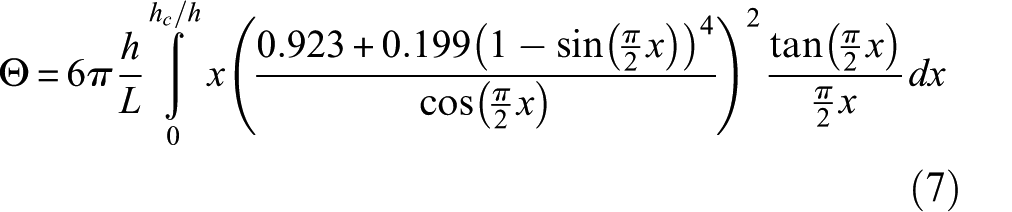
As it is shown in Figure 2, the first step of the derivation of the crack identification process is building a mathematical model of the cantilever beam to obtain the vibration response of the tip of the beam considering the crack breathing with damping, and more details about the mathematical model can be found in section “Mathematical modeling of the cantilever beam with a breathing crack.” Since the breathing process is a bi-linear problem, the vibration response of the mathematical model is obtained using an iterative method. 31 The accuracy of the dynamic response depends on the time step length used in the iterative process. Wu 31 claims the convergence of dynamic responses as long as the iterative time step is smaller than 0.001 s. Therefore, a time step of 0.0001 s is used in this study. Then, by considering the damping effect during the vibration of the cantilever beam, the steady-state response of the vibration signal is obtained and used for the entropy analysis. It should be noted that even though it is called “steady state,” it is not a pure steady state, rather a “semi-steady state.” The breathing phenomenon introduces extra-axial force when the crack goes from open-to-close position during vibrating. In addition to that, the stiffness (equation (7)) around the crack varies between the open and closed crack stages of the vibrating beam (more details about these two stages are described in section “Mathematical modeling of the cantilever beam with a breathing crack”). Now, due to these two reasons, perturbations appear in the vibration signal during the open-to-close and close-to-open stage transitions of the beam. Therefore, it is never possible to have a pure steady state in the presence of a breathing crack. For the simplicity, this semi-steady state will be stated as “steady state” throughout the article. The steady-state vibration signal is then sent through WT, which magnifies the weak bi-linearity due to the breathing phenomenon of the crack (a description about WT is given in section “WT”). The transformed signal, WT coefficient, is then used in entropy calculations to quantify the irregularity of the vibration signal. Two entropy measures, SampEn and QASE, are used in this process individually for the quantification of the crack severity (sections “SampEn” and “QASE” present more details, respectively, about SampEn and QASE). The convergence of the entropy calculations with the number of sampled vibration signal is checked, and convergence results can be found in Appendix 1.
The same crack detection process is carried out repeatedly for the crack depths ranging from zero (i.e. healthy beam) to half of the thickness of the beam (50% crack depth percentage) in 1% of crack depth percentage intervals. Then, results to observe the correlations between the crack depth and the percentage increment of the entropy values with respect to the healthy beam are presented and discussed.
Mathematical modeling of the cantilever beam with a breathing crack
As shown in Figure 1, a cantilever beam of length

where
First, when the slope on the left side of the crack is larger than the slope on the right side, the crack is in closed position; hence, the beam can be treated as a healthy beam.
31
Then, using variable separable method, the mode shapes of the beam with the closed crack can be found for

where

and
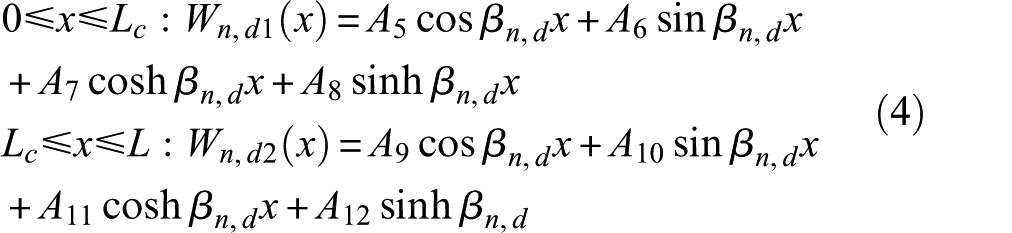
Second, when the slope of the left side of the crack is smaller than the right side, the crack is in open position and then the beam can be treated as an open crack beam or a damaged beam. 31 Now, the beam is separated into two sections at the crack location to find the modal frequencies and the corresponding modal shapes. Let us assume that beam section to the left of the crack as section 1 and the section to the right as section 2. Then, the vibration mode shapes of the two beam sections with open crack are as follows
and

where
The parameter
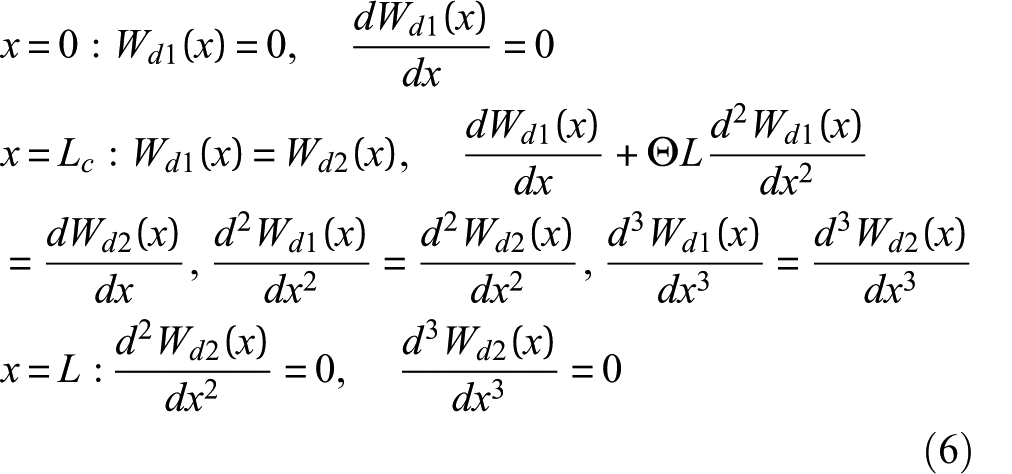
Substituting equation (4) into boundary conditions of the cantilever considering the crack opening given in equation (6), the
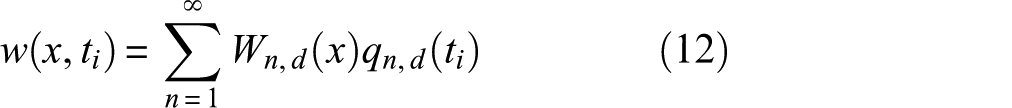
Then, the full vibration response of the beam can be found using the mode superposition as follows
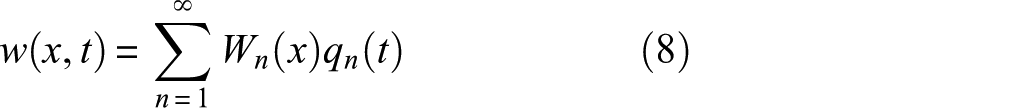
where
As it was mentioned before, during the vibration, beam undergoes two structural states, open crack (damaged beam) and closed crack (healthy beam) stages with different stiffness at the crack position. Due to this bi-linear behavior of the beam, vibrational characteristics of the beam keep changing. Hence, it is not easy to derive accurate analytical vibration solution of the beam subjected to external excitations with variable stiffness of the structure.
31
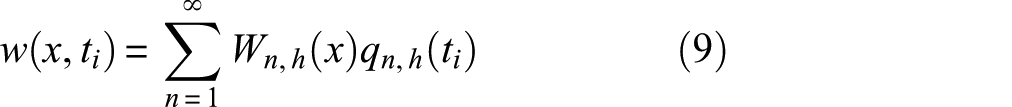
Therefore, an iterative numerical approach is used to find the final vibration solution
If the slope on the left side of the crack is larger than the slope on the right side (i.e. the closed crack/healthy stage), the deflection of the beam is given as follows
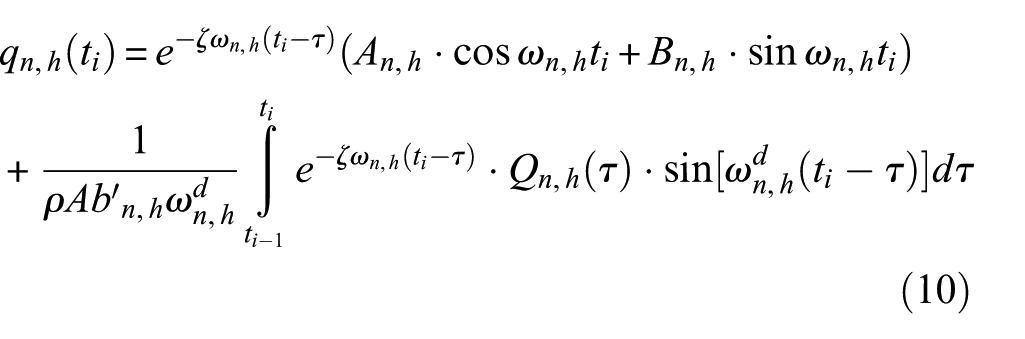
where damped modal frequency (damped natural frequency) is given by
On the other hand, if slope on the left side of the crack is smaller than the slope on the right side (i.e. the open crack/damaged stage), similar set of equations can be written as follows
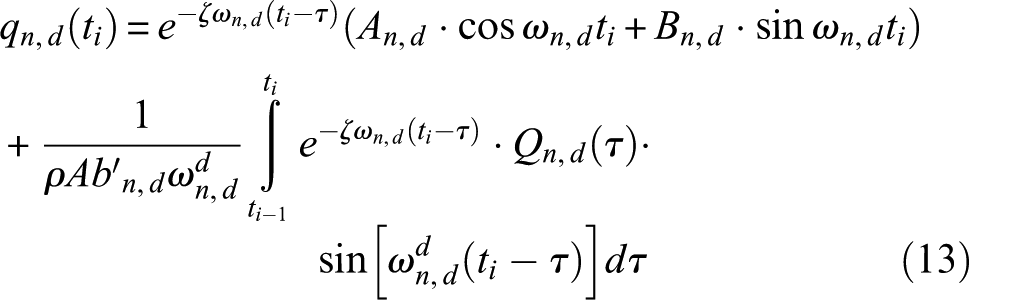
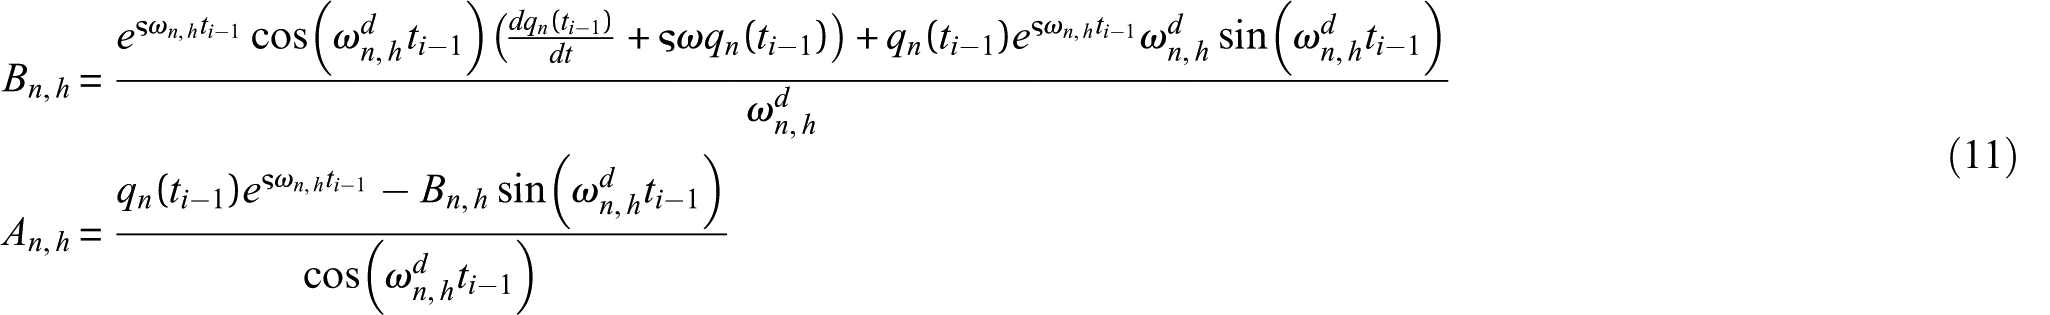
where
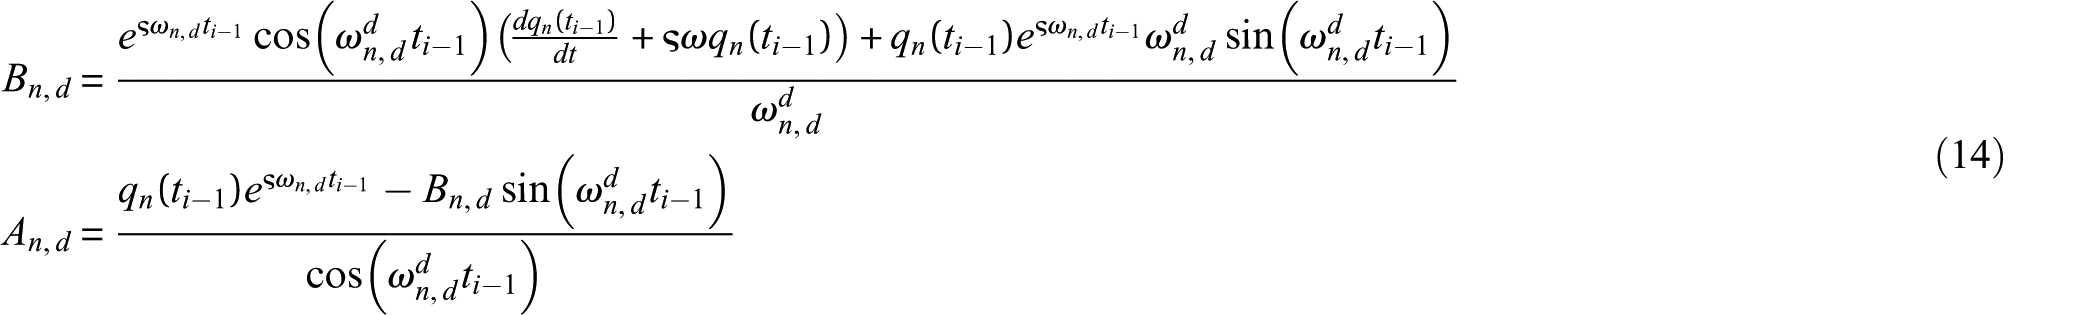
In equations (9) to (14), the subscripts
SampEn
Entropy can quantify the irregularity of time domain signals so as to detect and evaluate the breathing crack, which generates perturbations on the structural vibration signals. SampEn is capable in well handling of short, noisy data samples with trouble-free implementation.
36
Let us take a time series
First, template vectors of length
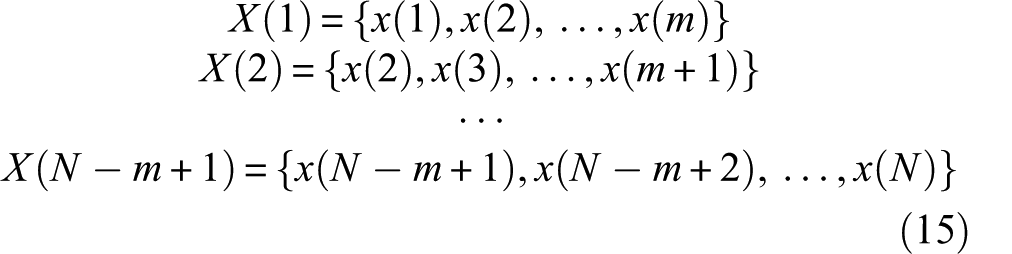
Then, the Chebyshev distance between all template vectors are calculated, and let us denote it by
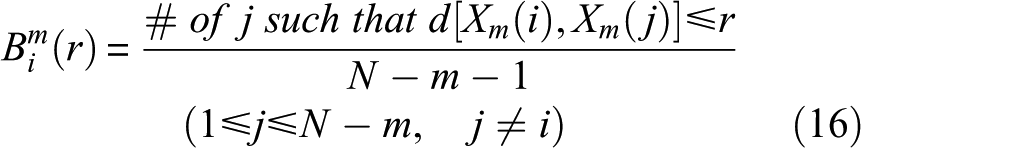
where

In equation (17),
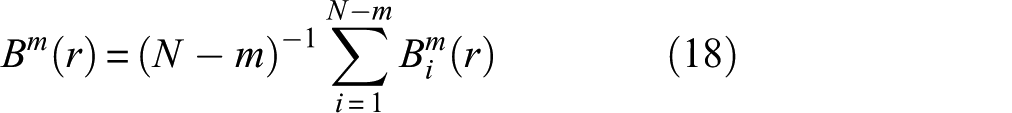
Similarly, for template vectors of length
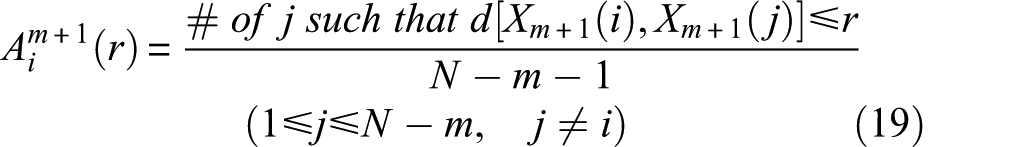
and similar to equation (18)
SampEn is then defined as follows

In this derivation,
QASE
The main objective behind the development of this new entropy measure, QASE, is to have improved computational efficiency while quantifying the irregularities meaningfully. 48 In order to achieve this improved computational efficiency, the core of the entropy calculation algorithm is based on a method called “relative coarse quantization of time series data.” This coarse quantization of data hugely lowers the computational times over other entropy methods, and this quantization process is described below.
Let us consider a time series

where
Then, these quantized data samples are grouped (called “vector groups”) using an embedding dimension “m”
The vector identifiers
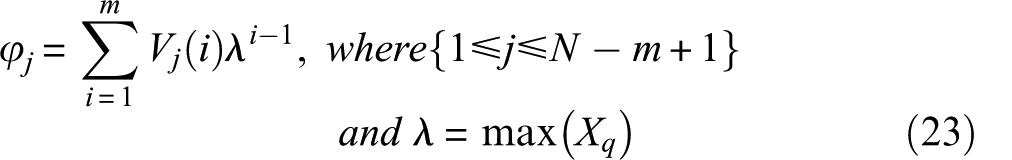
Then, it is possible to define the number of occurrences of each identifier as follows
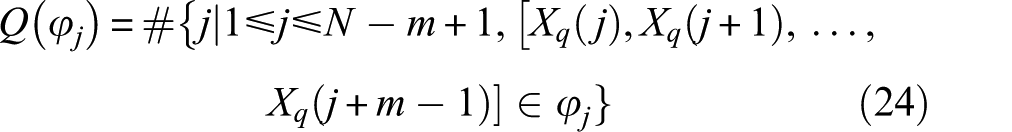
Now, depending on these numbers of presence of each vector identifier, it is possible to construct the QASE in the following way.
The probability values of
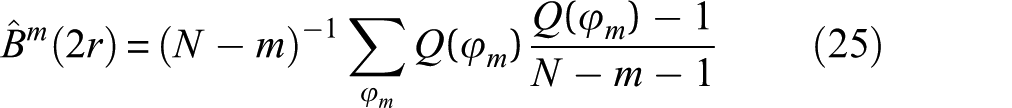
Then, QASE is derived as follows

WT
WT is a signal processing method, which can magnify the perturbations or irregularities in signals
47
and be used to further enhance/support the entropy measurement to quantify the signal perturbations with higher sensitivity. The wavelet is a smooth and quickly vanishing oscillating function. WT maps a temporal signal,
where

In this study, we use the “symlet2” as the mother wavelet function, and WT is realized using the MATLAB® software package.
Experimental setup
To validate the results and conclusions obtained through numerical simulations, experimental measurements on relevant aluminum alloy (grade 6061-T6) cantilever beams are conducted. The breathing cracks are constructed by bonding three aluminum alloy beams together; the same technique has been used by Prime and Shevitz 51 and Douka and Hadjileontiadis 52 to demonstrate breathing cracks experimentally. To prepare the bonded beam simulating the closed crack, first, small shallow cavities throughout the beam surfaces on the gluing side are prepared. Second, the gluing surfaces are made rough using a file before applying high-strength metal weld glue, J-B Weld glue. Then, surfaces are carefully put together, and the beam is clamped by applying a moderate pressure resulting in a very thin glue layer. These beams are kept in clamped position for 24 h before removing the claps and excess glue on the sides of the beam. Figure 3 illustrates the schematic arrangement of the bonded beam pieces for constructing the beam with a 50% crack depth percentage.
Schematic diagram of the constructed test beam for 50% crack depth percentage.
The crack is located 0.01 m from the fixed end of the cantilever beam, and the beam span is 1.00 m, which are same with the theoretical model. The healthy beam (0% crack depth percentage) is constructed by bonding two equivalent beams. This restricts the differences between healthy and cracked beams to the crack region. 51 Beams with 25% and 50% crack depth percentages are selected for the experimental validations due to ease of construction of those beams with the available materials. As shown in Figure 3, the 50% crack depth percentage beam is constructed by bonding two aluminum alloy pieces of 0.003175 m (1/8 in.) thickness on top of a continuous piece with 0.003175 m (1/8 in.) thickness, while the thicknesses of upper and lower aluminum alloy pieces of 25% crack depth percentage beam are 0.0015875 m (1/16 in.) and 0.0047625 m (3/16 in.), respectively. The final thickness of all the constructed beams is 0.00635 m (1/4 in.) with 0.0254 m (1.00 in.) wide.
Figure 4 illustrates the experimental setup for obtaining the dynamic response from the 50% crack depth percentage beam. The beam is tightly clamped using four bolts to a steel clamping post which is solidly fixed to the concrete test bench. The free end of the beam is sinusoidally excited using a shaker (model 2100E11; The Modal Shop). PCB Piezotronics model 352A24 accelerometer weighing 0.8 g is located 0.10 m away from the free end of the beam. The sinusoidal signal generation and data acquisition are done using LMS SCADAS Mobile (type SCM05) data acquisition system and a personal computer.
The experimental setup for obtaining dynamic responses of damaged and healthy aluminum alloy cantilever beams: (a) the whole setup and (b) the data acquisition system.
Results and discussions
This section presents the results and corresponding discussions pertaining to the study of the crack identification of the cantilever beam, which is described in section “Methodology of damage identification with entropy.” The dimensions, material properties of the beam, and vibration parameters are given in Table 1.
Dimensions and material properties of the cantilever beam.
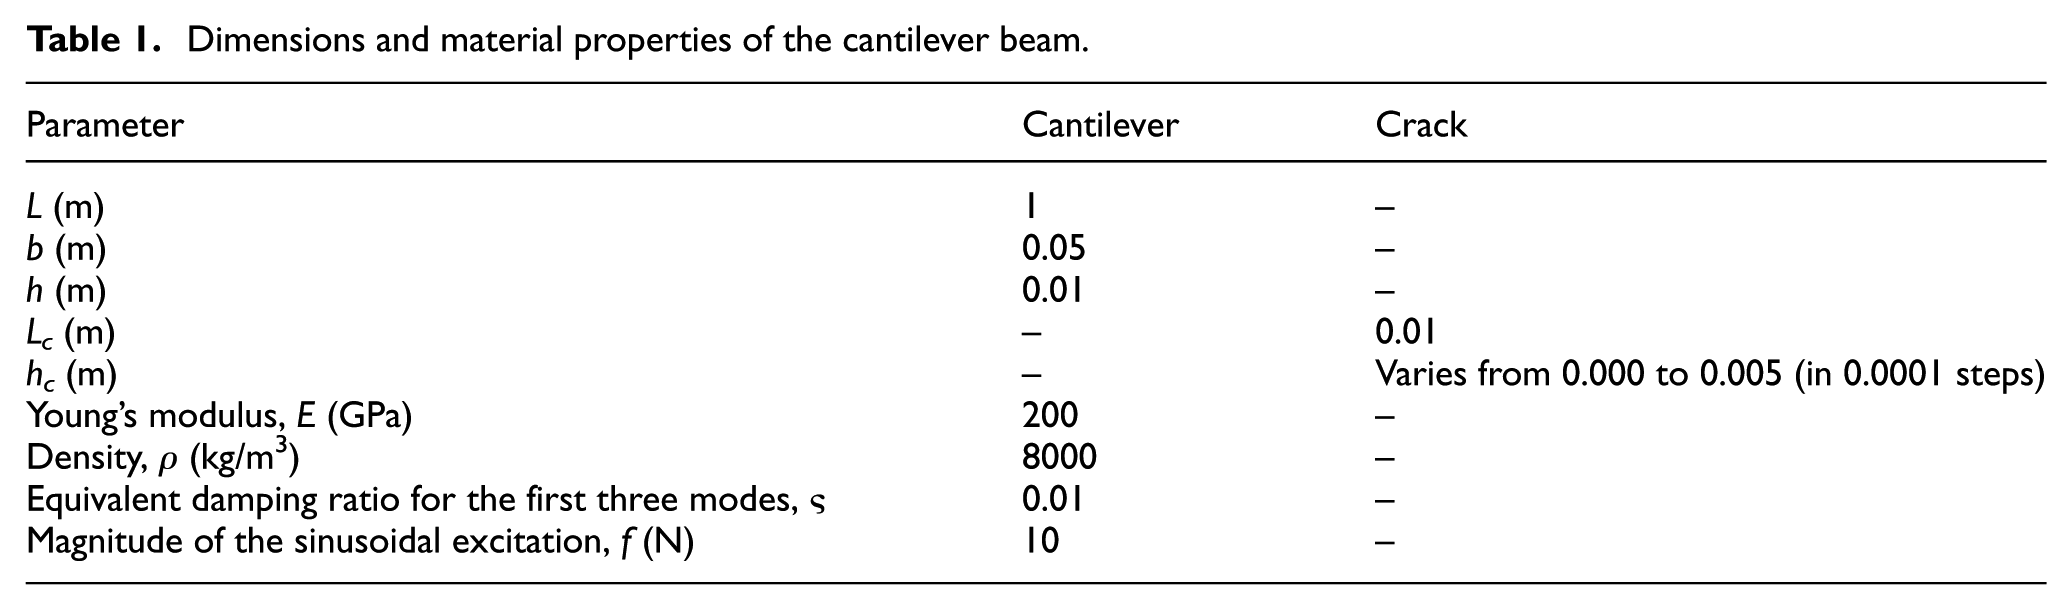
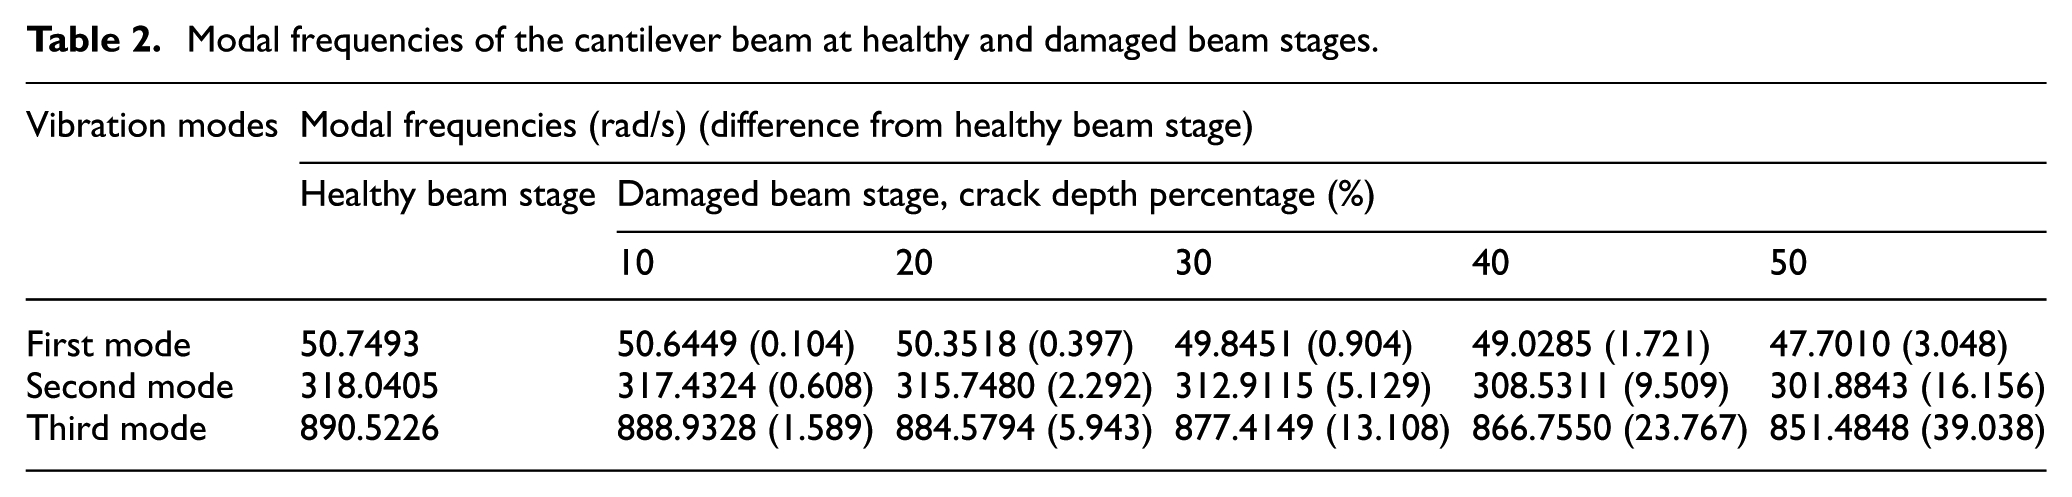
Table 2 provides the modal/natural frequencies of the beam at healthy and damaged beam stages (corresponding to closed crack and open crack stages) with different crack depth percentages (crack depth percentage is the percentage ratio of crack depth to the total beam thickness).
Modal frequencies of the cantilever beam at healthy and damaged beam stages.
During the simulation of the forced vibration response, the beam is subjected to sinusoidal excitation at the free end of the beam,
Dynamic responses of the breathing-crack beam model
In this section, several dynamic responses of the cantilever beam subjected to different excitation frequencies are presented with and without damping effect. It is noted that more accurate vibration response can be obtained with smaller iteration step length
Figure 5 illustrates the vibration responses of the beam with 20% crack severity subjected to excitations of 45 and 300 rad/s, which are close to the first and second modal frequencies of the beam, respectively. More discussions on dynamic responses relating to breathing of a cantilever beam and comparison of results from iterative method to the ones from finite element analysis (FEA) are found in the study by Wu. 31
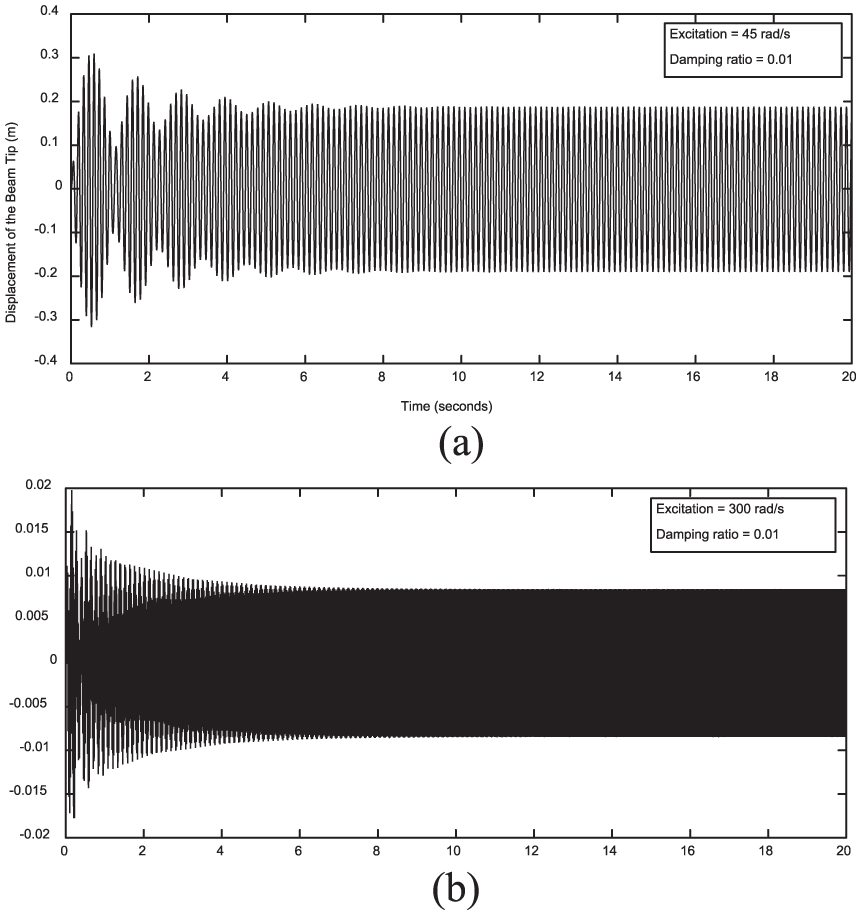
Dynamic responses at the free end of the cantilever beam under excitation frequencies of (a) 45 rad/s and (b) 300 rad/s.
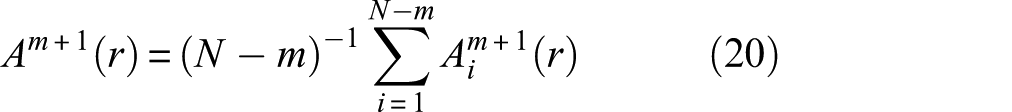
Direct calculation of the SampEn from the dynamic responses of the beam with breathing crack
Figure 6 illustrates the percentage increment of the SampEn of the cracked beams with respect to one of the healthy beams (the percentage SampEn of the healthy beam is 0%) and the percentage increment variation with different crack depth percentages.
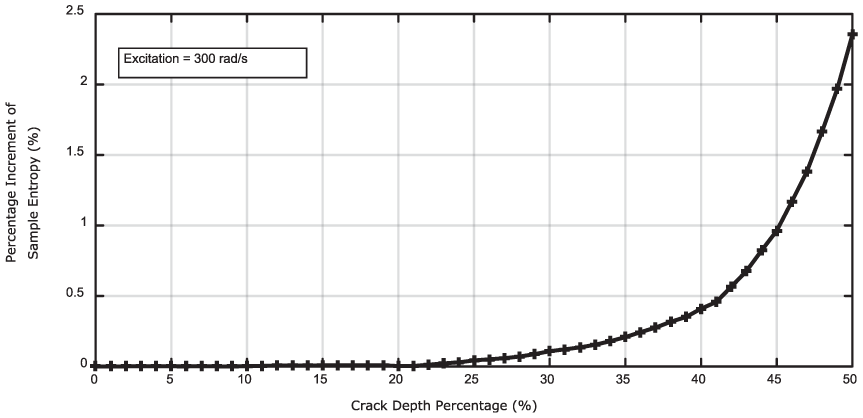
Variation of percentage increment of SampEn with different crack depth percentages.
The results depicted in Figure 6 are with the excitation of 300 rad/s. This represents the general variation of the SampEn values for other excitation frequencies studied. The embedding dimension “m” and tolerance value “r” for SampEn are 2 and 0.2 of SD of data, respectively. A total of 20,000 of data samples from steady-state dynamic response are used for the entropy calculations. It can be seen from Figure 6, when the entropy calculations are directly employed on the dynamic signals, that the method is fairly sensitive. It is seen that even at the 50% crack depth, the increment in the SampEn percentage is around just 2.5%. It can be concluded that the crack breathing effect on the vibration response of the beam structure is small with weak perturbations, which is not significant enough for the damage identification with entropy measurements. In practical applications, the small SampEn increment can be degraded due to the presence of various noise components.
Entropy calculations with WT as a data pre-processor
In the current analysis, the dynamic response generated by the iterative numerical method is first pre-processed by the WT, and then, these transformed data are used for the entropy calculations. The crack depth and SampEn value correlations are revealed.
Figure 7 shows the variation of the percentage increment of the SampEn of the cracked beam with respect to healthy beam with different crack depth percentages. The parametric values of “m” and “r” for SampEn are 2 and 0.2 times SD of data, respectively. The 20,000 data points of the “steady-state” dynamic response are first sent through “symlet2,” which is the wavelet family used in MATLAB WT package. The WT is repeated for nine times one WT after another WT manner to have reasonable amplifications of the breathing effects. SampEn calculations are then conducted on the wavelet-transformed data. The variations of the percentage increment of SampEn with different crack depth percentages are found to be sensitive to the scaling parameter of WT. From Figure 7, it is observed that low scaling parameters work well with vibration signals of higher excitation frequencies and vice versa.
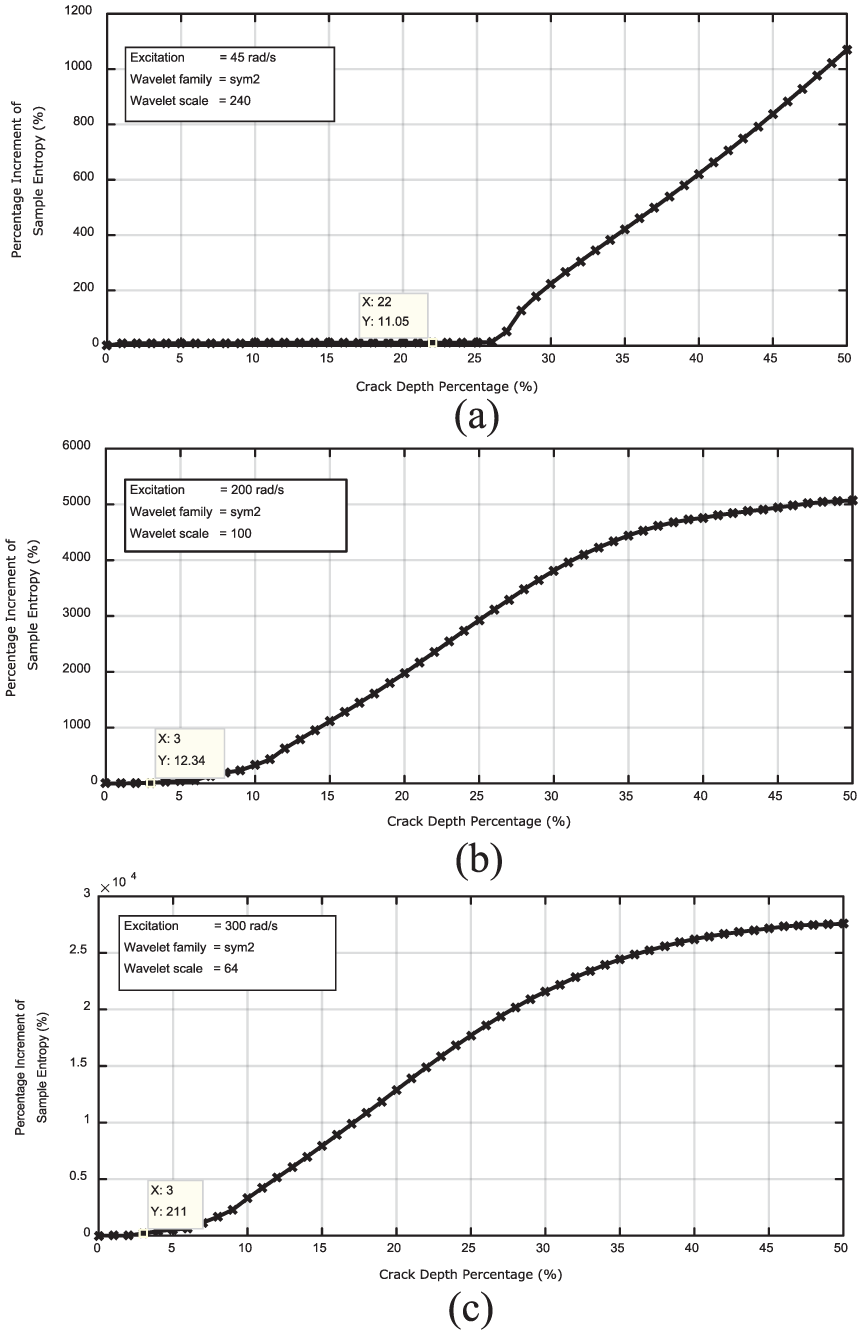
Variation of percentage increment of sample entropy of the wavelet-transformed dynamic responses with different excitation frequencies: (a) 45 rad/s, (b) 200 rad/s, and (c) 300 rad/s.
From Figure 7, dramatic increments in the sensitivity in crack identification can be seen showing much larger entropy value increments due to the crack breathing effect after the introduction of WT. In Figure 7(a), for the excitation of 45 rad/s, the crack depth percentage varies from 0% (healthy beam) to 50%, and SampEn percentage increment varies from 0% to around 1050%. During the analysis of the simulation results, it is assumed that the cracks are only identifiable when the percentage increments of entropies due to the crack effect are more than 10% compared to the healthy beam. This is to keep some safe margin for the presumed degradation of the results of the proposed crack identification method due to the inevitable environmental noises during the practical operation. With this assumption, from Figure 7(a), it is noted 22% of crack depth percentage can be detected with 11% SampEn increment compared to the healthy structure. Then, the increment value increases slightly until the crack depth percentage of 26% where it shows 13% of SampEn increment compared to the healthy beam, and then, the increment value increases almost linearly with the increment of the crack depth. From Figure 7(b) and (c), similar trends can be found, but much higher damage identification sensitivity can be realized with higher excitation frequencies. In Figure 7(b), with the 200 rad/s excitation, SampEn percentage increment is about 5000% at 50% crack depth, and Figure 7(c) shows around 27,000% increment with 300 rad/s excitation frequency at 50% crack depth. Both Figure 7(b) and (c) shows more than 10% increment in SampEn compared with the healthy structure at an initial crack with 3% depth percentage. Again, the 300 rad/s shows much higher SampEn increment (211%) than 200 rad/s case (12%) at 3% of crack depth percentage.
According to equations (6) and (7), larger crack depths in the beam lead to more significant stiffness reductions and larger slope differences at the two sides of the crack when the crack opens. Therefore, larger cracks result in more significant changes in the structure response during the vibration with the crack breathing. This is evident in Table 2, where it is noticeable that the difference in the modal frequencies of the healthy beam and the damaged beam stages increases as the crack depth increases; for example, in the first mode of vibration, this particular difference increases from 0.104 to 3.048 rad/s when the crack depth percentage increases from 10% to 50%. The structural change during the vibration induces more significant perturbations in the vibration signal and hence leads to larger entropy values. As it is seen in section “Direct calculation of the SampEn from the dynamic responses of the beam with breathing crack,” the perturbations are not substantial enough to make significant changes in the SampEn values compared to the healthy beam. However, after these perturbations are amplified by WT, it is evident from Figure 7 that entropy calculations are much more sensitive to the changes of the crack depths yielding much more significant SampEn increment. The amplification of perturbations by WT makes the proposed methodology to have superior sensitivities in crack identification in certain frequencies around 200–330 rad/s than the frequencies around 40–200 rad/s.
Higher excitation frequencies lead the vibration of the beam to be dominated by higher vibration modes of the beam. Since the crack is closer to the fixed end of the beam, which is the most practical location for occurrence of fatigue cracks, the higher normalized vibration mode shapes provide higher curvatures distribution at the crack position compared with the normalized lower mode vibration shapes which are dominant in lower excitation frequencies. These larger curvatures at the crack position give rise to more significant stiffness reduction at the crack, which result in more significant changes in the structure and its response during the vibration with the crack breathing, even at the initial stages of the crack. This is again evident in Table 2; higher modal frequency difference between healthy and the damaged stages is found for higher natural modes of the structure with any given crack severity level; if 10% of crack depth is considered, this difference increases as 0.104, 0.608, and 1.589 rad/s for the first, second, and the third vibration modes, respectively. Therefore, with constant excitation amplitude, as the excitation frequency increases, the vibration responses with higher vibration modes lead to more significant perturbations in the vibration signal. In addition, in a similar cantilever beam study with a breathing crack, Wu 31 has observed dramatic non-linear increment in the equivalent breathing frequencies with the increment of the excitation frequency closer to the second natural frequency of the beam. Higher breathing frequencies impose more perturbations in the vibration signal within a certain period leading to higher entropy increments. Therefore, higher entropy percentage increments, which ultimately result in better crack identification sensitivities, are induced by higher excitation frequencies.
Even though the SampEn shows higher sensitivities (once combined with WT) to the crack-induced perturbations, one thing noticed in the analysis is their long computational times. This would be a problem during implementation of the proposed work for a real application. Therefore, QASE is used to improve the computational efficiencies of the crack identification process.
Speed-up of crack identification process with QASE
QASE is an entropy measure, which is developed by keeping in mind of higher computational efficiencies. Therefore, it is intended to use QASE together with SampEn to speed-up the crack identification process. Figure 8 compares computational times for SampEn and QASE and reveals the huge computational time gains of QASE over SampEn.
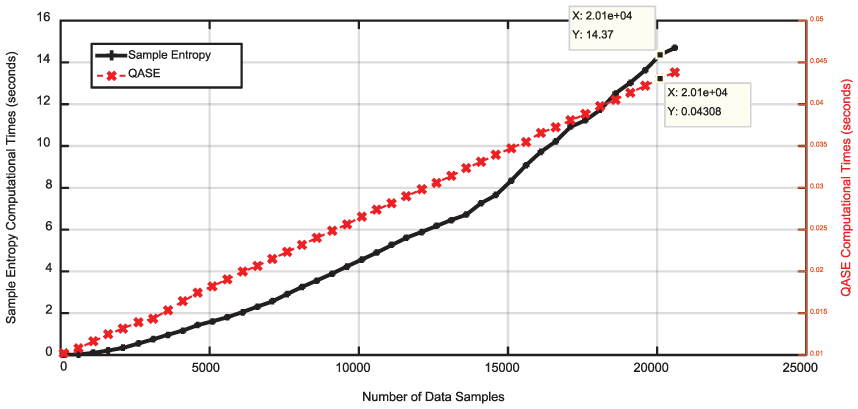
Variation of computational times of SampEn and QASE with different number of data samples.
The computations are done using an Intel® Core i5 3.30-GHz personal computer with 8 GB of random-access memory (RAM) without running any other substantial program in background. In Figure 8, x-axis shows the number of data samples used for the entropy calculations. At 20,000 data samples, which is the number of data samples used throughout the analysis, QASE takes 0.04 s for the calculations and SampEn needs 14 s. QASE is about 325 times faster than SampEn at 20,000 data samples. This computational gain can be used to improve the computational speed of the crack identification process.
Figure 9 shows the variation of both percentage increments of SampEn and QASE with different crack depth percentages changing from 0% to 50%. The excitation frequency is 300 rad/s, and the same WT is used prior to the entropy calculations (SampEn variation is same as the illustration in Figure 7(c)). The parametric values of “m” and “r” for both SampEn and QASE are 2 and 0.2 times SD of data, respectively. Figure 9 shows around 1900% QASE increment at just 5% crack depth compared with the healthy beam, although the QASE variation with different crack depths is not as smooth as SampEn. The non-smooth behavior of QASE is due to the approximation technique called “relative coarse quantization of data,” which is used by the QASE to approximate SampEn.
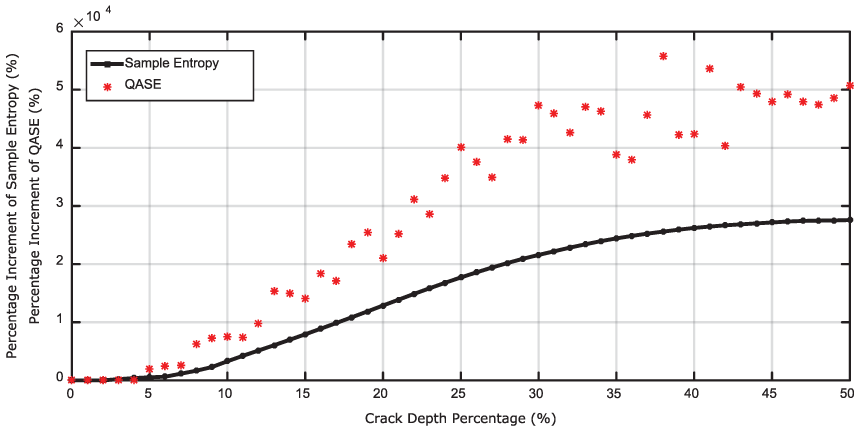
Variation of percentage increment of SampEn and QASE with different crack depth percentages with excitation frequency of 300 rad/s.
The non-smooth variation of the QASE disqualifies it as the major entropy measure to accurately quantify the crack depth, but its computational efficiency improvement can still benefit the proposed work for the high-sensitivity damage detection. It is decided to use QASE as the initial crack detector due to its better computational efficiencies and ability to display considerable percentage entropy increments compared with the healthy structure especially at initial crack depths. Then, once a crack is detected by QASE values, SampEn is employed to further evaluate the crack. This approach leads to faster crack detection with QASE and accurate damage predictions with SampEn.
So far, everything has been analyzed in a sense of pure computational environment, without considering any outside noises, which are inevitable in practical testing. Therefore, as the next step, the effect of noisy vibration signals on the current methodology is studied.
Impact of observational noise
The impact on the proposed method by the presence of noise in the vibration signal is studied by adding Gaussian white noise to the dynamic response of the beam, which has been illustrated in section “Dynamic responses of the breathing-crack beam model.” This noisy data represent real vibration data collected from a practical vibration testing using a data acquisition system.
Figure 10 shows the averaged variation of percentage increments of SampEn and QASE with different crack depth percentages for noisy data for 10 runs; the excitation frequency is 45 rad/s and the noise level is 40 dB of signal-to-noise ratio (SNR). SNR is measured using the logarithmic decibel scale of the ratio between the root sum square (RSS) of signal to RSS of noise. The averaging of the values from the 10 runs is done by taking the linear average of percentage entropy increments compared to the healthy beam value. Each run imposes randomly created noise on the dynamic signal; therefore, slightly different results are obtained in each run for the percentage entropy increments. The averaging is more realistic with real-world application of the proposed method. The excitation frequency of 45 rad/s is chosen for the study because in the section “Entropy calculations with WT as a data pre-processor,” it can be seen that the crack identification results for lower excitation frequencies are not as good as for higher excitation frequencies; therefore, study of the worst scenario in depth is given more importance.
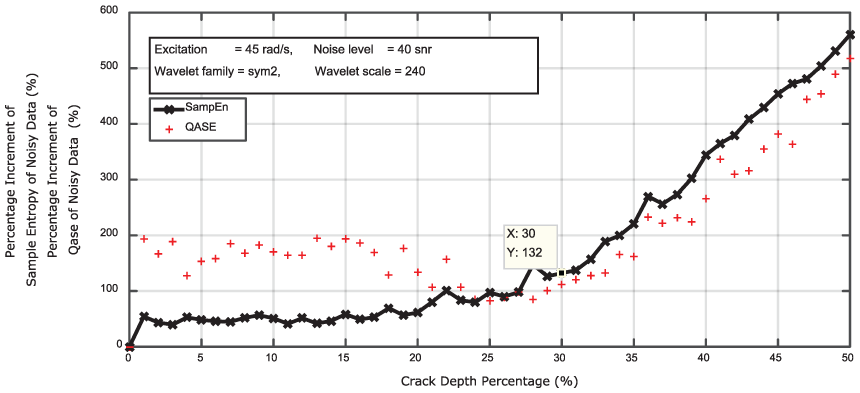
Variation of percentage increment of SampEn and QASE with different crack depth percentages for noisy data with 40 dB SNR of noise level (the excitation frequency is 45 rad/s).
From Figure 10, it can be seen that the range of the percentage increment of SampEn compared with the healthy beam is from 0% to around 560% when crack depth increases from 0% to 50%; for QASE, this range of the percentage increment is from 0% to about 517% (the word “range” stands for the amount of variation in the entropy increment compared with the healthy structure when the crack depth percentage varies from 0% to 50% of the beam thickness). It is noted that for the noiseless scenario given in Figure 7(a), the particular range of the percentage increment is from 0% to around 1050% for SampEn. During the analysis, it is noted that for QASE, the entropy increment range is from 0% to around 1080% as the crack depth percentage varies from 0% to 50%. The sensitivity of crack detection for noiseless scenario is 22% crack depth of total beam thickness (with 11% increment of SampEn), and for the 40 dB SNR scenario, the sensitivity has dropped down to 30% (with 132% increment of SampEn). The reason behind the reduction in the sensitivity due to the presence of noise in the vibration signal is explained in the next paragraph.
For the excitation of 45 rad/s, for the noiseless dynamic responses, it is observed that both SampEn and QASE are not significantly sensitive to the crack depth percentages until around 26% compared to their dramatic increments for the rest of the crack depth percentages from 26% to 50%. Therefore, once the noise is present in the dynamic signal, the noise is more dominant than the crack breathing effect for the crack depth percentages of 0% to 26%. This leads to more fluctuations in the percentage entropy increments in both SampEn and QASE in that crack percentage region so as to reduce the sensitivity of crack detection.
The results obtained in this section for noisy dynamic signals can be compared with real experimental results obtained for a similar beam setup.
Experimental results and comparison with the numerical values
In this section, the numerically simulated results obtained for noisy dynamic signals (40 SNR) for a lower excitation (45 rad/s) in the previous section are compared with experimental results. In real experimental testing, random noise is always inevitable. The experimental results are hence compared with simulation results directly without manually introducing noise in experimental testing.
The three experimental aluminum alloy cantilever beams, that is, healthy beam, 25% crack depth percentage beam, and 50% crack depth percentage beam, are excited with a frequency of 5.92 Hz which is close to the first modal frequencies of the three beams. Measurements include raw acceleration–time data for the three beams. Figure 11 shows a snapshot of the time series data for 50% crack depth percentage beam.
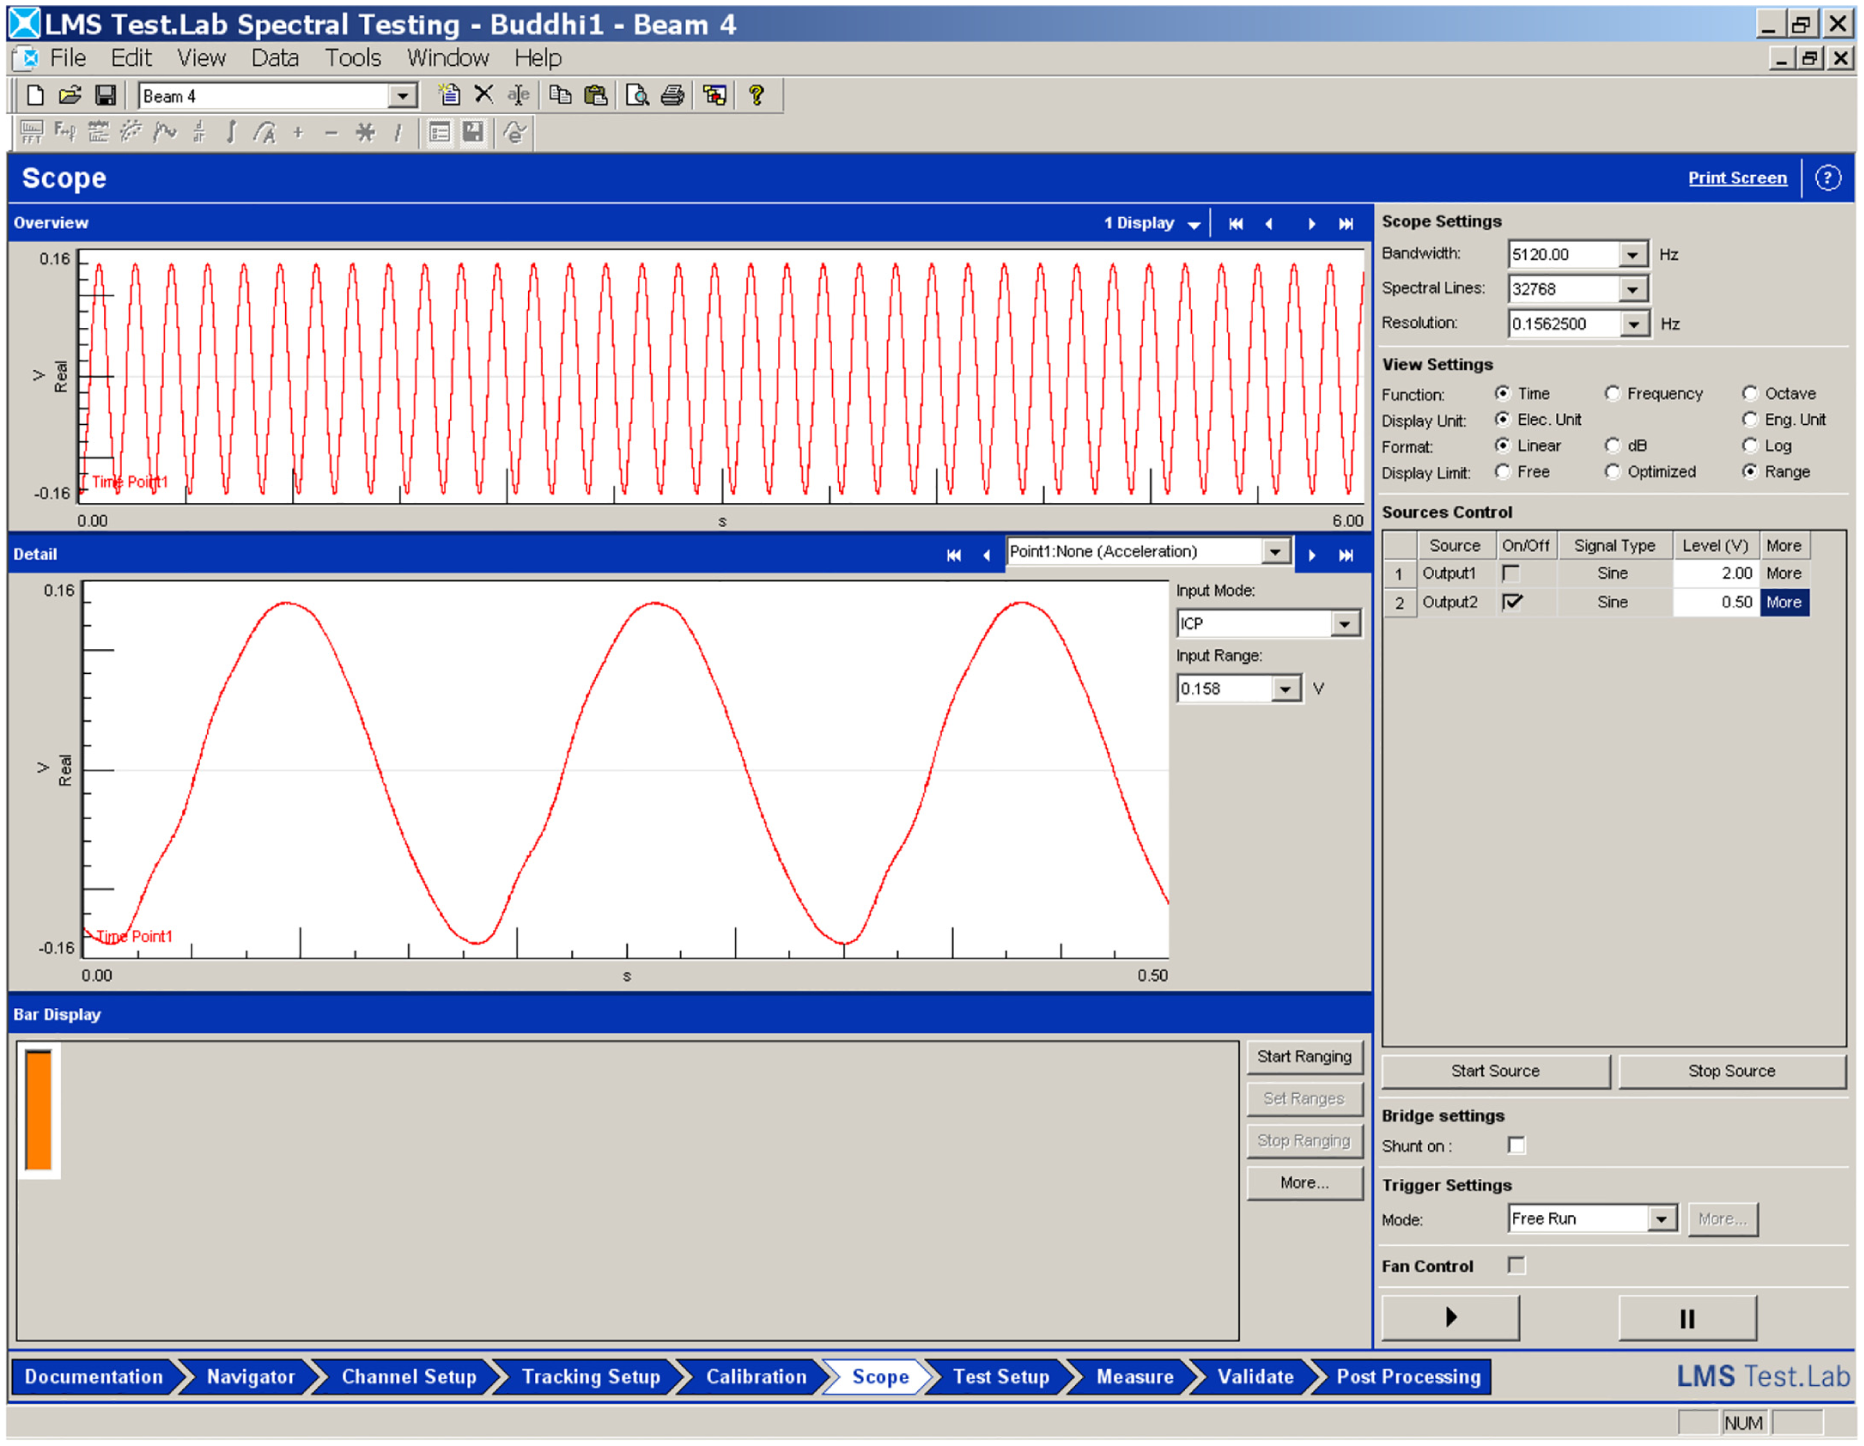
Graphical user interface of the data acquisition system for the experimental setup (time series is shown for the beam with 50% crack depth percentage).
From the acceleration–time data collected for the three beams, 20,000 data samples are selected for further analysis. These data sets are then transformed using WT (same WT parameter values are used as the numerical simulation; that is, scale is 240 and WT is done for nine consecutive times). The transformed data are then analyzed using SampEn and QASE while keeping the entropy parameter values same as the numerical analysis (m = 2 and k = 0.2). This procedure is repeated for 10 times for all three beams using 10 different data sets collected in different experimental run initiations. Table 3 compares the experimental and numerical results of linearly averaged (using 10 runs) SampEn and QASE percentage increments for 25% and 50% crack depth percentage beams compared to the healthy beam. Numerical results for 25% and 50% crack depth percentage beams are obtained from the previous section.
Averaged percentage increment (10 runs) of SampEn and QASE for the beams of 25% and 50% crack depth percentages.
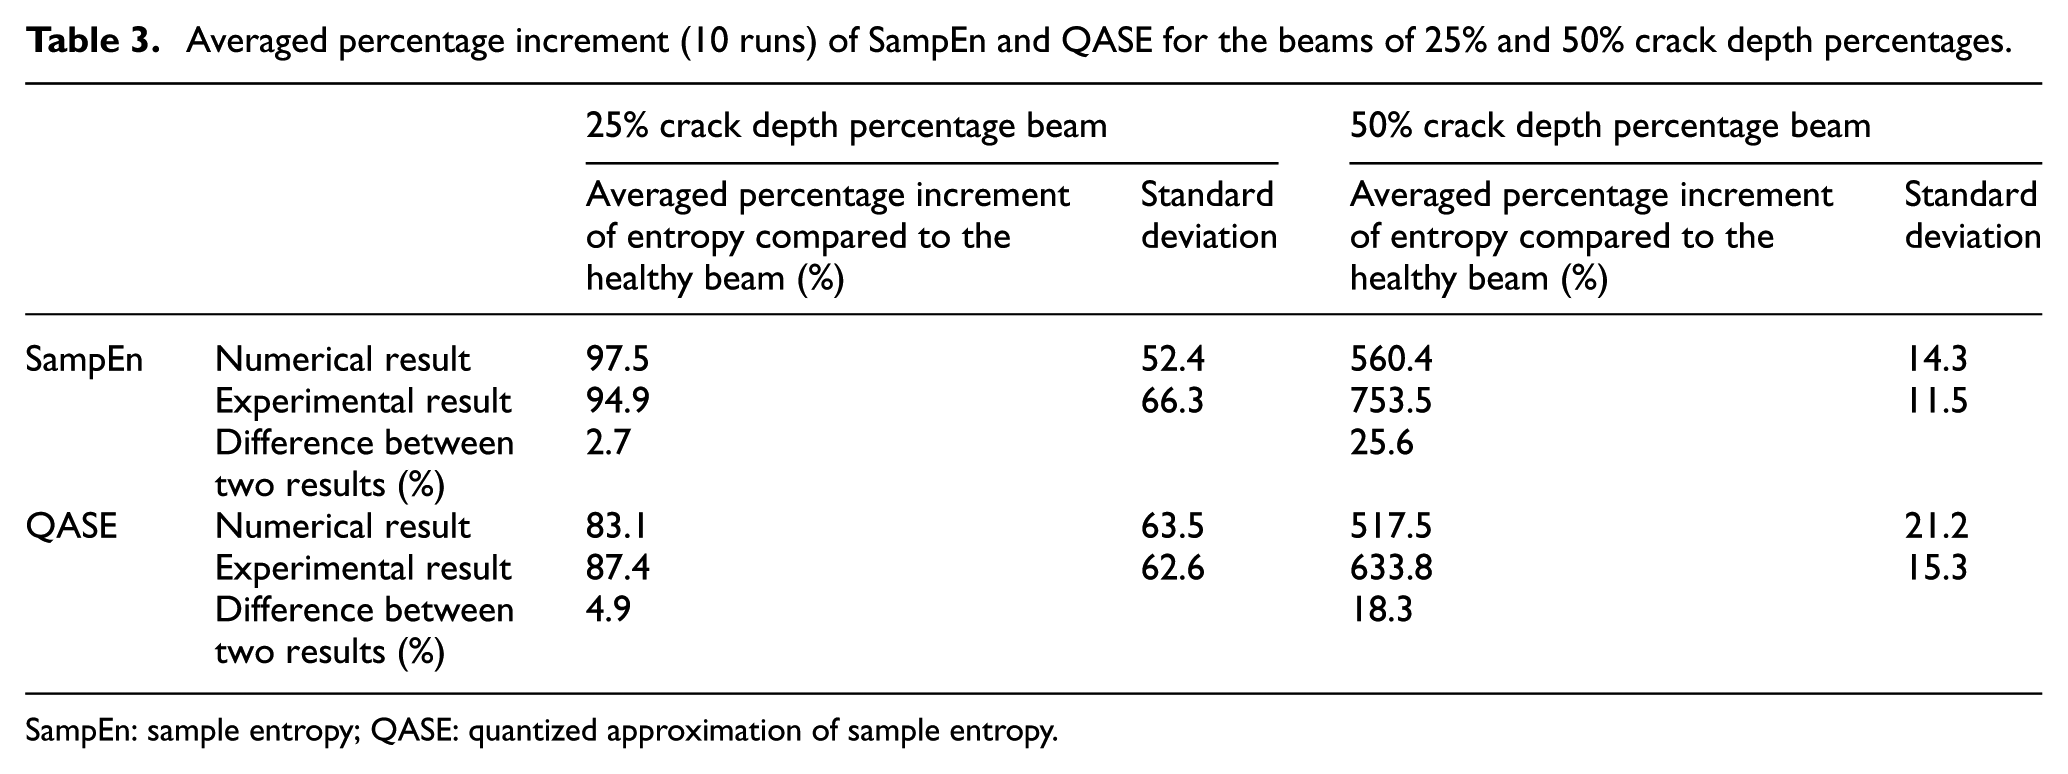
SampEn: sample entropy; QASE: quantized approximation of sample entropy.
From Table 3, it can be seen that numerical and experimental results have a good match with each other for both crack depth percentages. For the 25% crack depth percentage beam, SampEn increment difference between numerical and experimental methods is as small as 2.7%, while QASE shows a difference of 4.9%. On the other hand, for 50% crack depth percentage beam, numerical and experimental values of SampEn show a difference of 25.6% and QASE shows 18.3% for the respective difference.
In addition, from Table 3, it is also noted that the SD values are comparatively larger for 25% crack depth percentage beam over the 50% crack depth percentage beam for both numerical and experimental results. This result further strengthens the point that for the crack depth percentage region from 0% to around 26%, both SampEn and QASE are not very sensitive to the crack breathing for lower excitation frequencies due to the dominance of the noise.
Conclusion and future works
The high-sensitivity breathing crack identification (detection and evaluation) of a beam structure is studied and realized using entropy measures. An iterative numerical method is used to accurately generate the dynamic responses of the beam and simulate the weak signal perturbations/irregularities imposed by the crack breathing effect. These weak perturbations/irregularities are then amplified by WT and quantified using two entropy measures: SampEn and QASE. Through numerical simulations and experimental studies, the following conclusions are noted. (1) High-sensitivity crack identification for small and initial crack with only 3% of the beam thickness is observed and realized with more than 200% increment in SampEn compared with the healthy beam. (2) The computational time is significantly reduced with QASE by about 325 times at 20,000 data samples compared to SampEn. (3) The proposed method is validated using experimental results, where numerical and experimental results are in good agreement to each other. The proposed methodology only requires one sensor for the crack identification purpose, and the method is capable of online real-time continuous health monitoring of structures. Furthermore, the proposed technique can also be applied to other types of complex structures, such as plates and shells.
The further works will be extended to establishing an effective filtering process on the experimental noisy data without reducing the signal perturbation induced by crack breathing. A parametric study on the entropy calculation to further increase the crack identification sensitivity with lower excitation frequency is also suggested. These aspects will be covered in the next steps of the research to promote the proposed method as a powerful SHM tool for practical applications.
Footnotes
Appendix 1
Figure 12 shows the entropy convergence results. It is observed that SampEn converges when the number of data samples are around 18,000. During the analysis, 20,000 data samples are used in all the calculations.
Declaration of conflicting interests
The author(s) declared no potential conflicts of interest with respect to the research, authorship, and/or publication of this article.
Funding
The author(s) disclosed receipt of the following financial support for the research, authorship, and/or publication of this article: This research was undertaken, in part, under the sponsorship of the fundings from University of Manitoba and Natural Sciences and Engineering Research Council of Canada (NSERC).