
Abstract
Foundation pit displacement is a critical safety risk for both building structure and people lives. The accurate displacement monitoring and prediction of a deep foundation pit are essential to prevent potential risks at early construction stage. To achieve accurate prediction, machine learning methods are extensively applied to fulfill this purpose. However, these approaches, such as support vector machines, have limitations in terms of data processing efficiency and prediction accuracy. As an emerging approach derived from support vector machines, least squares support vector machine improve the data processing efficiency through better use of equality constraints in the least squares loss functions. However, the accuracy of this approach highly relies on the large volume of influencing factors from the measurement of adjacent critical points, which is not normally available during the construction process. To address this issue, this study proposes an improved least squares support vector machine algorithm based on multi-point measuring techniques, namely, multi-point least squares support vector machine. To evaluate the effectiveness of the proposed multi-point least squares support vector machine approach, a real case study project was selected, and the results illustrated that the multi-point least squares support vector machine approach on average outperformed single-point least squares support vector machine in terms of prediction accuracy during the foundation pit monitoring and prediction process.
Keywords
Introduction
The increase of population in metropolitan and urban cities has driven a growing pace of utilizing the underground space. The effective management of construction safety associated with deep-ground foundation works will ensure the infallible integrity for the life of the structure.1,2 In practice, retaining structures are commonly applied to resist the forces from soil and rocks, thereby ensuring slope stability. When the displacements caused by the forces that exceed the displacement limits of retaining material, it could result in safety risk.3,4 To prevent the latent risks associated with the displacement, it is imperative and vital to undertake the tasks of regular and accurate monitoring and prediction of displacements through surveying the foundation pit slope and its retaining structures.
However, the implementation of such tasks is a challenge in reality, given the complexity of a foundation pit system and the difficulty of selecting the crucial data with highly correlated parameters. The current practice of investigating the slope stability is primarily carried out using rigid-body limit equilibrium and the finite-element method. 5 However, these methods have been plagued with the incapability of nonlinear structural deformation estimation, and they cannot constantly assess the stability of slip surface. 6 Therefore, monitoring and estimating the displacement of foundation pit slope are not easy tasks if only traditional methods are applied. Such tasks require not only practical modeling techniques, but also in-depth engineering knowledge and experience, and sufficient on-site data. 7
Currently, efforts have been made to adopt intelligent computational methods, such as artificial neural networks (ANNs) and support vector machines (SVMs), for forecasting the displacement of foundation pit slope. ANNs are the nonlinear mapping tool and have a good self-learning ability to be utilized in predicting the structural displacement under various types of soil and loading.8–11 Nevertheless, their inherent defects, such as the slow of convergence, the poor of the generalizing performance, prone to be trapped in the local optimum, over-fitting and poor stability, have rendered ANNs not robust and unreliable for certain particular studies. 8 Therefore, alternative approaches that can forecast the displacement of foundation pit slope with more precise and robust results are needed.
SVMs are supervised learning models with related learning algorithms in machine learning, founded by Cortes and Vapnik. 12 Compare with ANNs, 13 SVMs have satisfying performance in classification and prediction, due to their ability to understand and learn complex interconnections when adequate sampling data are available. SVMs have also been successfully applied in several fields, such as chemical engineering, 14 bioengineering, 15 medical informatics, 16 finance, 17 and energy. 18
As an adjusted variant of an SVM, the least squares support vector machine (LSSVM) was developed to facilitate a faster training process and to obtain a more accurate forecast result. 19 It uses least squares loss function and equality constraints to acquire a linear set of equations instead of an inequality constraint that has been applied in SVMs, which facilitates the complicated calculation and makes training easier. Noticeably, it is observed that accurate deformation forecasting of a foundation surface based on the LSSVM approach typically relies on involving a significant amount of influencing factors derived from adjacent single point, which therefore results in large working load in the data collection stage. To overcome this challenge, this article further investigates the potentials of LSSVM in foundation pit displacements monitoring and prediction by integrating multi-point measuring techniques, 20 which considers multiple measuring points with close proximity as one measurement to offset the internal effects of adjacent single point. With the aims to elucidate the algorithms and parameters that are widely employed in previous LSSVM applications, and to eventually move toward formulating multi-point least squares support vector machine (MP-LSSVM) approach, this article presents the fundamentals of LSSVM in section “Overview of LSSVM” and elaborates on the proposed methodology in section “Methodology.” In section “Case study,” this article quantitatively evaluates the formulated MP-LSSVM approach against traditional single-point least squares support vector machine (SP-LSSVM) and finally concludes the key findings of implementing MP-LSSVM in foundation pit displacements monitoring and prediction in section “Discussion and conclusion.”
Overview of LSSVM
As an improvement of standard SVMs, LSSVM has shown abilities in solving regression, classification, and optimization problems. Because the LSSVM provides a computational advantage over the SVM by converting quadratic optimization problem into a system of linear equations, it has developed into an appealing intelligence technique.21,22 The objective of the LSSVM is to fit a surrogate model for mapping the relationship between a set of inputs and outputs by adopting training data. Under the assumption that a training data set can be depicted as
With a nonlinear function

where

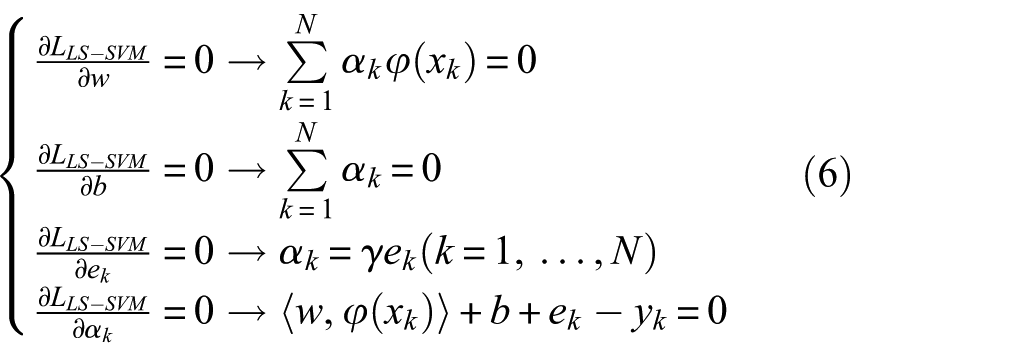
The conditions for optimality are given by equation (6) with Lagrange multiplier
except for the situation when
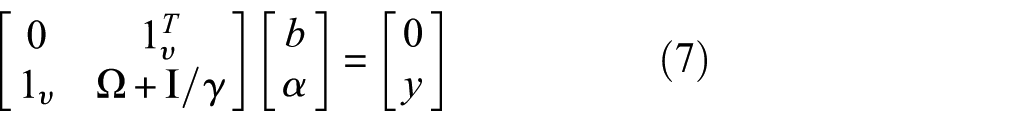
where

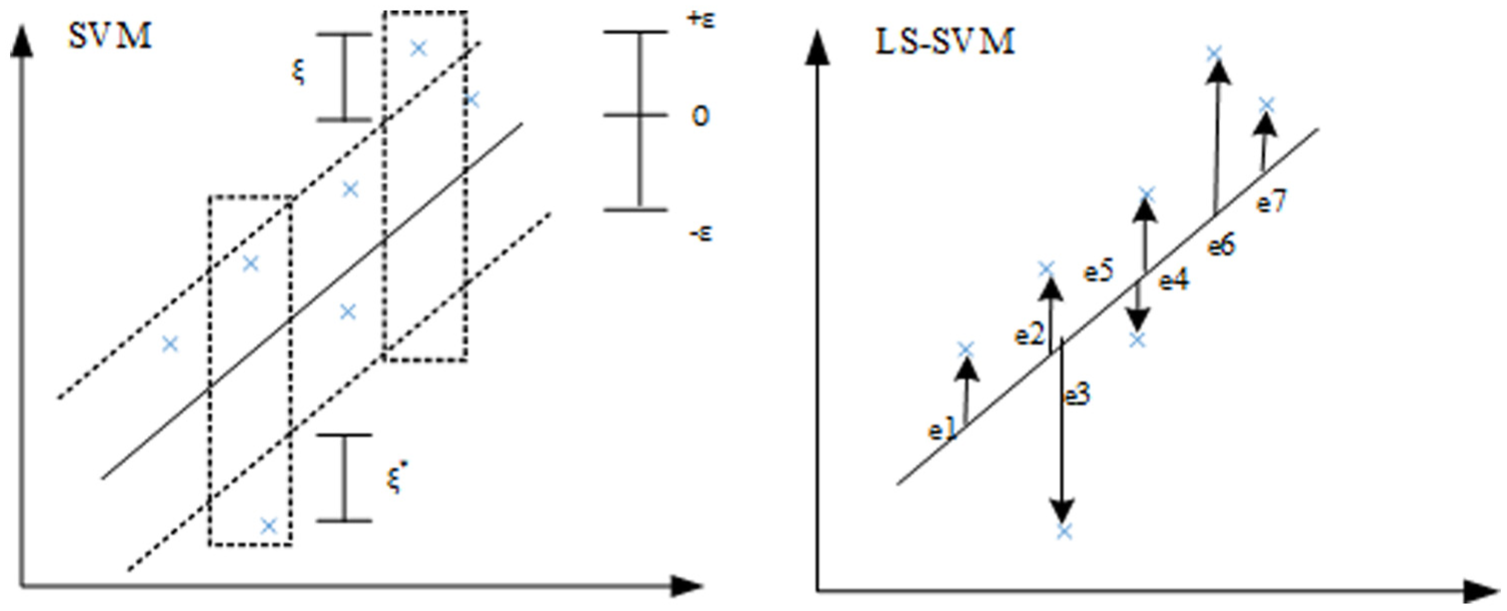
Sparseness comparison between SVMs and LSSVM for a linear regression.
Then, the function prediction of the resulting LSSVM model can be expressed as
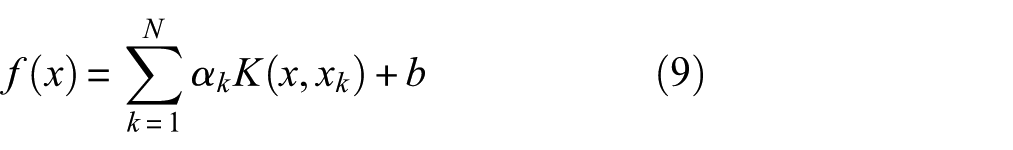
where
where
Methodology
This section presents an overview of the formulated methodology, which starts with a collection of measuring point coordinates using temporal geographic information system (TGIS). MP-LSSVM was developed to analyze and predict the displacement of measuring points based on different scenarios of earth pressure. Using the matrix structure transformation and principal component analysis (PCA) in the multi-measuring point prediction model, the inputs and outputs of this study were formulated as required by LSSVM. The algorithms of MP-LSSVM were finally integrated with the TGIS system to monitor and predict foundation pit displacement.
Data collection methods and assumptions
The development of sensor and communication technology makes automatic monitoring systems, such as DAMSAFE (a demonstration project sponsored by the Dutch Partners for Water program and supports decision making in a long-term integrated approach in order to ensure dam safety) and MISTRAL (an expert system for the management of warnings from automatic monitoring systems of dams), available for the function of automatic data collection, data management, and data analysis. However, the data in these systems cannot be visualized and analyzed spatially and dynamically. TGIS is a system that can collect, store, manage, analyze, and display spatial and temporal entity information. 26
This study used TGIS as the platform to develop foundation pit monitoring scenarios. Underpinned by ArcGIS Engine, TGIS has advantages in data management, 27 spatial visualization, 26 and temporal data dynamic performance with location. 28 Therefore, it cannot only present the displacement difference of displacement body in the “time axis,” but also analyze the time series data of displacement. In this study, all the coordinates of measuring points were collected by TGIS, with which the displacement difference (current coordinate values minus prior coordinate values) of each direction can be automatically calibrated.
It is commonly considered foundation earth as elastic bodies in earth stress issues, according to Hook’s law. 29 However, this assumption could be too ideal in practice and also lead to a difference in calculation result of earth stress between theoretical value and practical value. 30 While calculation results of earth stress based on elastic theory could be applied in stiff soil monitoring under the assumptions of (a) earth is a continuous medium when foundation earth is treated as a whole body; (b) earth is linear elastic when there is no or less plastic failure in earth body; and (c) earth is a homogeneous isotropic body when the changes of earth composition are small. 31 In the process of foundation pit construction, the anti-slide piles are driven into the pit, and the application of anchor to link the anti-slide piles make the edge of foundation pit preserve continuous. Based on the assumption of earth pressure, the point of pit slope will not be crack under concentrated stress.
The solid line (Figure 2) presents the edge of the foundation pit, while the curved dotted line represents the anti-sliding piles that lean inward on the northern edge. The slope can be treated as a whole after reinforcing the slope by anchor cable. Assuming that the earth pressure distribution is continuous, the slope shown in dotted line could be a bent curve with deflection. In the process of foundation pit monitoring, a number of monitoring points are sampled. The distance between these measuring points should be controlled in a suitable range to avoid high cost by increasing the number of measuring points or low correlation by increasing the distance of measuring points.
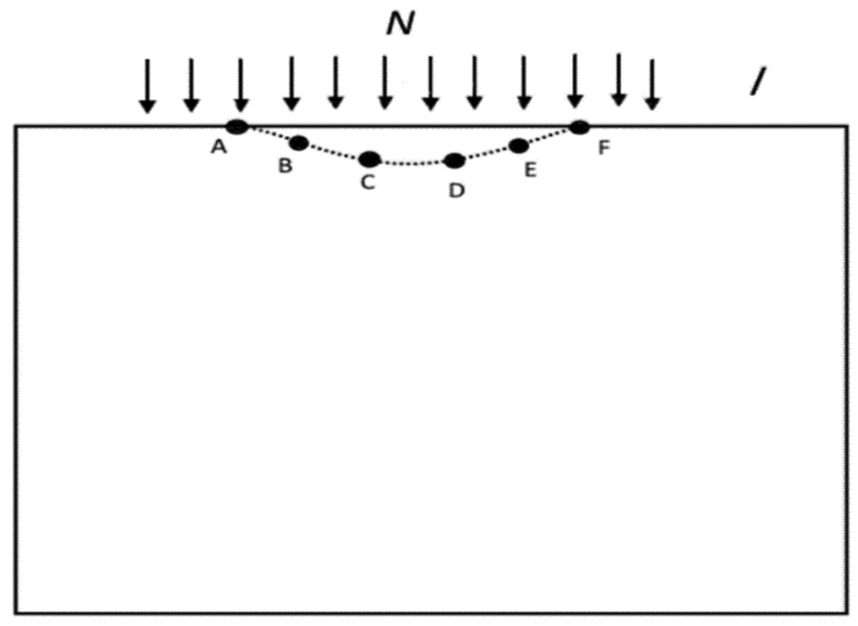
Multi-point monitoring pit schematic.
Multi-measuring points principle and PCA
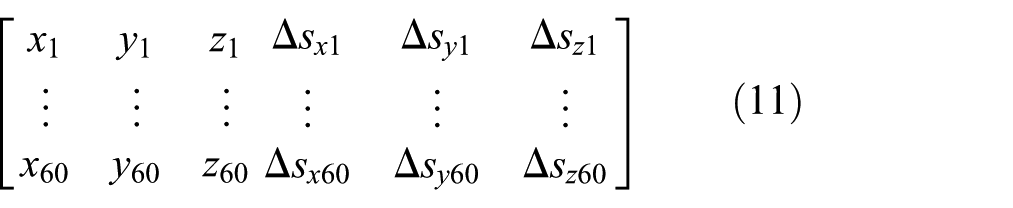
Significant displacement parts might be assessed by more than one monitoring point. Supposing there are A, B, C, D, E, F (Figure 2) monitoring points in a significant displacement part that each point called single measuring point, and the data of each single measuring point contain the coordinate values and displacement values of
When the dimensions of data become large, noise can be included, which complicates the LSSVM, prediction model. In addition, in order to have a better result from the LSSVM approach, it typically needs to collect a large amount of other influencing factors derived from adjacent single point, which is not normally available during the construction process. This can result in large workload during the data collection stage. However, the noise can be reduced by dimensionality reduction method to remove irrelevant features. PCA is one of dimensionality reduction methods that use a vector space transform.
32
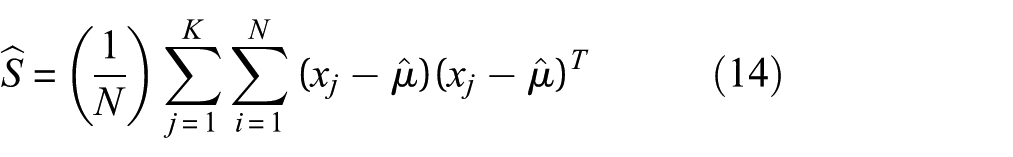
PCA finds the principal component, which has strong correlations with displacements of the multiple measuring points. PCA assumes that the majority of classes’ information is included in the directions with largest variations. The standardized linear projection is the most popular derivation of PCA. It can make the variance maximum in projection space. If a p-dimensional data set X is given (i.e. equation (10)), the m (where

where

The m principal components of x are de-correlated in the projection space. The principal axes come from a global covariance matrix in multi-class problems. It means data’s variations are examined on a global basis
where

where
MP-LSSVM and evaluation method
PCA is able to reduce the dimensionality and get principal components, which have a high correlation with the displacement. Although the PCA can reduce certain dimensions, the total dimensions are still large. Standard SVMs consume a large number of resources and run slowly to process large volume and dimensional data. LSSVM (equations (4) to (9)) was developed to overcome these disadvantages. 33 It treats the two-time square error as the loss function and adopts equality constraint instead of inequality constraint. Due to the adoption of equality constraint, it is converted from the solving problem of quadratic programming to linear equations, which reduces the difficulty to find a solution.
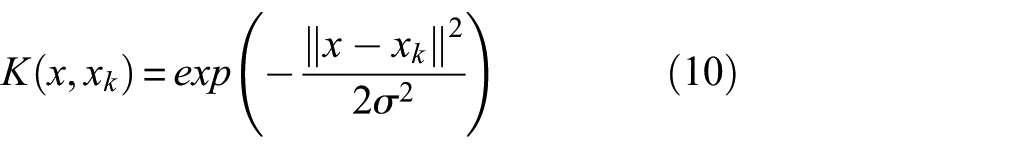
This study adopted LSSVM to train and test the data set of multiple measuring points in MATLAB (Figure 3). RBF (equation (8)) is a most widely used kernel function in LSSVM, and it has less restrictive conditions for parameter selecting in the RBF.
34
If training data set and kernel function are given, LSSVM is mainly affected by the kernel parameter and the weighting factor. As the values of σ in RBF and
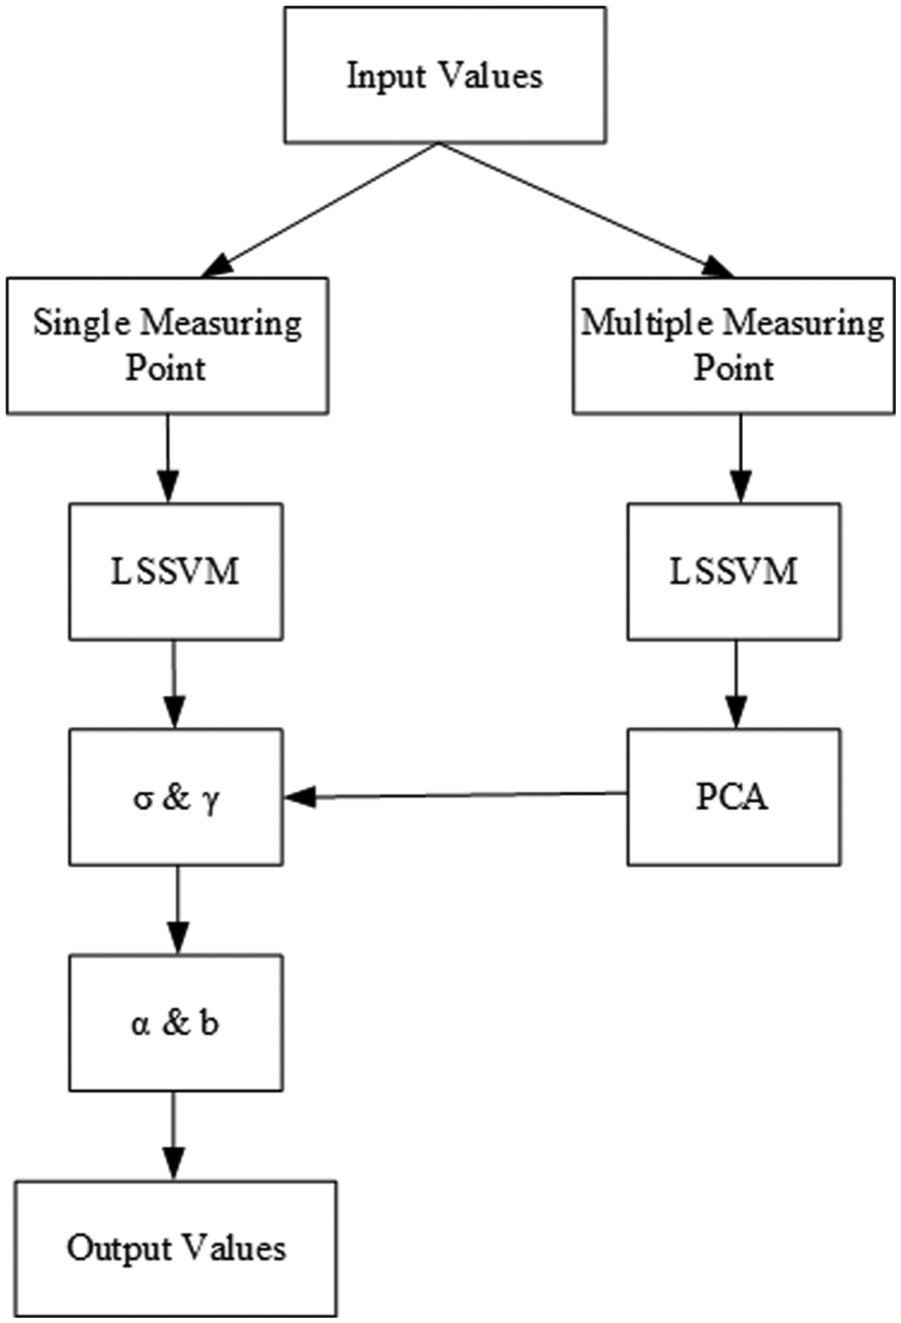
Flowchart of the algorithms of SP-LSSVM and MP-LSSVM.
The next step in the process is to use cross-validation methods so that the optimal parameters for σ and
To the best of the author’s knowledge, the assignment of the parameters (σ and
Case study
This case study targets upon a real foundation displacement monitoring and prediction project in mountain city Chongqing, China, namely, the Guo Hua project. The depth of the foundation pit is around 20 m. The maximum value of the displacement in Y-axis should be controlled in 50 mm according to the Chinese national standard. 39 Before starting the monitoring, a control network was established. Due to the situation of the construction site, it was established along the horizontal control network and translocate with the Chongqing coordinate system. There are three control points: K1, K2, and K3 (Figure 4). Based on the monitoring schematic, the actual layout of monitoring points is as follows:
Select P1–P10, P14–P15 as the monitoring points on the first retaining wall of the north slope;
Select A2–A6 as the monitoring points on the second retaining wall of the north slope;
Select P11–P13, P16, P18 as the monitoring points on the retaining wall of the east slope.
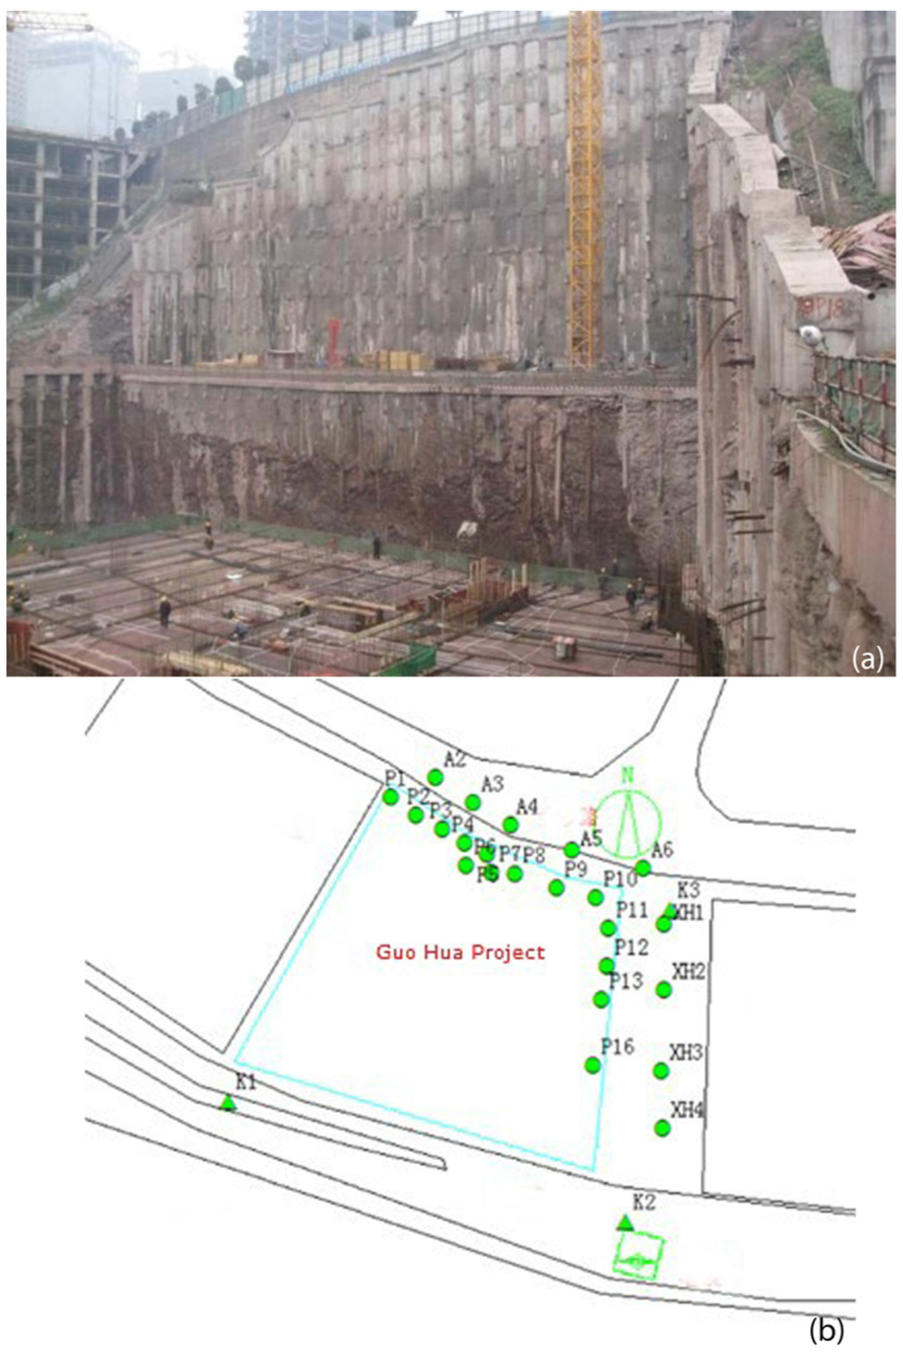
Foundation pit site (a) and monitoring points (b).
The displacement of the retaining wall is complex on the east side. Therefore, we chose the data from P13 as an example to analyze in the middle of the east. P12 and P16 are located on the adjacent sides of P13. The displacement data of these three points will be regarded as a multi-measuring point and be analyzed by MP-LSSVM. The observation data are based on the measurement of SOKKIA SET1130R3 Total Station (Figure 5), and coordinates get from the average of a face left and right. To observe by reflector plate, measuring the precision of angle is 1″, the ranging accuracy is 3 + 2 ppm. The displacement monitoring coordinate system takes north as X direction and east as Y direction. As the foundation pit is located on the west side of the point P13, determination of its displacement in the Y direction is the objective of this study. P13 has a negative increase displacement in the direction of Y and takes a slight movement toward the inside of the pit. This is consistent with the normal situation. After the 10th period, the slope of P13 and adjacent foundation pit was pulled by anchor cable. Therefore, the amount of displacement had some rebound. As the excavation depth increases, the slope has the tendency of inclining to the inside of the pit. The original displacement information can be seen as shown in Figure 6.
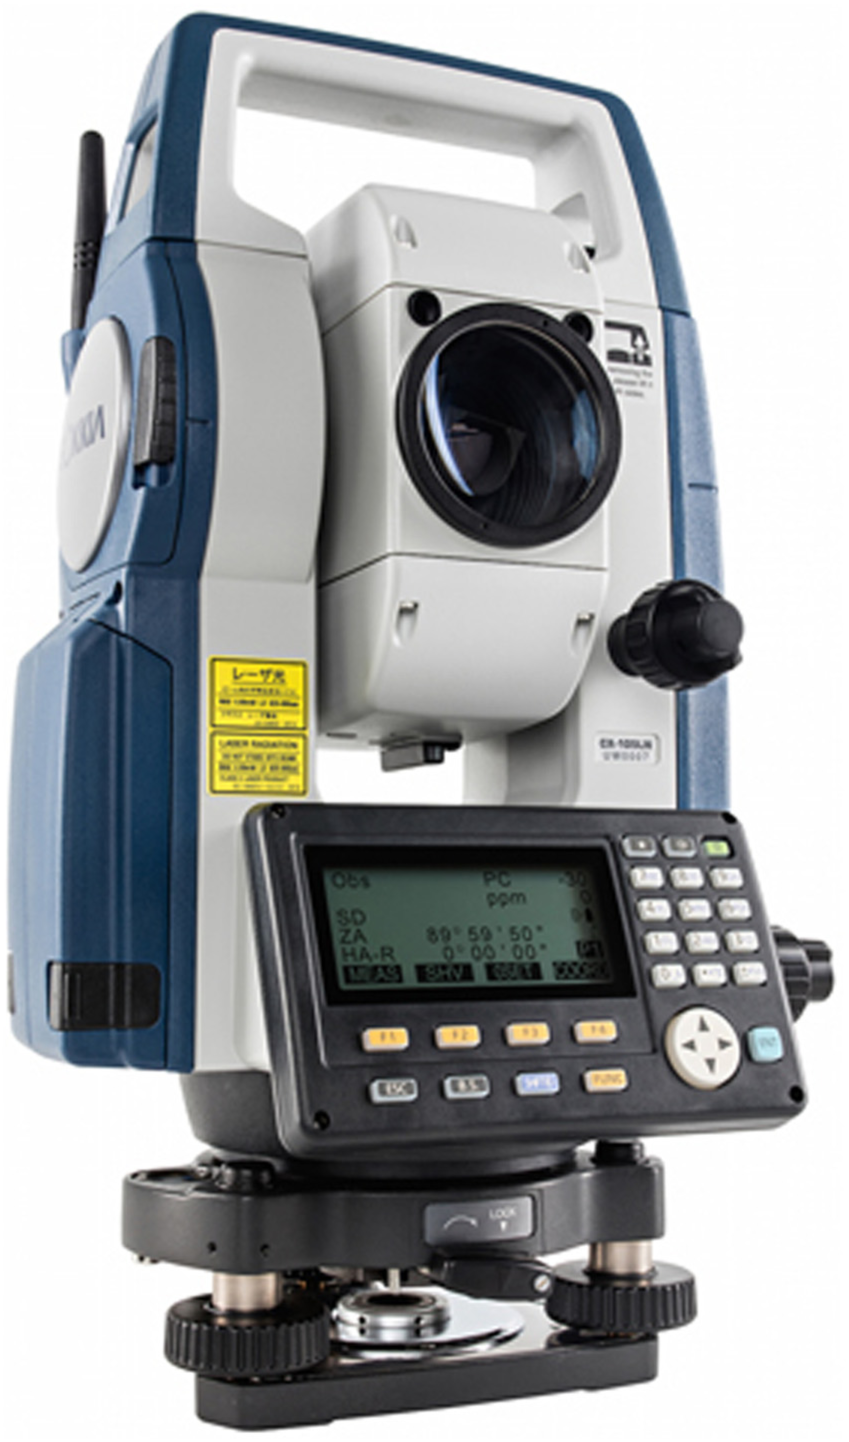
SOKKIA SET1130R3 Total Station.
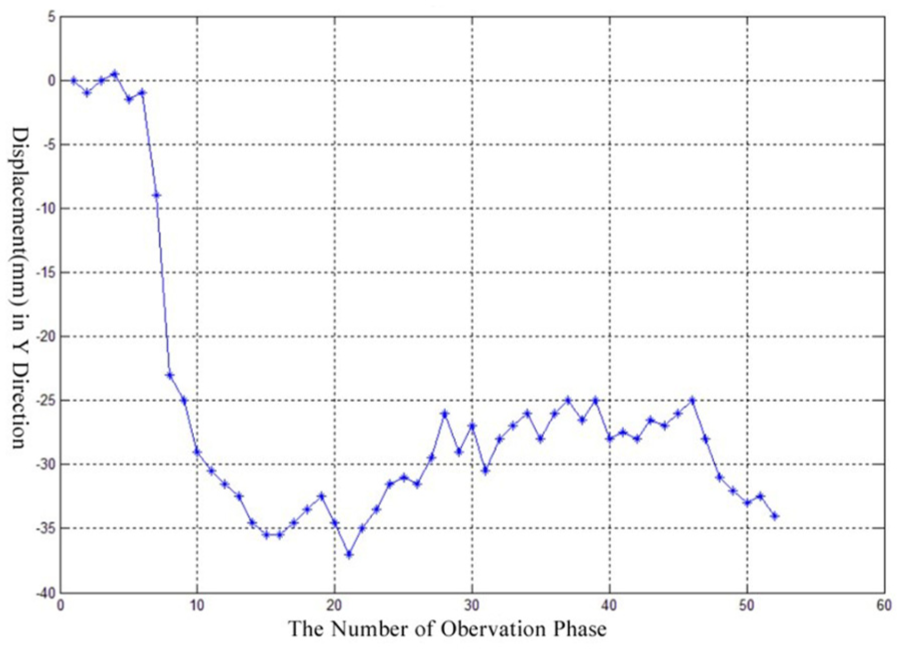
Actual displacement of P13 in the Y direction.
SP-LSSVM
SP-LSSVM included the displacement of the first four phases and the fifth phase as input values and output value, respectively (Figure 6). Phases 5–47 were used as training samples, and the rest phases were applied to evaluate the displacement prediction. It found that the optimal connection weight
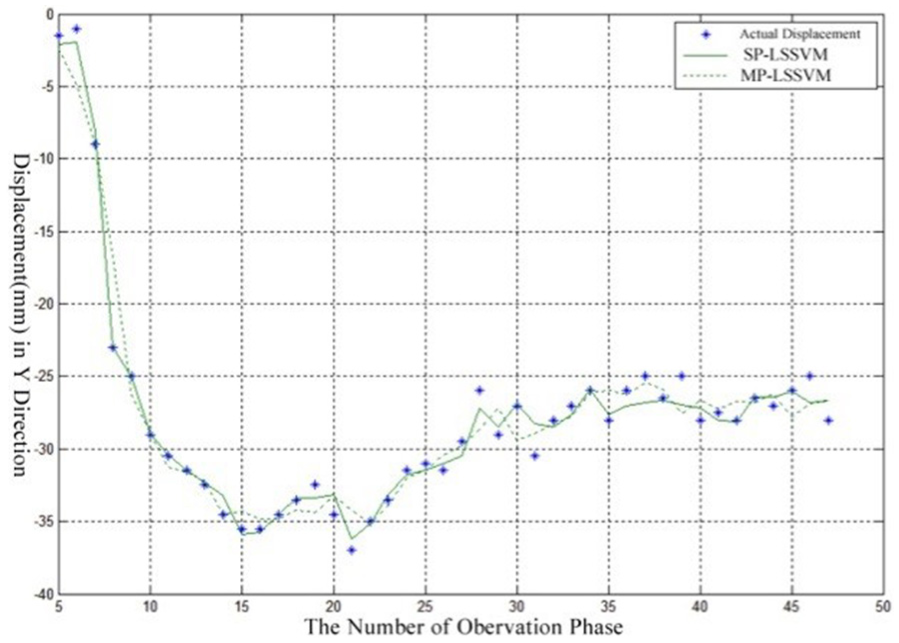
Fitting plot of SP-LSSVM and MP-LSSVM.
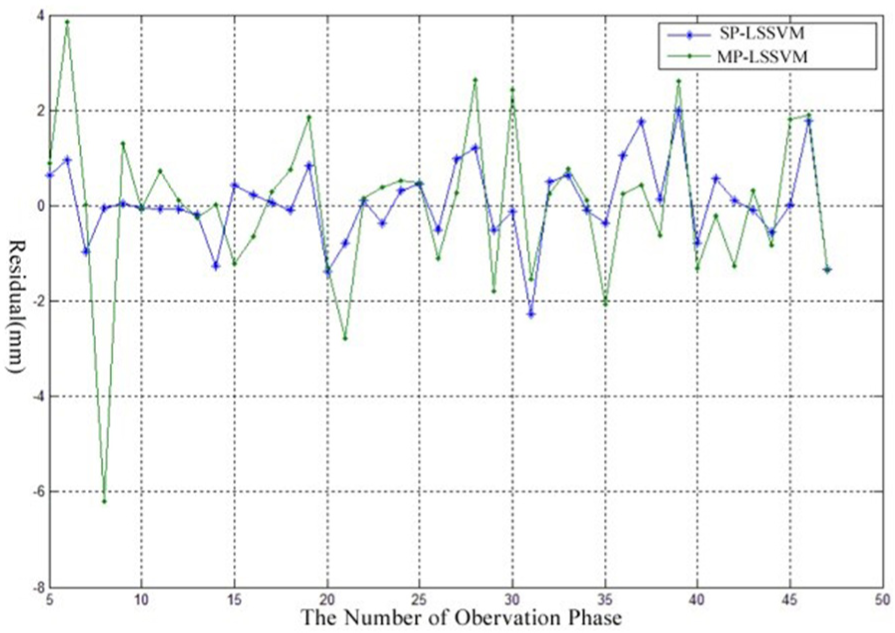
Residual fitting plot of MP-LSSVM and SP-LSSVM.
MP-LSSVM
MP-LSSVM applied the same data process as used by SP-LSSVM. It found the optimal connection weights
As shown in Figures 7 and 8, the fitting result from SP-LSSVM is better than that from MP-LSSVM. The fitting residual value of SP-LSSVM is within ±2 mm and has smaller fluctuation than the result from MP-LSSVM. Therefore, the fitting outcome from SP-LSSVM is better. However, based on the assessment shown in Table 1, the average predicting residual value of MP-LSSVM is smaller than SP-LSSVM. Therefore, the evaluation shows that the prediction outcome from MP-LSSVM is more accurate than the outcomes from SP-LSSVM.
Prediction results from SP-LSSVM and MP-LSSVM.
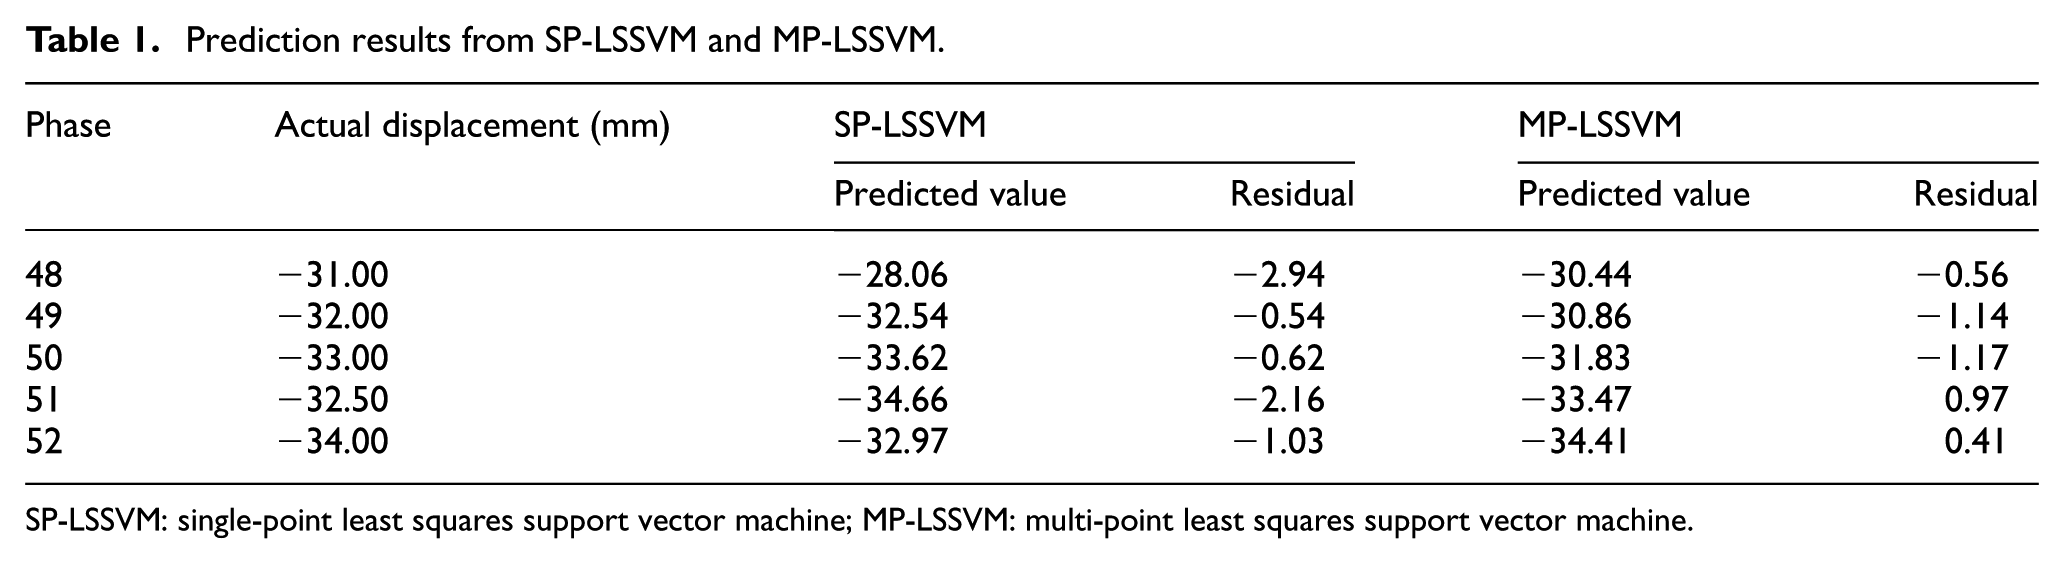
SP-LSSVM: single-point least squares support vector machine; MP-LSSVM: multi-point least squares support vector machine.
Discussion
The performance of SP-LSSVM and MP-LSSVM on foundation pit displacements monitoring and prediction was evaluated by the following three indexes: MAE, MAPE, and MSE


Table 2 shows that SP-LSSVMs have the largest prediction error from all three evaluation methods, and MP-LSSVMs’ fitting results are not satisfying. The overall fitting results from SP-LSSVM are better than the MP-LSSVM, while MP-LSSVM is advanced in terms of the prediction results. Because the value of RBF parameter σ is small, SP-LSSVM has a better curve fitting than the MP-LSSVM. On the other hand, its over-fitting of training samples leads to the inaccurate prediction. In contrast, the prediction of MP-LSSVM is based on the interrelationship between the influencing parameters and the displacement value of the multiple measuring points. The input data of MP-LSSVM are multi-measuring points, which may lead to a higher fitting error. However, every single point in multi-measuring points contributions to the final prediction value. This can partly explain the lower value of prediction errors from MP-LSSVM.
Comparison of evaluation results by MAE, MAPE, and MSE.
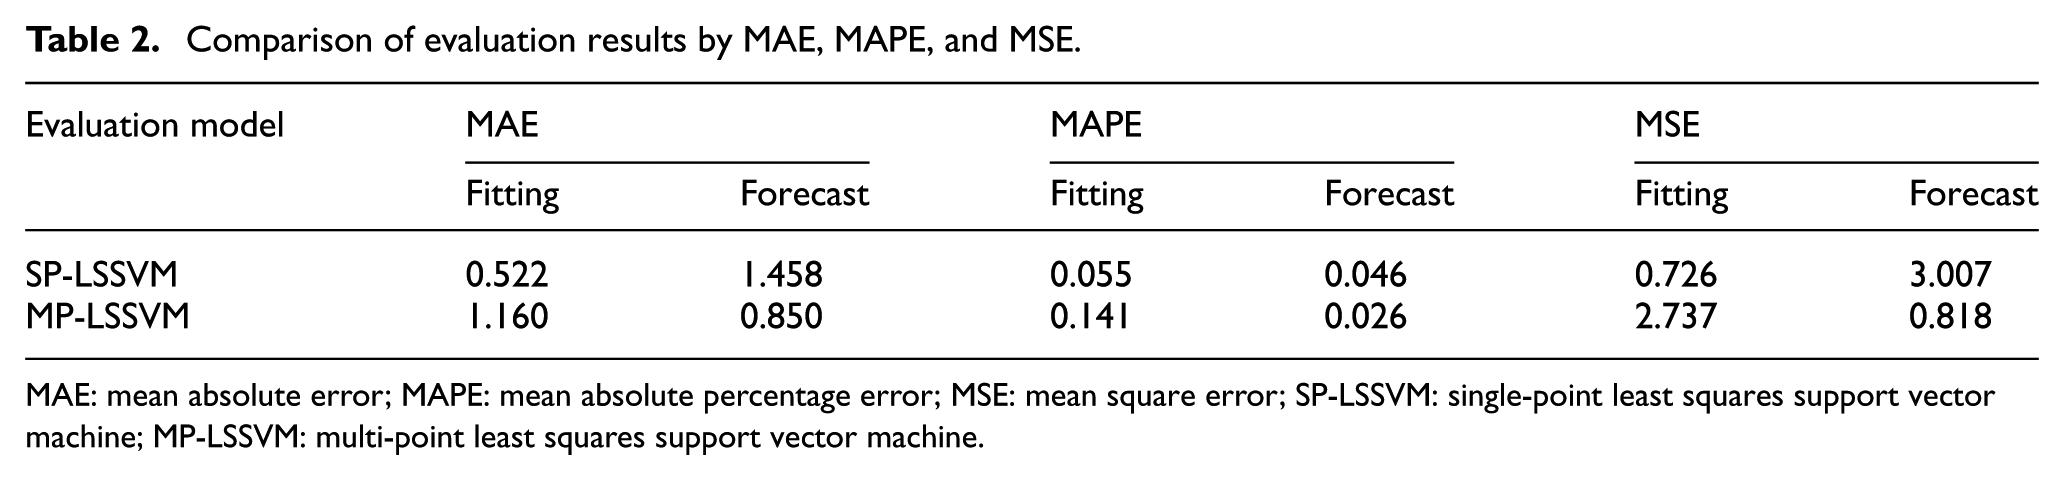
MAE: mean absolute error; MAPE: mean absolute percentage error; MSE: mean square error; SP-LSSVM: single-point least squares support vector machine; MP-LSSVM: multi-point least squares support vector machine.
Conclusion
Foundation pit collapse has led to a large number of construction workers’ deaths and property losses. 31 Therefore, accurate monitoring of the foundation pit displacement and the related supporting structures is very important to the construction management. While the analysis and prediction of the displacement are the critical steps for the foundation pit monitoring and warning control. Previous approaches, such as SVMs, applied in foundation prediction have shown limitations in terms of data handling efficiency and prediction accuracy. Meanwhile, accurate displacement prediction of a foundation surface based on these approaches relies on involving a significant amount of influencing factors derived from adjacent single point, which therefore results in large working load in the data collection stage.
To solve these problems, this study applied LSSVM algorithm based on multi-point measuring techniques (MP-LSSVM), with which multiple points within a certain area can be measured as a whole during the calculation process. To evaluate the effectiveness of MP-LSSVM, a case study was undertaken in a real project in Chongqing, China, namely, the Guo Hua project with a focus on comparing MP-LSSVM against the single-point measuring LSSVM (SP-LSSVM) approach. These two approaches were compared and evaluated by three indexes including MAE, MAPE, and MSE. MP-LSSVM shows the better prediction of the foundation pit displacement, in terms of the accuracy.
Footnotes
Declaration of conflicting interests
The author(s) declared no potential conflicts of interest with respect to the research, authorship, and/or publication of this article.
Funding
This research was undertaken with the benefit of a grant from Ministry of Science and Technology of the People’s Republic of China, The Thirteenth Five-Year National Key Research Projects (project no. 2016YFC0702005-04 and no. 2016YFC 0701601-06).