






Abstract
Intrinsic mode functions of acoustic emission signals, extracted from signals using empirical mode decomposition, were used to characterize the contact conditions of asperities (e.g. sliding friction or collision) in the mating parts of bolted composite joints undergone flexural vibration, whereby to evaluate the tightening condition of the joints quantitatively. Specifically, the sliding friction–related intrinsic mode functions, generated in the mating parts of the two joining composite components (termed as C-C contact), were ascertained from those generated from the contacts between the joining components and metallic fasteners (termed as M-C contact), via a Hilbert–Huang transform. Subsequently, the C-C contact–related intrinsic mode functions were linked to the contact behaviors of asperities at the joining interfaces, reflecting quantitatively the degree of the residual torque of the bolted joints. The fatigue performance of the joints was further evaluated according to the changes in the energy ratios of the C-C contact–related intrinsic mode functions. Experimental results have revealed that the gross energy of acoustic emission signals is capable of evaluating the residual torque of the joints within a limited range. Vibration loosening of composite joints was found to result in an increase in the energy ratios of C-C contact–related high-frequency intrinsic mode functions, on which basis the detectability of the acoustic emission–based structural health monitoring is further improved, making it possible to evaluate the tightening condition of a bolted joint when the joint undergoes vibration fatigue. This proof-of-concept study provides a promising solution to evaluate the contact conditions of bolted composite joints during assembly and to continuously monitor the tightening condition throughout the service life of the joints using the acoustic emission technique.
Keywords
Introduction
Past decades have witnessed an increasing use of advanced composite materials in engineering structures due to their superior mechanical properties compared with traditional metallic materials such as high specific stiffness and strength,1,2 along with outstanding resistance to fatigue and corrosion. In order to meet the demand of design and maintenance, integration of multiple primary components via bolted joints is a prevailing assembling approach for composite structures. 3 However, during the service lives of bolted composite structures, various factors, 4 for instance, improper bolt preload (i.e. applied torque), high temperature and humidity environment, and dynamic loading, have the potential to initiate and accelerate the process of bolt loosening. Among them, the applied torque plays a critical role in determining the durability and damage tolerance of bolted joints.2,5–7 Most failures of bolted joints were reported to be caused by metallurgical fatigue, under-tightening, over-tightening, and irregular tightening of the bolts. If the applied torque is insufficient, all external loads are to be transferred by the bolt, which results in excessive fluctuating stress when the bolted joint is subjected to dynamic loading. On the other hand, an excessive preload produces an overlarge and noncyclic tensile load in the bolt, as well as a high mean stress in the mating area, which exceeds the endurance limits of the joint materials. 8 Therefore, improper preload (i.e. too high or too low) potentially leads to failure of the bolted joint.
To guarantee the performance of a bolted joint, it is critically important to develop efficient methods to characterize the contact conditions during assembly and further surveil the tightening condition throughout its service life. In order to serve these purposes, varied active and passive acoustic methods relying on structural health monitoring (SHM) techniques9–11 have been developed to monitor the loosening of bolted structures. In the active acoustic methods, either linear signal features (e.g. wave energy dissipation, delay in time-of-flight,12,13 wave reflection/transmission 3 ) or nonlinear signal features (e.g. generation of high-order harmonics14–17 and modulation sidebands 3 ) have been adopted to identify a loose bolt. In the passive acoustic methods, acoustic emission (AE) signals can be used to interpret the details of physical processes occurring in the monitored structure, including contact behaviors in the mating parts of a bolted joint.18,19 When a bolted joint is subjected to dynamic loading, the mating parts at the contact interface, of which surfaces are uneven with randomly distributed asperities in the microperspective, undergo a slight relative motion. The asperities on the two contact surfaces, applied with different degrees of pressure, exhibit certain type of contact behavior, for example, asperity collision, elastic and plastic deformation, or fretting wear (i.e. formation and rupture of adhesion junctions).20–22 It was reported that specific contact behavior at the contact interface can be identified using pattern recognition and frequency analysis of AE signals, 23 which have demonstrated their efficiency in characterizing failure modes of carbon fiber–reinforced plastics (CFRPs) (e.g. matrix cracking, fiber pull-out and breakage, and debonding). Therefore, it is potential to surveil the tightening condition of a bolted joint subject to dynamic loading (i.e. flexural vibration) by means of signal analysis on the AE signals generated from asperity contacts at the interface. However, traditional time–frequency analysis (e.g. short-time Fourier transform (STFT)) may result in false information when applied to process non-stationary or nonlinear mechanical fault signals (e.g. AE signals).24–26 In this backdrop, empirical mode decomposition (EMD) has been widely studied and applied in various SHM fields (e.g. damage detection, 24 pattern recognition, 25 and system identification). When a signal is dealt with EMD, a set of complete and almost orthogonal components (i.e. intrinsic mode functions, IMFs) can be obtained, which represent the natural oscillatory modes in the original signal, and are determined by the characteristics of the signal itself. Hilbert–Huang transform (HHT) spectrum of the IMFs further obtained using Hilbert transform provides accurate time–frequency signal characteristics.
In this study, AE signals induced by contacts of asperities at the C-C and M-C interfaces in the bolted composite joint were recognized using the HHT-processed characteristics of AE signals. First, single-type AE signals generated from asperity contacts at the two distinct types of contact interfaces were captured and processed, respectively, by HHT to ascertain the time–frequency characteristics of decomposed IMFs. Subsequently, these IMFs were used as basic functions to recognize the C-C contact–related IMFs in the mixed AE signals from a bolted composite joint, by comparing the signal time–domain waveform and time–frequency distribution in the HHT spectrum. With usage of energy ratios of the C-C contact–related IMFs, contact conditions of the bolted joint under different applied torques subject to flexural vibration were evaluated by the AE signals. On this basis, tightening conditions of the bolted composite joints under different torques subject to vibration fatigue were continuously monitored through decrease in compressive strain of the bolts and changes in the energy ratios of the C-C contact–related IMFs of the AE signals.
HHT for bolt loosening–induced AE signals
In a bolted composite joint, there exists a series of contact interfaces as shown in Figure 1(a) (e.g. interfaces between metallic washer and composite beam (M-C) and interfaces between two composite components (C-C)), surfaces of which are rough with randomly distributed asperities. 27 As a representative result, the microstructure of the surface of the composite specimen was obtained by scanning electron microscopy (SEM) and displayed in Figure 1(b). To observe that asperities of different sizes distribute on the nominally flat surface and consequently when the two composite beams are assembled by a bolt, the interface in the mating parts features partial contact as illustrated in Figure 1(c).
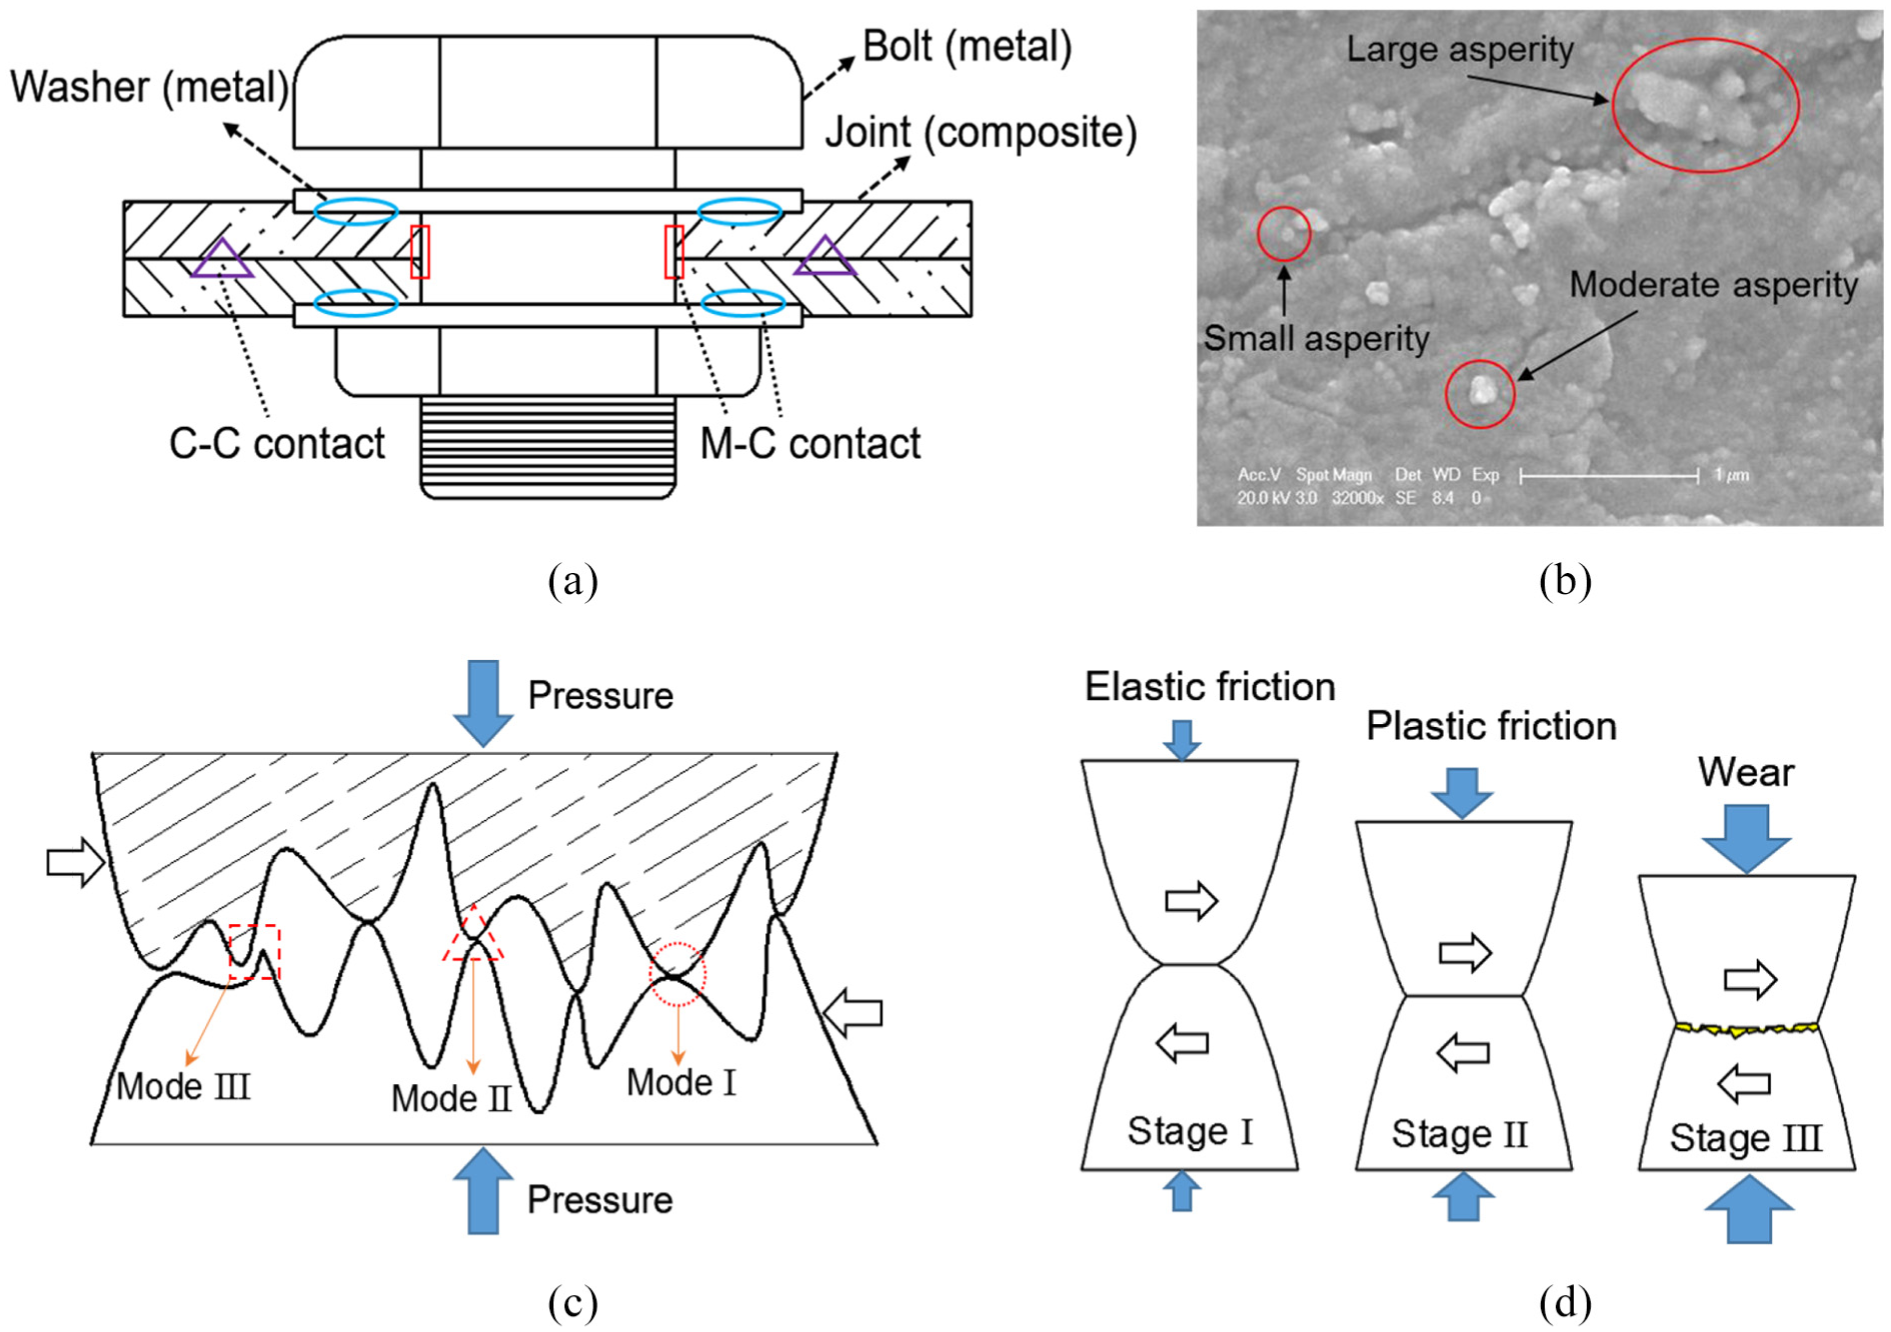
(a) M-C and C-C contacts in a bolted composite joint, (b) asperities on the composite surface obtained by SEM, (c) two contact surfaces at the C-C interface undergo a relative motion, and (d) contact behaviors of asperities under increasing pressure.
In practice, mixed AE signals produced by asperity contacts at both the M-C and C-C interfaces in the joint generate when the joint is subjected to dynamic loading. In what follows, asperity contacts at these two interfaces will be characterized by, respectively, using time–frequency analysis on the related single-type AE signal. In addition, signal features of AE signals generated from asperity contacts at the C-C interface under increasing applied pressure are to be further studied by comparing the frequency distribution. Previous studies21,22 confirmed that contacts of asperities in larger contact area (induced by greater applied pressure) produce AE signals with longer durations (i.e. lower centered frequencies) through both experimental investigation and numerical simulation. On this basis, taking the C-C interface as an example, three representative types of asperity contacts are discussed to facilitate the understanding of generation mechanisms of AE signals in a bolted composite joint by considering the influence of residual torque on the signal characteristics. When the bolt is fastened, as shown in Figure 1(c), the largest asperities (Mode I) on the surfaces first come into contact and undergo intensive deformation, and the moderate asperities (Mode II) are in a weak contact and slight gaps exist between the smallest asperities (Mode III). Once a relative motion between the contact surfaces presents, sliding friction occurs between both the Mode II and Mode I asperities but with different contact durations, which are determined by the substantial contact area of the asperities. The Mode I asperities carry a larger contact force and consequently a higher degree of deformation presents, leading to a larger substantial contact area. As a result, AE signals with a longer duration (i.e. a lower centered frequency) are generated. Conversely, shorter-duration AE signals (i.e. with a higher centered frequency) generate from the contacts between the Mode II asperities. If sliding distance of the two surfaces exceeds the gap between the Mode III asperities, Mode III asperities on one contact surface attempt to slide past those on the opposite surface, which results in the collision contact behavior and generates AE signals with the shortest duration. With increasing applied torque, for larger asperities in real contact (Mode II and Mode III), elastic and plastic friction (see Figure 1(d)) occurs sequentially. Once the asperities are overloaded, wear produces consequently at the contact interface.
To conclude that the contacts between the three types of asperities naturally generate AE signals with distinct time durations and centered frequencies. Upon the occurrence of bolt loosening in a bolted composite joint, a reduce in contact area between asperities, caused by the decrease in contact pressure, results in more frequency components with higher centered frequencies in the AE signals. 22 With usage of EMD, the AE signals can be broken down into various components (IMFs) with decreasing centered frequencies, which can be correlated with the contact behaviors of the asperities and further evaluate the tightening condition of the bolted joint.
The signal processing procedure of EMD method is illustrated in Figure 2. In the process of applying EMD to an AE signal

Signal processing procedure of EMD method.
The mean of the upper and lower envelopes is then obtained and signified as
In the subsequent processes,
The above process (i.e. sifting process) is repeated
According to above description of generation mechanisms of AE signals, the first IMF
The sifting process is repeated to obtain all IMFs, with decreasing centered frequencies, of the AE signal
The decomposition procedure ends once the residue
Hilbert transform is subsequently performed on the decomposed IMFs to conduct time–frequency analysis of the signal, which is defined as follows
Then, analytic signal Z(t) whose real part is
The envelope e(t) and instantaneous phase
The decomposed IMFs with decreasing centered frequencies will be linked to the contact behaviors of the asperities at the interfaces of the loose joint and further used to evaluate the residual torque in what follows.
Specimen preparation and experimental setup
In this study, single-type AE signals generated from asperity contacts at both C-C and M-C interfaces were first captured and processed, respectively, by HHT to ascertain frequency distribution of decomposed IMFs from these two different interfaces. Subsequently, the IMFs generated from the single-type interface were used to recognize the C-C contact–related IMFs in the mixed AE signals from a bolted composite joint. The abovementioned research flow chart is displayed in Figure 3.

Research flow chart.
To validate the efficiency of IMFs in identifying contact conditions of joint interfaces, three sets of experimental setups were used to capture AE signals generated at the single-type contact interface (i.e. C-C contact in two assembled composite beams as displayed in Figure 4(a) and M-C contact in a bolted beam as shown in Figure 4(b)) and mixed-type contact interface (in a bolted composite joint (see Figure 4(c))). Note that composite beams were cut from sheets of laminated T700/7901 carbon fiber–reinforced epoxy, obtained using hot pressing with a stacking sequence (90, 0, 90, 0) s. Specimens were 1-mm thick and 30-mm wide.

Experimental setups for collecting AE signals: (a) in two beams assembled by insulation tape, (b) in a bolted beam, (c) in a bolted joint, and (d) in four bolted joints under fatigue.
To generate AE signals from C-C contact, in Figure 4(a), two composite beams, with lengths of 100 and 190 mm, respectively, were assembled with an overlap length of 20 mm using insulation tape. One end of the beam was secured to the moving element of a vibration table (ES-3-150) with an M8 bolt. A sealant was used to avoid AE source from contacts between the M8 bolt and other components. The beam in the length of 100 mm without the assembled beam (190 mm) was first excited to ascertain that AE signals from contacts between the M8 bolt and other components were eliminated. The specimens were shaken vertically with a displacement of 0.6 mm at a frequency of 22.3 Hz using the sinusoidal motion of the moving element and were monitored with an acceleration sensor. A four-channel SAEU2S AE system (Soundwel Co.) was employed to capture AE signals generated from the two assembled composite beams (i.e. C-C contact) subject to vibration in a short time (i.e. 8 s), using an SR 150M sensor with a wide resonant frequency range between 10 and 160 kHz as shown in Figure 5. The AE signals were recorded at a sampling frequency of 2 MHz. A threshold of 40 dB was used to avoid involvement of environmental noise and boundary reflections in the captured signals. To simplify the analysis, acoustic wave attenuation and multiple boundary reflections were believed consistent before and after the fatigue, given the AE sensor position and sample boundary were the same. Multiple reflections from edges and core of the joints were minimized by setting proper threshold value (40 dB) and hit interval (300 μs). Most multiple reflections were captured as separated signals (achieved by hit interval) but filtered due to low energy (achieved by threshold), which was caused by attenuation characteristics of AE signals propagating in composites.

Resonant frequency range of the AE sensor.
To generate AE signals from M-C contact (i.e. contact between the metallic fasteners and the composite beam), as shown in Figure 4(b), an intact beam with a length of 270 mm was drilled a thread hole and assembled with an M6 bolt after confirming that AE signals from contacts between the M8 bolt and other components were eliminated. The M6 bolt was tightened from 1 to 9 N m, with an increasing step of 1 N m, so as to collect AE signals produced from the M-C contact in each scenario. The AE signals were collected when the specimens were under the same excitation condition as those shown in Figure 4(a).
To obtain the AE signals generated from the mixed-type contact (including both C-C and M-C contacts), as depicted in Figure 4(c), the same beams as those shown in Figure 4(a) were assembled with an M6 bolt to form a bolted composite joint. The joint was tightened from 1 to 9 N m and excited under each torque using the same excitation conditions as those shown in Figure 4(a) and (b) in a short time (i.e. 8 s).
To verify the efficiency of the HHT-processed AE signals in the continuously monitoring of vibration loosening of the bolted composite joints, four bolted joints with the same geometry as that in Figure 4(c) but applied with different torques (i.e. 3, 5, 7 and 9 N m), as displayed in Figure 4(d), were fatigued for 10 h (fatigue experiments were repeated three times). The specimens were shaken vertically with a displacement of 0.6 mm at a frequency of 22.3 Hz using the sinusoidal motion of the moving element. The detail procedure for the fatigue experiment can be found in our previous research. 4 During the vibration fatigue, the AE signals and compressive strain of the bolt (indicating the residual torque) were continuously registered in the AE device and strain indicator, respectively.
Results and discussions
Characterization of the residual torque of bolted composite joints
To achieve a quantitative monitoring of bolt torque using the mixed AE signals generated from both C-C and M-C interfaces in a bolted composite joint, unique characteristics and quantitative dependence of these two signals on the applied torque must be first understood. Motivated by this, AE signals generated at the single-type contact interface (i.e. C-C contact as shown in Figure 4(a) and M-C contact as shown in Figure 4(b)) are processed with HHT and the decomposed IMFs are comparably studied to ascertain their distinct characteristics in this section.
The original AE signal (the average of 300 signals) and its first four IMFs, generated from the C-C contact between the two composite beams assembled by insulation tape (see Figure 4(a)), are displayed in Figures 6 and 7, respectively. The first four IMFs in Figure 7 are observed to possess increasing periods. Time–frequency analysis on the original signal was comparably conducted using STFT (window length: 128, overlap number: 127, fast Fourier transform (FFT) length: 1024) and HHT and the corresponding spectra are displayed in Figure 8(a) and (b), respectively. The main energy of the AE signal is observed to distribute in the frequency range between 20 and 200 kHz. From further observation, a higher time–frequency resolution is observed in the HHT spectrum presented with normalized energy compared to the former one.
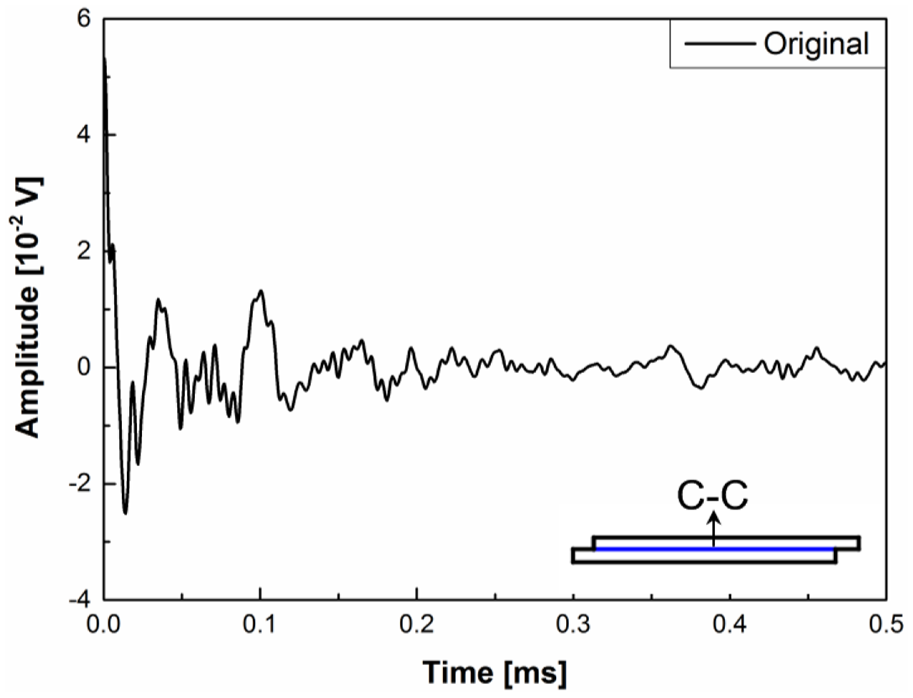
Time presentation of the original AE signal captured from the two beams assembled by insulation tape.

Time presentations of first four IMFs of the AE signal in Figure 6.
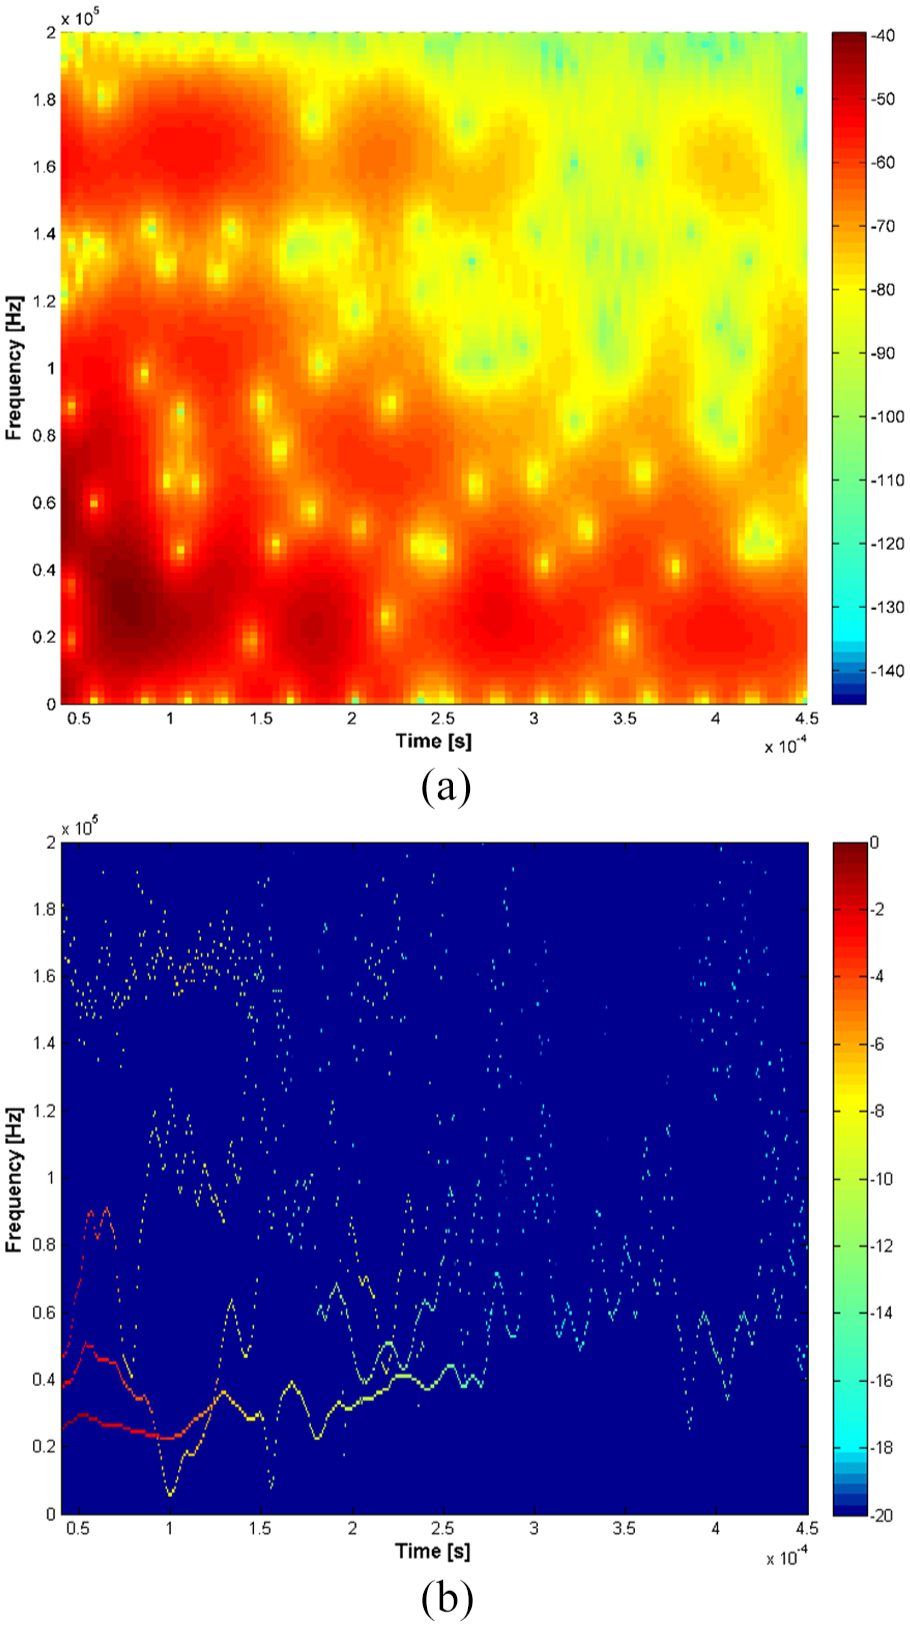
(a) Short-time Fourier transform and (b) Hilbert–Huang transform spectra of the signal in Figure 6.
Figure 9(a) and (b) shows the time presentation of the original AE signal (the average of 300 signals) and its first IMF generated from the bolted beam (i.e. M-C contact, see Figure 4(b)) under 1 and 7 N m, respectively. Note that
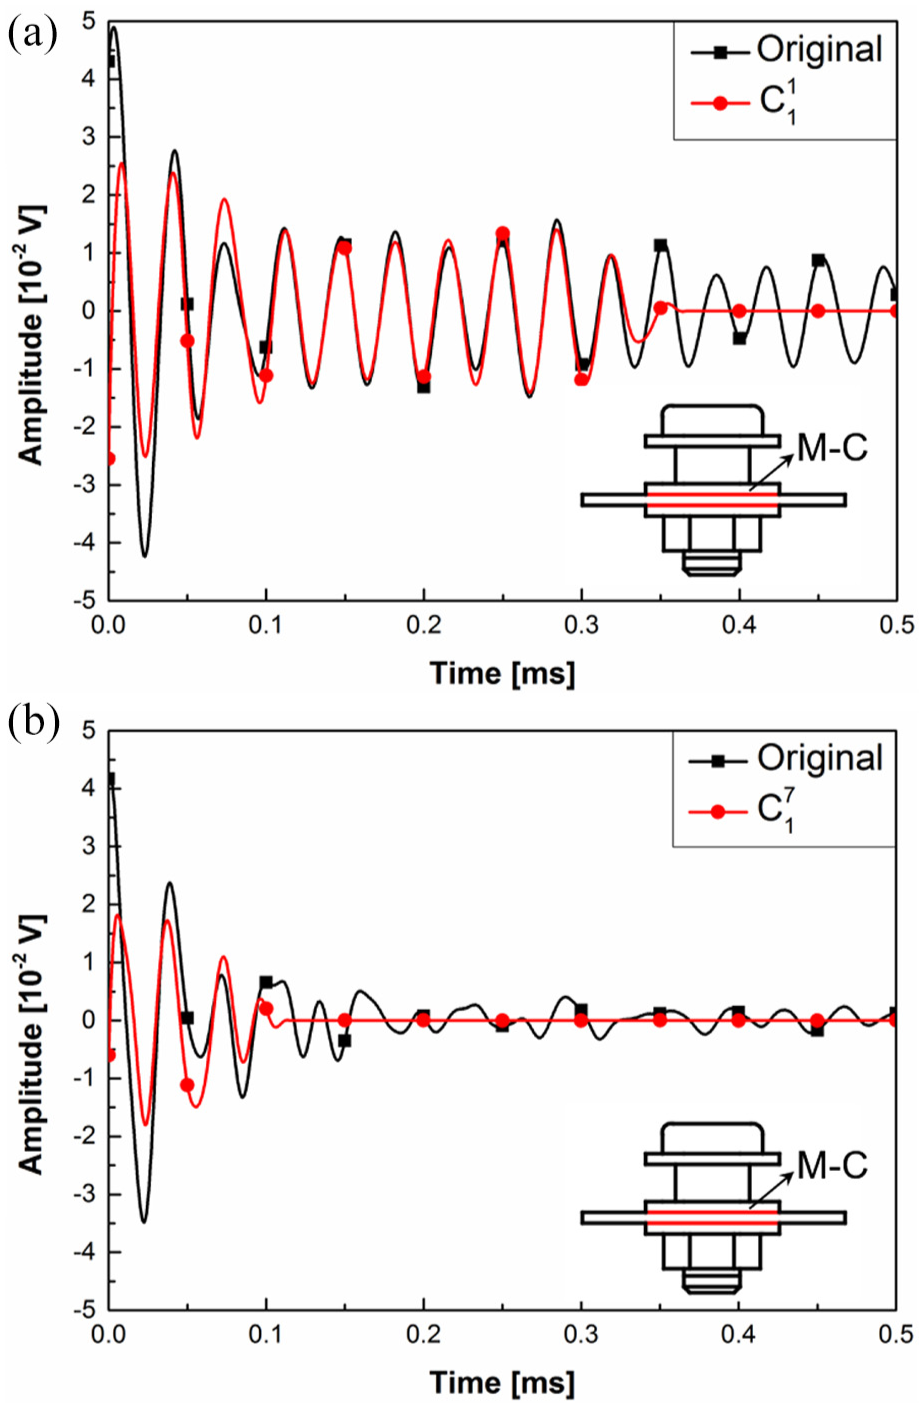
Time presentations of the original AE signal and its first IMF captured from the bolted beam under (a) 1 N m and (b) 7 N m.
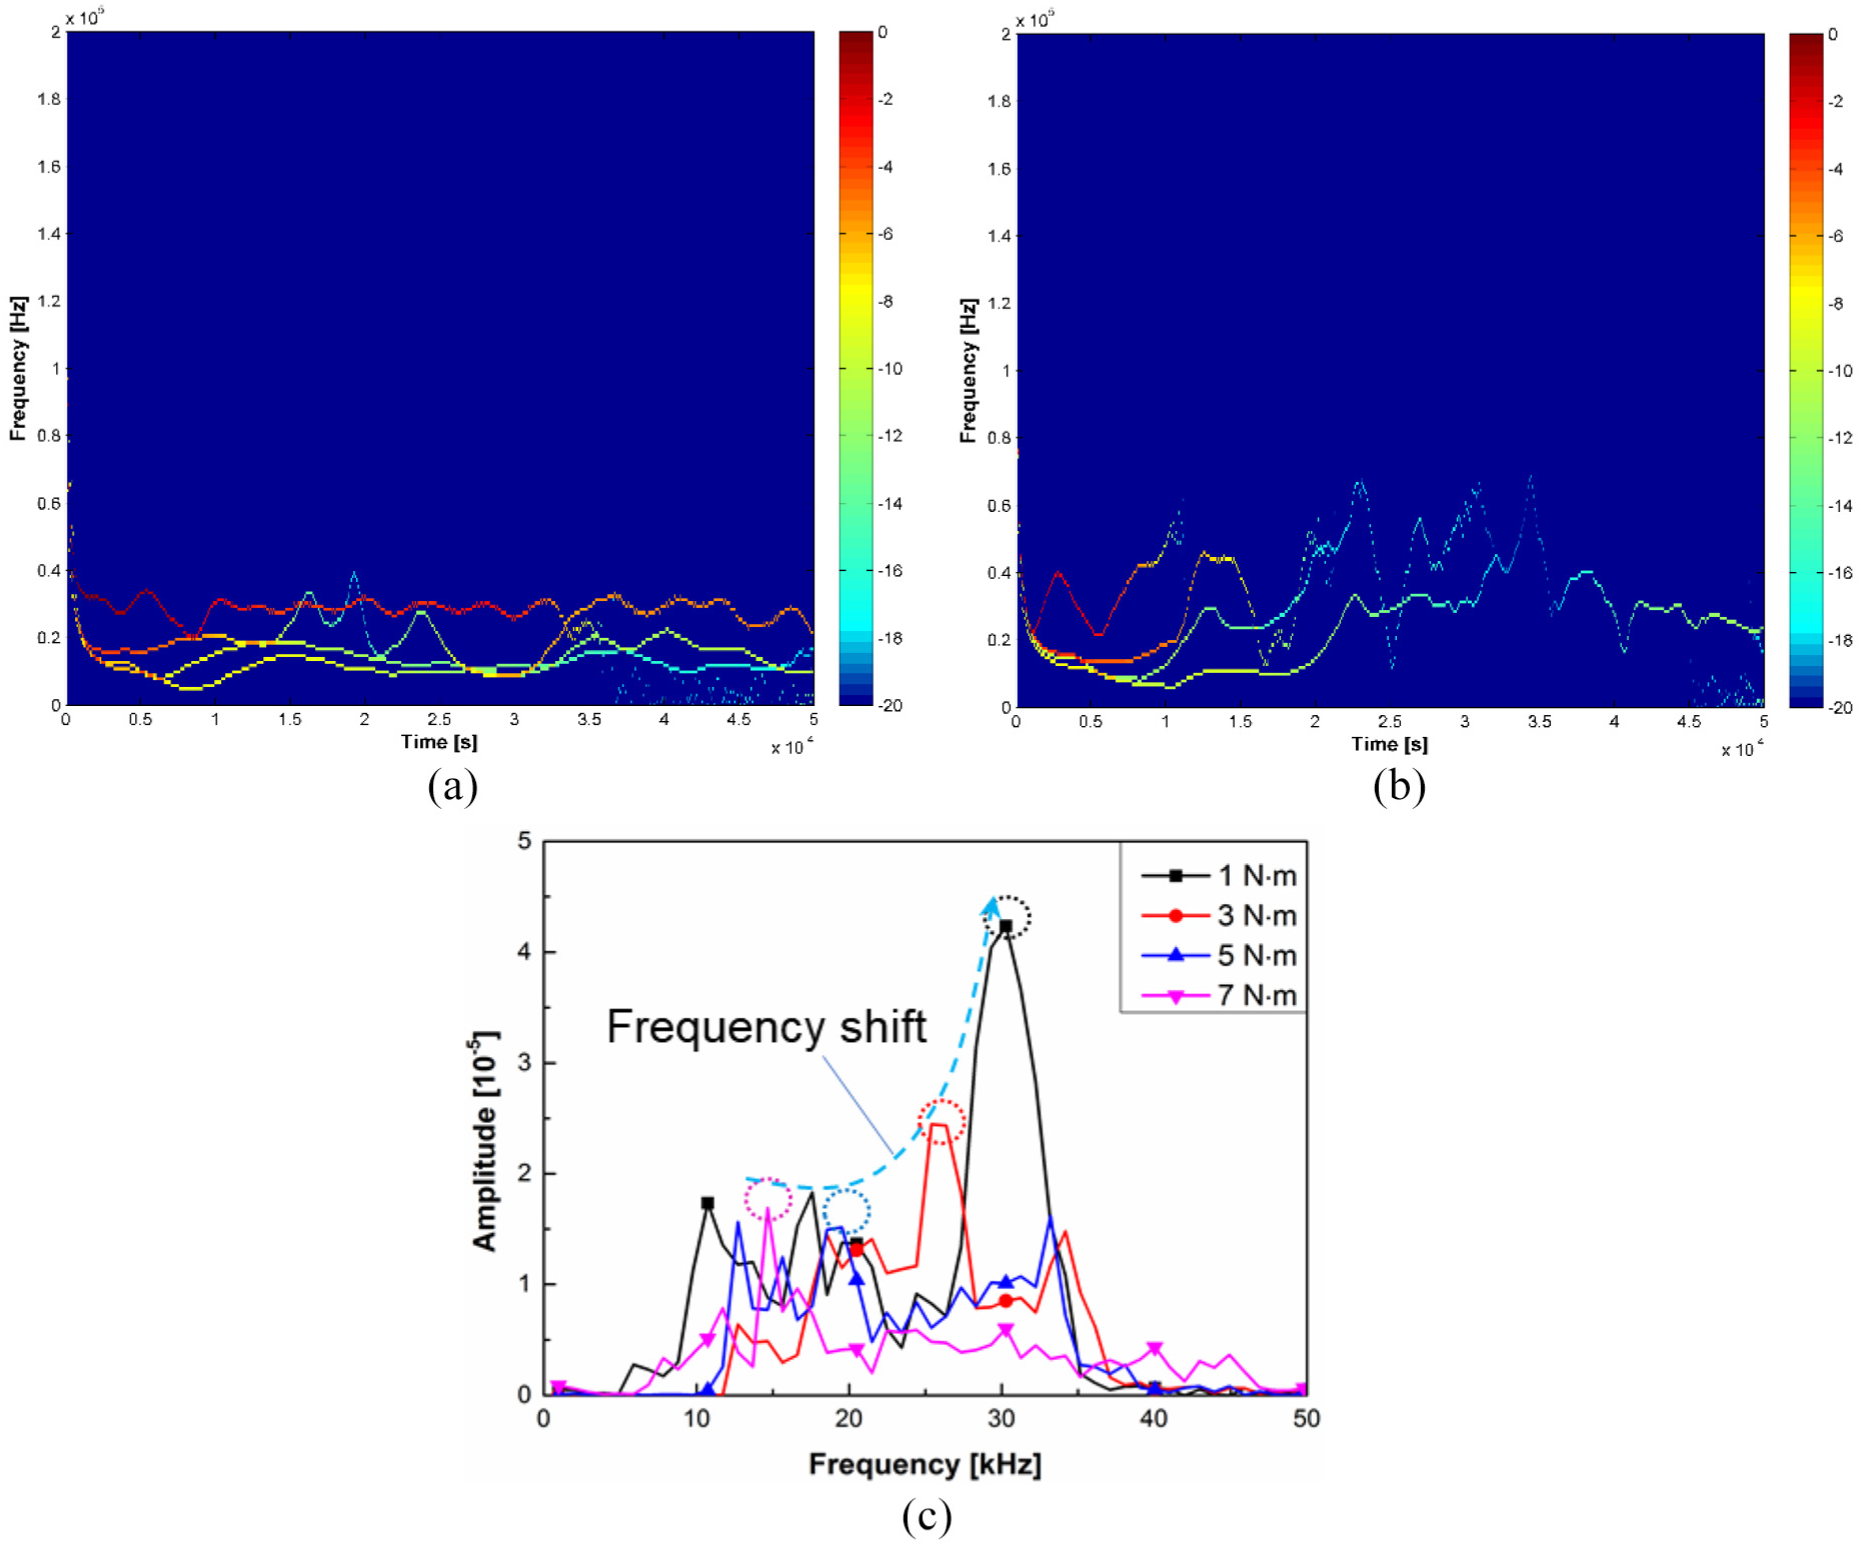
Hilbert–Huang transform spectra of the AE signals (a) in Figure 9(a), (b) in Figure 9(b), and (c) marginal spectra of the AE signals captured from the bolted beam under different torques.
Comparing the AE signals generated from the M-C contact to those generated from the C-C contact, it is found that the M-C contact generates the AE signals dominating the frequency range between 10 and 40 kHz, while the AE signals induced by the C-C contact mainly distribute between 20 and 200 kHz. The difference in roughness and hardness between metal and resin is responsible for the diversity of their frequency distribution. Such frequency distribution difference can be used to characterize AE signals generated from M-C and C-C contact and provide a basis to extract C-C–related IMFs from the mixed AE signals.
The typical amplitude distribution (gross energy) of the mixed AE signals generated in a bolted composite joint during vibration is shown in Figure 11(a), and Figure 11(b) is the averaged results of three repeated tests. To observe that in Figure 11(a) when the applied torque is 3 N m, the amplitude of the AE signals distributes over a wide range, which indicates that uncontrolled contact behaviors in the bolted joint arise from a lack of sufficient pressure on the contact surfaces. Similar phenomena present when the torque is 1 and 2 N m, which are not to be discussed in detail. When the applied torque continues increasing, the amplitude of the AE signals reaches a steady value, especially for the joint under 7 N m. From the averaged results as displayed in Figure 11(b), a monotonic decrease in the signal amplitude is observed until the applied torque reaches 7 N m. Then, it increases slightly until 9 N m. Damage caused by intensive pressure on the composite surface below the outer border of the washer was found in the further observation. Therefore, AE signals induced by the surface damage are inferred to cause the increase in signal amplitude (i.e. gross energy) after the torque exceeds 7 N m. According to our previous analysis as displayed in Figure 1(d), the joint applied with the torque between 3 and 6 N m is insufficiently tightened (I-t condition) when most asperities under elastic deformation. Under the torque of 7 and 8 N m, the jointed is considered as efficiently tightened (E-t condition). When the applied torque exceeds 8 N m, intensive pressure causes surface damage at the interfaces and consequently the joint is over-tightened (O-t conditions). From Figure 11, it can be concluded that the detectable range regarding bolt loosening is limited from 4 to 7 N m with the usage of gross energy of AE signals.
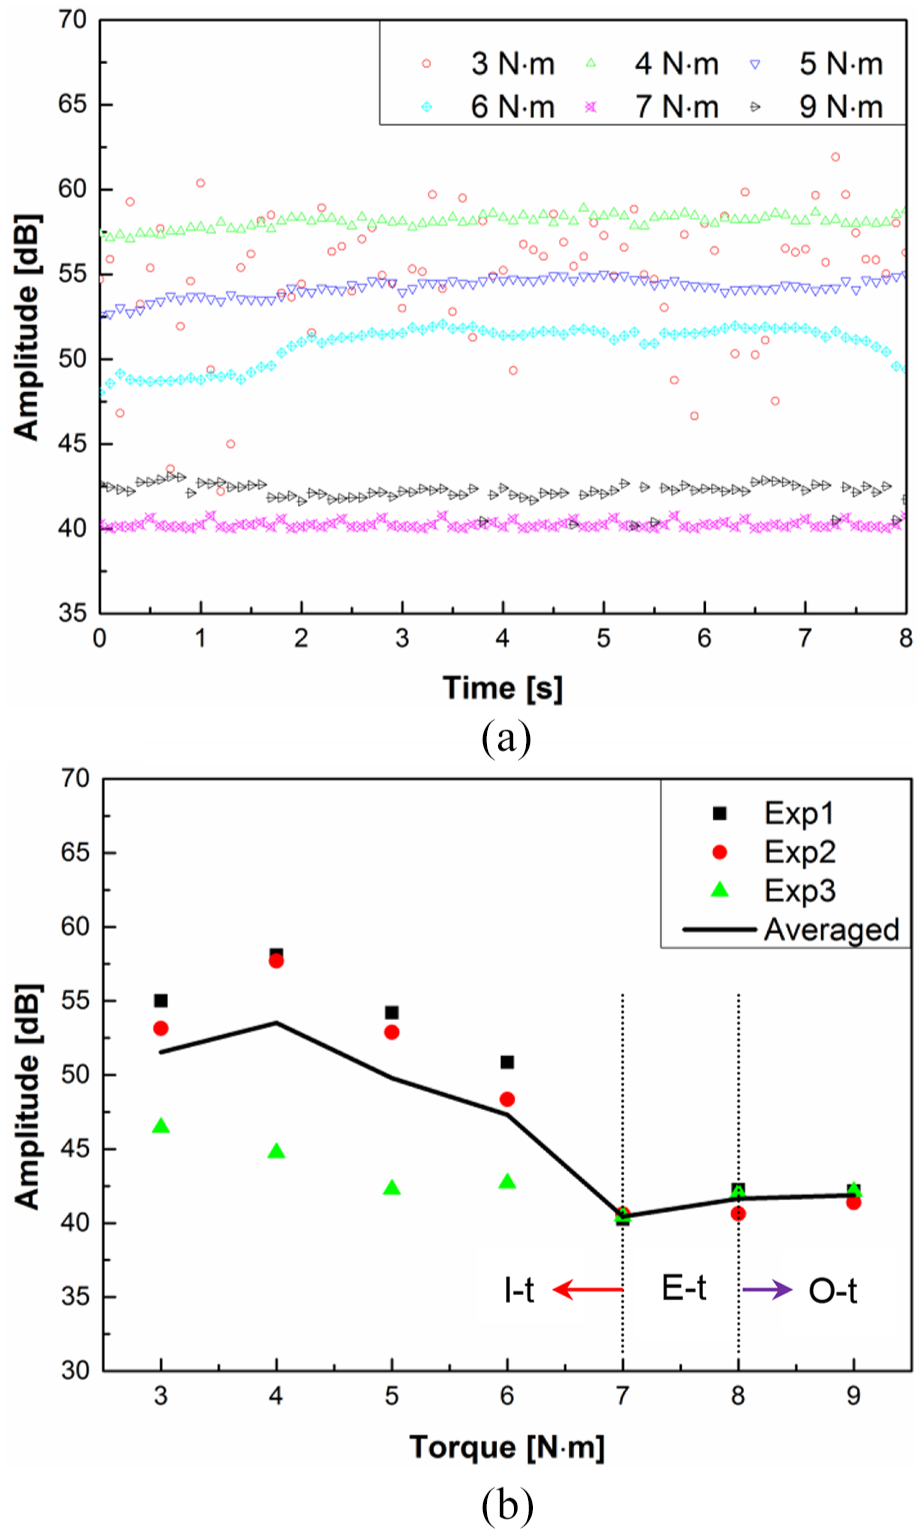
(a) Typical amplitude distribution and (b) averaged amplitude of the AE signals captured from the bolted joint under different torques in three tests.
To further improve the detection range of bolt loosening using AE technology, in the following section, IMFs of the same AE signals as shown in Figure 11(b) will be further extracted using EMD and correlated to the contact conditions of the joining interfaces.
The AE signals (averages of 300 signals) generated in the bolted joint under 3 and 7 N m were comparatively processed with HHT and their IMFs

Time presentations of the first three IMFs of the AE signal acquired from the bolted joint under 3 N m: (a)
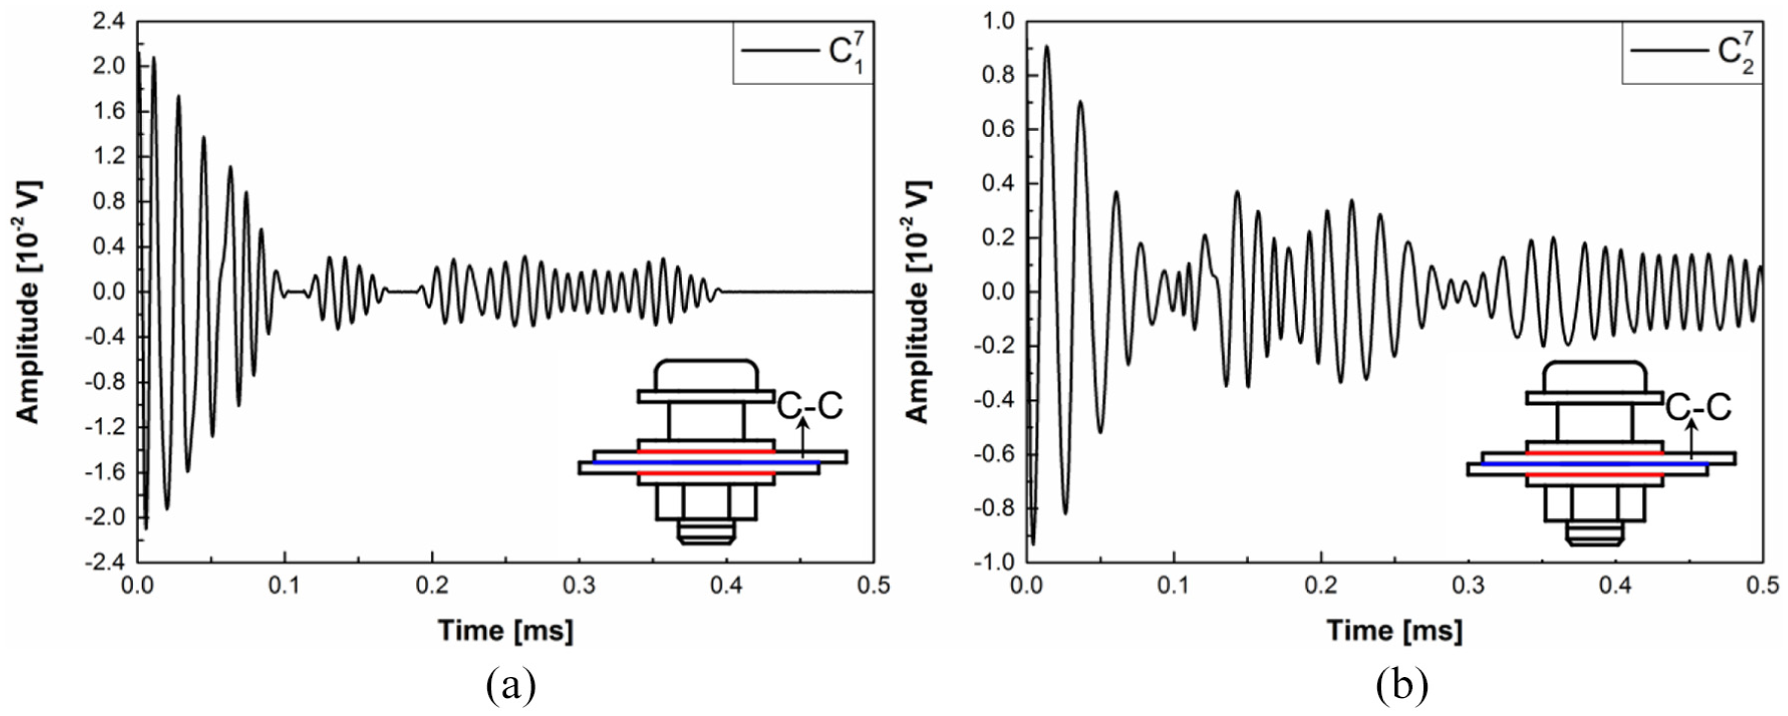
Time presentations of the first two IMFs of the AE signal acquired from the bolted joint under 7 N m: (a)
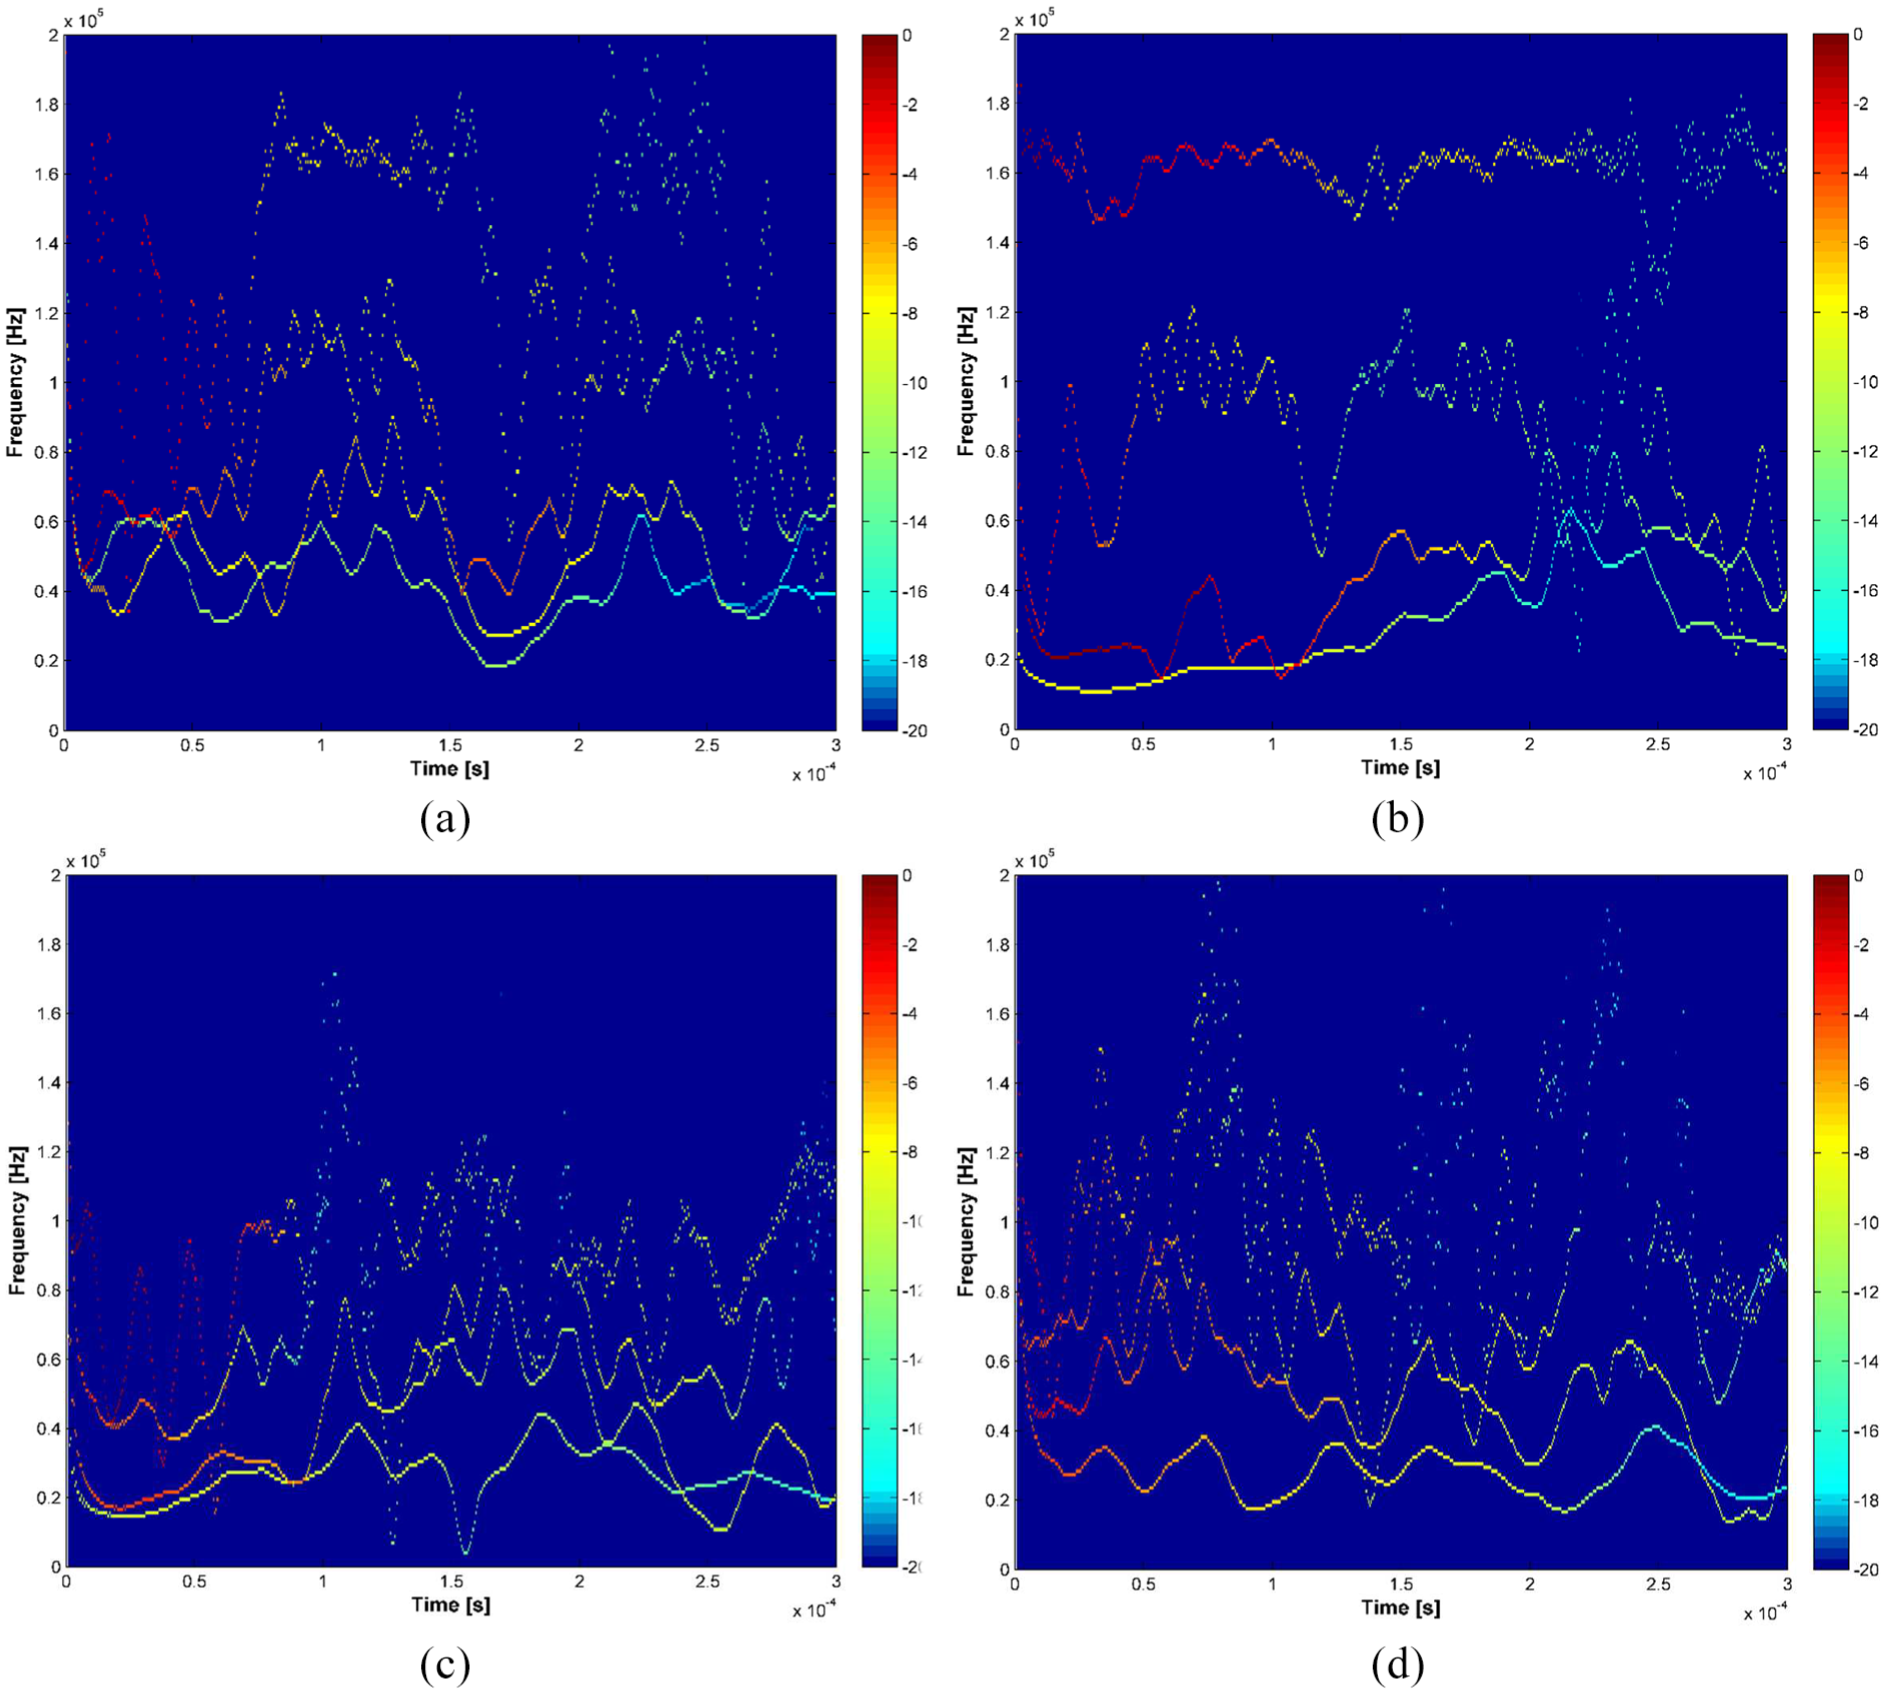
Hilbert–Huang transform spectra of the AE signals from the joint under (a) 1 N m, (b) 3 N m, (c) 7 N m, and (d) 9 N m.
To achieve a quantitative analysis of tightening conditions of bolted composite joint using AE signals, energy ratio
where

Energy ratios of IMF components decomposed from the AE signals from joints under different torques.
Monitoring of vibration loosening of bolted composite joints
In section “Characterization of the residual torque of bolted composite joints,” HHT-processed AE signal characteristics show the sensitivity to changes in the bolt torque manifest as energy shift from low-frequency components to high-frequency components with decreasing torque. The efficiency of the proposed method in detecting bolt loosening of composite joints during vibration fatigue will be further verified in what follows.
During the vibration fatigue, fretting wear occurs at the contact interfaces in composite joints due to dynamic external loading, as shown in Figure 16. Such volume loss at the contact interface leads to bolt loosening at the early stage of vibration fatigue. From previous analysis in section “HHT for bolt loosening-induced AE signals,” it can be concluded that the decrease in bolt torque results in a reduction in the interfacial pressure and an augment in the sliding distance between contact surfaces. As a consequence, more asperities with relative small sizes feature weak contacts and produce more high-frequency IMFs in the AE signals. To validate the efficiency of the proposed AE method in the continuous monitoring of bolt loosening, in this section, four bolted composite joints (see Figure 4(d)) under 3, 5, 7 and 9 N m are fatigued using flexural vibration for 10 h simultaneously and monitored using the HHT-based characteristics of AE signals. Most AE signals were captured during the first 2 h, indicating intensive fretting wear at the interfaces present at the early fatigue stage. Therefore, fatigue experiment in the first 2 h will be discussed in detail. The accumulated energy of the original AE signals generated in the four joints and the changes in the compressive strain of the bolts are plotted over time in Figure 17(a) and (b), respectively. The slope of the energy curves represents energy release rate of asperity contacts, which can be used to indicate the stability of the bolted joints under fatigue. From Figure 17(a), it can be found that the AE signals generated in the bolted joint under 3 N m exhibit most frequent changes in the energy release rate. While the AE signals generated in the bolted joint under 7 N m exhibit a relative low energy release rate, which indicates a stable contact condition of the bolted joint under this torque. However, cumulative energies of the AE signals from the joints under torques of 7 and 9 N m are similar during the fatigue process. Such similarity also occurs in the curves for the joints under torques of 3 and 5 N m during the first fatigue hour. In Figure 17(b), the degree of bolt loosening, evaluated by the decrease in the compressive strain, is found to decrease with an increase in the applied torque when it is not larger than 7 N m. From the comparison between Figure 17(a) and (b), the released energy of the AE signals, to some extent, is found to be capable of qualitatively detecting the state of a bolted joint under vibration fatigue, but not capable of identifying the influence of applied torque on the fatigue process of bolted joints under vibration.
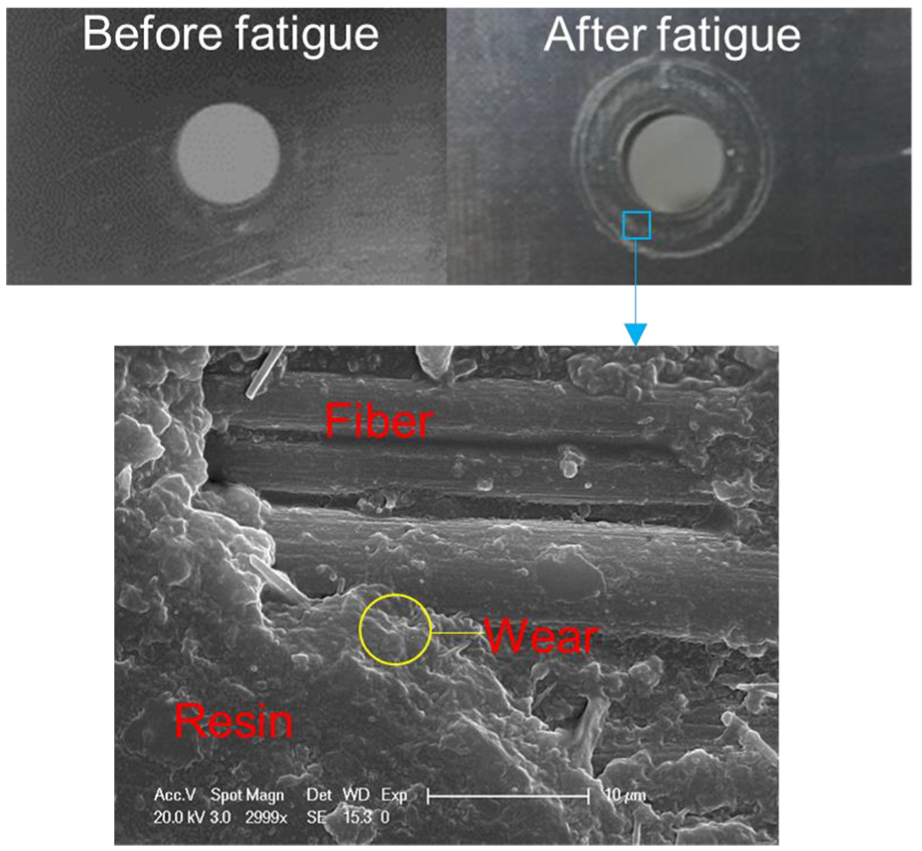
Fretting wear on the composite surface.
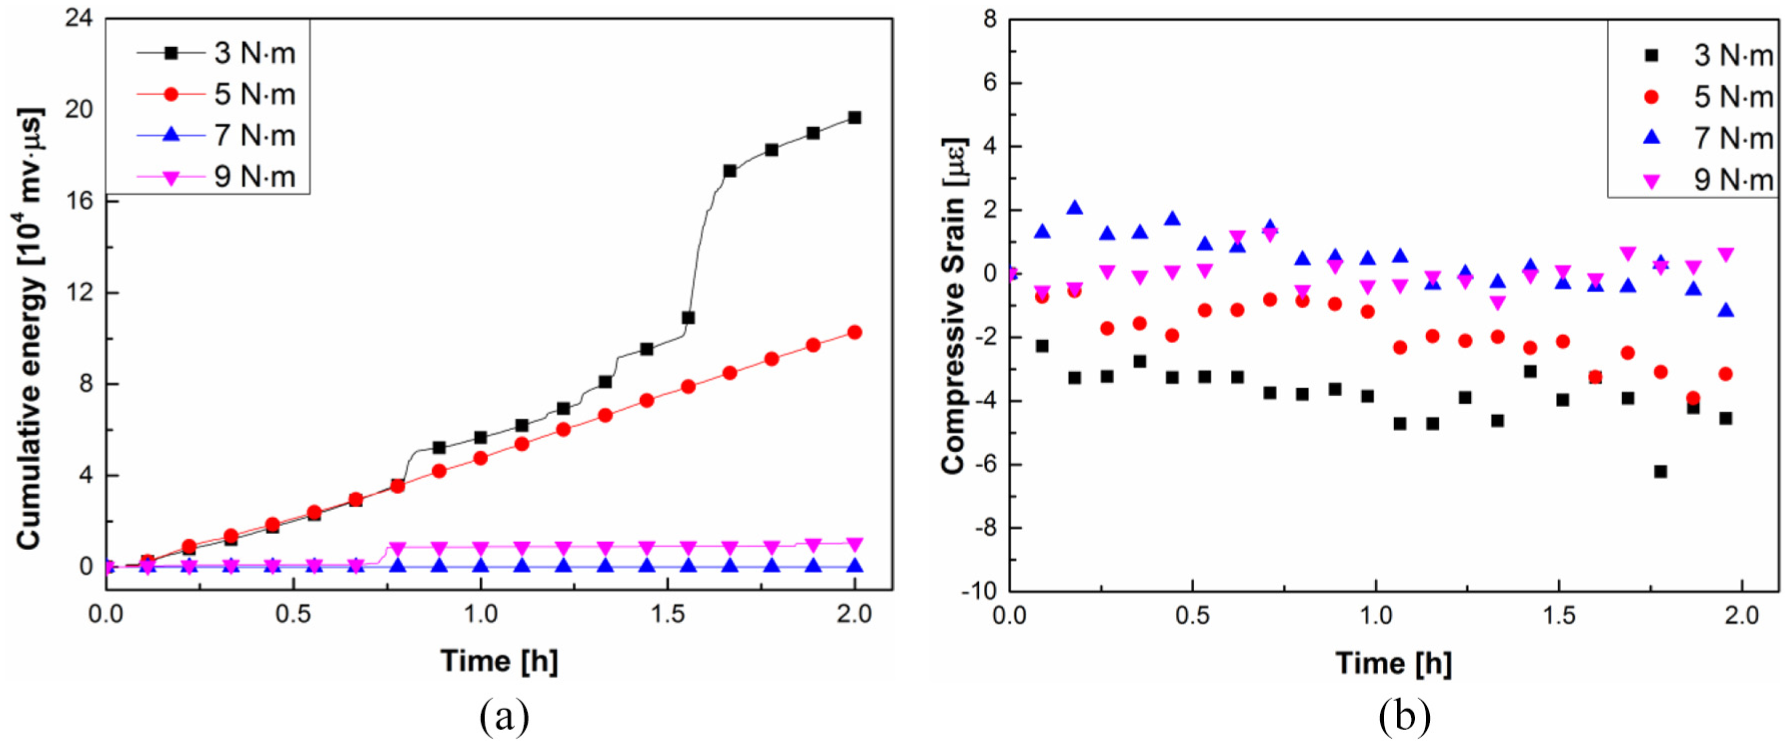
(a) Cumulative energy of the AE signals captured from the bolted joints under fatigue and (b) reductions in the compressive strain of related bolts.
HHT-processed AE signal characteristics will be applied to quantitatively detect tightening condition of bolted joints subject to vibration fatigue in what follows. As representative results, HHT spectra of the AE signals (average of 300 signals) from the joints under 3 and 7 N m over fatigue are comparatively shown in Figure 18(a)–(d). To observe that C-C contact–related (i.e. high-frequency) IMFs become stronger and distribute in a wider time range after fatigue. Energy ratios of first three IMF components of the AE signals generated from the bolted joints under different torques over fatigue are exhibited in Table 1. For the joints under 3, 5, and 7 N m, the energy ratios of residual IMFs decrease with some fluctuations over fatigue time, which indicates that the high-frequency IMFs become more intensive after fatigue, and are consistent with results as shown in Figure 18. While for the joint under 9 N m, the energy ratio of residual IMFs first decreases in the first hour and after then it increases. Upon further comparison between variation of compressive strain of the bolts and changes in the energy ratios of residual IMFs for the four joints, as shown in Figure 19, a considerable consistency in between can be concluded. As representative results, tightening torque of the joint under 9 N m decreases in the first 1.5 h and then increases. Similar change trend also presents in the energy ratio of residual IMFs. Therefore, the HHT-based characteristics of AE signals outperform the amplitude (energy)-based AE method in the continuous evaluation of tightening condition of the bolted composite joints under vibration fatigue.
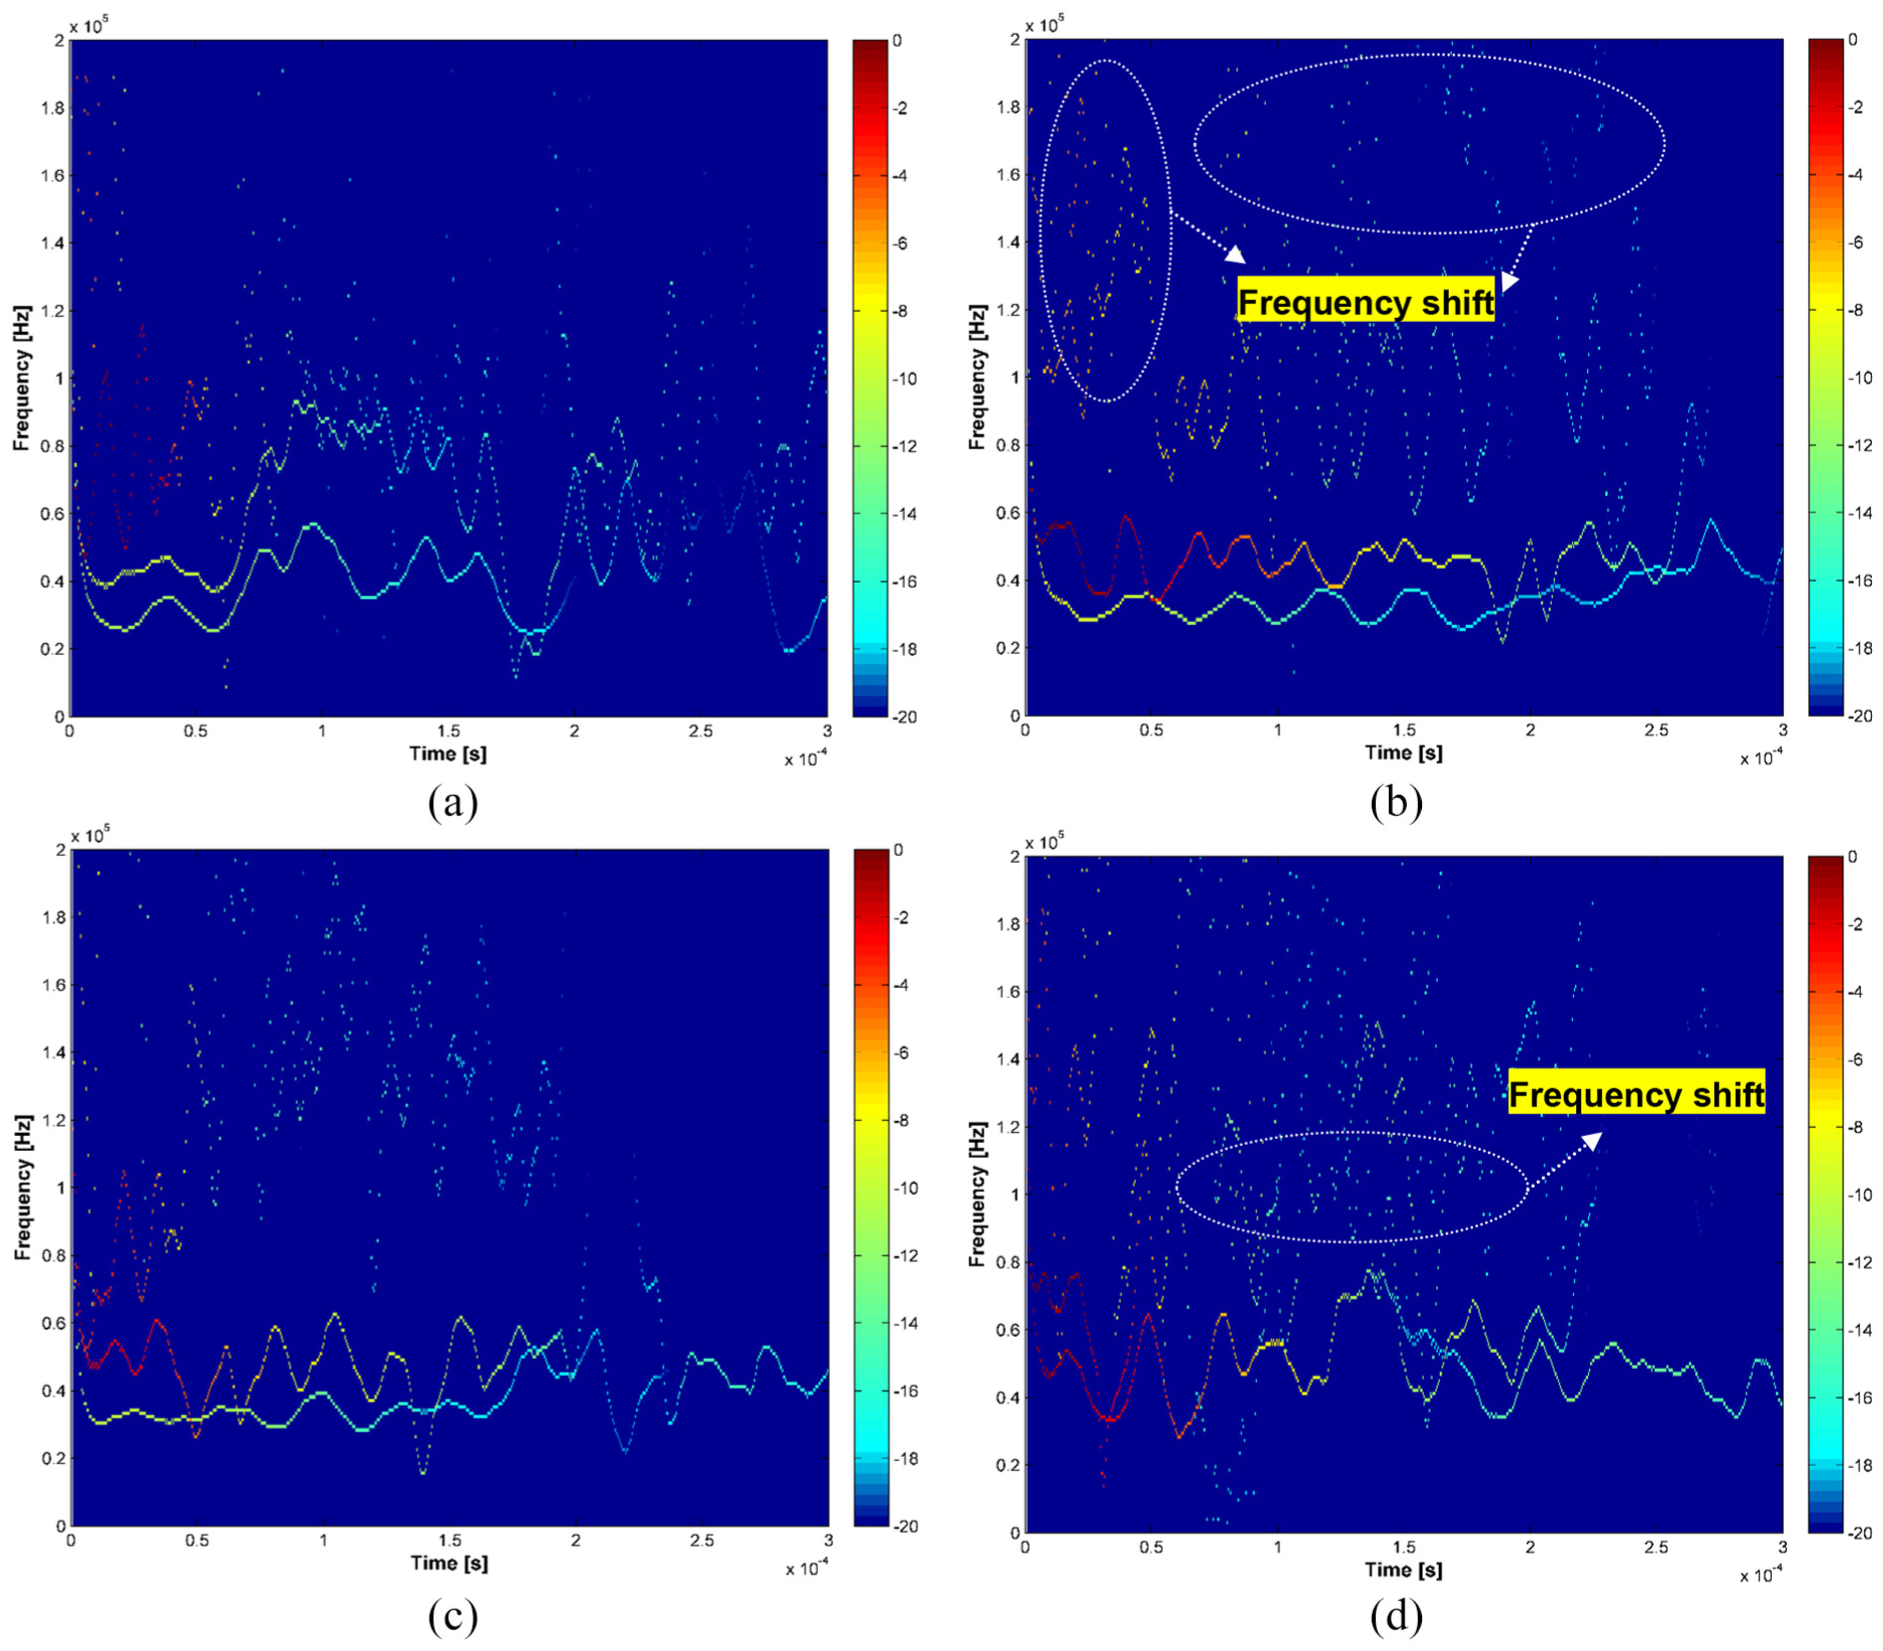
Hilbert–Huang spectra of the AE signals from the joint under 3 N m: (a) before and (b) after fatigue; from the joint under 7 N m (c) before and (d) after fatigue.
Evolution of energy ratios of IMF components decomposed from the AE signals from bolted joints under different torques over fatigue (unit: %).

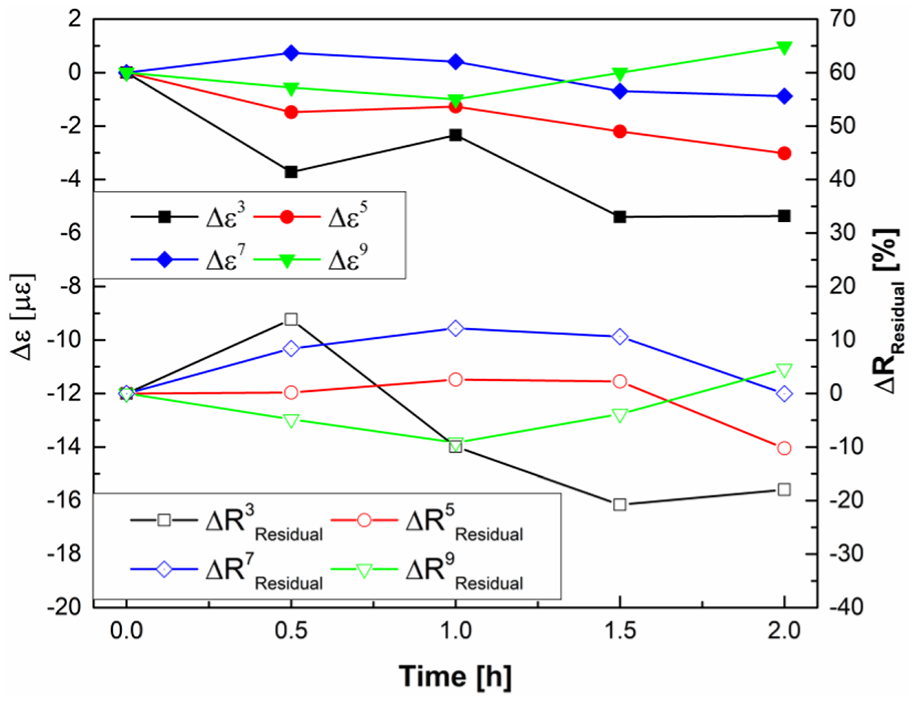
Variation of compressive strain (Δε, unit: με) and energy ratios of residual components (ΔRResidual, unit: %) over fatigue.
Conclusion
Evaluation of tightening conditions of bolted composite joints subject to vibration is attempted by directly analyzing the asperity contacts at the C-C interface using the HHT-based characteristics of AE signals in this study. The following conclusions can be drawn according to the experimental findings:
HHT shows a higher time–frequency resolution when processing bolt loosening–induced AE signals, which possess non-stationary characteristics, compared to STFT.
AE signals induced by asperity contacts at different contact interfaces (i.e. C-C and M-C contacts) in bolted composite joints can be discriminated by comparing the time presentation envelopes and the time–frequency distribution of the IMFs in the HHT spectrum. In the investigated frequency range, M-C contact–related AE signals dominate the frequency range between 10 and 40 kHz, while C-C contact–related AE signals mainly distribute between 20 and 200 kHz.
The gross energy of AE signals shows a considerable sensitivity to changes in the residual torque of a bolted composite joint in a limited range. Such method fails to quantitatively detect the tightening condition of joints under vibration fatigue. With usage of HHT-based signal characteristics, energy ratios of high-frequency IMFs induced by the C-C contact achieve an enhanced sensitivity to the decrease in bolt torque. Bolt loosening results in increases in the energy ratios of the C-C contact–related IMFs. Based on this, vibration loosening of bolted composite joints under different torques is quantitatively correlated to the increase in energy ratios of C-C contact–related IMFs. On this basis, continuous evaluation of bolted composite joints under vibration fatigue is achieved by the HHT-processed characteristics of AE signals.
Despite the promising results reported in this study, there are some problematic issues and challenges remaining for future exploration. Considering intensive attenuation, dispersion properties and signal complexity of the high-frequency AE propagating in composites, in the current primary study, AE signals in a frequency band of 10–200 kHz were considered. To achieve comprehensive understanding of generation mechanisms of AE signals in the bolted composite joint and their quantitative dependence on the tightening torque, frequency analysis in a wider spectrum will be implemented in future study. To extend this method for bolt loosening monitoring in multi-type joints with distinct surface properties, it is necessary to understand the relation between the surface properties (i.e. roughness and material types) and the centered frequencies of decomposed IMFs. To achieve this goal, future work is dedicated to building a theoretical contact model to describe asperity contacts in the mating parts of a bolted joint to facilitate the related numerical investigation.
Footnotes
Declaration of conflicting interests
The author(s) declared no potential conflicts of interest with respect to the research, authorship, and/or publication of this article.
Funding
This project is supported by the Hong Kong Research Grants Council via General Research Funds (nos 523313 and 15214414). This project is also supported by National Natural Science Foundation of China (grant no. 51375414).
