
Abstract
Seepage failure and slope instability in dike engineering are the most common dangerous cases which can easily lead to the break accident. The two dangerous cases have remarkable features such as complex causes, many influencing factors and strong uncertainty. The advantages in the safety factor method and the reliability analysis method are integrated. A dual criterion, which combines the certain index (safety factor) with the uncertain index (reliability), is proposed to evaluate the seepage and stability safety of dike engineering. The dynamic determination approach for the safety status of dike engineering and the corresponding dangerous water level threshold is developed. A representative section of one actual dike engineering is taken as an example. The seepage and stability safety of dike section is analyzed. The more comprehensive and objective evaluation results on service safety status and development trend are obtained. The determined threshold of dangerous water level, which can ensure the service safety of dike engineering, is very helpful to guide the scientific management of dike engineering.
Introduction
Most of failure cases in dike engineering are caused by seepage and instability.1–4 Safety factor is a common evaluation index for seepage and stability safety of dike engineering.5–7 The rich experience on it has been accumulated in practical applications. However, dike engineering is a system with significant uncertainty, fuzziness, and time variation. There is obvious limitation in judging the seepage and stability safety of dike engineering with certain safety factor. 8 For example, even if the safety factor is larger than the design criterion, the seepage and instability failures may occur. The safety factors are same, but the reliability values may be different.9,10 Reliability theory can effectively describe the uncertainty and correlation existing in dike system, and the service risk of dike engineering can be obtained. 11 However, this method can only reflect the changing trend of service reliability, and cannot judge the limit dangerous state of dike engineering. It is not convenient to direct the safe service of dike engineering. 12 A dual criterion, which combines the certain index (safety factor) with the uncertain index (reliability), can be used to implement the more comprehensive evaluation for the seepage and stability safety of dike engineering.
Wenqiang et al.13,14 make a beneficial attempt in evaluating the slope stability by the dual criterion-based approach. The median safety factor is multiplied with the reliability to obtain the reduced slope safety factor (namely, the reliability-safety factor). The pure mathematical probability distribution model is adopted to describe the distribution of material parameter. The negative or infinite parameter, which is allowable, makes the result not reflect the actual situation. Mingfang et al. 15 have made some modifications by considering the statistical characteristics of material parameters. Yong et al. 16 have further improved the dual criterion-based approach. The interval distribution of material parameters is considered, and the time-varying characteristics of material parameters are ignored. The dynamic evaluation of slope stability cannot be implemented.
According to the seepage and stability mechanism with stochastic uncertainty and time-varying characteristics, a dual criterion of dike safety, which combines the certain index (safety factor) with the uncertain index (reliability), is investigated in this article. The dual criterion-based approach is developed to implement the dynamic assessment for seepage and stability safety of dike engineering. The corresponding method is introduced to determine the dangerous water level threshold that can ensure the service safety of dike engineering. Finally, a representative section of one actual dike engineering is taken as an example.
Dual criterion-based evaluation model for service safety of dike engineering
Service reliability of dike engineering
The structural state function of dike engineering, which is described with the safety factor, can be expressed as follows 13
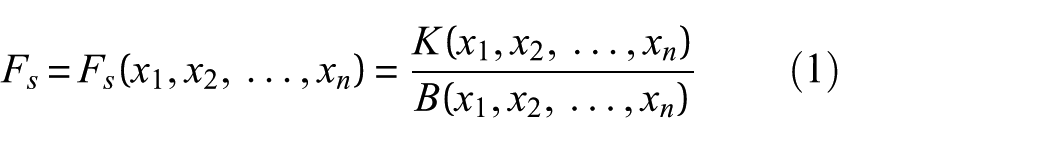
where K is the structural resistance; B is the load on dike structure; and
A set of sample values,
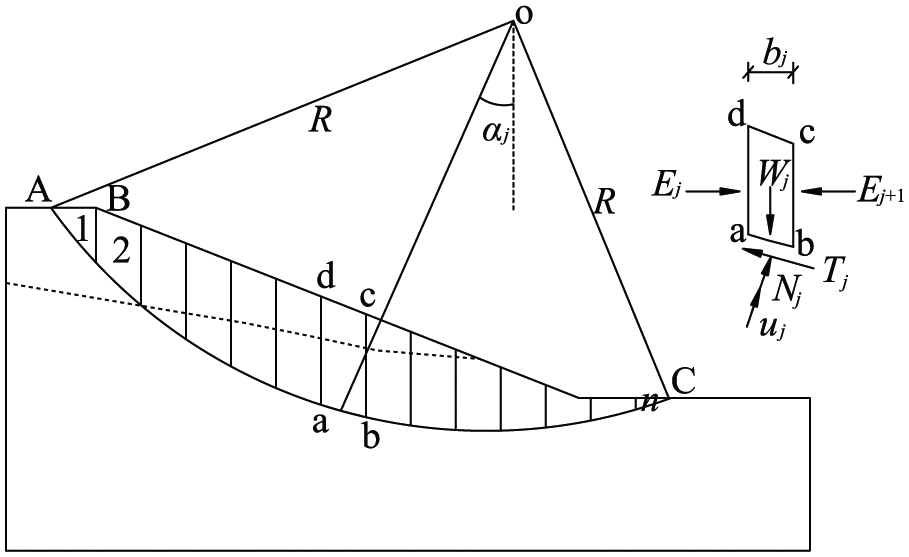
The Monte Carlo method, the first-order second-moment method, and the point estimate method are often used to calculate the reliability.17–19 The Monte Carlo method is based on mathematical statistical sampling and is not limited by analytical conditions. Theoretically, as long as the number of random samples is large enough, a relatively accurate solution can be obtained. It has been applied in many fields. The total number of Monte Carlo sampling simulation is related to the required error. When the total number of sampling reaches 4 × 10, 5 the accuracy of Pf can be guaranteed. The failure probability of engineering structures is very small, and the total number N of sampling will be correspondingly large, which brings some difficulties to the practical application of Monte Carlo method. To solve this problem, the improved Latin hypercube sampling method 20 and the dual sampling method are combined to carry out the sampling in this article. Figure 1 shows the implementation flowchart of fusion sampling method. Main steps are as follows:
Analyze the probability distribution of random parameters. The mean value and variation coefficient are determined.
Generate a random Latin square matrix using Latin hypercube sampling method.
Construct column correlation coefficient matrix.
Judge whether the maximum column correlation coefficient meets the requirements. If not meet the requirements, the Cholesky decomposition is used to obtain the new Latin square matrix.
Repeat steps 3 and 4 until the maximum column correlation coefficients meet the requirements or fail to obtain new matrices.
Obtain another set of random numbers, which are negatively correlated with the original random number, using the antithetic sampling method; another set of random numbers which are negatively correlated with the original random number are obtained.
Transform the random number into the sample value by transformation method or inverse function method.
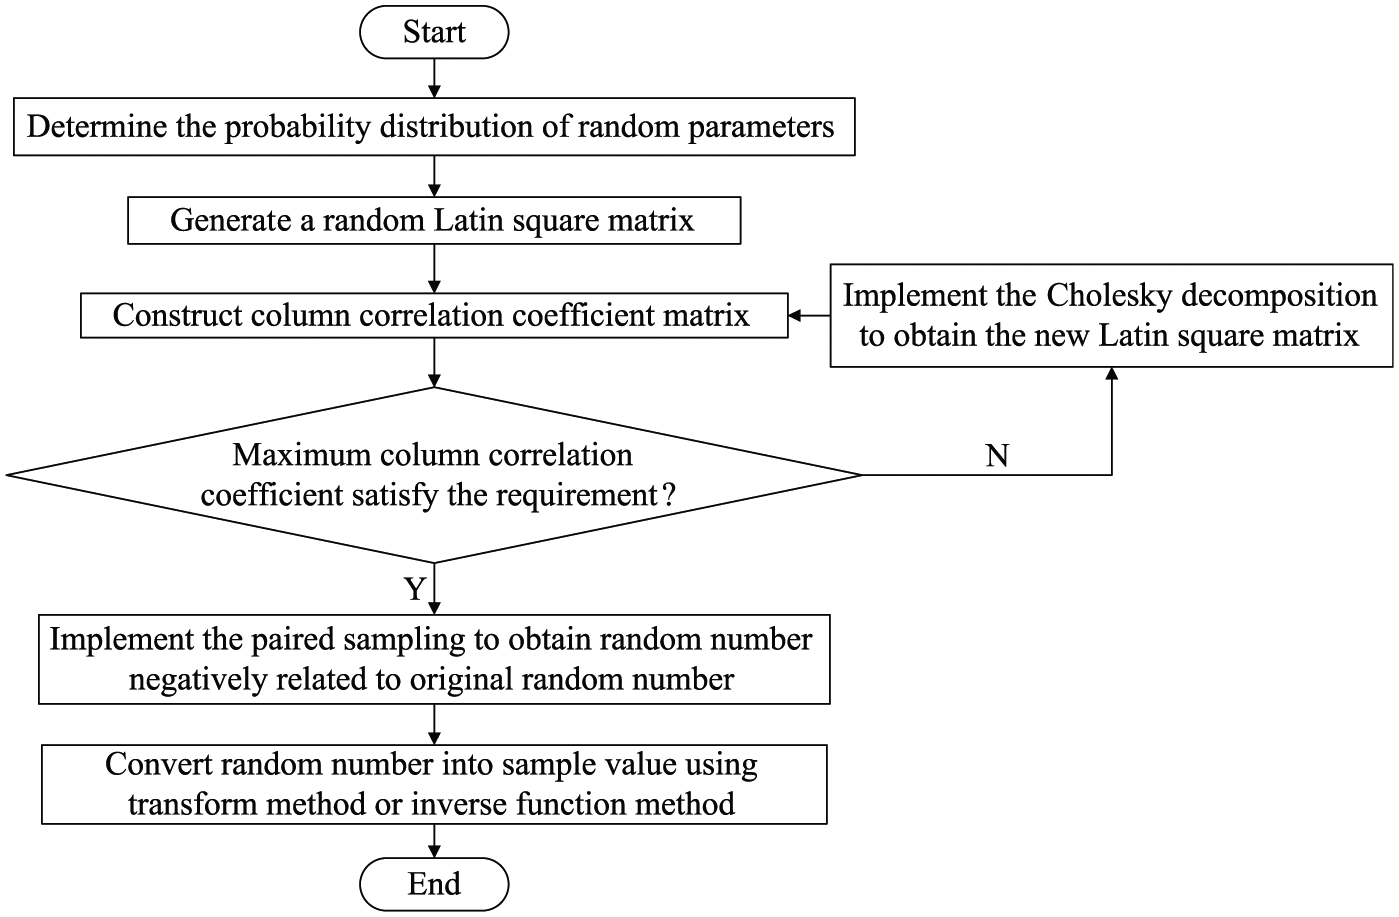
Implementation process of fusion sampling method.
Safety factor–reliability combined evaluation criterion for service safety of dike engineering
According to equation (1), the critical safety factor of dike structure is taken to build the following limit state equation of dike structure 14

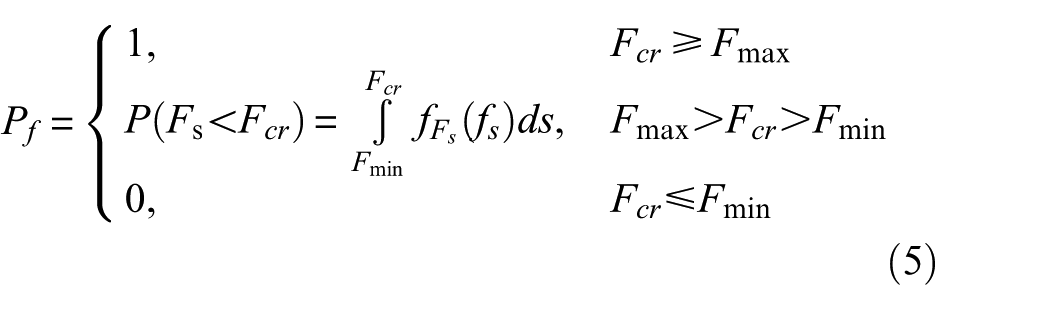
The corresponding failure probability of dike structure can be expressed as follows 15
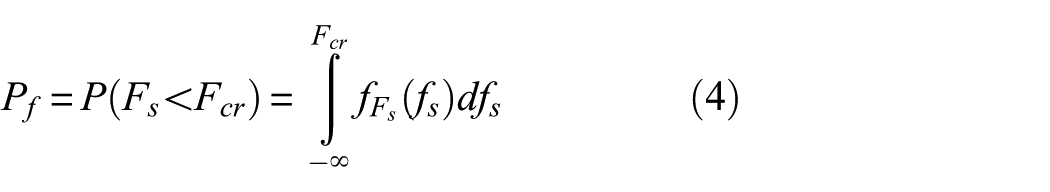
The statistical distribution and interval distribution of material parameters, such as cohesion, internal friction angle, and permeability coefficient, should be considered in the application of above theoretical model. That is, the whole function curve is replaced with the truncated material parameter distribution function to avoid negative or infinite parameters. N independent samples of safety factor,
where
When
The median safety factor of dike structure is multiplied by the structural reliability. The reduced median safety factor is called the reliability-safety factor,
13

When the reduced median safety factor is greater than 1, the structure is safe. When the reduced median safety factor is less than 1, the structure is destroyed. When the reduced median safety factor is equal to 1, the structure is in a critical state. Based on the limit state of the reduced median safety factor, equation (6) can be taken to calculate the critical failure probability corresponding to the median safety factor, namely
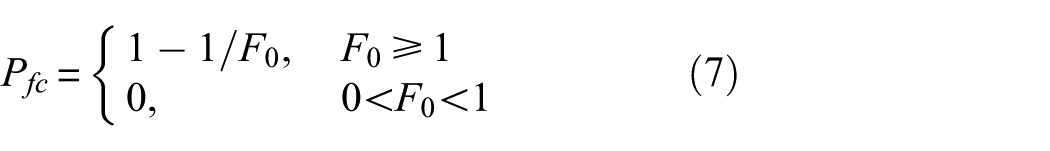
Therefore, the dual criterion for service safety of dike engineering is established. It combines the safety factor with the failure probability, as shown in Figure 2. The safety status of dike engineering can be evaluated by comparing the failure probability calculated by equation (5) with the critical failure probability.
Dual criterion for service safety of dike engineering.
Dual criterion-based method evaluating seepage safety of dike engineering
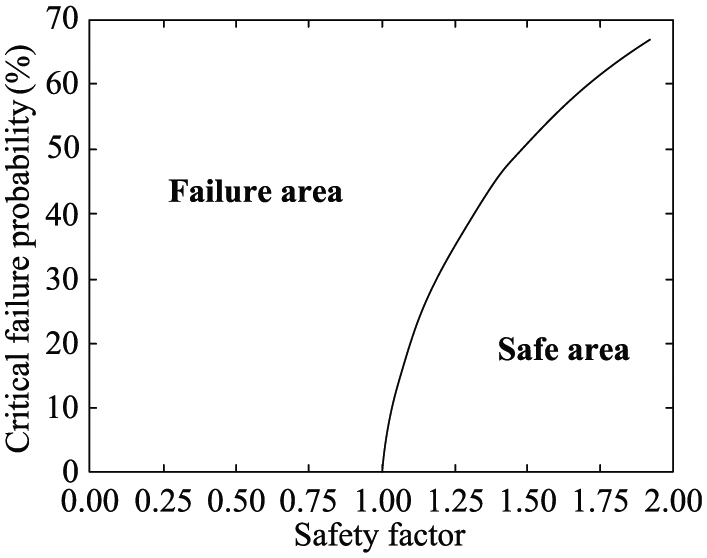
The rise and fall of water level experienced in a year can be regarded as a process of one dry–wet cycle for dike soil. The partition characteristic, as shown in Figure 3, appears in dike soil. The area above the saturation line of high water level is a natural state zone. It is not affected by the dry–wet cycle. The cohesion and the internal friction angle are constant. The area between the saturation line of high water level and the saturation line of low water level is the dry–wet cycle zone. It has been known that the periodic variation of water level, namely, the dry–wet cycle action, can make the cohesion and the internal friction angle decline. The area below the saturation line of low water level is a long-term saturated state zone. The cohesion and the internal friction angle are basically stable.
Structural partition caused by varying water level.
The decline process of soil strength parameters in the dry–wet cycle zone can be characterized as follows 21
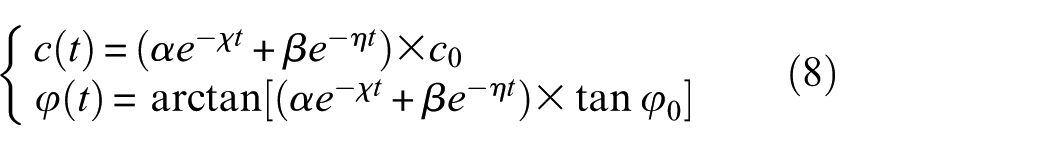
where
The deformation failure of dike soil, which is caused by seepage, is called the seepage deformation. There are two common forms of seepage deformation, namely, piping and soil flow. 22 The piping is a phenomenon where the fine particles in the soil layer are taken away or out through the pores among the coarse particles under the seepage action. The soil flow appears in the clay and uniform sand soil under the seepage action. It is a phenomenon that when the seepage exit gradient is greater than the allowable gradient, the soil surface is jacked and floated by seepage. When the hydraulic gradient is sufficiently high between the inside of the material, which is below the bottom of the channel, and the zone near the top, unstable surfaces are generated. It will affect seepage safety. The soil flow may appear in the dike case in this article. Therefore, this article focuses on the soil flow failure. The critical seepage gradient of soil flow failure can be expressed as follows 21
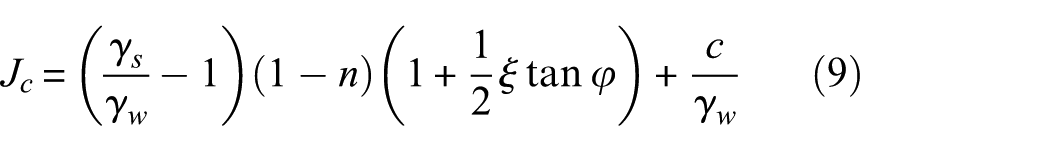
where
The seepage gradient of dike soil can be obtained using seepage finite element method. The solution of the two-dimensional anisotropy stationary seepage problem can be expressed as follows 23
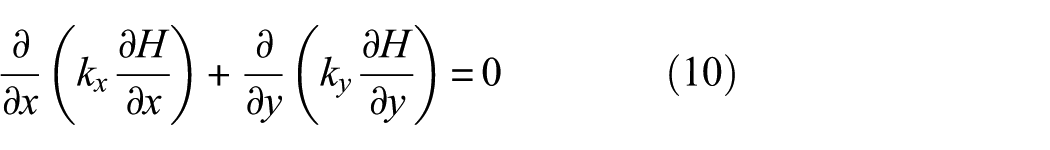
where
The solution of certain seepage field can be regarded as the following functional extreme value problem24,25
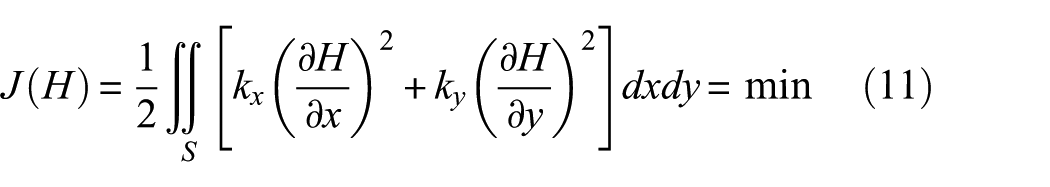
The following can be obtained by discretizing equation (11) in the seepage field
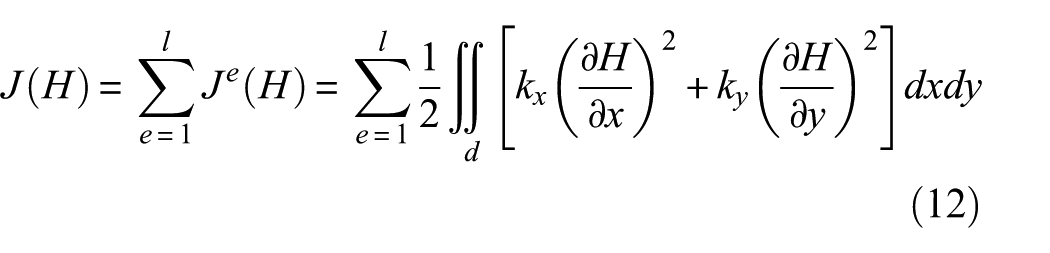
where J is a functional about H, l is the element number, S is the area of seepage field, and d is the element area.
An interpolation function
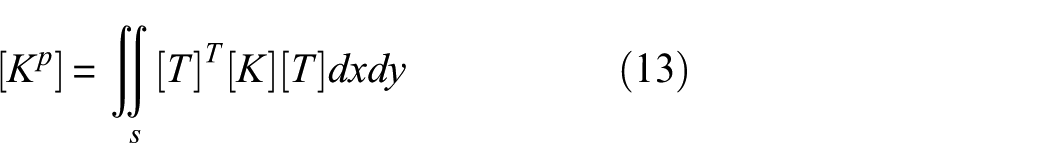
where
The randomness of dike seepage field mainly comes from the variation of
The basic cause of seepage failure is that the exit gradient J exceeds the critical seepage gradient Jc. The exit gradient J can be determined by the seepage finite element analysis. The critical seepage gradient is mainly affected by the cohesion and the internal friction angle of overburden layer. When the ratio of the critical seepage gradient to the exit gradient is less than 1, the seepage failure occurs. So, the state function on safety factor of dike seepage can be expressed as follows
where
According to equation (3), the following performance function on time-varying reliability of dike seepage is constructed
where
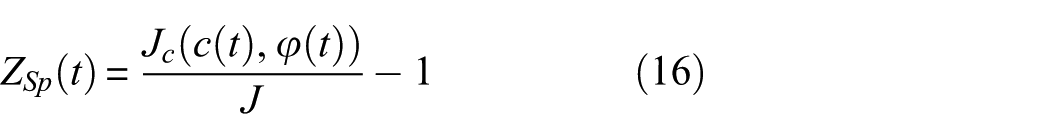
Assume that

When the reduced median safety factor is greater than 1, the dike seepage is safe. When the reduced median safety factor is less than 1, the seepage failure appears. When the reduced median safety factor is equal to 1, the dike seepage is in a critical state. According to the limit state of the reduced median safety factor, equation (17) can be taken to calculate the critical failure probability of dike seepage, namely
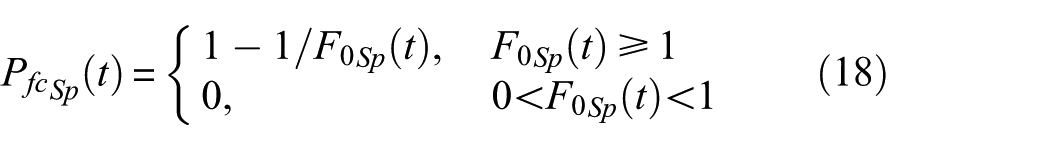
According to the critical failure probability of dike seepage, the threshold of dangerous water level can be determined. The implementation flowchart is shown in Figure 4, and the main steps are as follows:
Select the calculated water level
Implement the fusion sampling process as shown in Figure 1 to extract N groups of the parameters. Calculate the exit gradient J and the critical seepage gradient Jc(t). Determine the safety factor
Increase continuously N. End the sampling operation when the standard deviation of
For the water level
Obtain the reliability-safety factor of dike seepage by the failure probability
According to the limit state of median safety factor of dike seepage, equation (17) is taken to calculate the critical failure probability
Compare
Dynamic evaluation process for seepage safety of dike engineering.
Dual criterion-based method evaluating stability safety of dike engineering
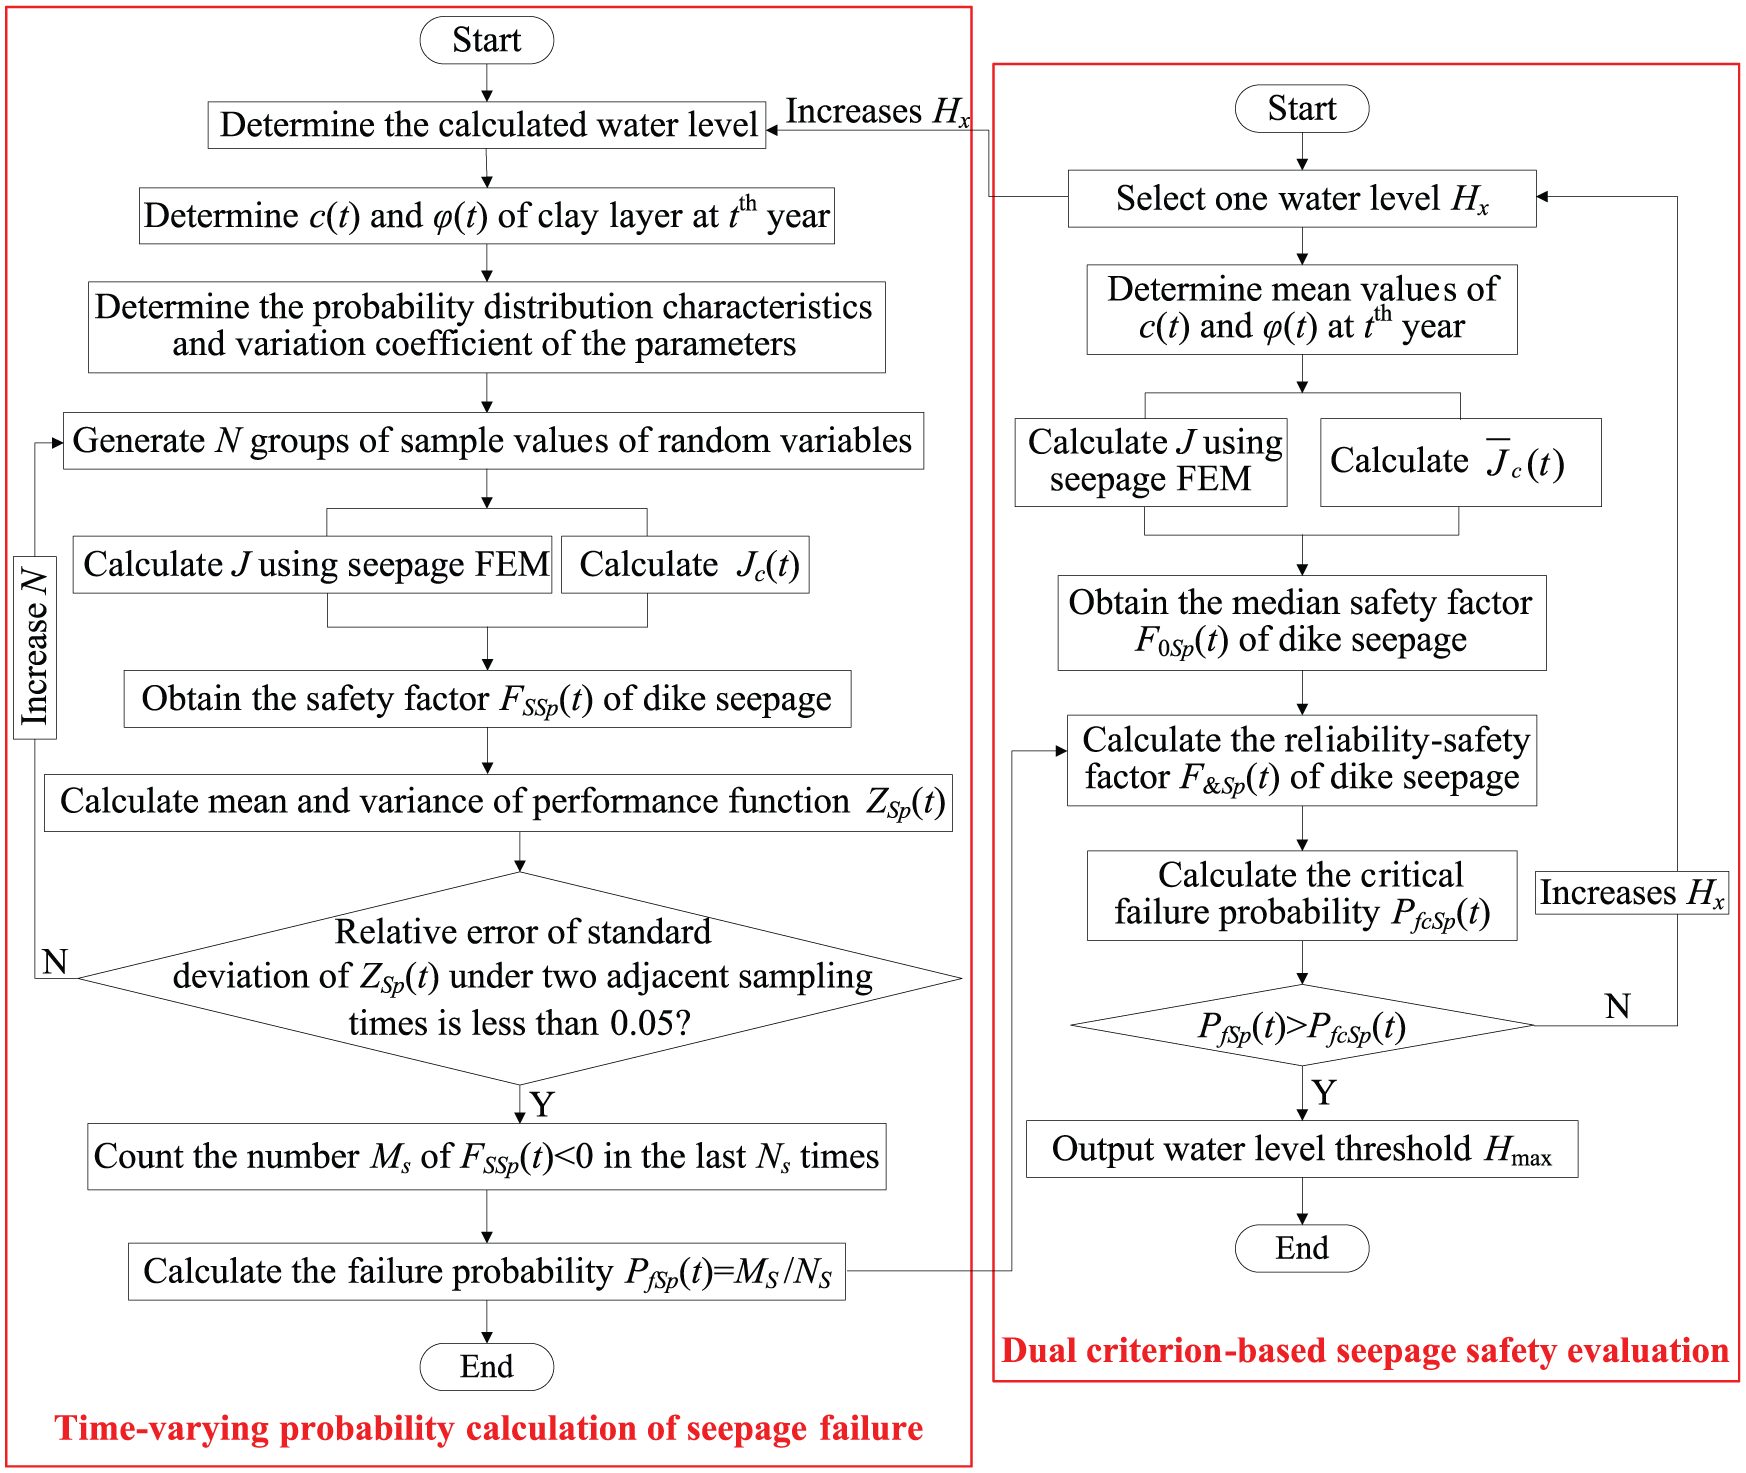
In this article, the simplified Bishop method, as shown in Figure 5, is used to analyze the stability of dike slope. Under the action of high water level, the instability of dike slope usually occurs in the downstream face. 6 So, the stability problem of dike slope in the downstream face is analyzed in this article.
Stability analysis for dike slope using simplified Bishop method.
According to the basic assumptions in the simplified Bishop method and the dynamic decline process of mechanical parameters, the time-varying safety factor of dike stability can be expressed as follows 26
where
In the calculation, the mechanical parameters of the soil slices in the dry–wet cycle zone should be dynamically determined with equation (8). The mechanical parameters in the natural state zone and the saturated state zone can be regarded as constants. The pore water pressure
According to equation (3), the following performance function on time-varying reliability of dike stability is constructed

where
Assume that

When the reduced median safety factor is greater than 1, the dike slope is stable. When the reduced median safety factor is less than 1, the instability failure of dike slope appears. When the reduced median safety factor is equal to 1, the dike slope is in a critical stability state. According to the limit state of the reduced median safety factor, equation (22) can be taken to calculate the critical instability failure probability of dike slope, namely
According to the critical instability failure probability of dike slope, the threshold of dangerous water level can be determined. The implementation flowchart is shown in Figure 6, and the main steps are as follows:
Select the calculated water level
Implement the fusion sampling process as shown in Figure 1 to extract N groups of the parameters. Determine the safety factor
Increase continuously N. End the sampling operation when the standard deviation of
For the water level
Obtain the reliability-safety factor of dike stability by the failure probability
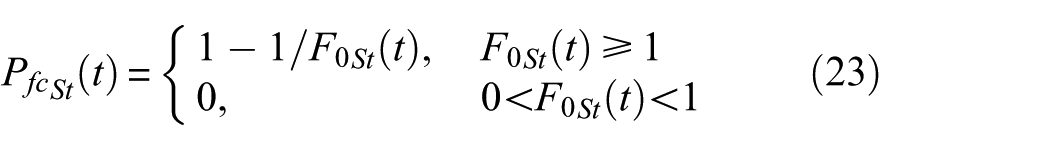
According to the limit state of median safety factor of dike stability, equation (23) is taken to calculate the critical instability failure probability
Compare
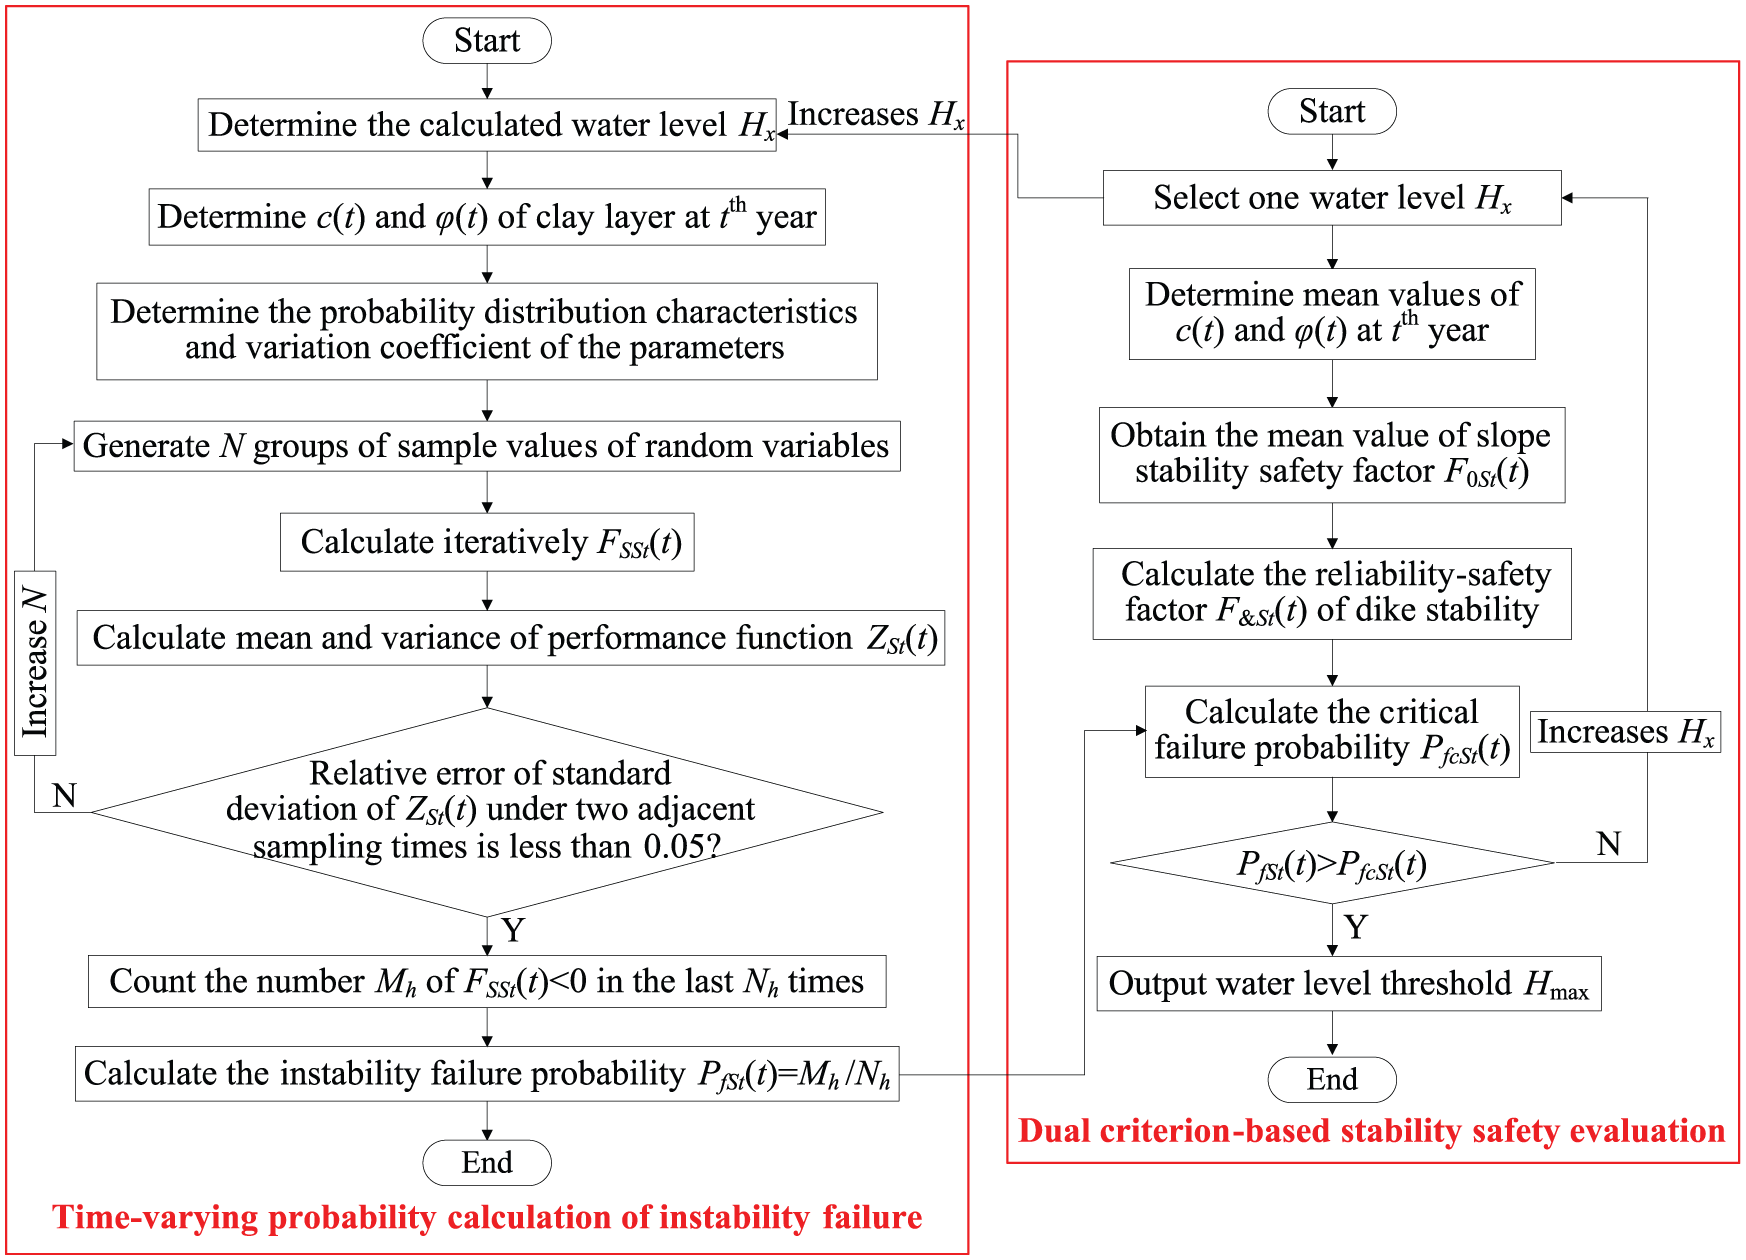
Dynamic evaluation process for stability safety of dike slope.
Example analysis
Engineering overview and material parameters
A dike engineering with the total length of 22.92 km is an important flood protection project in the basin plain area. Since 1855, the river has been diverted 7 times, forming 8 overlapping leaf valves. The topography and sedimentary environment of the basin are shown in Figure 7(a). 27 The overall topography of the basin is high in the West and low in the East. The topography of the upper delta plain is very flat, and it slopes gently toward the sea, with a slope of about 1/10,000. Common landform units on the land include distributary channels, crevasse splay, natural dikes, and flood plains. Because of the dike construction, the above natural geomorphic units developed better only in the lower part of the distributary channel. The upper part is often divided into abandoned channel highlands, river courses, inland river beach highlands, and outbank depressions. The area faces serious water shortage. Due to geological constraints, more small-scale enclosing dams have been built to alleviate the contradiction of water supply, save water, save land, and improve water quality. Because of the high degree of soil salinization, land development and management projects are carried out by means of deep ditch pressure water drainage and underground pipe drainage, with emphasis on the development of barren and alkali land, comprehensive agricultural development, and land consolidation.
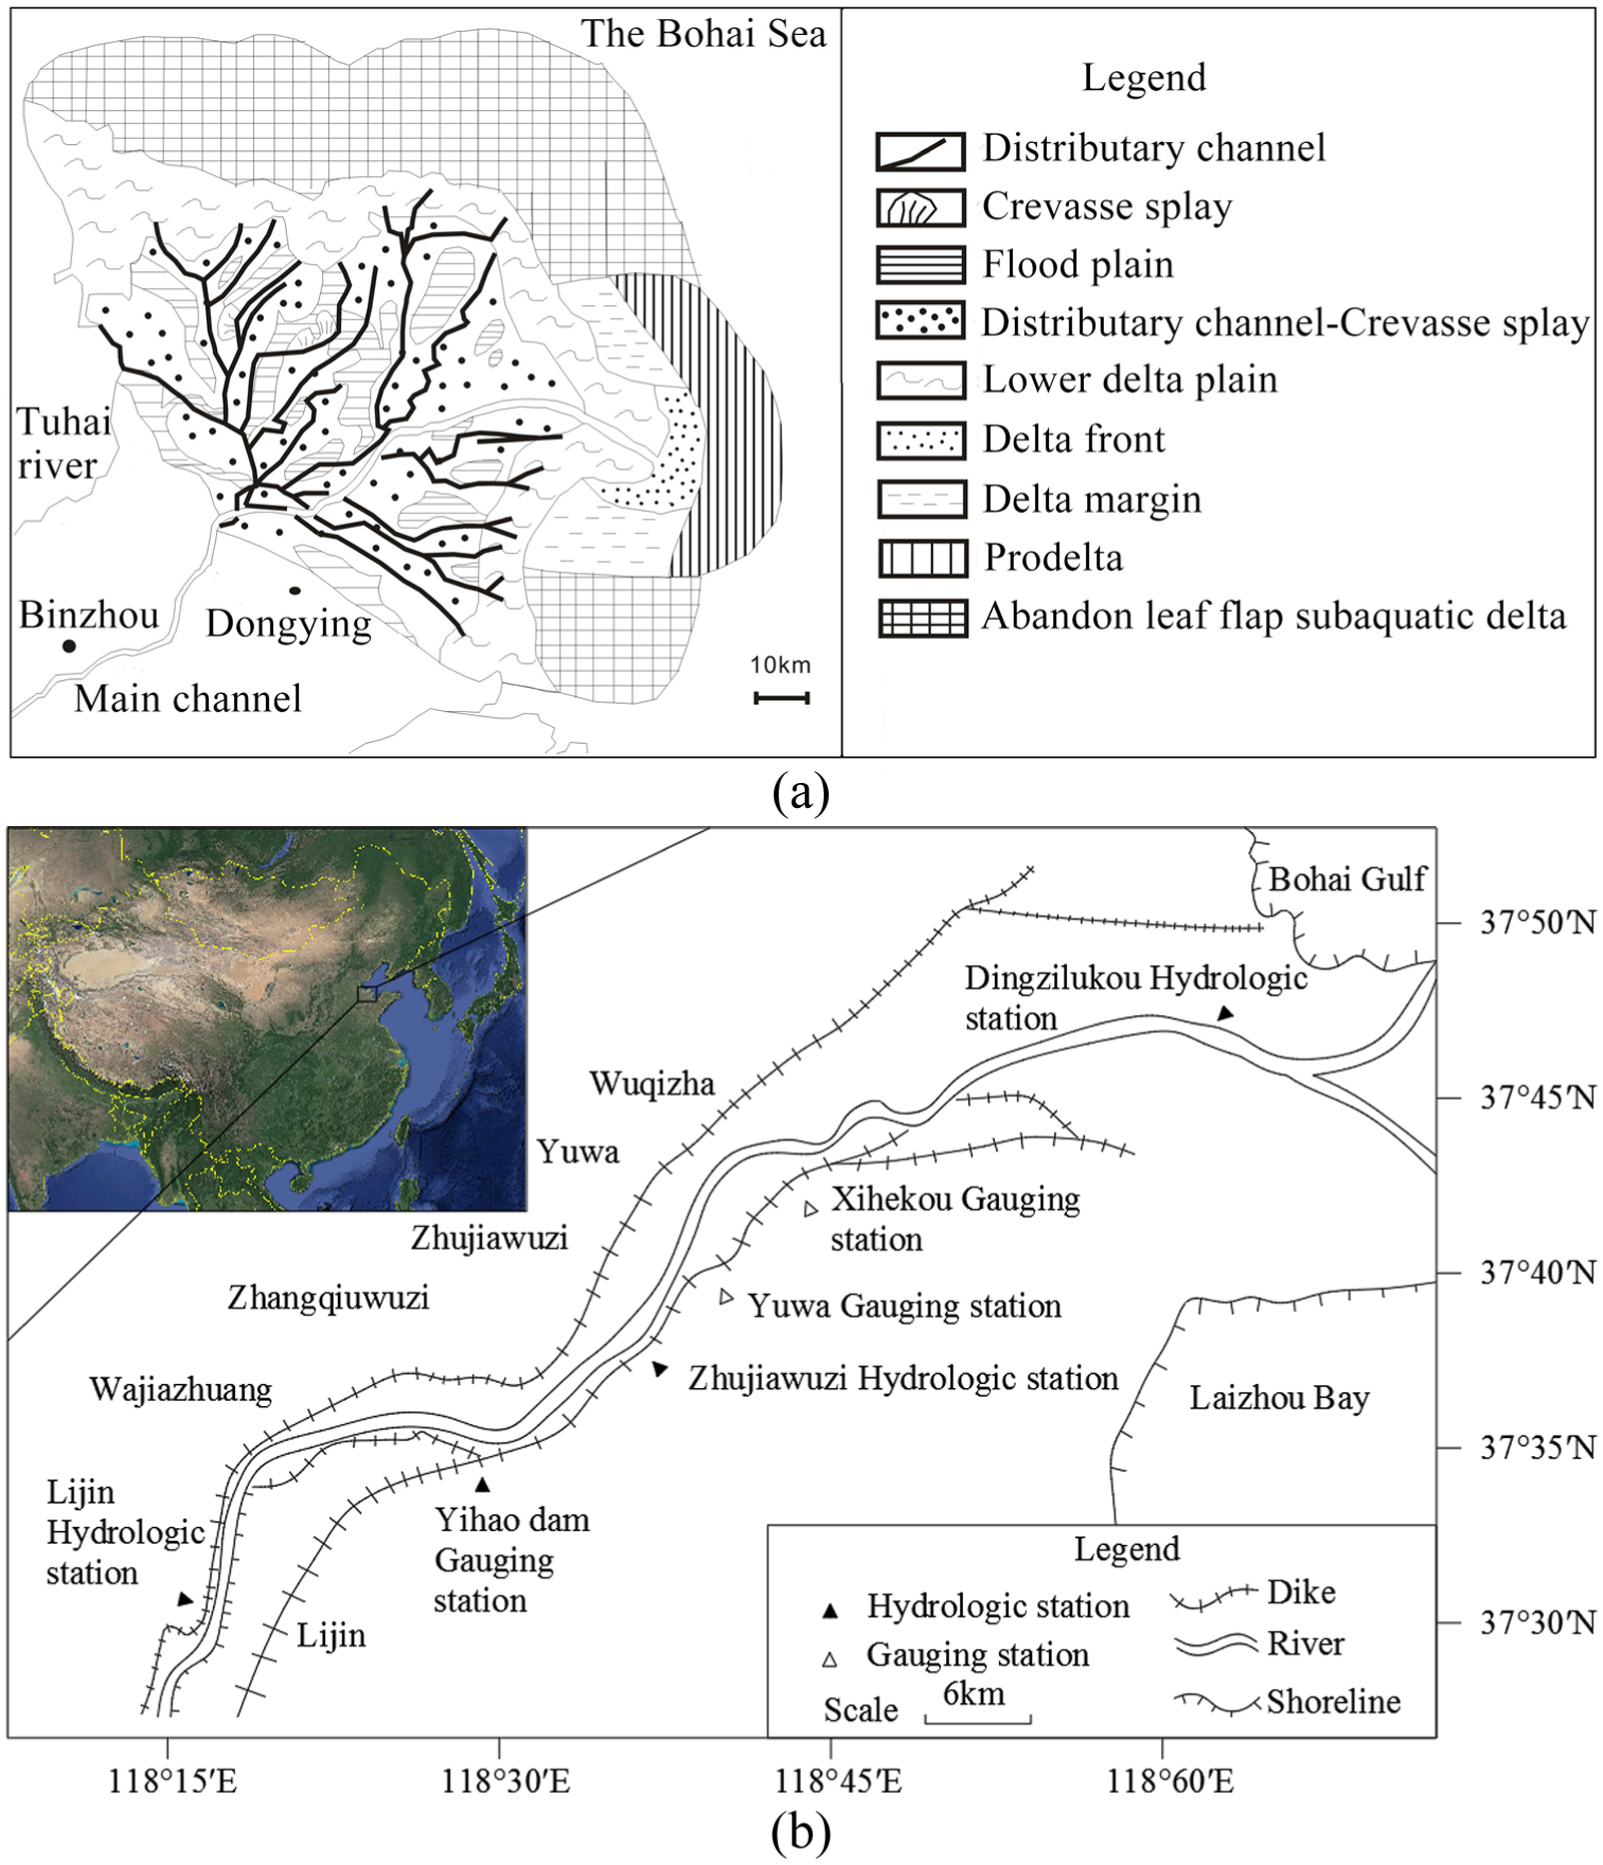
(a) Topography and sedimentary environment of the basin and (b) dike layout.
The layout of dike engineering is shown in Figure 7(b). The river water level is mainly affected by runoff. So, the flood season is usually from May to October, and the dry season is from November to April. And the water level varies greatly and shows a more obvious annual cycle. Valley-type loose sediments are extensively developed in river channels. There are sedimentary boulder, gravel sand, and a small amount of medium fine sand and sandy loam, cohesive soil at the bottom. The upper part is sandy loam, silty sand, cohesive soil, and silt soil. And the surface is the silt and clayey soil deposited. Because of the slow and steady flow, the depositional regularity and stratification are obvious. The main characteristics are interbedded, thin layer distribution and horizontal bedding development. In addition to partial scour, the riverbed scour and deposition change little, and the river regime is relatively stable. The complete section of the river is Lijin hydrological station to the estuary. A flood with a 20-year return period was considered in the design of dike. The value of the peak flow is 5600 m3/s, the corresponding water level is 9.73 m, and the water velocity is 1.66 m/s. The duration of this flood is 11 days. A typical section is shown in Figure 8. The crest width of dike section is 6 m. The height of dike body is 12.5 m. The upstream slope ratio is 1:2.5, and the downstream slope ratio is 1:2. The highest water level in the history is 10.22 m. The dike body is silty loam. The dike foundation is divided into two layers. Its upper part is the soft clay with the thickness of 2 m, and its lower part is the sand gravel with the thickness of 8 m.
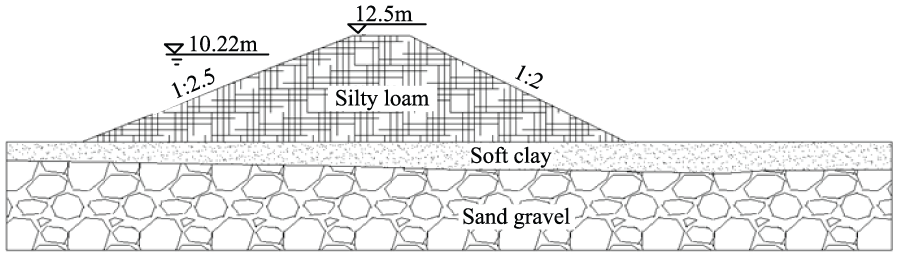
Dike section.
The statistical analysis for material parameters of dike soil is implemented to obtain the mean value and variation coefficient. The initial values of material parameters of dike soil are taken as the site test values when the dike project is completed. Due to few sample data, a A
2
test method is chosen.28,29 The test results are obtained by comparing the empirical distribution function Fn(x) with the theoretical distribution function F(x). The statistical
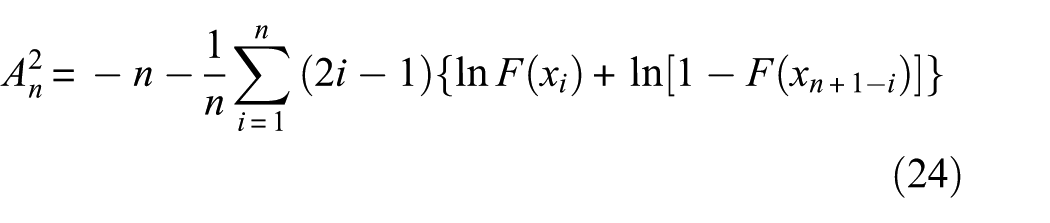
where n is the number of statistical samples, and
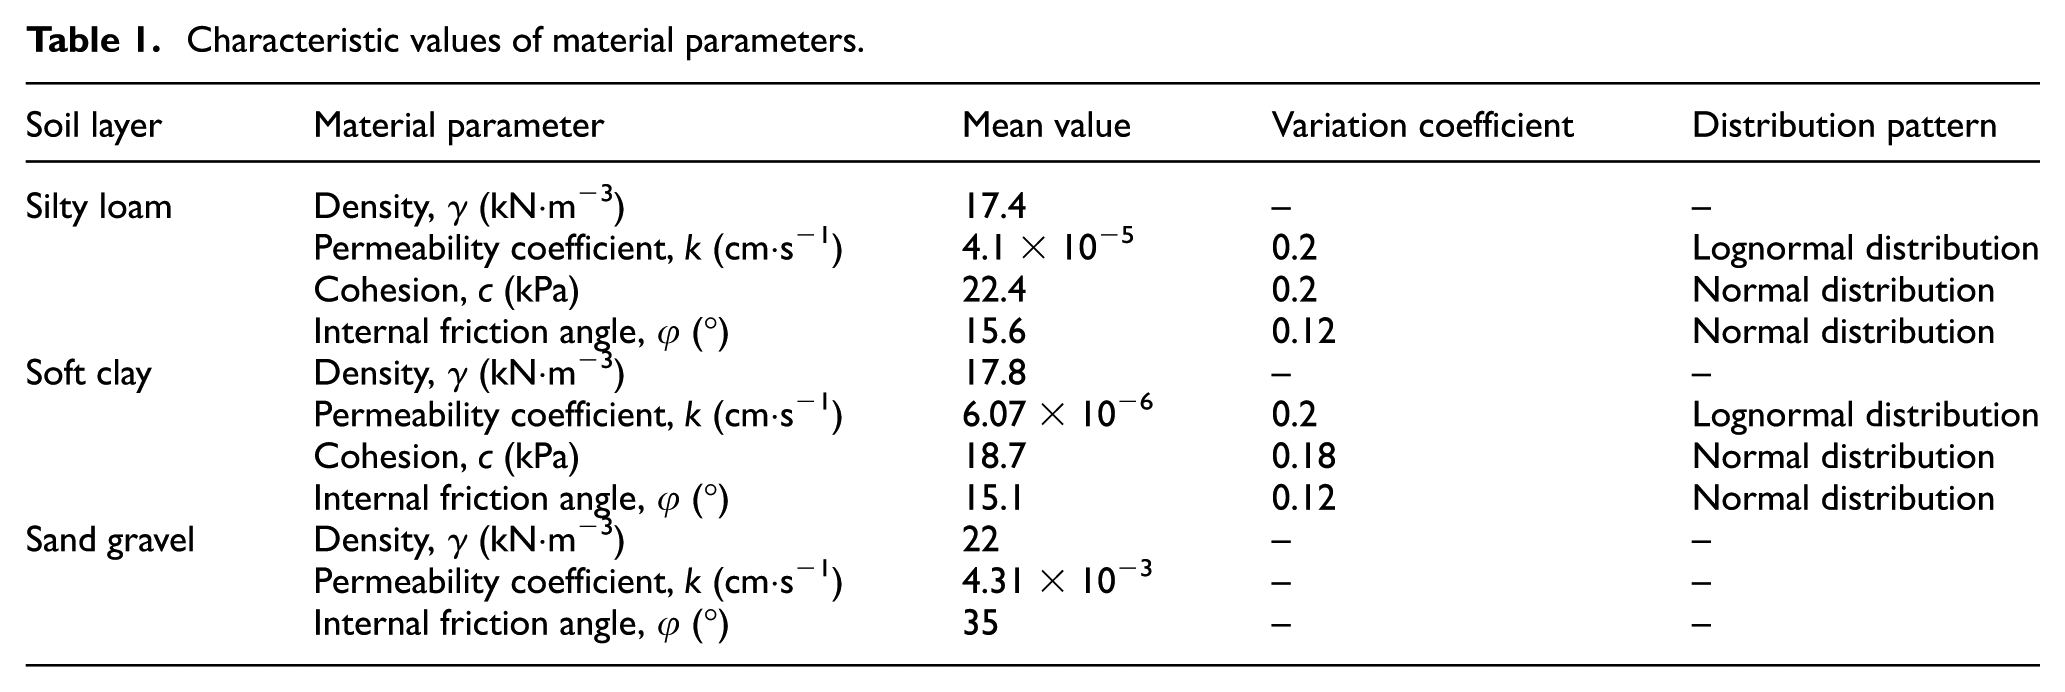
The above method is adopted to implement the statistical analysis for the test results on soil material parameters of dike body and dike foundation. Table 1 lists the statistical parameter values.
Characteristic values of material parameters.
Evolution law of mechanical index
The clay in dike foundation and the loam in dike body are selected to manufacture the tested specimens. Each type of soil sample specimens is divided into 7 groups which simulate the natural state of soil sample and 1, 2, 3, 5, 10, and 15 times of dry–wet cycles, respectively. Every group is divided into three subgroups which consist of four specimens. In order to simulate the seepage action in dike soil under natural environment, the free water immersion method is adopted. In the operation process, both sides of the sample ring knife are clamped by filter paper and permeable stone, and the upper and the lower four stacks are arranged into a set and are clamped into the container by a water filling clamp to saturate freely. In order to make the dry–wet cycle process more close to the real nature state and ensure that the structural features of soil sample are not damaged, the test is carried out using a low-temperature oven blowing drying method. The apparatus is shown in Figure 9(a). The shear failure test is fulfilled with the SY30-20 triaxial apparatus which is shown in Figure 9(b). The test procedure is shown in Figure 10.
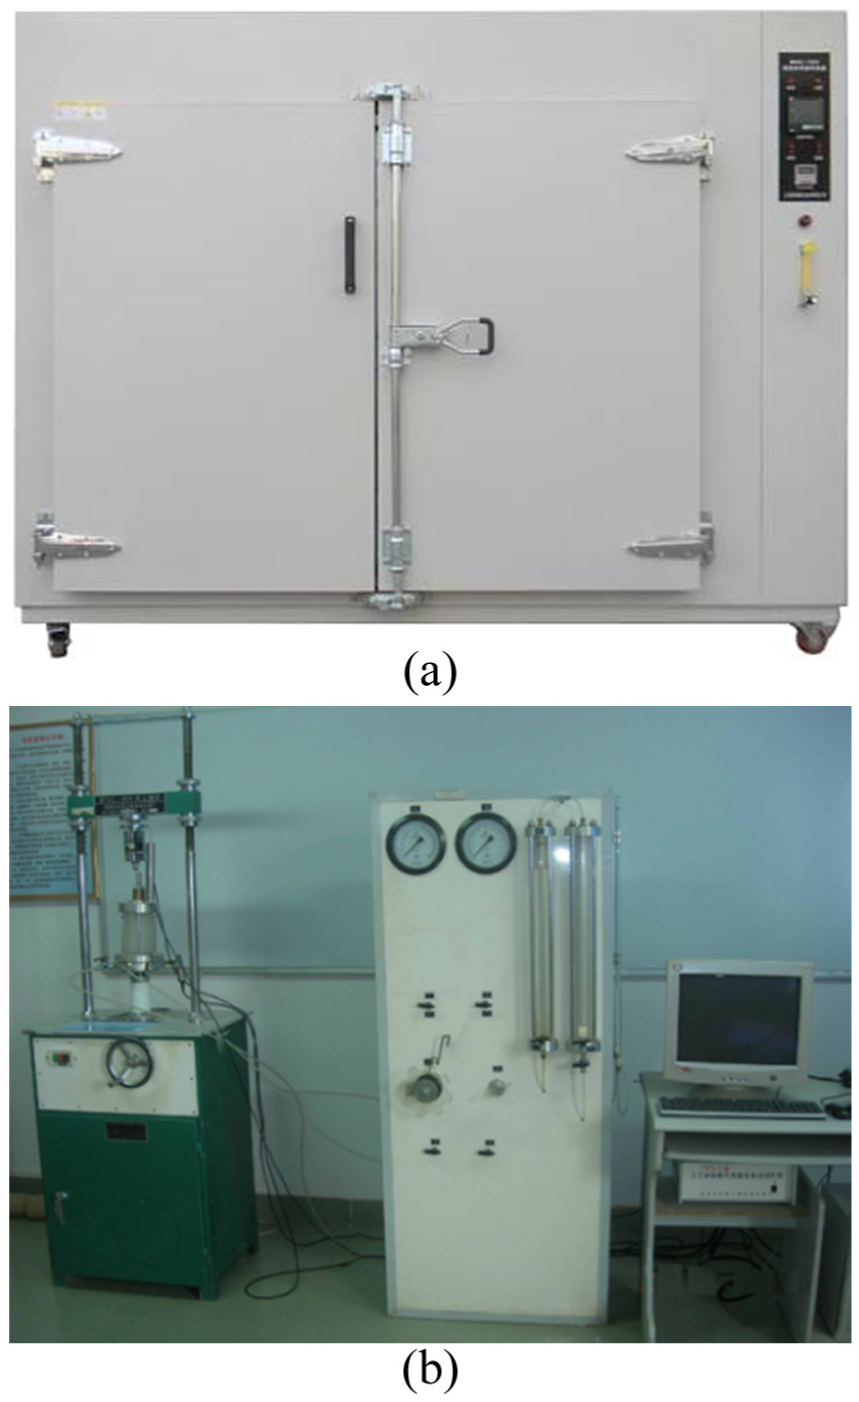
(a) Low-temperature oven and (b) triaxial apparatus.
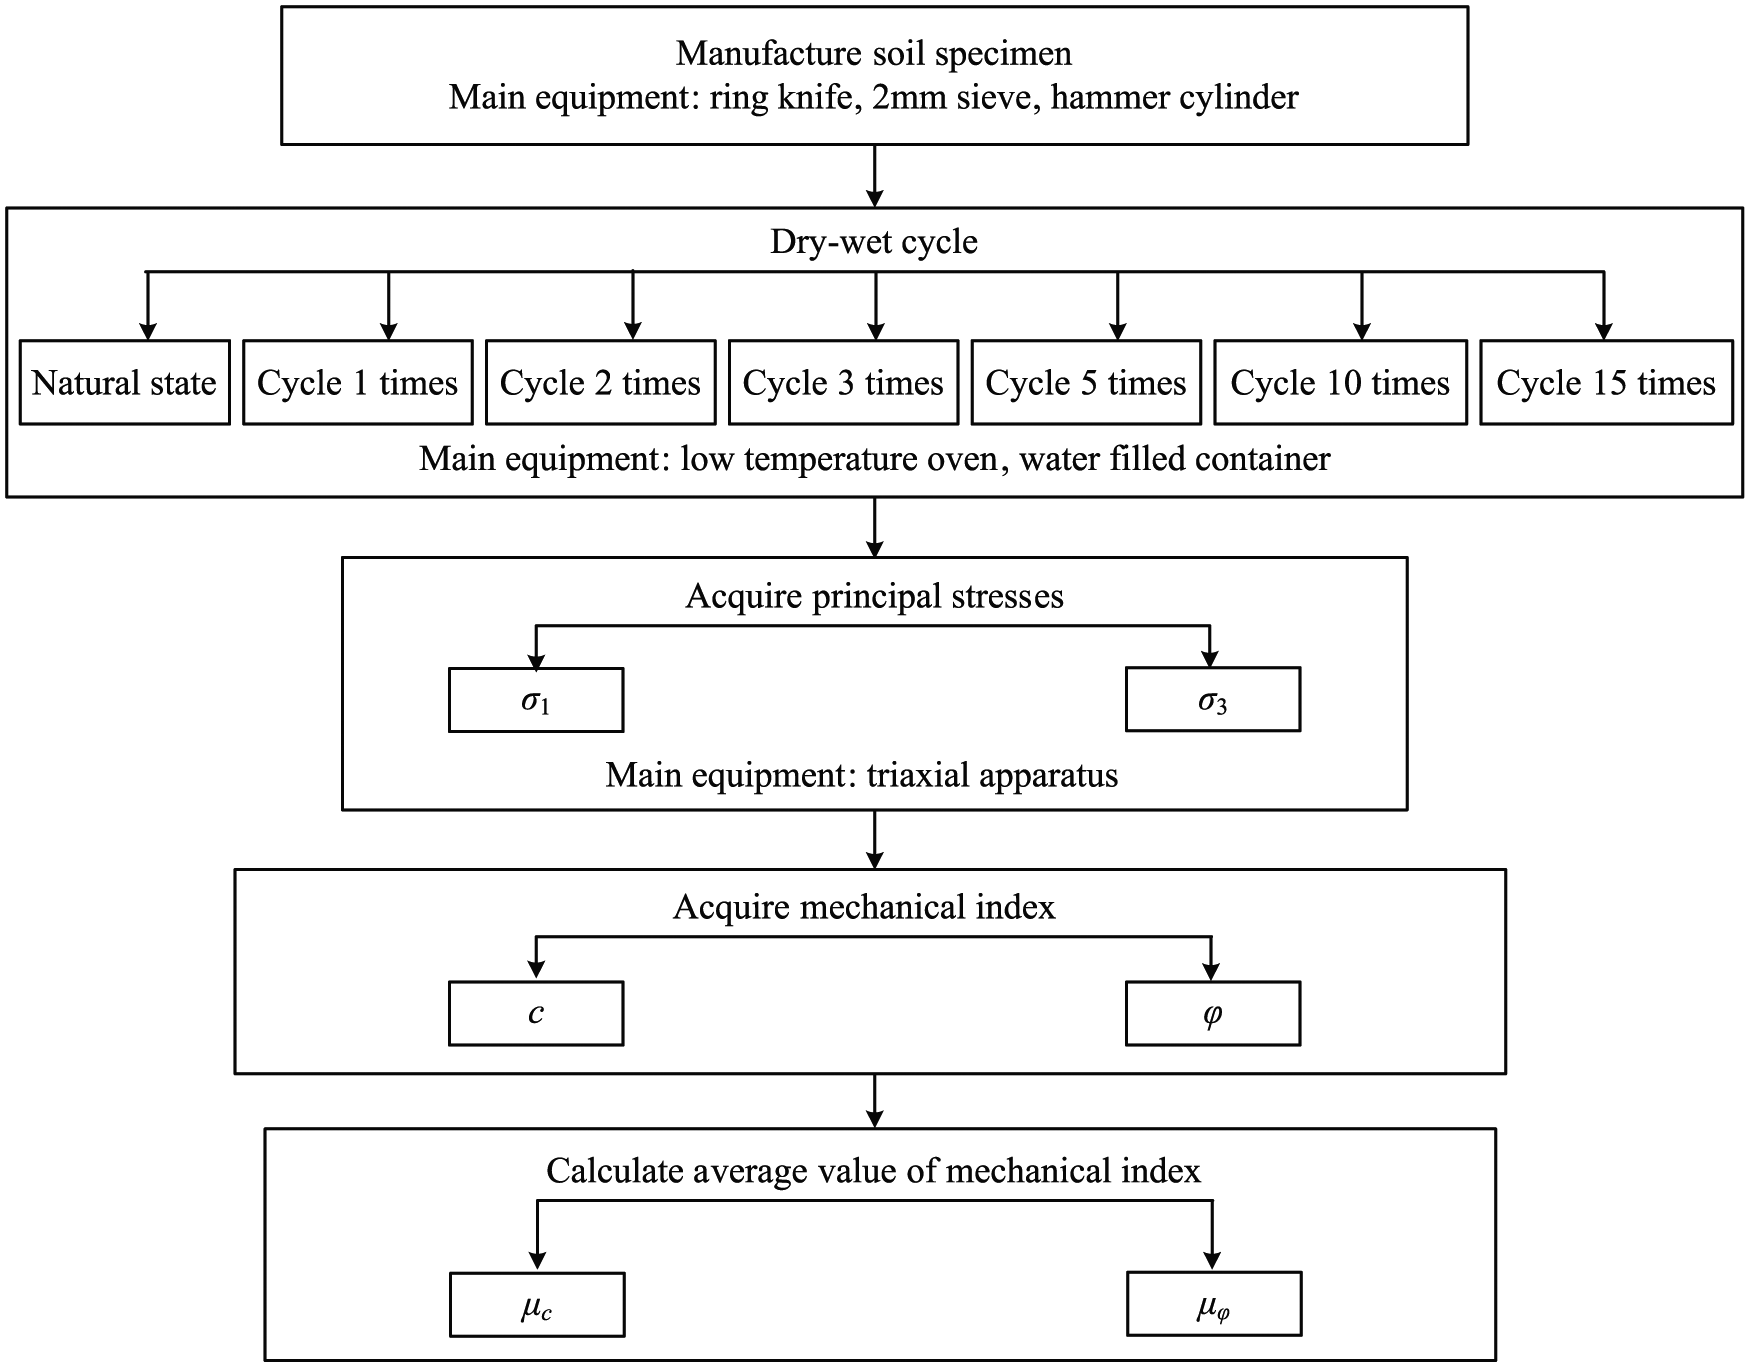
Experimental process of dry–wet cycle in dike soil samples.
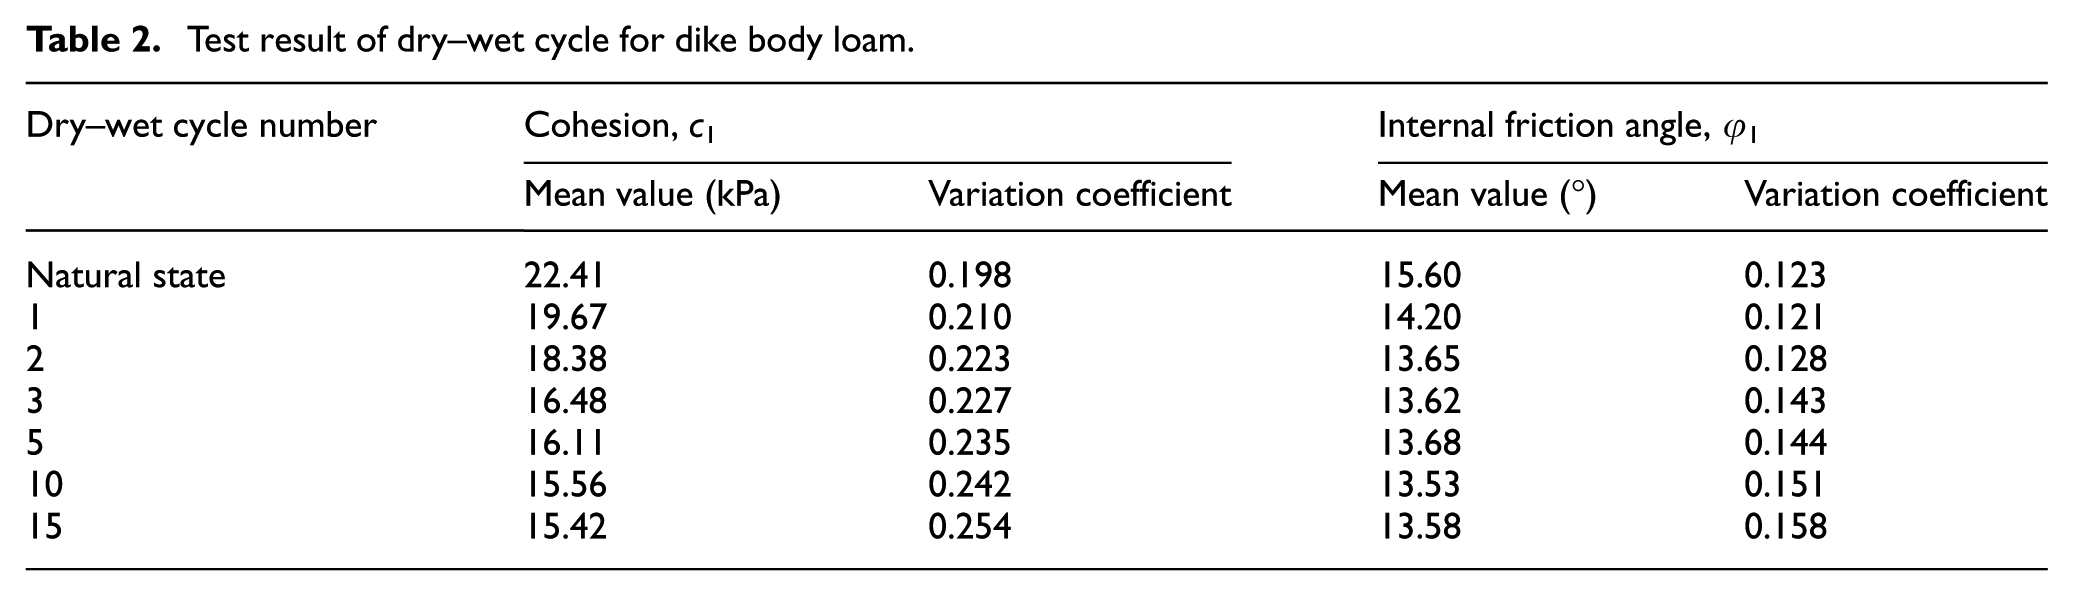
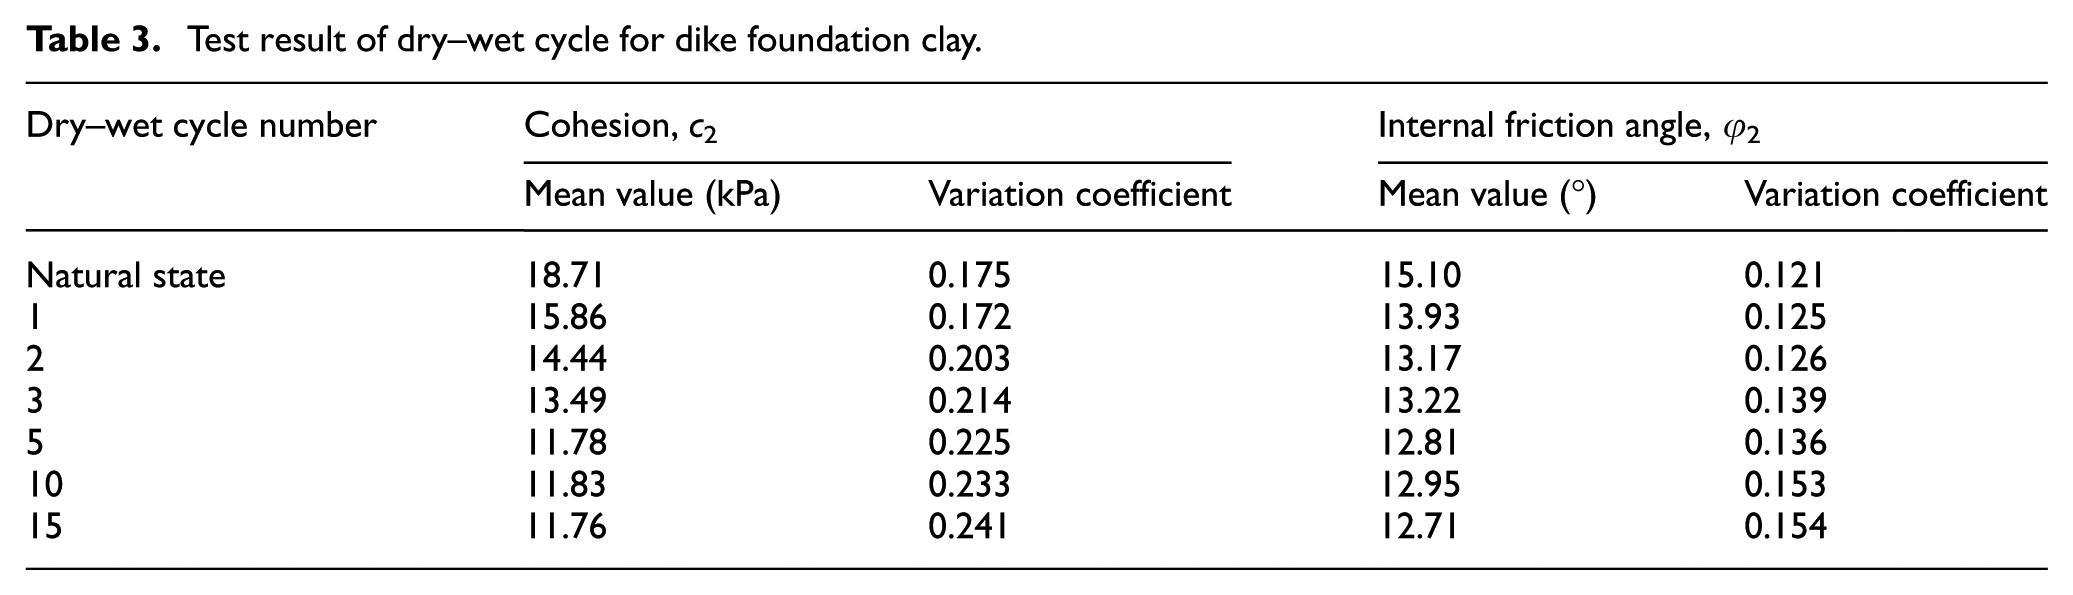
Table 2 lists the test results of cohesion and internal friction angle for dike body loam under dry–wet cycle action. Table 3 lists the test results of cohesion and internal friction angle for dike foundation clay under dry–wet cycle action. The fitting results of cohesion and internal friction angle are shown in Figure 11(a) and (b), respectively.
Test result of dry–wet cycle for dike body loam.
Test result of dry–wet cycle for dike foundation clay.
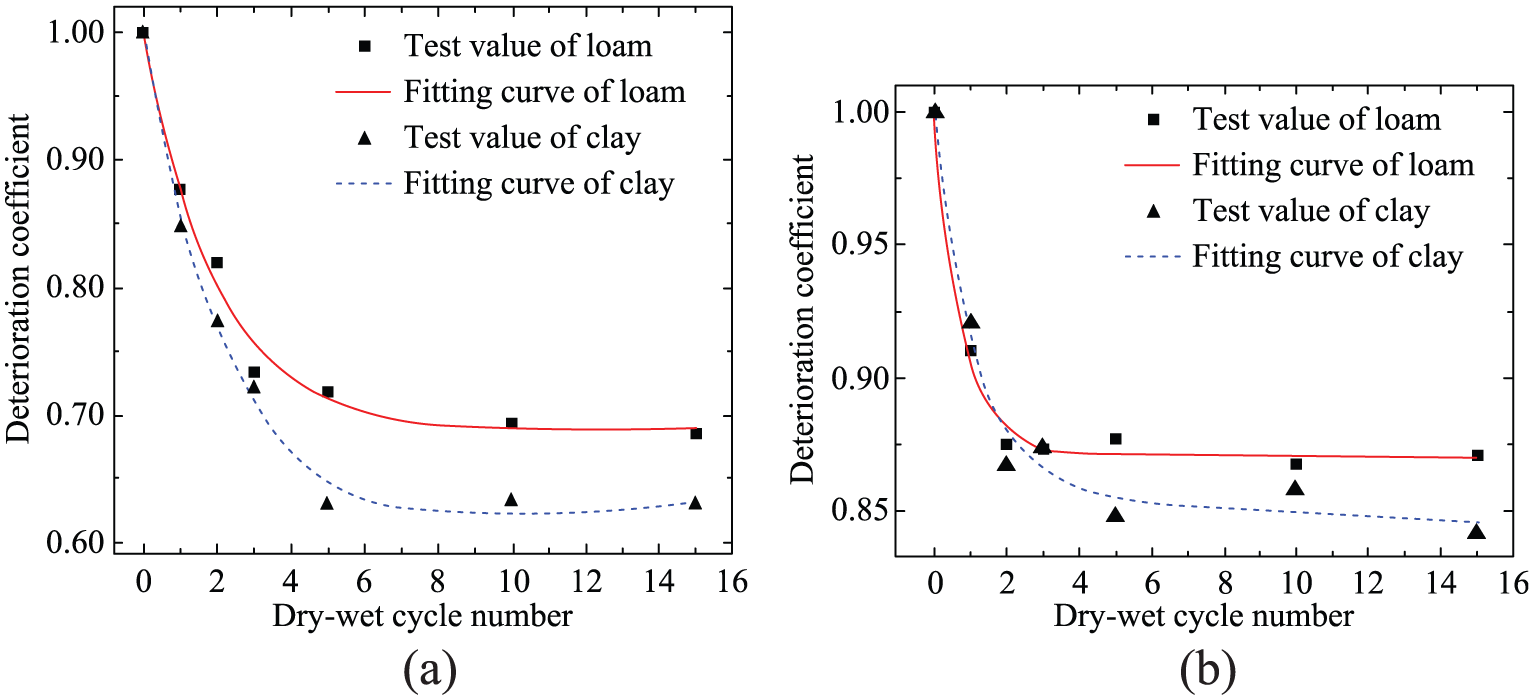
Degradation curves for (a) cohesion and (b) internal friction angle of loam and clay under dry–wet cycle action.
Dynamic evaluation of seepage failure
Seepage failure evaluation and threshold determination of dangerous water level
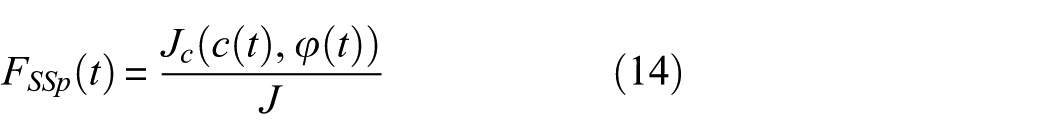
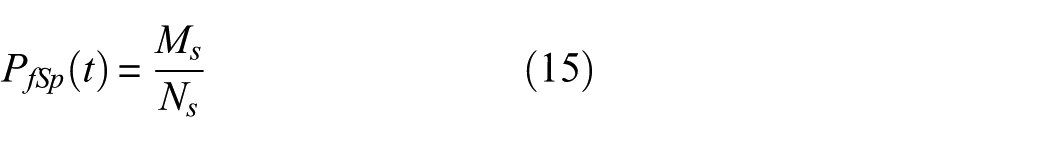
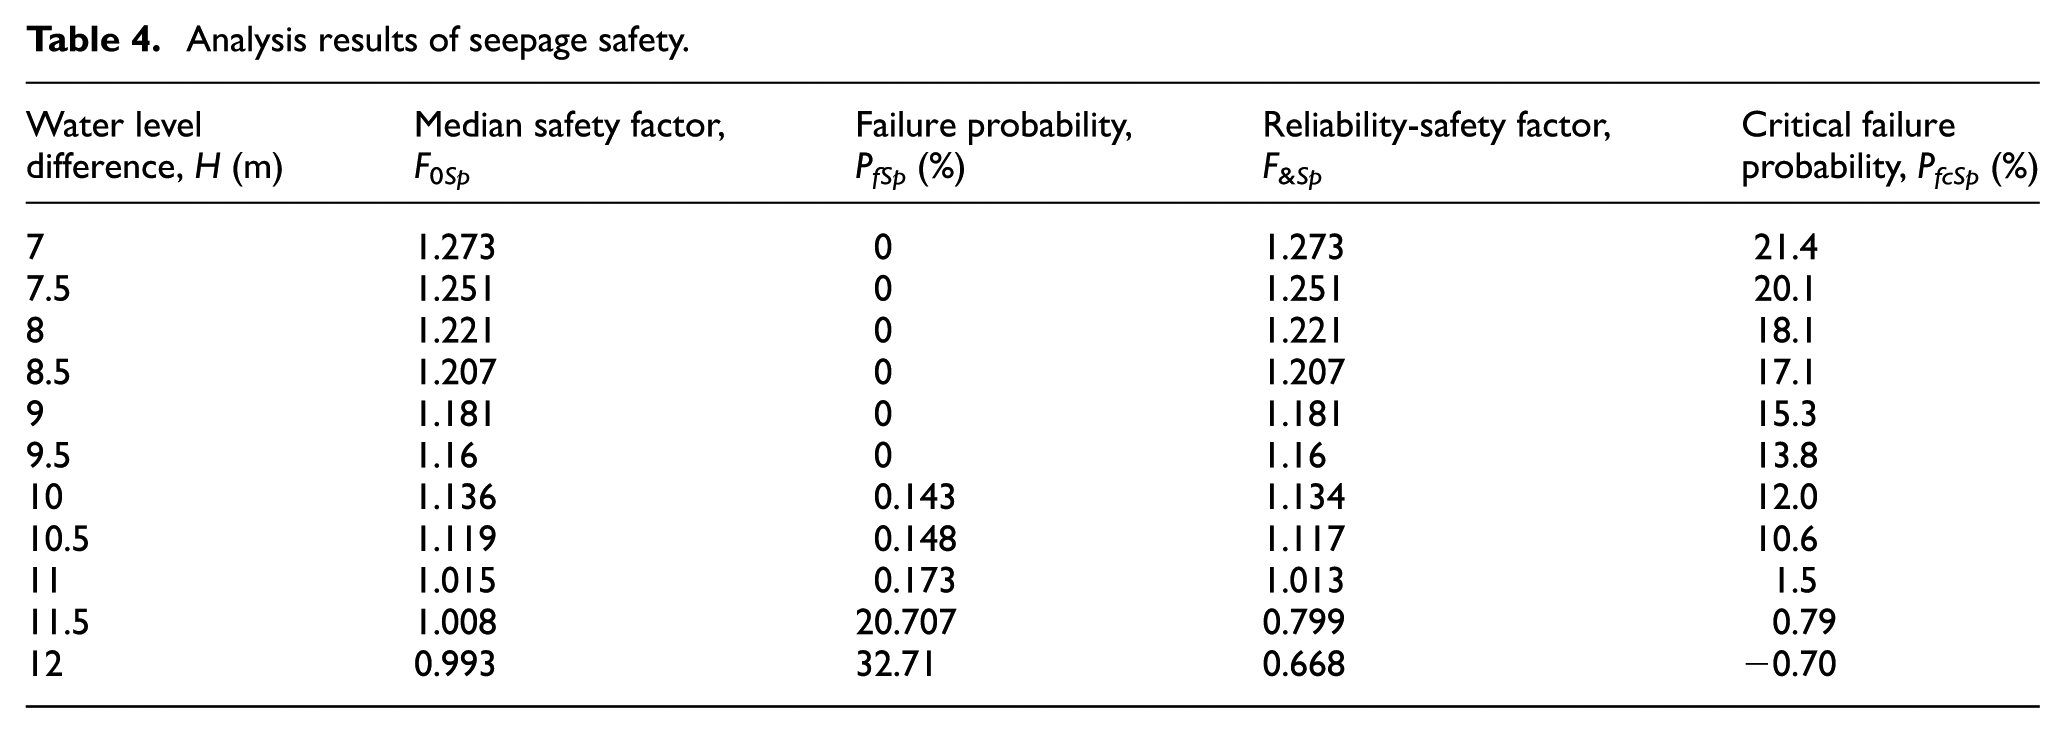
According to the process shown in Figure 4, the mean values and variation coefficients of soil parameters listed in Table 2 are taken to implement the safety evaluation of dike seepage under different water level differences. The median safety factor, F0Sp, of dike seepage is determined by equation (14). The reliability-safety factor, F&Sp, of dike seepage is determined by equation (17). The failure probability, PfSp, of dike seepage is determined by equation (15). The critical failure probability, PfcSp, of dike seepage is determined by equation (18). The calculated results are shown in Table 4 and Figure 12(a) and (b).
Figure 12(a) shows the relation curve between the median safety factor of dike seepage and the water level difference. It can be seen from Table 4 and Figure 12(a) that the median safety factor is decreased obviously with the increasing water level difference. It is indicated that the greater the water level difference, the weaker the safety of dike seepage. If the safety factor equal to 1 is regarded as the critical point of seepage failure, the seepage failure will occur when the water level H is 12 m.
The relation curve between the reliability-safety factor of dike seepage and the water level difference is shown in Figure 12(a). It can be seen from Figure 12(a) that the seepage failure will occur when the water level H is 11.5 m.
Figure 12(b) shows the curves on the calculated failure probability of dike seepage and the critical failure probability. The following can be known from Figure 12(b). It is difficult to determine the time of seepage failure only by the calculated failure probability of dike seepage. After the dual criterion is introduced, it may be considered that the dike has undergone seepage failure when the calculated failure probability is greater than the critical failure probability. At this time, the corresponding water level difference is 11.5 m.
Analysis results of seepage safety.
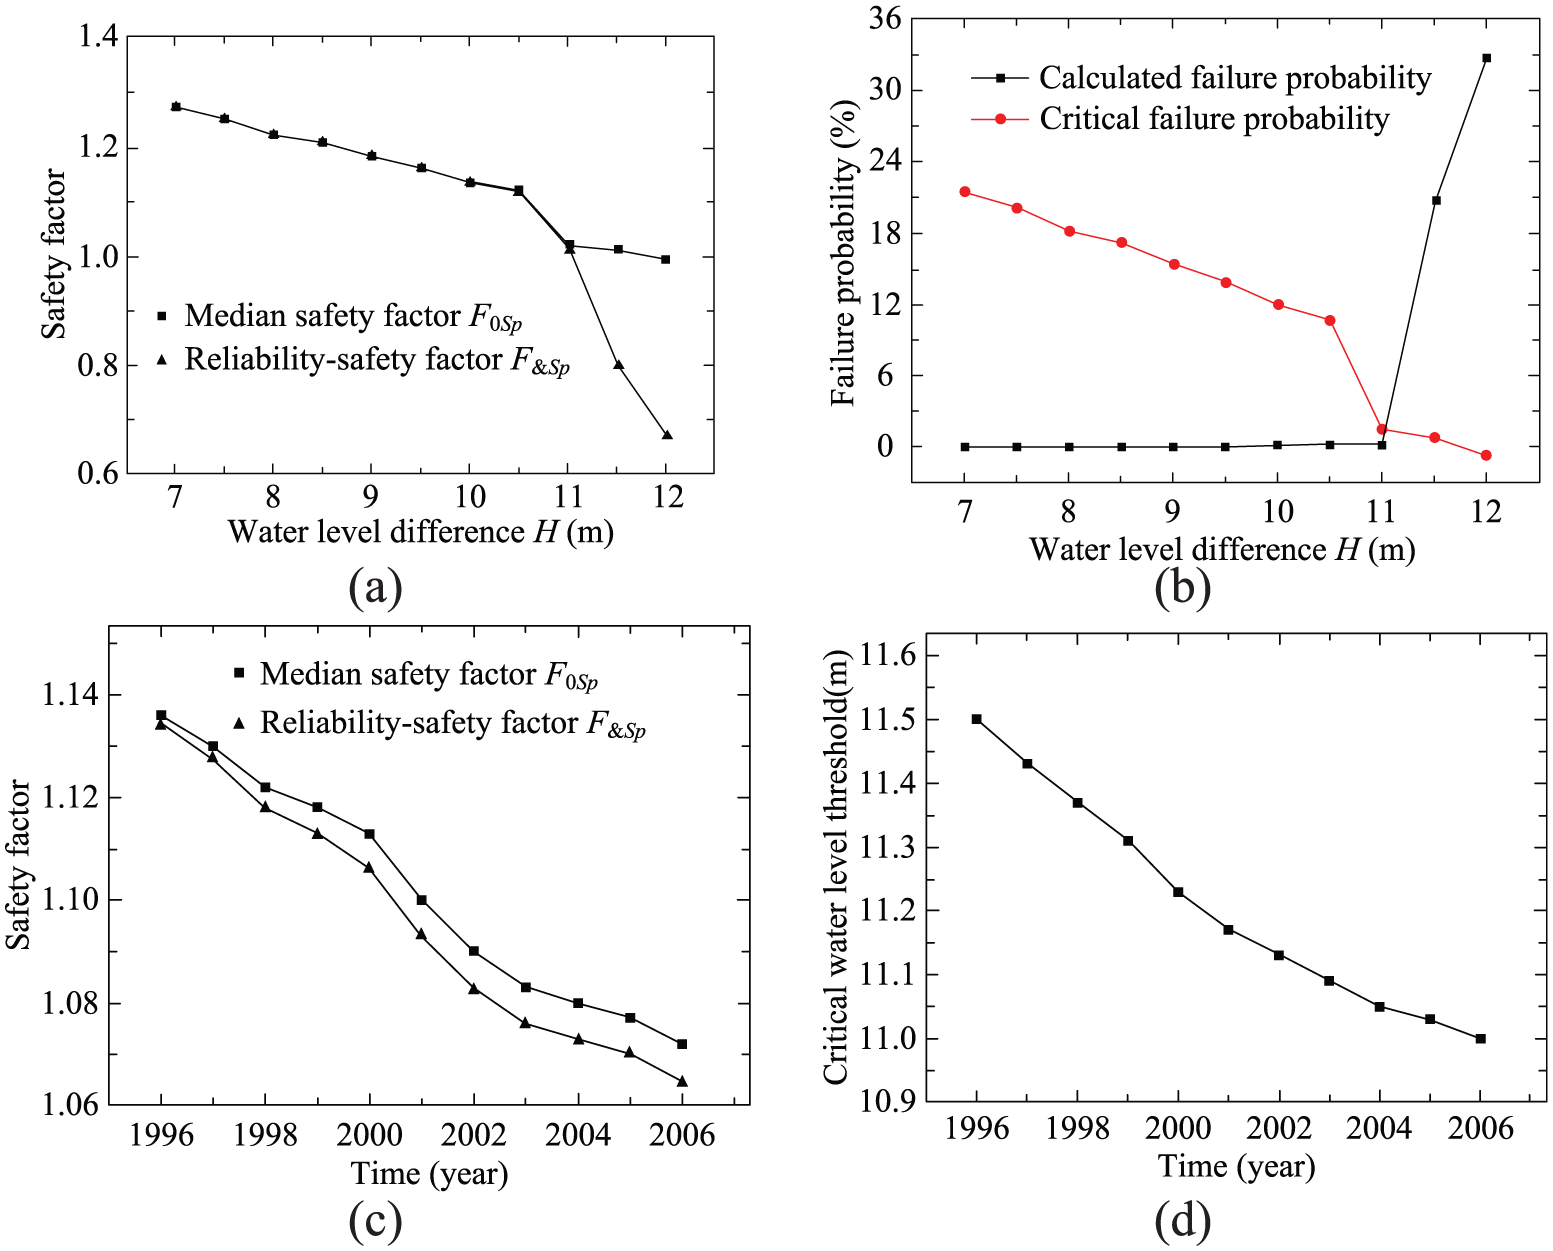
Calculated results for dike seepage: (a) safety factor vs water level difference curve, (b) failure probability vs water level difference curve, (c) safety factor vs time, and (d) dangerous water level threshold vs time.
It can be seen from the above comparison that the median safety factor of dike seepage is larger, so the median safety factor–based determined water level difference threshold is larger. The dual criterion combining the reliability with the median safety factor can describe more objectively the random seepage characteristics of dike soil. Therefore, the dual criterion-based result can be considered more reliable.
Time-varying seepage failure evaluation and dynamic determination of dangerous water level threshold
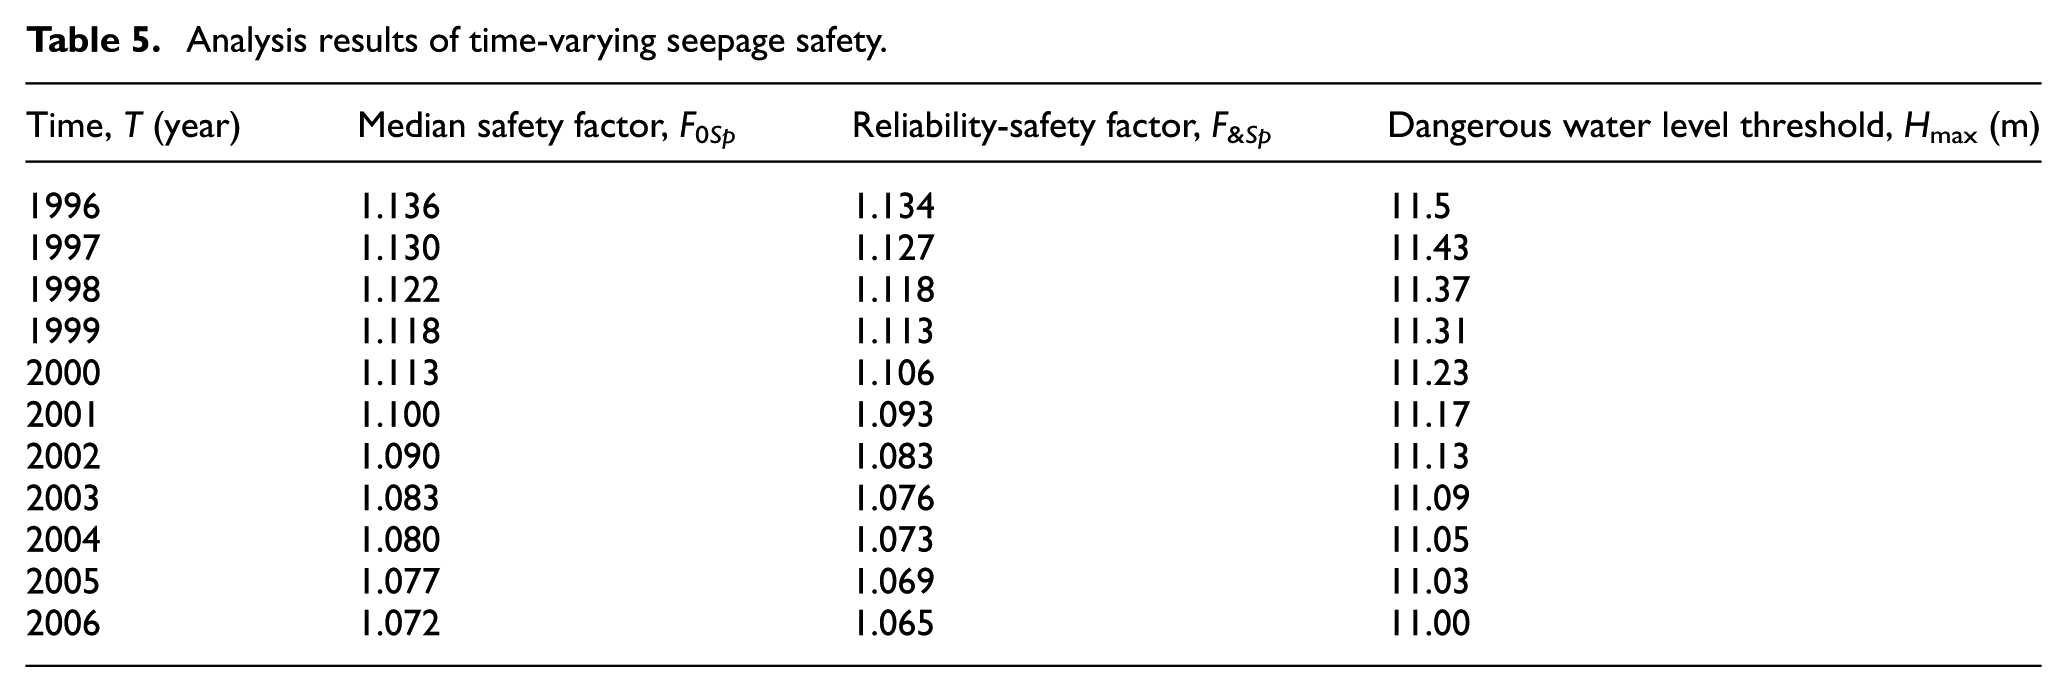
The time-varying characteristics of the mechanical parameters of clay overburden layer are described by the evolution model as in equation (8). The fitting degradation curves of clay cohesion and internal friction angle are shown in Figure 11(a) and (b), respectively. The warning water head of 10 m is taken as an example. Table 5 lists the analysis results of time-varying seepage safety. Figure 12(c) and (d) show the annual variation curves of the median safety factor of dike seepage, the reliability-safety factor of dike seepage, and the threshold of dangerous water level. The following can be seen from Table 5 and Figure 12(c) and (d):
Under the action of one water level difference, the median safety factor of dike seepage is decreased year by year. It indicates that the safety of dike seepage becomes worse.
The reliability-safety factor considering the failure risk of dike seepage is smaller than the median safety factor of dike seepage. The dual criterion-based determined threshold of dangerous water level is decreased year by year. The threshold of dangerous water level is decreased by about 0.5 m in 11 years. It indicates that the capability carrying external load is weakened in the service process of dike engineering. The failure risk of dike engineering increases dynamically. So, the time-varying effect should be considered in evaluating the safety of dike seepage.
Analysis results of time-varying seepage safety.
Dynamic evaluation of instability failure
Instability failure evaluation and threshold determination of dangerous water level
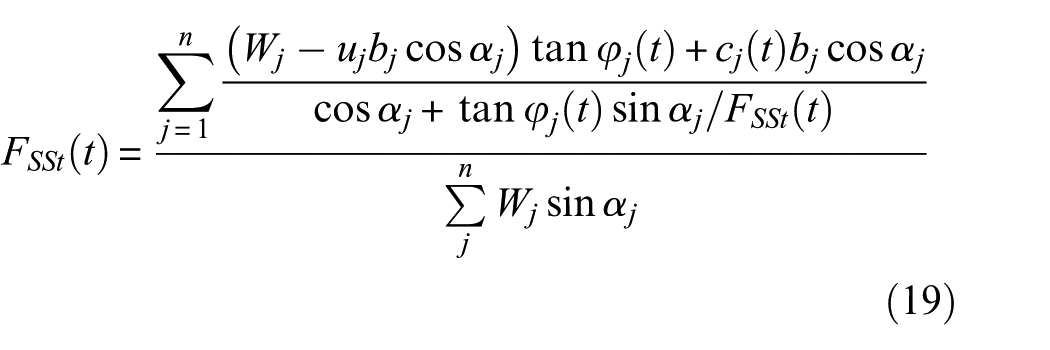
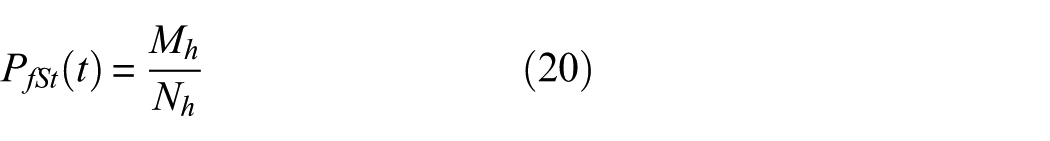
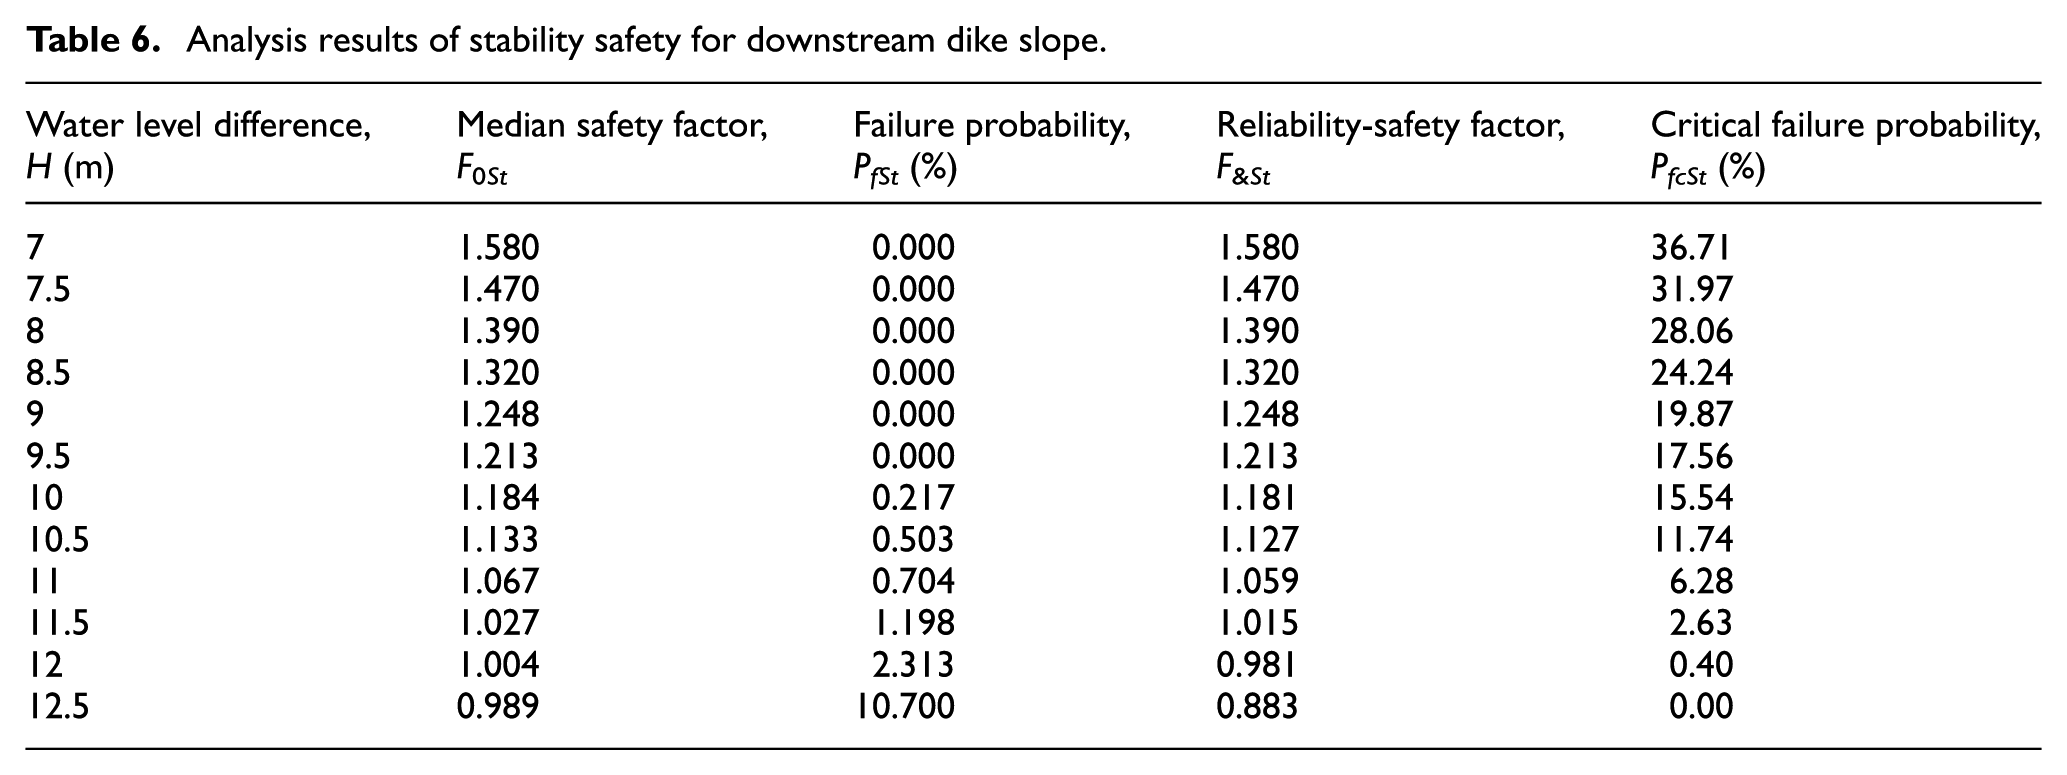
The dike section selected in the above seepage analysis is taken to implement the stability evaluation of its slope. The material parameters are listed in Table 1. According to the process shown in Figure 6, the stability of dike slope under different water level differences is evaluated. The median safety factor F0St of dike slope stability is determined by equation (19). The reliability-safety factor F&St of dike slope stability is determined by equation (22). The failure probability PfSt of dike slope stability is determined by equation (20). The critical failure probability PfcSt of dike slope stability is determined by equation (23). The calculated results are shown in Table 6 and Figure 13(a) and (b).
Figure 13(a) shows the relation curve between the median safety factor of dike slope stability and the water level difference. It can be seen from Figure 13(a) that the dike slope stability gradually decreases with increasing water level difference. If the median safety factor equal to 1 is regarded as the critical point of instability failure for dike slope, the instability failure will occur when the water level H is 12.5 m.
The relation curve between the reliability-safety factor of dike slope stability and the water level difference is shown in Figure 13(a). The reliability-safety factor equal to 1 is regarded as the critical point of instability failure for dike slope. It can be seen from Figure 13(a) that the instability failure of dike slope will occur when the water level H is 12 m.
Figure 13(b) shows the curves on the calculated failure probability of dike slope instability and the critical failure probability. The following can be known from Figure 13(b). It is difficult to determine the time of instability failure only by the calculated failure probability of dike slope instability. After the dual criterion is introduced, it may be considered that the dike slope has undergone instability failure when the calculated failure probability is greater than the critical failure probability. At this time, the corresponding water level difference is 12 m.
Analysis results of stability safety for downstream dike slope.
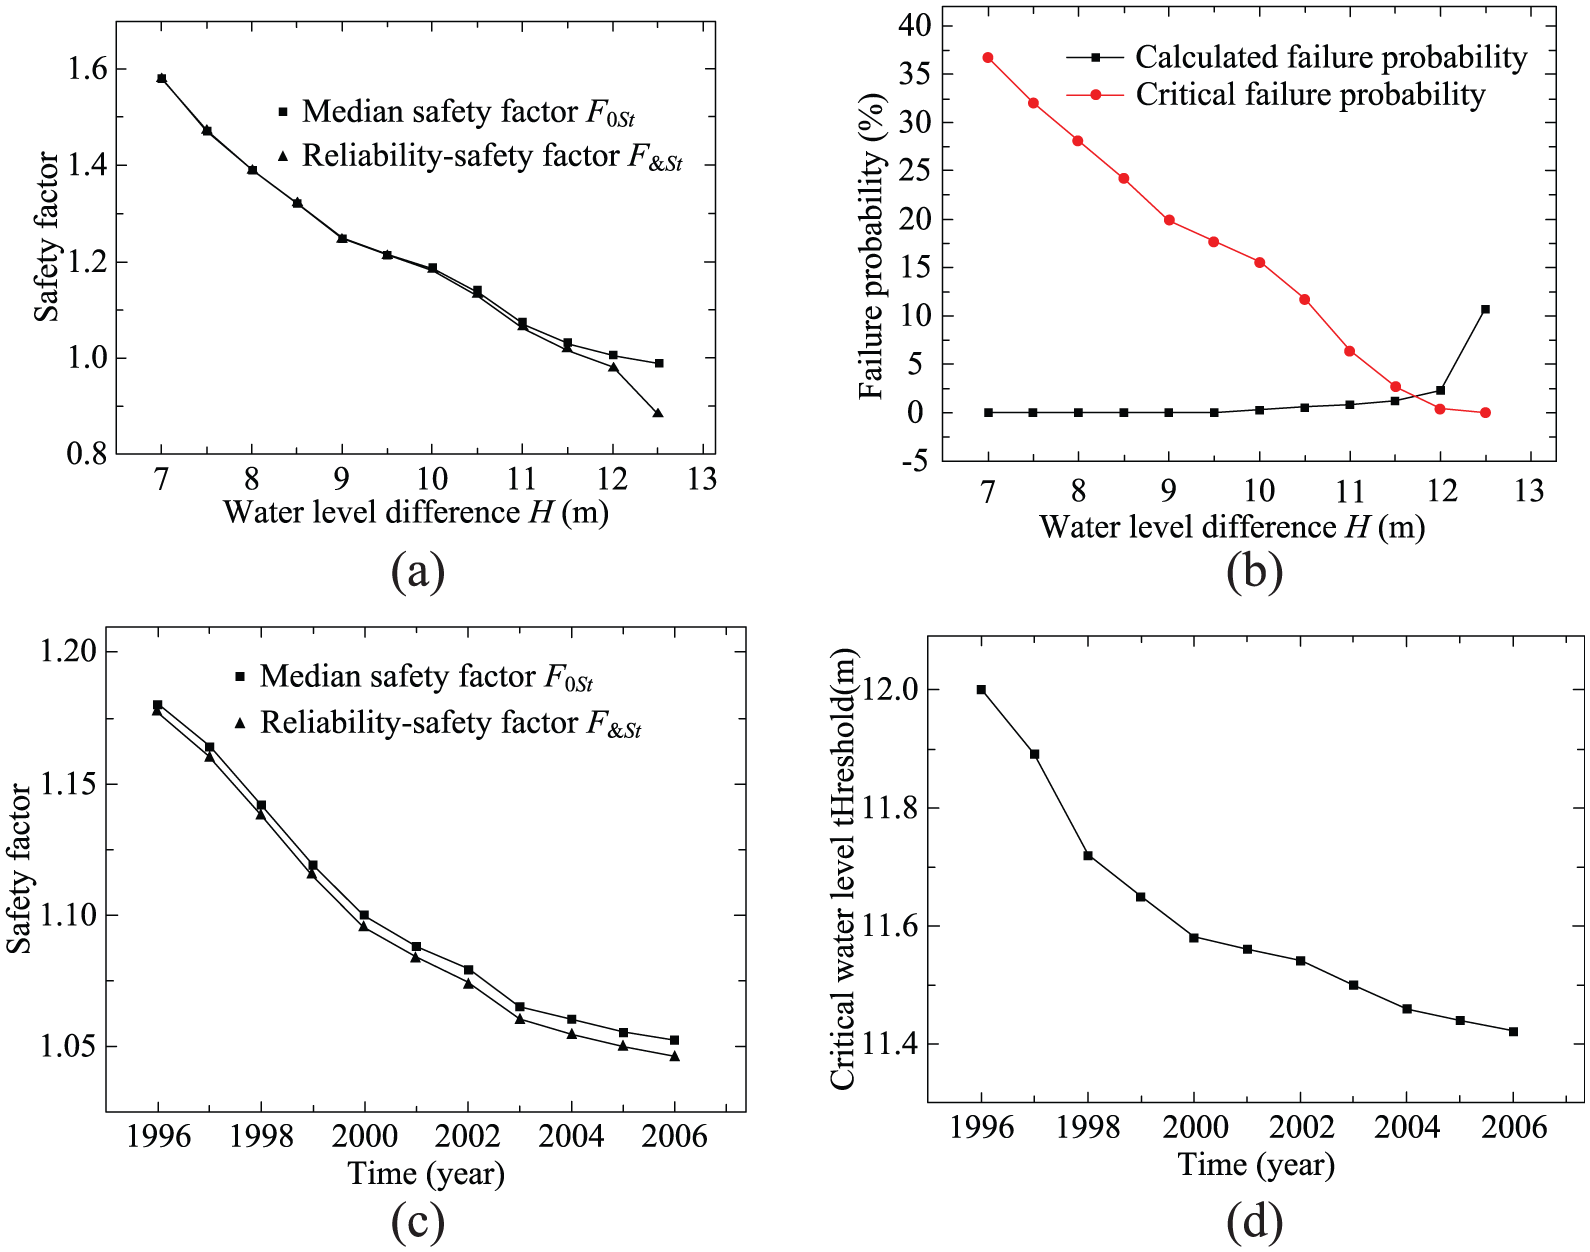
Calculated results for dike slope stability: (a) safety factor vs water level difference curve, (b) failure probability vs water level difference curve, (c) safety factor vs time, and (d) dangerous water level threshold vs time.
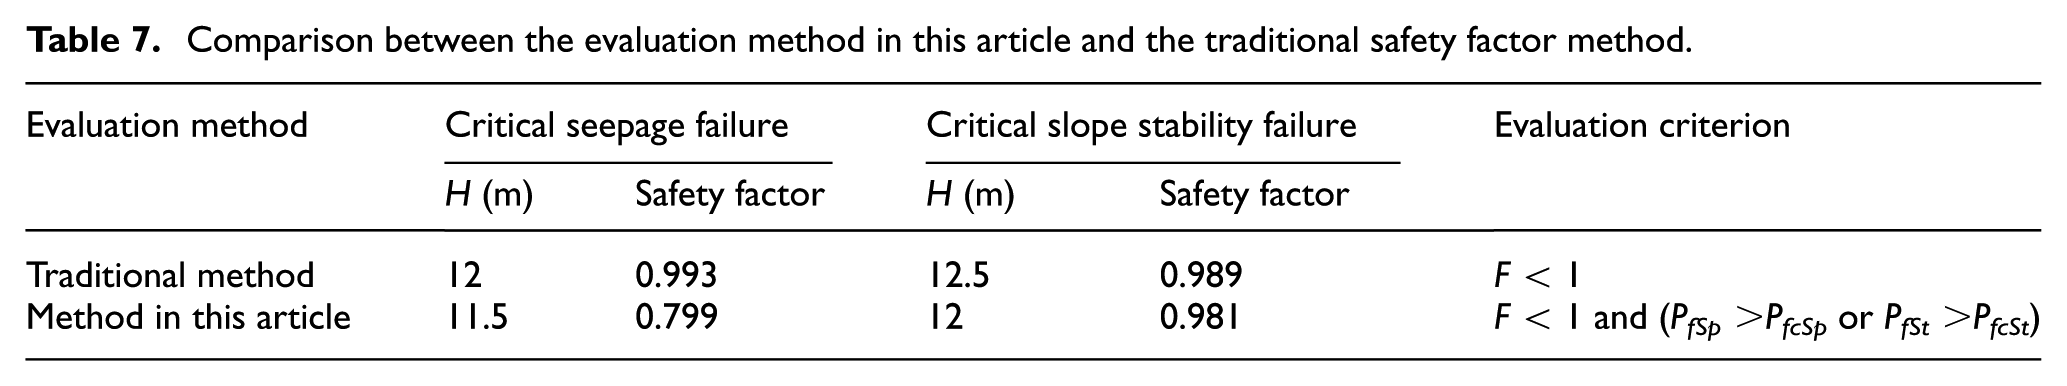
The median safety factor, reliability-safety factor, and failure probability of each water level difference can be obtained from Tables 4 and 6. Since it is impossible to determine when the damage will occur by considering the failure probability alone, Table 7 compares the traditional safety factor method with the evaluation method in this paper. It can be seen that the difference in dangerous threshold between the two methods is small. And the dual criterion combining the uncertain reliability with the certain median safety factor can describe more objectively the stability status of dike slope. Compared to the dangerous threshold under the seepage failure condition, it can be known that the failure of dike seepage occurs earlier than the failure of dike instability. So, the failure of dike seepage should be considered preferentially when the limit service state of dike engineering is determined.
Comparison between the evaluation method in this article and the traditional safety factor method.
Time-varying instability failure evaluation and dynamic determination of dangerous water level threshold
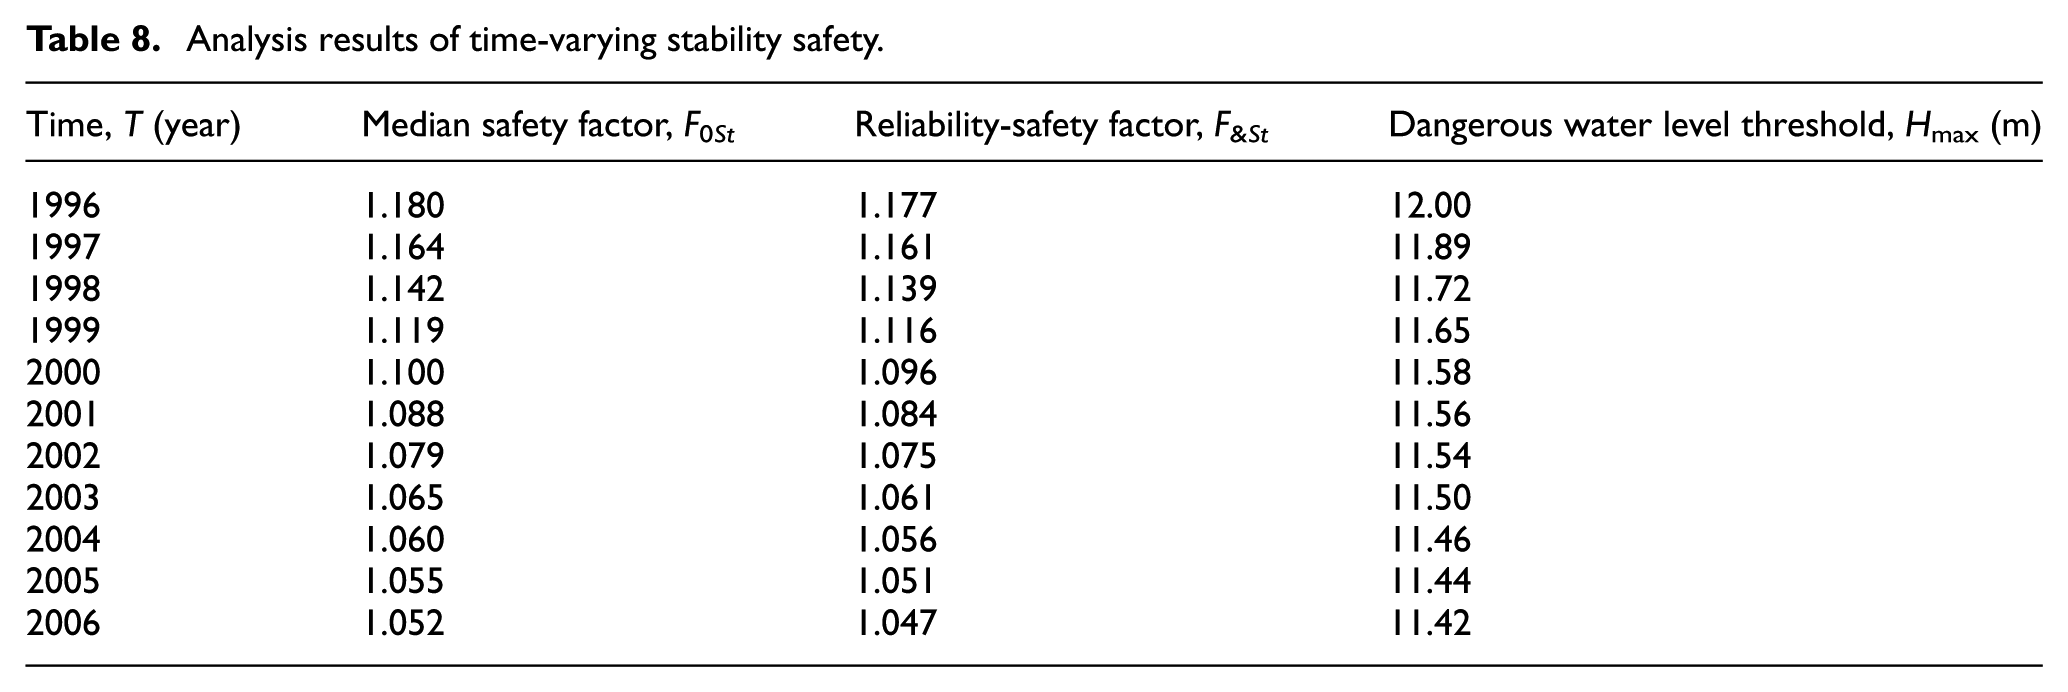
The time-varying characteristics of the mechanical parameters of dam body loam and dam foundation clay are described by the evolution model as in equation (8). The fitting degradation curves of mechanical parameters are shown in Figure 11. The warning water head of 10 m is taken as an example. Table 8 lists the analysis results of time-varying slope stability. Figure 13(c) and (d) shows the annual variation curves of the median safety factor of dike slope stability, the reliability-safety factor of dike slope stability, and the threshold of critical dangerous water level of dike slope instability. Figure 14 shows the most dangerous sliding surfaces in different years under the water head of 10 m. The following can be seen from Table 8, Figure 13(c) and (d), and Figure 14:
Under the action of one water level difference, the median safety factor and the reliability-safety factor of dike slope stability are decreased year by year. It indicates that the stability of dike slope becomes worse.
The reliability-safety factor considering the stability failure risk of dike slope is smaller than the median safety factor of dike slope stability. The dual criterion-based determined threshold of dangerous water level, which can ensure the dike slope stability, is decreased year by year. The threshold of dangerous water level is decreased by about 0.6 m in 11 years.
The degradation laws of the overall structural characteristics of dike slope and the material parameters of dike soil correspond one by one. The structural safety declines rapidly in the early stage and tends to be stable in the middle and later stages. However, the overall trend is unsafe.
Due to the degradation effect of soil mechanical parameters, the most dangerous sliding surface of dike slope changes. It moves gradually to the shallow downstream side. It changes quickly in the early stage and tends to be stable in the later stage.
Analysis results of time-varying stability safety.
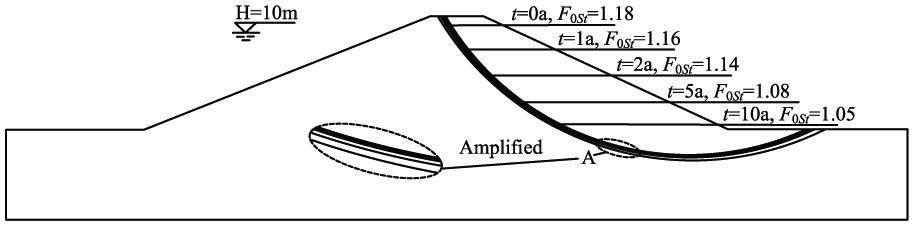
Time-varying dangerous sliding surfaces under 10 m water level difference.
Conclusion
The certain index (safety factor) is combined with the uncertain index (reliability) to build a dual criterion-based evaluation model for service safety of dike engineering. Considering the time-varying characteristics of material parameters, the safety status of dike engineering and the corresponding dangerous water level threshold are determined dynamically. It is convenient for the dike management. The following conclusions can be drawn:
By the comparative analysis for different index-based evaluation results on seepage and stability safety of dike engineering, it is demonstrated that the median safety factor is relatively high. The median safety factor can be regarded as a reference index. And it is difficult to determine the time of seepage failure only by the calculated failure probability of dike seepage. So, the reliability-safety factor and the corresponding dual criterion integrate the characteristics of traditional safety factor and reliability index. The statistical features of dike material parameters can be reflected comprehensively. Therefore, the dual criterion-based evaluation result is more reliable. The reasonable threshold of dangerous water level can not only guarantee the safety of the actual project but also save the cost.
The dual criterion-based dynamic evaluation approach proposed in this article considers only the distribution characteristics and time-varying law of cohesion and internal friction angle. An ideal assumption, that a dry–wet cycle is fulfilled in a year, is given. There is a certain difference with the actual situation. It needs to be improved in future research for service safety evaluation of dike engineering.
Footnotes
Declaration of conflicting interests
The author(s) declared no potential conflicts of interest with respect to the research, authorship, and/or publication of this article.
Funding
The author(s) disclosed receipt of the following financial support for the research, authorship, and/or publication of this article: This research has been partially supported by the National Natural Science Foundation of China (SN: 51739003, 51579083, 51479054, and 41323001), the National Key Research and Development Program of China (SN: 2018YFC0407101, 2016YFC0401601, and 2017YFC0804607), Key R&D Program of Guangxi (SN: AB17195074), Open Foundation of State Key Laboratory of Hydrology-Water Resources and Hydraulic Engineering (SN: 20165042112 and 20145027612), and the Fundamental Research Funds for the Central Universities (SN: 2015B25414).