
Abstract
Acoustic emission caused by structural damage encompasses important information about structural integrity. In particular, acoustic emission can detect phenomena that are difficult to determine, such as microcracks and internal cracks. However, conventional acoustic emission has shown limitations in complex structure applications for years. In this article, we propose a Q-switched laser scan–based structural training technique to achieve accurate acoustic emission localization and visualize accumulated damage in complex structures with a single PZT sensor (acoustic emission sensor). The proposed method compensates for the difference in characteristics between the actual acoustic emission wave and the laser-induced elastic wave using laser-based structural training algorithm. Acoustic emission localization in complex structures is accomplished by cross-correlation in the time domain. Pencil-lead break method is used as the source for acoustic emission to simulate the real damage-induced acoustic emission event. The proposed laser-based structural training algorithm with a laser scanning interval of 2 mm achieved an average localization error of 1.84 mm in two Al-alloy layers with fastener structure. Finally, the accumulated damages were visualized by appending the damage index of the acoustic emission waves at accurately localized points.
Keywords
Introduction
Acoustic emission (AE) is a transient elastic wave generated by sudden stress redistribution in structures. 1 AEs are generated by crack growth, crack opening, crack closure, dislocation movement, phase transformation, and so on, in monolithic materials and by fiber breakage, delamination, and fiber–matrix debonding in composites. 2 Generated AEs are mostly related to structural damage. 3 In aircrafts, cracks typically occur due to wing bending during takeoff and landing of the aircraft or due to internal and external pressure changes in the fuselage. Generally, under a repeated load environment, probability of cracking increases at the bolt and rivet connection due to stress concentration. Furthermore, in the cases that are difficult to be visually recognized, such as microcracks and internal cracks in structures, it is difficult to accurately detect the defect positions. Meanwhile, structural health monitoring (SHM) is necessary to maintain a stable state during the service period. 4
For this reason, many researchers are interested in source localization using AE techniques, and various studies have been conducted. Among the various localization methods, the most widely accepted method is the “Triangulation technique.” 5 In this technique, the distance from the source to each transducer is obtained using time of arrival. The source location is determined by intersection point of the three circles which is centered at each transducer with calculated distance as radius. So, this method needs prior knowledge about constant wave speed on all the structures. And another method is the “Beamforming technique.”6,7 The principal of beamforming technique is based on the delay-and-sum algorithm which uses four to eight sensor arrays. It assumes constant wave speed in all directions. Because of the assumptions of these methods, it could be applied only on isotropic and homogeneous structure. The cross-correlation technique for source localization is also proposed. Chen et al. 8 and Liu et al. proposed source localization by estimating time-arrival difference using cross-correlation. These techniques used multi-channel sensing system to obtain the parameters of each signal. AE localization technique was developed using single sensor. Ebrahimkhanlou and Salamone9,10 proposed two-source localization technique using single sensor: (1) probabilistic approach by estimating the distance between AE source and sensor and (2) deep learning approach using reflection and reverberation patterns of AE waveforms.
Due to the limitations on anisotropic structure, various studies have been conducted to successfully locate the source in an anisotropic structure. Optimization-based technique for source localization in anisotropic plates which is based on minimizing the error function was proposed by Kundu and colleagues.11,12 However, difficulties remain in the composite structure if there are holes in the propagation path of the wave, or obstructions that affect the wave propagation path, such as damage. Paget et al. 13 and Seydel and Chang 14 proposed impact localization algorithms using elliptical group-velocity pattern. However, these methods require prior knowledge of group velocities, and they still have a limitation of being applied to complex composite structure.
Recently, an impact localization method using time reversal with scanning sensing method was used to acquire the entire information of the interested area to be localized in a complex structure. Park et al. 15 proposed the laser-based impact localization using time reversal method. This article acquired the impact response function (IFR) of trained data from scanning laser Doppler vibrometer (SLDV) and localized using the similarity with IFR of actual impact signal. However, this technique had a disadvantage of being used only in a surface-treated (special surface treatment, attaching retroreflective tape) structure.
In this article, we propose a laser scan–based structural training technique where a Q-switched laser scanning system (guided-wave ultrasonic propagation imaging (G-UPI); X-NDT, Inc.) was used to induce elastic wave in the structure and a single PZT sensor (M204A; Fuji Ceramics Corp.) was used to acquire the elastic wave. The laser elastic wave includes most of the geometric information of the structure, and it was trained to simulate the AE which is named “laser-simulated AE.” For the specimen for proof-of-concept, two Al-alloy layers with fastener structure were fabricated and the pencil-lead break (PLB) method which is a standard method to mimic structural failure-induced AE was used to simulate the real damage-induced AE. When a PLB event occurs, the fracture and slippage of the graphene layers in graphite induce an AE in the structure. In PLB tests, a guide ring is generally used to maintain a constant angle between the structure and the lead length of the pencil to improve repeatability. These AEs are localized through cross-correlation with laser-simulated AE and show slight error with the actual position of PLB.
The source localization technique proposed in this article has the following advantages: (1) It is possible to confirm the position of AE occurrence using only one sensor. (2) It is possible to detect the position of AE occurrence regardless of the complexity of the structure, since the laser elastic waves encompass the geometrical characteristics of the structure. (3) In case of wave speed, it changes according to the material property of the structure. However, in this system, AE is simulated through the laser-based structural training process. So, regardless of the material, localization is possible. (4) Source localization is possible irrespective of the surface state of the structure because the Q-switched laser is irradiated on the structure and the momentary heat induced an elastic wave in the structure.
Experiments
The PLB-induced AE wave is induced around a bolt joint of two layers and simple plate of the structure. The AE wave is collected by an amplifier-integrated PZT sensor attached to an arbitrary point on the rear side of the structure by considering an SHM sensor integrated on the inner surface of the aerospace skin structure. To train the structure with the PZT sensor, 12 ns-pulsed beams of 0.70 mJ energy and 532 nm wavelength generate elastic waves using the raster scan function in the G-UPI system over the monitored area and the induced elastic waves are collected through the same PZT sensor attached to the inner surface of the structure. The acquired elastic waves are thermal expansion elastic waves that are different from the real AE waves, although they are commonly guided by stress waves in a solid medium in nature. The difference in the characteristics of these two waves becomes more apparent as the complexity of the structure increases. In this article, we compensate for the difference in the characteristics of these two signals in a complex structure using the laser-based structural training algorithm in the frequency domain to simulate the AE wave using a laser-induced elastic wave. The source localization is performed by extracting the location with the highest coefficient of cross-correlations between the actual AE wave and the laser-simulated AE, which means that positions have the highest waveform similarity. In addition, repeated damage accumulation is visualized by appending the damage index (DI) of the AE waves at the position localized.
AE source and measurement
PLB-based AE generation (Hsu-Nielsen source)
Figure 1 shows a pencil for the Hsu-Nielsen source which is a representative method for producing AE events. 16 Pencil leads with constant diameter are used to induce AE waves and the guide ring is attached to the front of the pencil to maintain a constant pencil lead length and angle between the pencil lead and the structure. The guide ring was manufactured using a three-dimensional (3D) printer and applied to a 0.7-mm-diameter pencil. Details of the PLB-induced AE waves are shown in Figure 2.
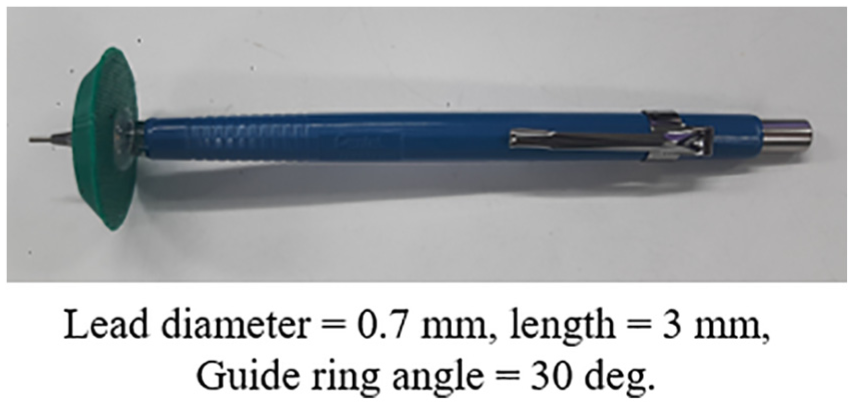
Manufactured pencil with a 30° angle guide ring for Hsu-Nielsen source.
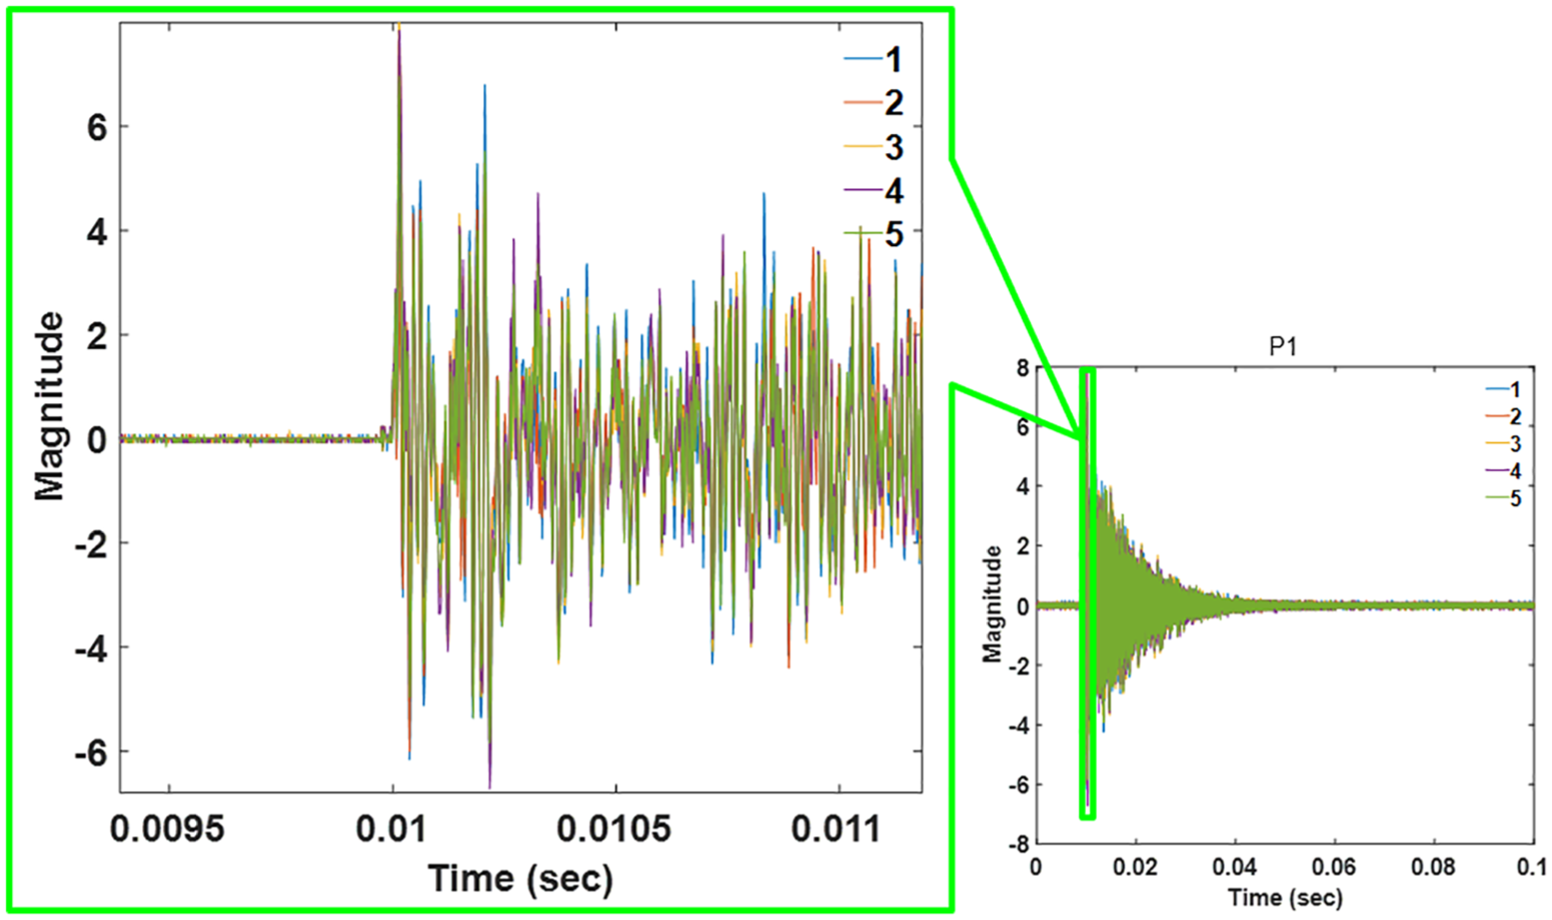
Repeatability of five PLB-induced AE waves at identical locations.
Figure 2 shows the five acquired PLB-induced AE waves at identical points on the specimen using a pencil with a guide ring. As shown in the left side of Figure 2, because of the high repeatability, the location error can be considered a pure error in the proposed laser-based structural training method.
Measurement of a PLB-induced AE wave
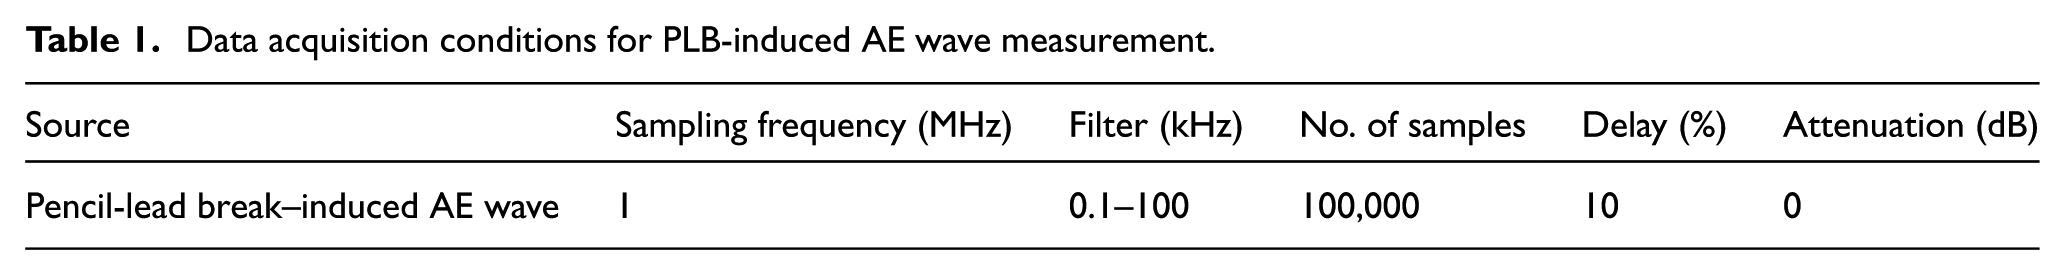
Figure 3(a) shows the fuselage surface of an actual aircraft. Most metallic aerospace skin structures are joined with rivets, and many internal joints are connected by various fasteners. This structural configuration increases the probability of cracking due to stress concentration around the joint when loads are applied. Figure 3(b) and (c) shows the specimen used, which has configurations often found in general structures and aerospace structures. In Figure 3(c), the substructure on the rear surface is Al 6061 and has a width of 250 mm, height of 150 mm, and thickness of 1.5 mm and was bolted to a large panel of the same material that has a width of 1000 mm, height of 500 mm, and thickness of 10 mm. The specimen was fixed on an optical table using large right-angle brackets on both sides of the specimen, as shown in Figure 4(a). After the PZT sensor was attached to the rear surface of the specimen, as shown in Figure 3(c), PLB-induced AE waves were induced near the bolts where cracks are likely to occur and on the simple plate area. The PLB-induced AE wave was collected by a PZT sensor and filtered to the desired frequency band with a programmable band-pass filter. An oscilloscope collected the pre-trigger signal (10%) and stored it on a PC through the graphical user interface (GUI) platform. Detailed signal acquisition conditions are described in Table 1. Figure 4(c) shows the exact PLB points, where each coordinate is based on the lower-left corner of the region of interest.
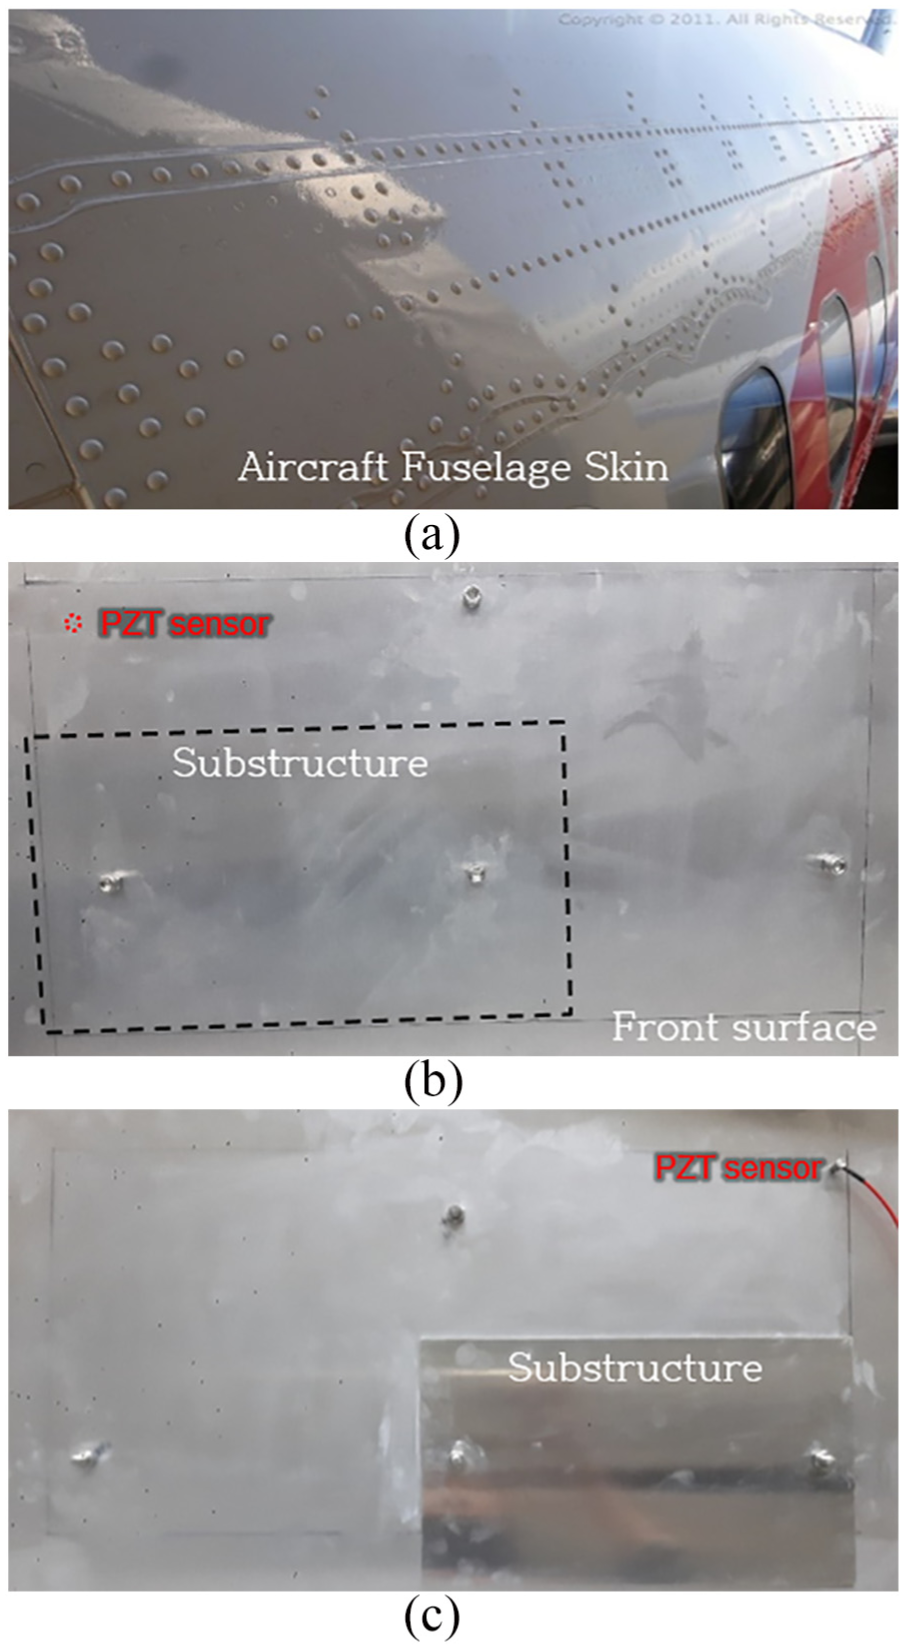
(a) Actual aircraft fuselage skin, (b) front side of the specimen, and (c) rear part of the specimen with substructure and PZT sensor.
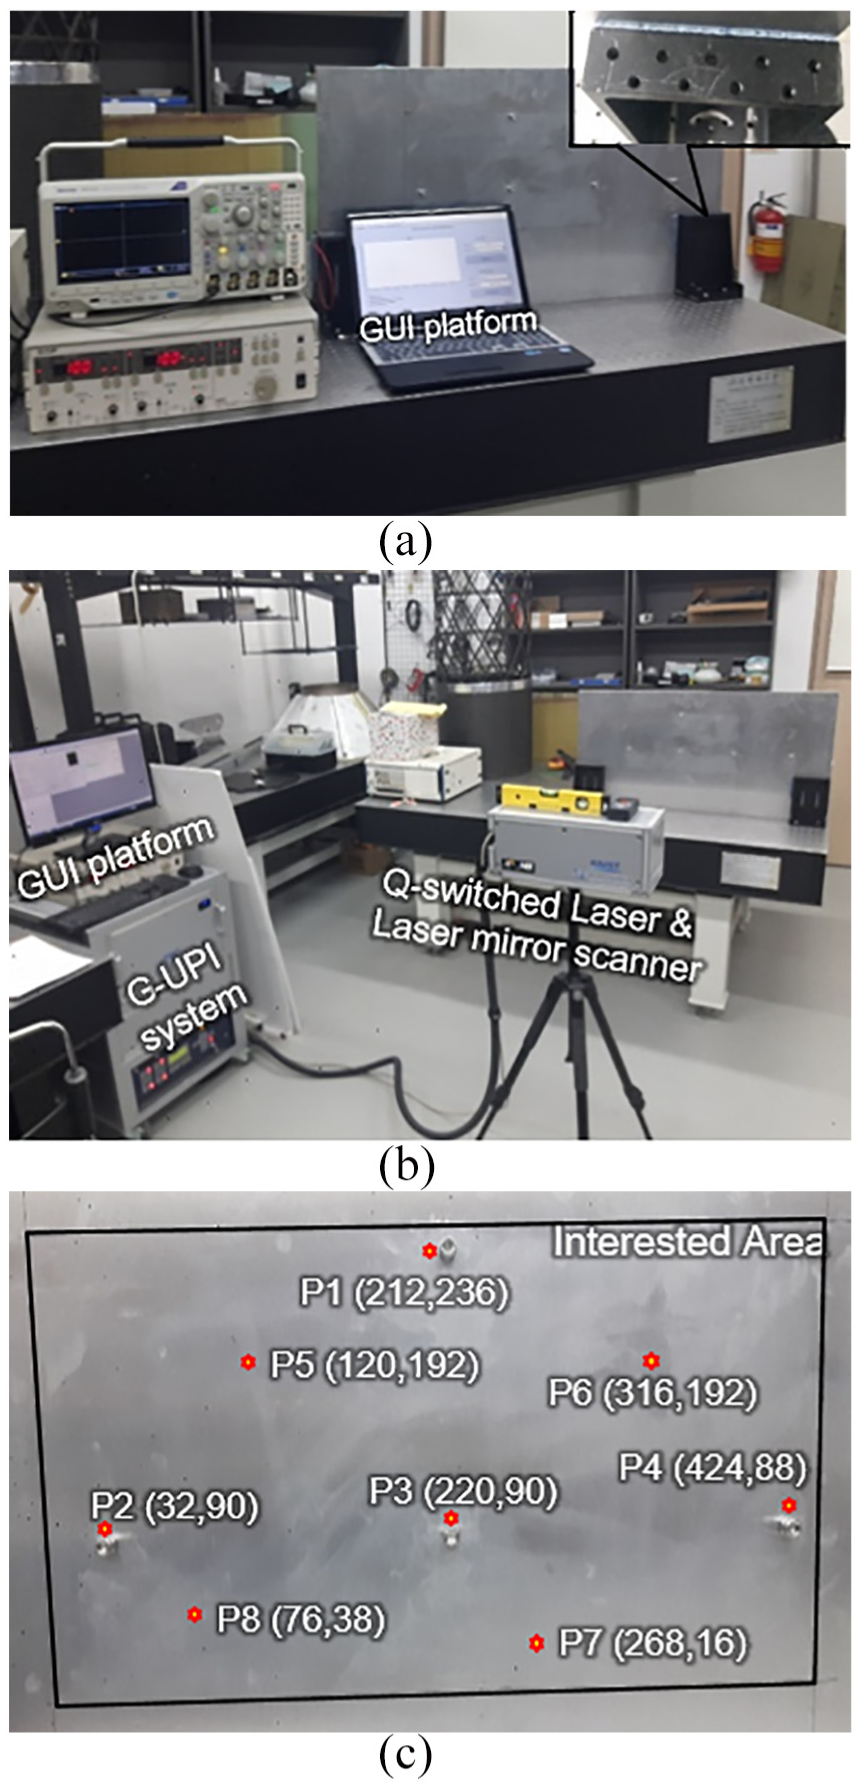
(a) Measurement environment of the PLB-induced AE wave using a PZT sensor with a fixture, (b) setup for scanning generation of the laser-induced elastic wave using a G-UPI (guided-wave ultrasonic propagation imaging) system (X-NDT, Inc.), and (c) PLB points on the front of the main structure.
Data acquisition conditions for PLB-induced AE wave measurement.
Measurement of a laser-induced elastic wave
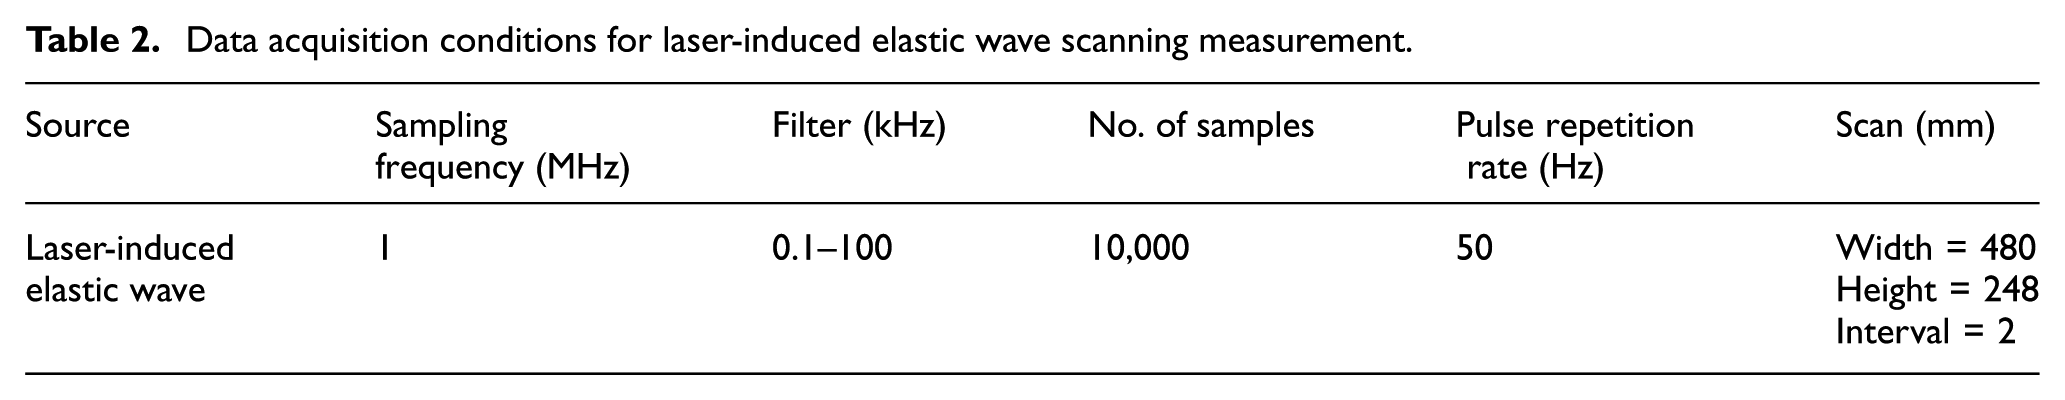
Figure 4(b) shows the laser elastic wave generation and measurement environment of the area of interest using the same specimen with a sensor attached previously. A laser elastic wave was induced at one point on the structure with a Q-switched laser, and the wave generation mechanism was repeated with a laser mirror scanner (LMS) over the area of interest of 480 mm × 248 mm at 2 mm intervals. Scanning was performed at a low pulse repetition rate of 50 Hz to minimize the reverberation effects on the low-damping metallic materials. The induced laser elastic waves were collected with the attached PZT sensor, and the collected signal was filtered through a programmable filter to the desired frequency band (the same frequency band as the PLB-induced AE wave measurement) and stored in the PC. Detailed signal acquisition conditions are described in Table 2.
Data acquisition conditions for laser-induced elastic wave scanning measurement.
Laser-based structural training algorithm for AE technology
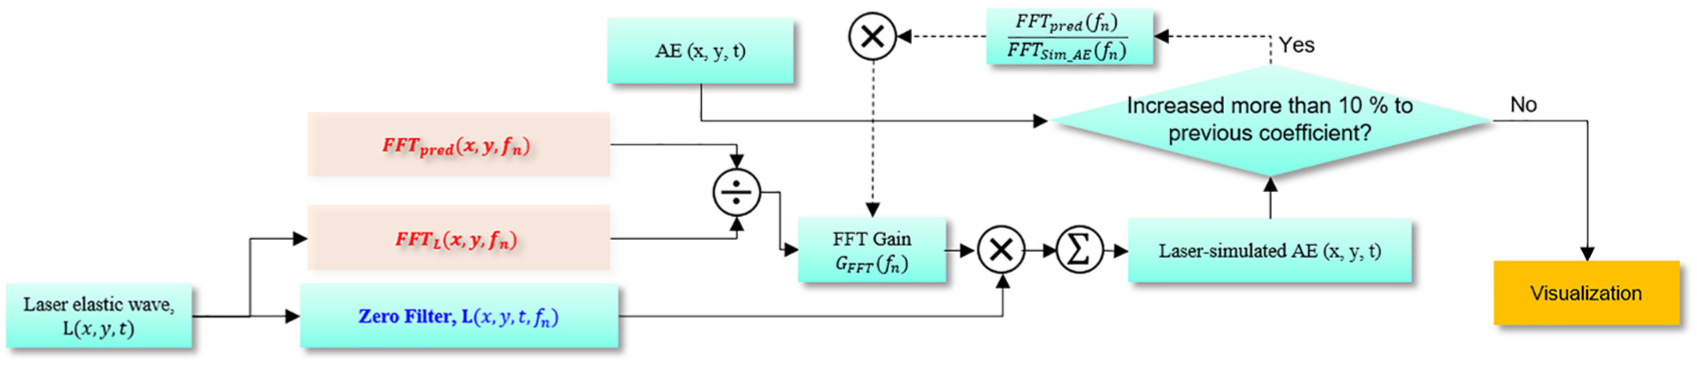
Figure 5 shows the flowchart of the developed laser-based structural training algorithm of AE using the laser elastic wave. The laser scan–based elastic wave acquisition in section “Measurement of a laser-induced elastic wave” and this training algorithm smartilize the structure to provide AE localization and accumulated damage visualization. In this training flowchart, the algorithm is constructed using a fast Fourier transform (FFT) and a zero filter used in the signal decomposition process. The zero filter reduces the number of iterations by reducing the interference in the stop band region during signal decomposition and synthesis process.
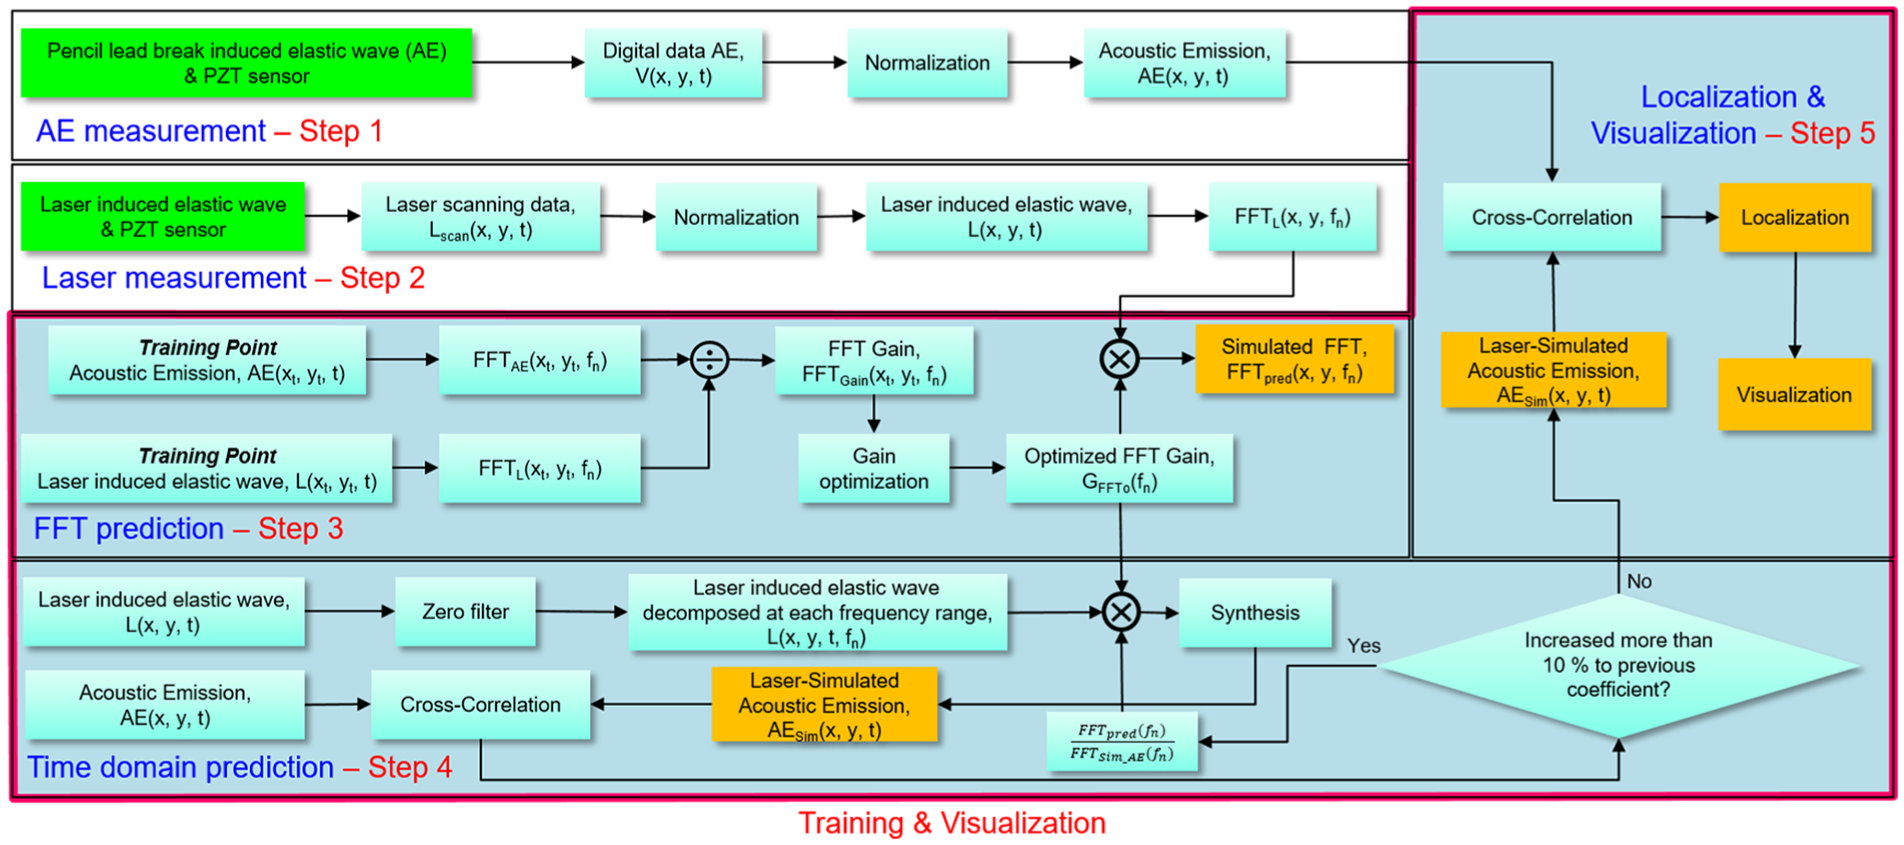
Flowchart of the laser-based structural training algorithm for AE localization and visualization.
FFT prediction
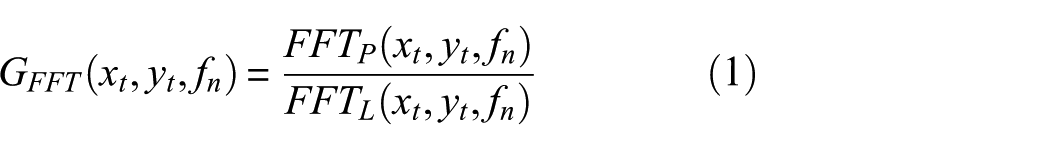
The difference in the characteristics between the actual AE wave and the laser elastic wave is compensated in the frequency range. After designating some of the generated AEs (PLB points) as training points, the laser elastic waves generated at the same point of the training points were extracted. To compensate for the difference in the characteristics of the two signals, the ratio of the two FFTs was designated as gain, as shown in equation (1). The FFT prediction is completed by extracting the most suitable gain among the gains obtained at each training point and applying it to the entire laser elastic waves in the spectrum as shown in equation (2)

Time domain prediction
Figure 6 shows the time domain prediction flowchart. Laser-simulated AE is derived by applying the FFT gain obtained through FFT prediction to each signal decomposed in same frequency range of FFT calculation through zero filter. The waveform similarity is verified by cross-correlation between the actual AE wave and the laser-simulated AE wave. Feedback is used to improve the waveform similarity by recalculating the FFT gain and reapplying the gain to decomposed signal. Iteration is repeated until 10% or more of waveform similarity improvement is not achieved.
Flowchart of time domain prediction using laser elastic wave.
Zero-filter verification
Figure 7(a) shows a PLB-induced AE wave decomposed by the zero filter used in the signal decomposition and synthesis method.
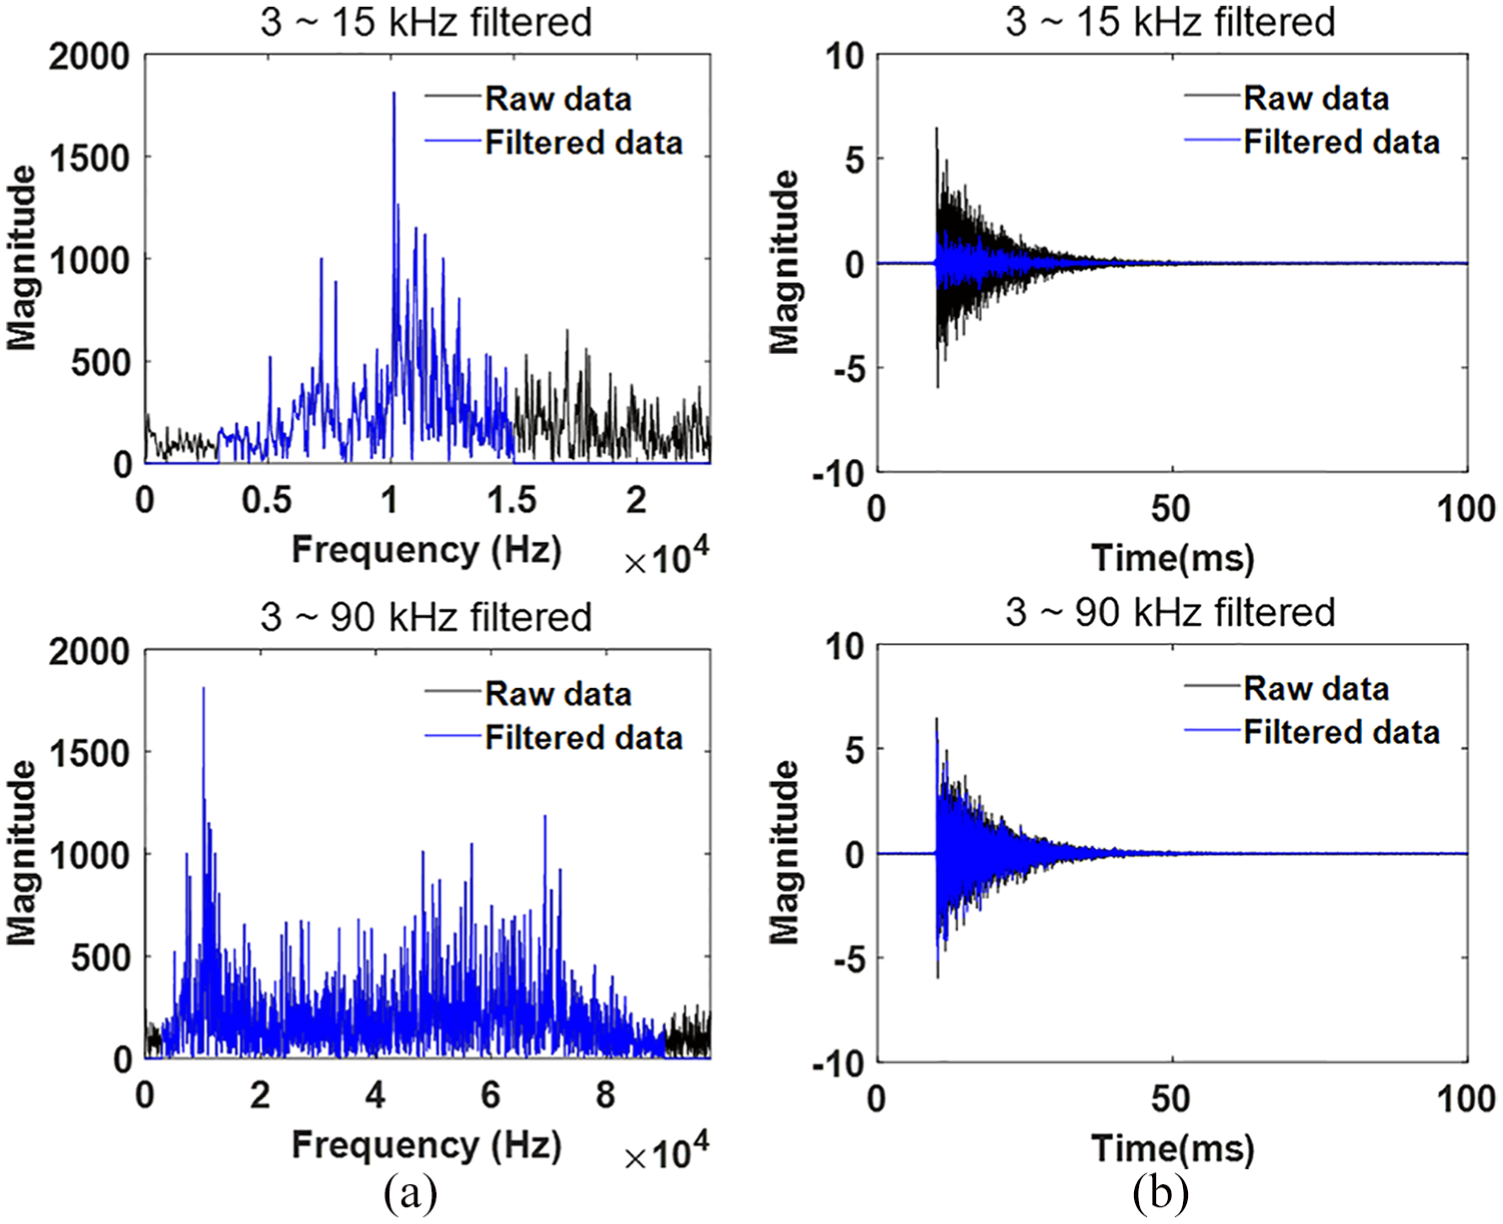
Signal decomposed with respect to each frequency range: (a) in frequency domain and (b) in time domain.
In Figure 7, the blue signal represents the filtered signal in certain frequency range by the zero filter and the black signal represents the measured signal. Unlike the numerical filter used in most signal decomposition, as shown in Figure 7(a), all frequency responses except for the range of 3–15 kHz and 3–90 kHz is set to “zero.” Each corresponding response in the time domain is plotted in Figure 7(b). It shows the time domain signals synthesized after decomposition using zero filter at the same frequency interval as in FFT calculation. Based on this, if the signal is decomposed according to each frequency range by the zero filter and synthesized, the original signal can be restored. Therefore, the zero filter is suitable for signal decomposition and synthesis for laser-based structural training algorithm.
Localization and visualization
Figure 8 shows the flowchart for AE source localization using laser-simulated AE wave and actual AE wave. The largest value among the coefficients obtained through cross-correlation between the actual AE wave and the laser-simulated AE wave is determined as the AE occurrence position.
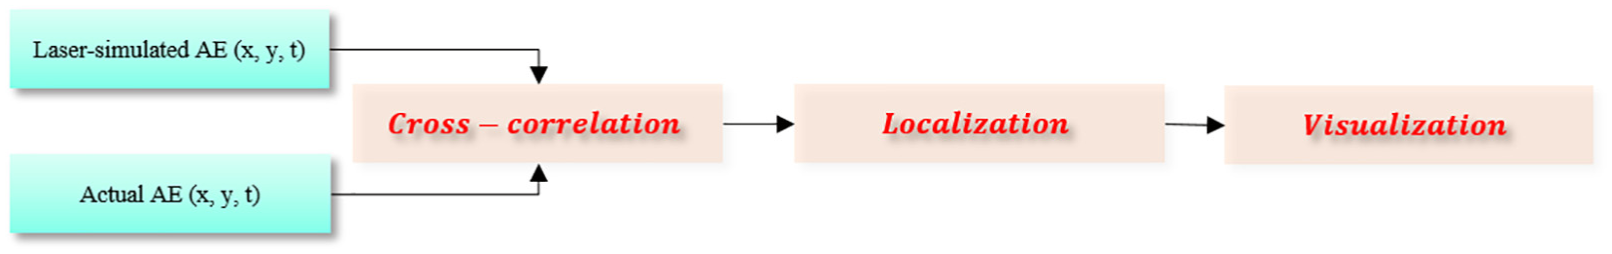
Flowchart for AE source localization using laser-simulated AE wave and actual AE wave.
Figure 9 shows the repeated structural damage appending and visualization flowchart. AE frequently occurs in a repeated load environment. There is a high possibility that AE occurs at the same or very close point due to stress concentrations caused by cracks that induce AE. Therefore, the structural integrity can be confirmed through cumulative AE visualization when cracks repeatedly occur in the structure. The DI of the actual AE which is calculated in equation (3) is applied to the AE location designated by source localization, and each AE DI is appended and visualized in 3D. Through this, the degree of damage at each point is checked simultaneously

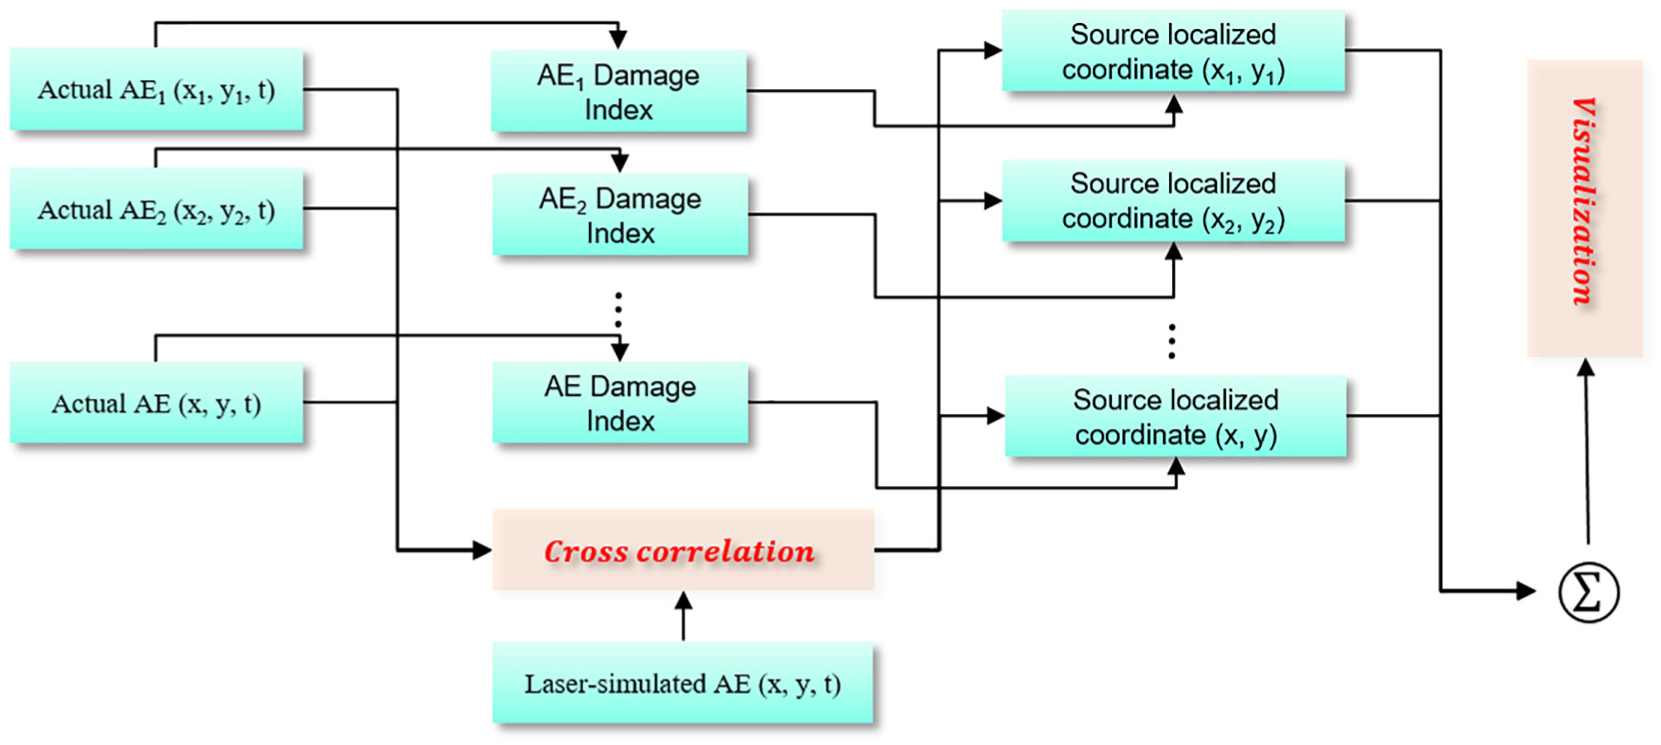
Flowchart for accumulated damage visualization using the damage index and coordinate of the localized source.
Results of laser-based structural training
Figure 10 shows the laser-based structural training results. The blue signal represents the laser-simulated AE wave at the same location of PLB point and the black signal represents the actual AE wave measured at each point. The cross-correlation coefficient (X_corr_coeff) was used to quantify the waveform similarity in the time domain. The points 2, 3, and 4 were used as training points and the remaining points were used as verification points. Coefficient of cross-correlation between the actual AE and the laser-simulated AE shows 48.10% at point 2, 53.02% at point 3, and 45.88% at point 4, which were training points. To verify the validity of structural training at any point, we used points 1, 5, 6, 7, and 8 of the structure as verification points. The X_corr_coeffs were 64.94% at point 1, 64.71% at point 5, 62.55% at point 6, 61.40% at point 7%, and 63.93% at point 8.
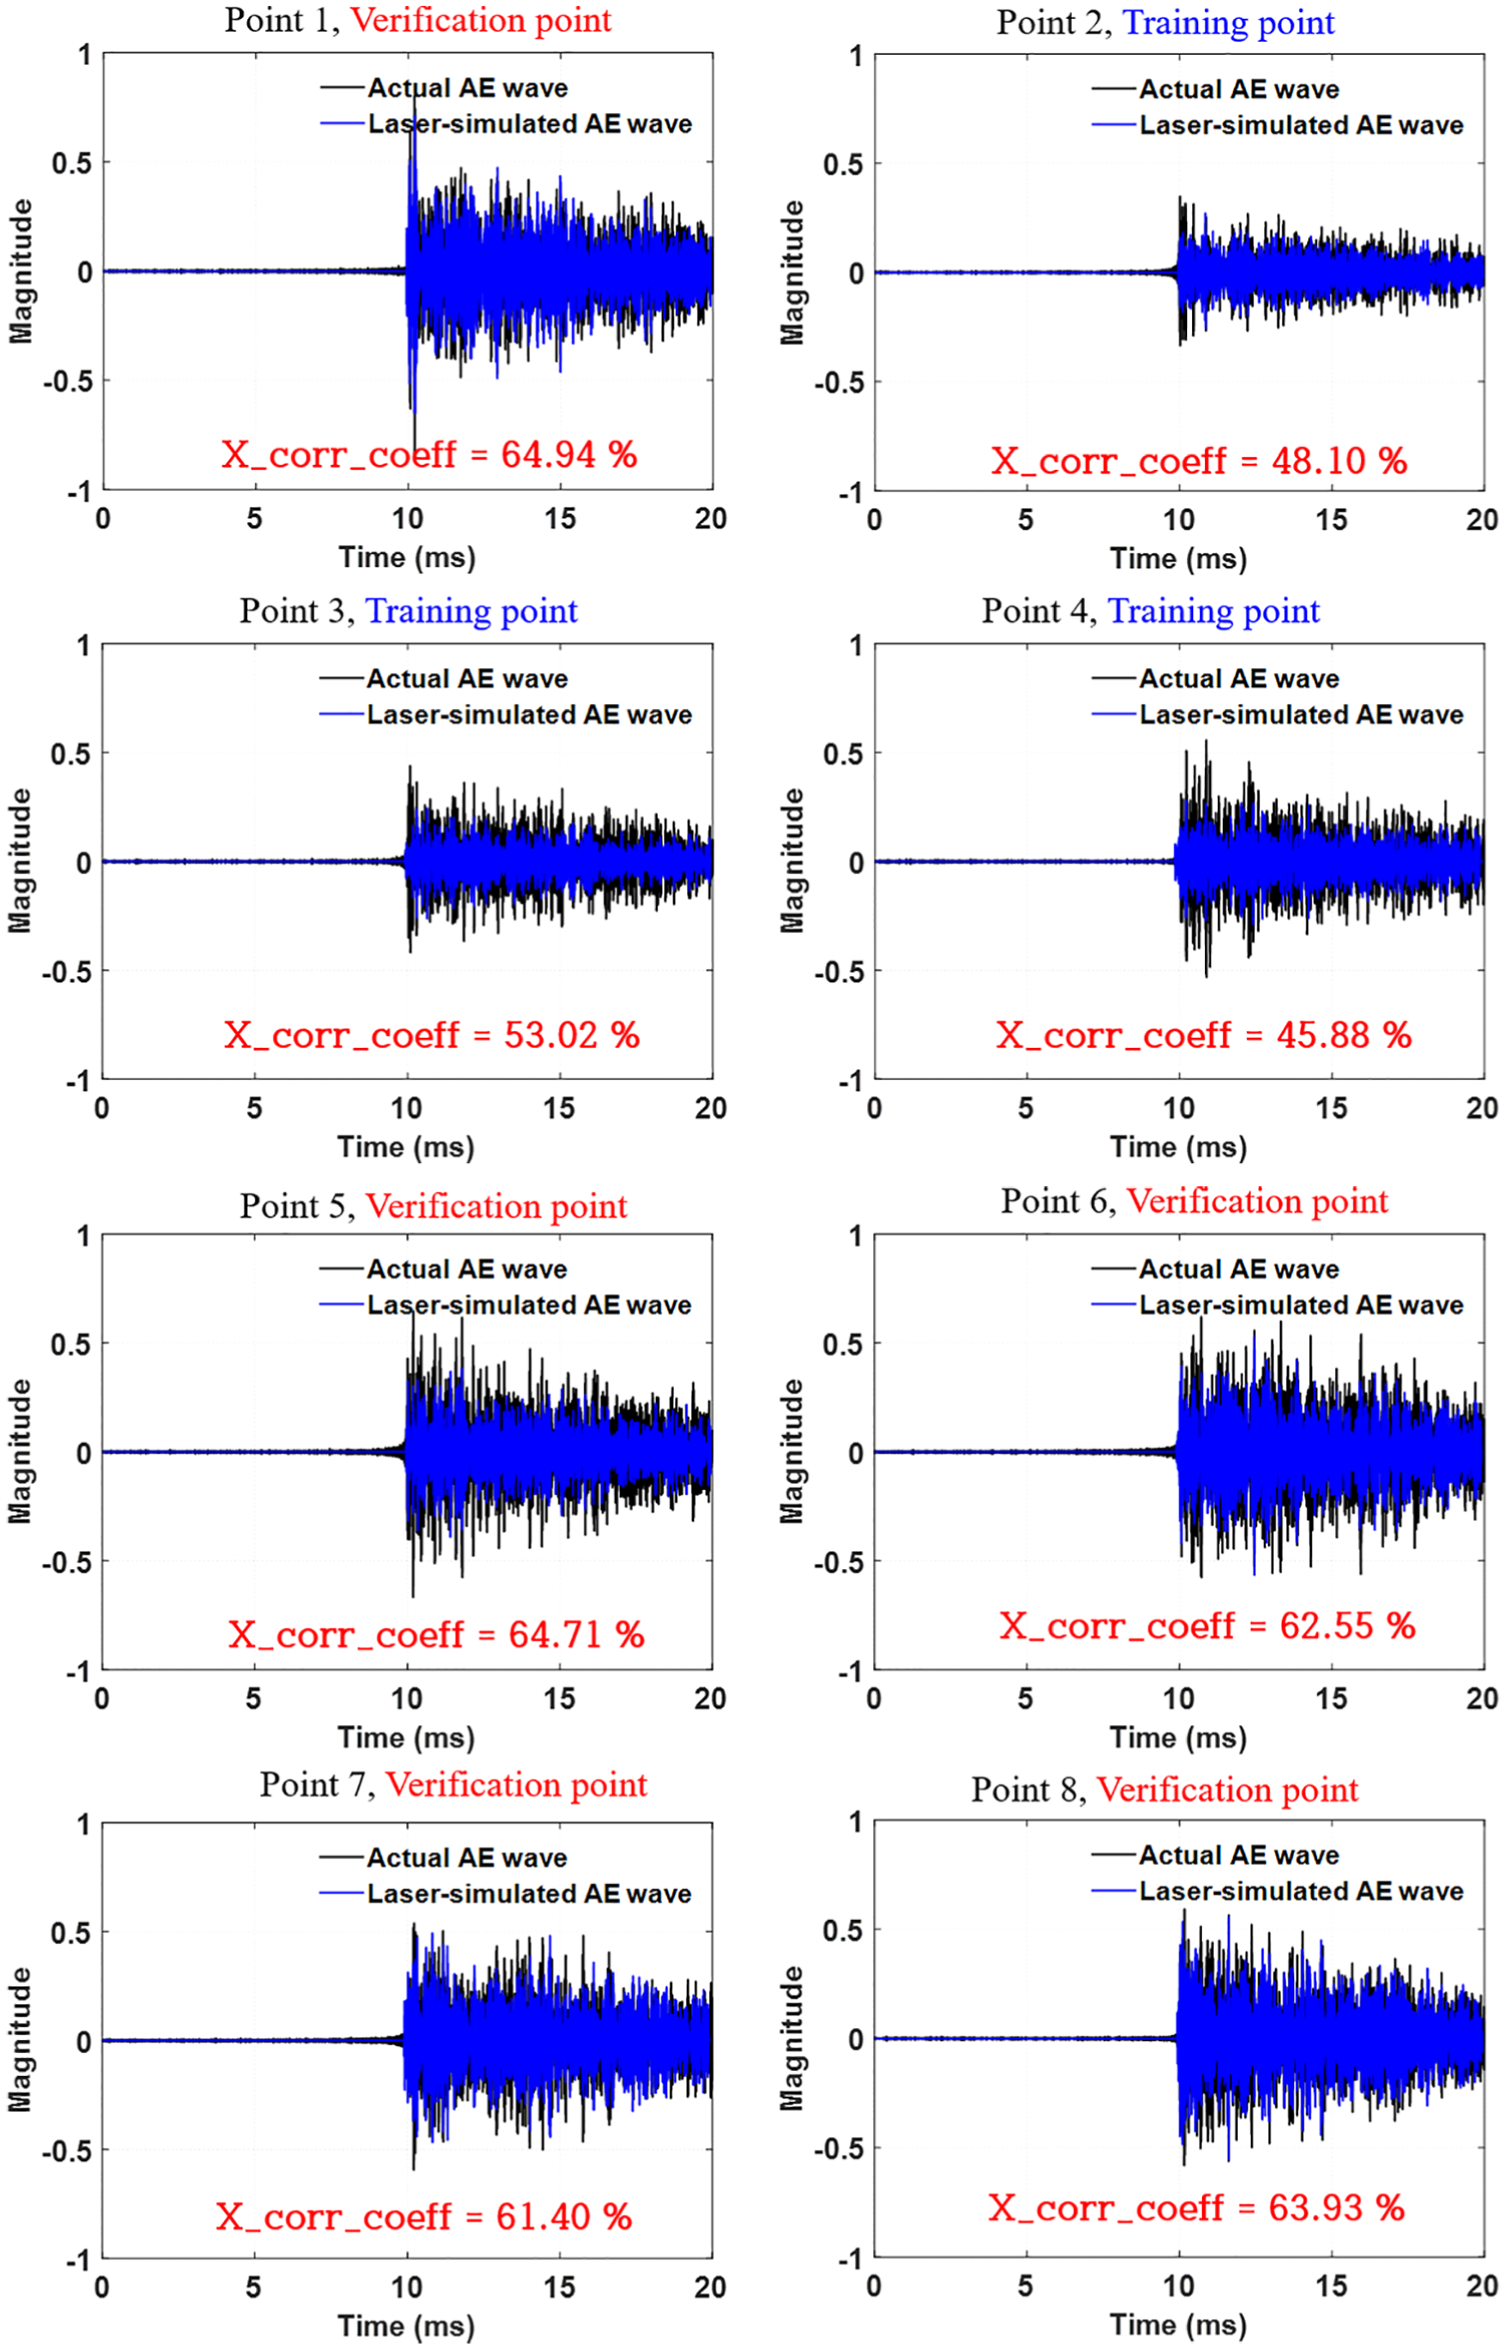
Comparison of an actual PLB-induced AE wave and a laser-simulated AE wave at each point.
Source localization results
AE localization
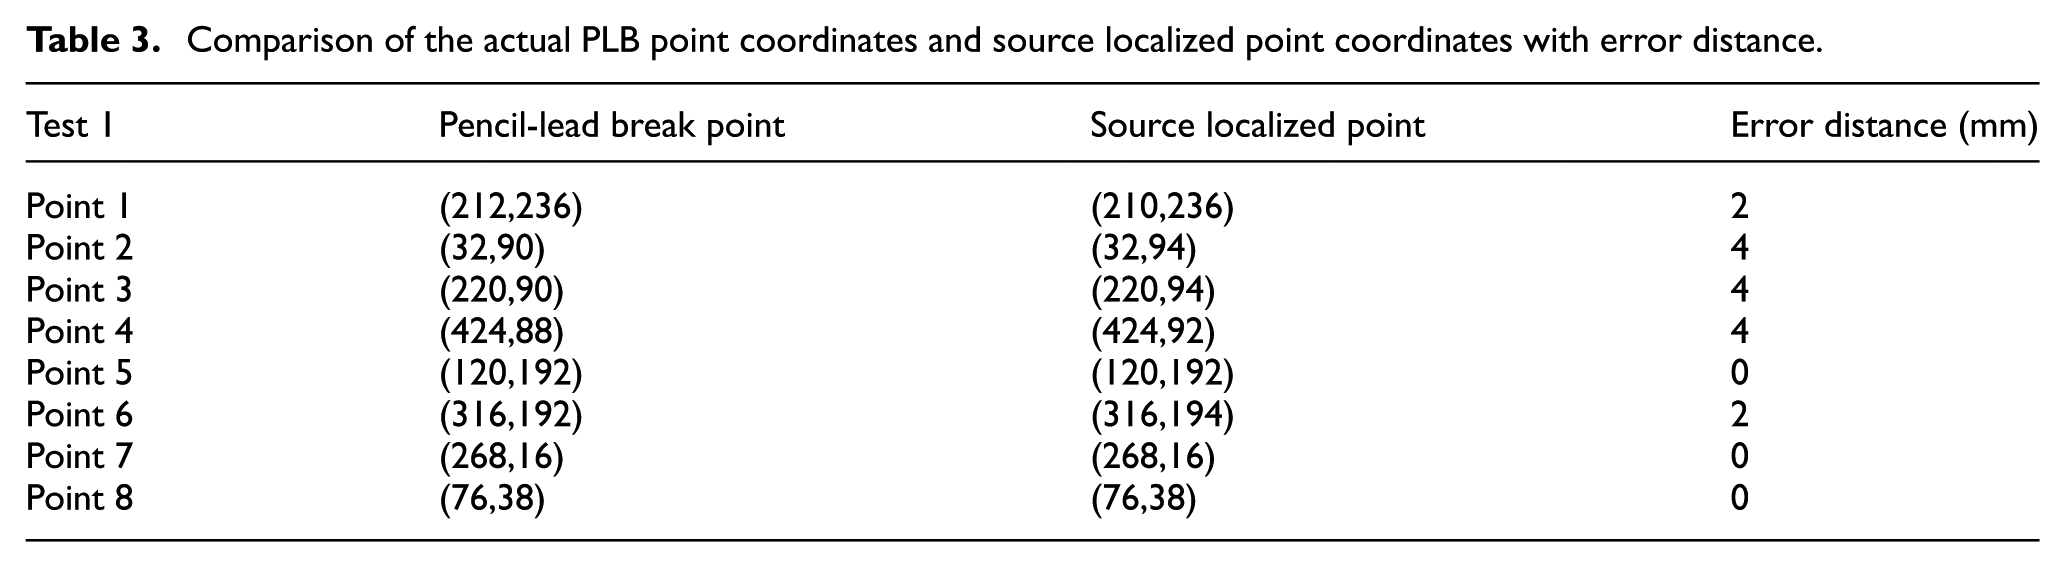
The X_corr_coeff of the actual AE wave and laser-simulated AE wave was derived and points with the highest coefficient were determined to be the points where AE occurs. As shown in Table 3, the error distance between the PLB point and the source localized point determined through the cross-correlation coefficient was 2 mm at point 1, 4 mm at point 2, 4 mm at point 3, 4 mm at point 4, 0 mm at point 5, 2 mm at point 6, 0 mm at point 7, and 0 mm at point 8, where the localization resolution is 2 mm because the Q-switched laser scanning interval was 2 mm. As shown in Figure 11, the error of localized point can be immediately confirmed by simultaneously displaying the actual PLB points in the region of interest.
Comparison of the actual PLB point coordinates and source localized point coordinates with error distance.
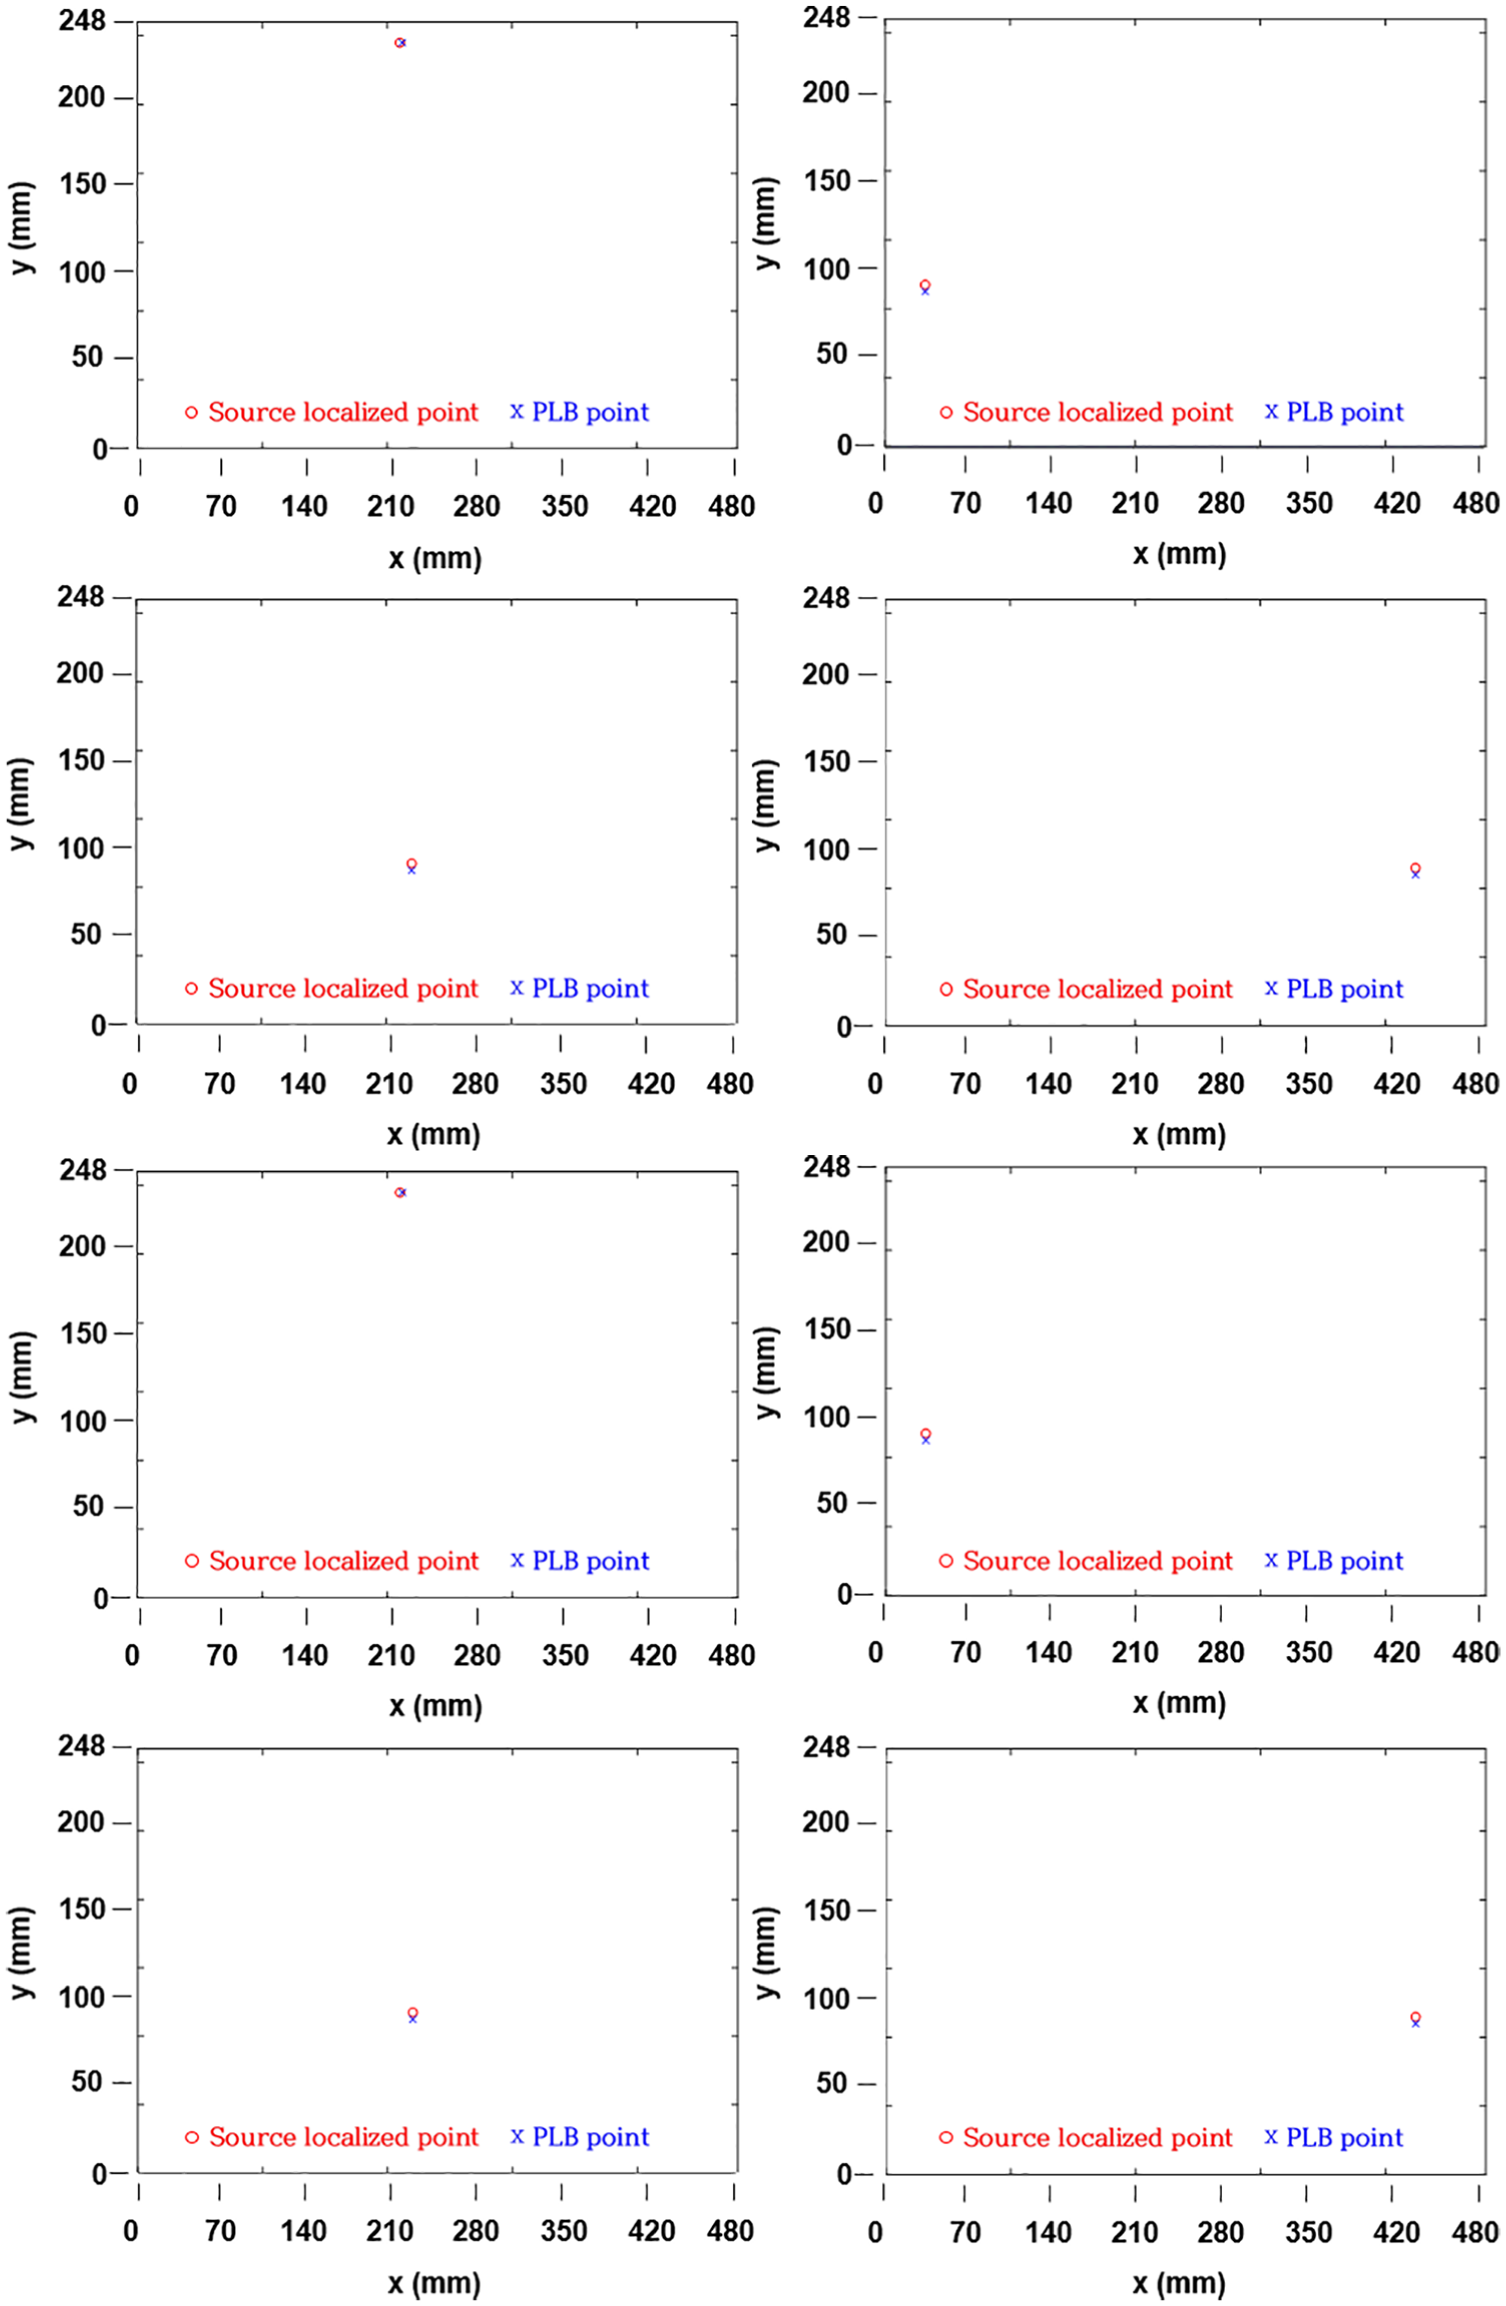
Source localization with actual PLB point on the entire region of interest (points 1–4: near the bolts; points 5–8: simple plate).
Repeated damage visualization using AE DI
Under the condition that AE occurs randomly and repeatedly, repeated damage was visualized using the accumulated damage visualization method. Using DI of actual AE, repeated damage at each point was displayed in 3D. Figure 12(a) assumes that damage has repeatedly occurred near the bolt. Points 2 and 3 of these bolts were the bolts connecting the substructure and the main structure. Damage was repeated 2 times at point 1, 3 times at point 2, 4 times at point 3, and 5 times at point 4. Figure 12(b) assumes that the damage was repeated on the simple plate. Damage was repeated 2 times at point 5, 3 times at point 6, 4 times at point 7, and 5 times at point 8. As a result, low accumulated DI was observed at the locations where repetitive damage was less, and high accumulated DI was observed at the locations where relatively many repetitive damage occurred. Therefore, it is possible to distinguish the location that is damaged severely or not.
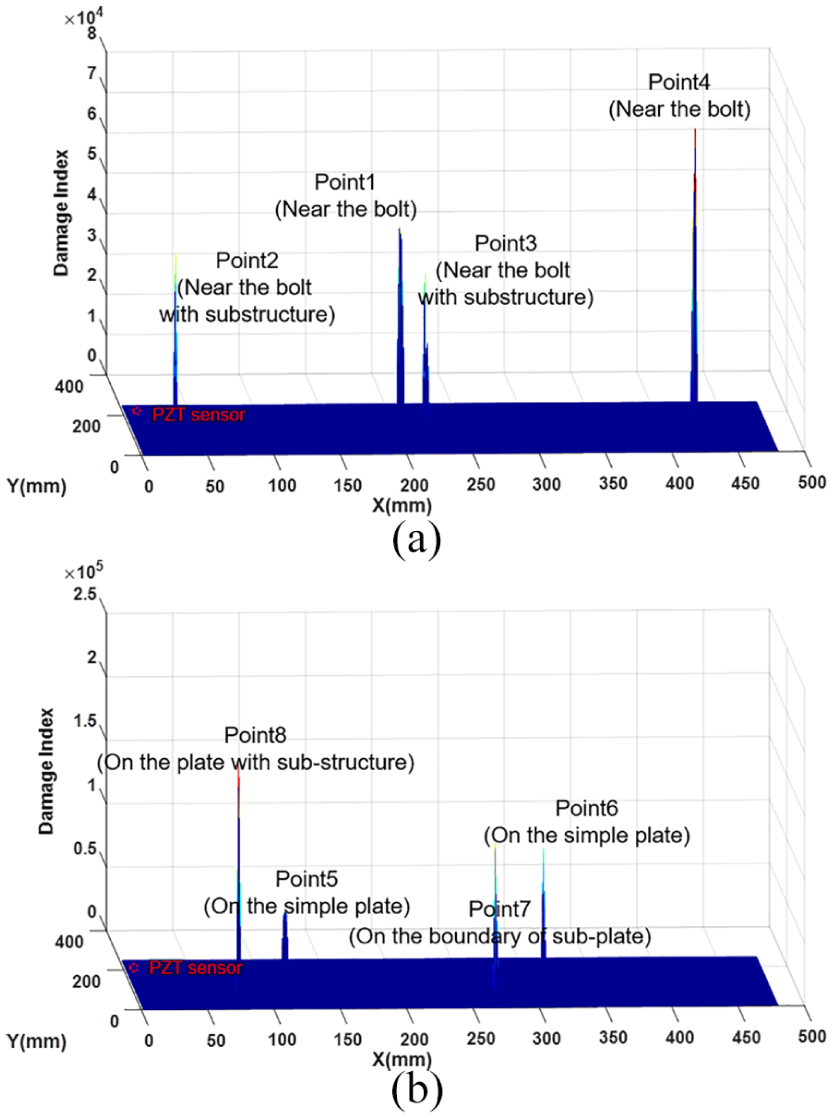
Visualization of repeated structural damages in 3D using actual AE damage index: (a) assuming AE has repeatedly occurred near the bolt and (b) assuming AE has repeatedly occurred at the simple plate.
Conclusion
This article demonstrates the AE source localization and accumulated damage visualization using AE DI through a Q-switched laser scan–based structural training technique with a single PZT sensor. The specimen used in the experiment is a complex structure with fasteners and a substructure. Instead of real damage-induced AE, an AE standard method, called PLB test that can generate AE wave similar to the real damage occurrence, was used on a simple plate area and near a bolt in the specimen. The PLB-induced AE wave was acquired by a PZT sensor attached to the rear surface of the specimen, which is the internal surface in an actual SHM application. The laser elastic wave induced by the Q-switched laser and LMS in the entire region of interest was collected with the same PZT sensor. The collected laser elastic waves were simulated with actual AE waves in the entire region of interest through the proposed laser-based structure training algorithm, which is a smartilization process for a structure with an integrated PZT sensor. The location with the highest coefficient acquired by cross-correlation between the laser-simulated AE wave and the actual AE wave is selected as the AE occurrence point. As a result, the mean error distance between the actual PLB point and the source localized point was 1.84 mm. Given that most localization algorithms have approximately 10 mm accuracy as of now, this structural training algorithm shows superior source localization performance. The laser elastic waves were obtained with a 2-mm scan interval with a speed of 50 points per second in this study; the smaller scanning interval can additionally reduce the localization error. By visualizing repeated damage through AE DI accumulation, the structural integrity for repeated damage was achieved. Therefore, the proposed Q-switched laser scan–based structural training technique is suitable for localizing AE source and visualizing accumulation of repeated damages.
Footnotes
Declaration of conflicting interests
The author(s) declared no potential conflicts of interest with respect to the research, authorship, and/or publication of this article.
Funding
This work was supported by the National Research Foundation of Korea (NRF) grant funded by the Ministry of Science and ICT (NRF-2017R1A5A1015311) and the Technology Innovation Program (10074278, development of an SHM system for UAV using CNT/polymer hybrid fiber sensor network and simultaneous proof-of-concept of autonomous flight and diagnosis) funded by the Ministry of Trade, Industry & Energy (MI, Korea).