
Abstract
Research works on photogrammetry have received tremendous attention in the past few decades. One advantage of photogrammetry is that it can measure displacement and deformation of a structure in a fully non-contact, full-field manner. As a non-destructive evaluation method, photogrammetry can be used to detect structural damage by identifying local anomalies in measured deformation of a structure. Numerous methods have been proposed to measure deformations by tracking exterior features of structures, assuming that the features can be consistently identified and tracked on sequences of digital images captured by cameras. Such feature-tracking methods can fail if the features do not exist on captured images. One feasible solution to the potential failure is to artificially add exterior features to structures. However, painting and mounting such features can introduce unwanted permanent surficial modifications, mass loads, and stiffness changes to structures. In this article, a photogrammetry-based structural damage detection method is developed, where a visible laser line is projected to a surface of a structure, serving as an exterior feature to be tracked; the projected laser line is massless and its existence is temporary. A laser-line-tracking technique is proposed to track the projected laser line on captured digital images. Modal parameters of a target line corresponding to the projected laser line can be estimated by conducting experimental modal analysis. By identifying anomalies in curvature mode shapes of the target line and mapping the anomalies to the projected laser line, structural damage can be detected with identified positions and sizes. An experimental investigation of the damage detection method was conducted on a damaged beam. Modal parameters of a target line corresponding to a projected laser line were estimated, which compared well with those from a finite element model of the damaged beam. Experimental damage detection results were validated by numerical ones from the finite element model.
Keywords
Introduction
Vibration-based damage detection is one application of structural dynamics. An assumption of the application is that changes in structural properties of a structure, such as mass and stiffness, due to occurrence of damage can cause changes in its modal parameters, including natural frequencies, modal damping ratios and mode shapes. Inversely, one can detect the damage by identifying and processing the changes in modal parameters. In practice, workability of a vibration-based damage detection method largely depends on accuracy of modal parameter estimation. Recent advances of camera and computer technologies have benefited the usage of photogrammetry for structural dynamics and its application to vibration-based damage detection. By tracking movements of exterior features of a structure that appear on digital images captured by cameras, its full-field displacement and deformation can be measured in a fully non-contact manner, and its modal parameters can be estimated for damage detection.
In the field of experimental structural dynamics, digital image correlation (DIC) techniques have been used to measure vibration and estimate modal parameters;1–6 they have also been used for structural damage detection. Ghorbani et al. 7 generated detailed cracked maps of a full-scale masonry wall based on its surface deformation fields measured using a three-dimensional DIC technique. Seguel and Meruane 8 identified debonding in an aluminum honeycomb sandwich panel based on its full-field vibration shapes measured using a three-dimensional DIC system. Before applying a DIC technique, a surface of a structure is usually prepared by painting a high-contrast speckle pattern so that its digital images captured at different instants can be compared to track deformation of the surface. When certain locations of a structure instead of a surface are of interest, one can attach visible targets to the structure and displacement of the locations can be obtained by tracking the attached targets.9–11 Lecompte et al. 12 developed a point-tracking technique to measure static deformation of a cracked concrete beam and detect its cracks, where infrared light-emitting diodes (LEDs) were attached to the beam and served as targets. Compared with results from a DIC system, the density of displacement measured using the point-tracking technique was low as it depended on the number of attached LEDs. Wahbeh et al. 13 mounted LEDs to a structure and measured its two-dimensional vibration. The LEDs that served as targets were tracked by locating their centers on each captured digital image. Rucka and Wilde 14 attached circular points to a lateral surface of a cracked beam that underwent static deformation, which was measured by tracking the attached points on captured digital images. Wavelet transforms of the measured deformation were used to detect the crack of the beam. Feng and Feng 11 tracked vibration of multiple black dots attached to a lateral surface of a beam and the tracked vibration compared well with those measured using laser displacement sensors and accelerometers.
The DIC and target-tracking techniques require visible exterior features to be painted on or mounted to a structure, which can introduce unwanted permanent surficial modifications, mass loads and stiffness changes. When such features do not exist or are difficult to add, one can apply target-less techniques, such as edge detection and motion magnification techniques,15–17 to track displacement and deformation of a structure. Poudel et al. 18 extracted mode shapes of a cracked beam from captured digital images using an edge detection technique, and wavelet transforms of differences between the extracted mode shapes and referenced ones were used to detect the cracks. Pakrashi et al. 19 applied an edge detection technique called Sobel technique to convert digital images to black-and-white binary ones, and a pattern recognition process was used to extract the first mode shape of a cracked beam; the cracks could be identified using the extracted mode shape. Javh et al.20,21 developed a gradient-based optical-flow modal analysis technique using digital cameras, where black-and-white lines were drawn on surfaces of structures, such as beams and cymbals. Chen et al. 22 proposed a motion magnification technique to measure modal parameters of structures. The technique was then applied to evaluate natural frequencies of an outdoor antenna tower and an outdoor bridge by Chen et al. 23 and Chen et al., 24 respectively. Yang et al. 17 proposed a target-less blind identification technique for full-field output-only modal analysis based on a motion magnification technique; damage in beam components of a frame structure was detected based on mode shapes estimated by the proposed technique. Guo and Zhu 25 proposed a real-time target-less efficient technique for vibration measurement, where Lucas–Kanade tracking algorithm and a modified inverse compositional algorithm were used. However, the proposed technique could be undermined due to changes in shading, lighting and background conditions.
In this work, a photogrammetry-based structural damage detection method is developed; it consists of three techniques: a laser-line-tracking technique, an experimental modal analysis technique for a target line and a damage identification technique. In the laser-line-tracking technique, a digital camera captures a series of digital images of a visible laser line projected to a surface of a structure and a target line corresponding to the projected laser line is tracked. Projecting the laser line to a structure does not cause any structural modifications, since a laser line is massless and its existence is temporary. Modal parameters of the target line are estimated using the experimental modal analysis technique, and positions and sizes of structural damage can be identified based on estimated mode shapes of the target line. The developed structural damage detection method was experimentally investigated on a damaged cantilever beam. Modal parameters of a target line estimated by the experimental modal analysis technique were compared with those from a finite element model of the beam. Experimental damage identification results were validated by those from the finite element model.
The remaining part of this article is outlined as follows. The laser-line-tracking technique is described in section “Laser-line-tracking technique,” based on which the experimental modal analysis technique is described in section “Experimental modal analysis of a target line.” The damage detection technique is described in section “Structural damage detection technique.” Experimental investigations of the laser-line-tracking, experimental modal analysis and damage identification techniques are presented in section “Experimental investigation.” Conclusions of this work are presented in section “Conclusion.”
Methodology
Laser-line-tracking technique
A three-dimensional schematic of the laser-line-tracking technique is shown in Figure 1(a). In this technique, a digital camera is facing a surface of a beam with a tilt angle
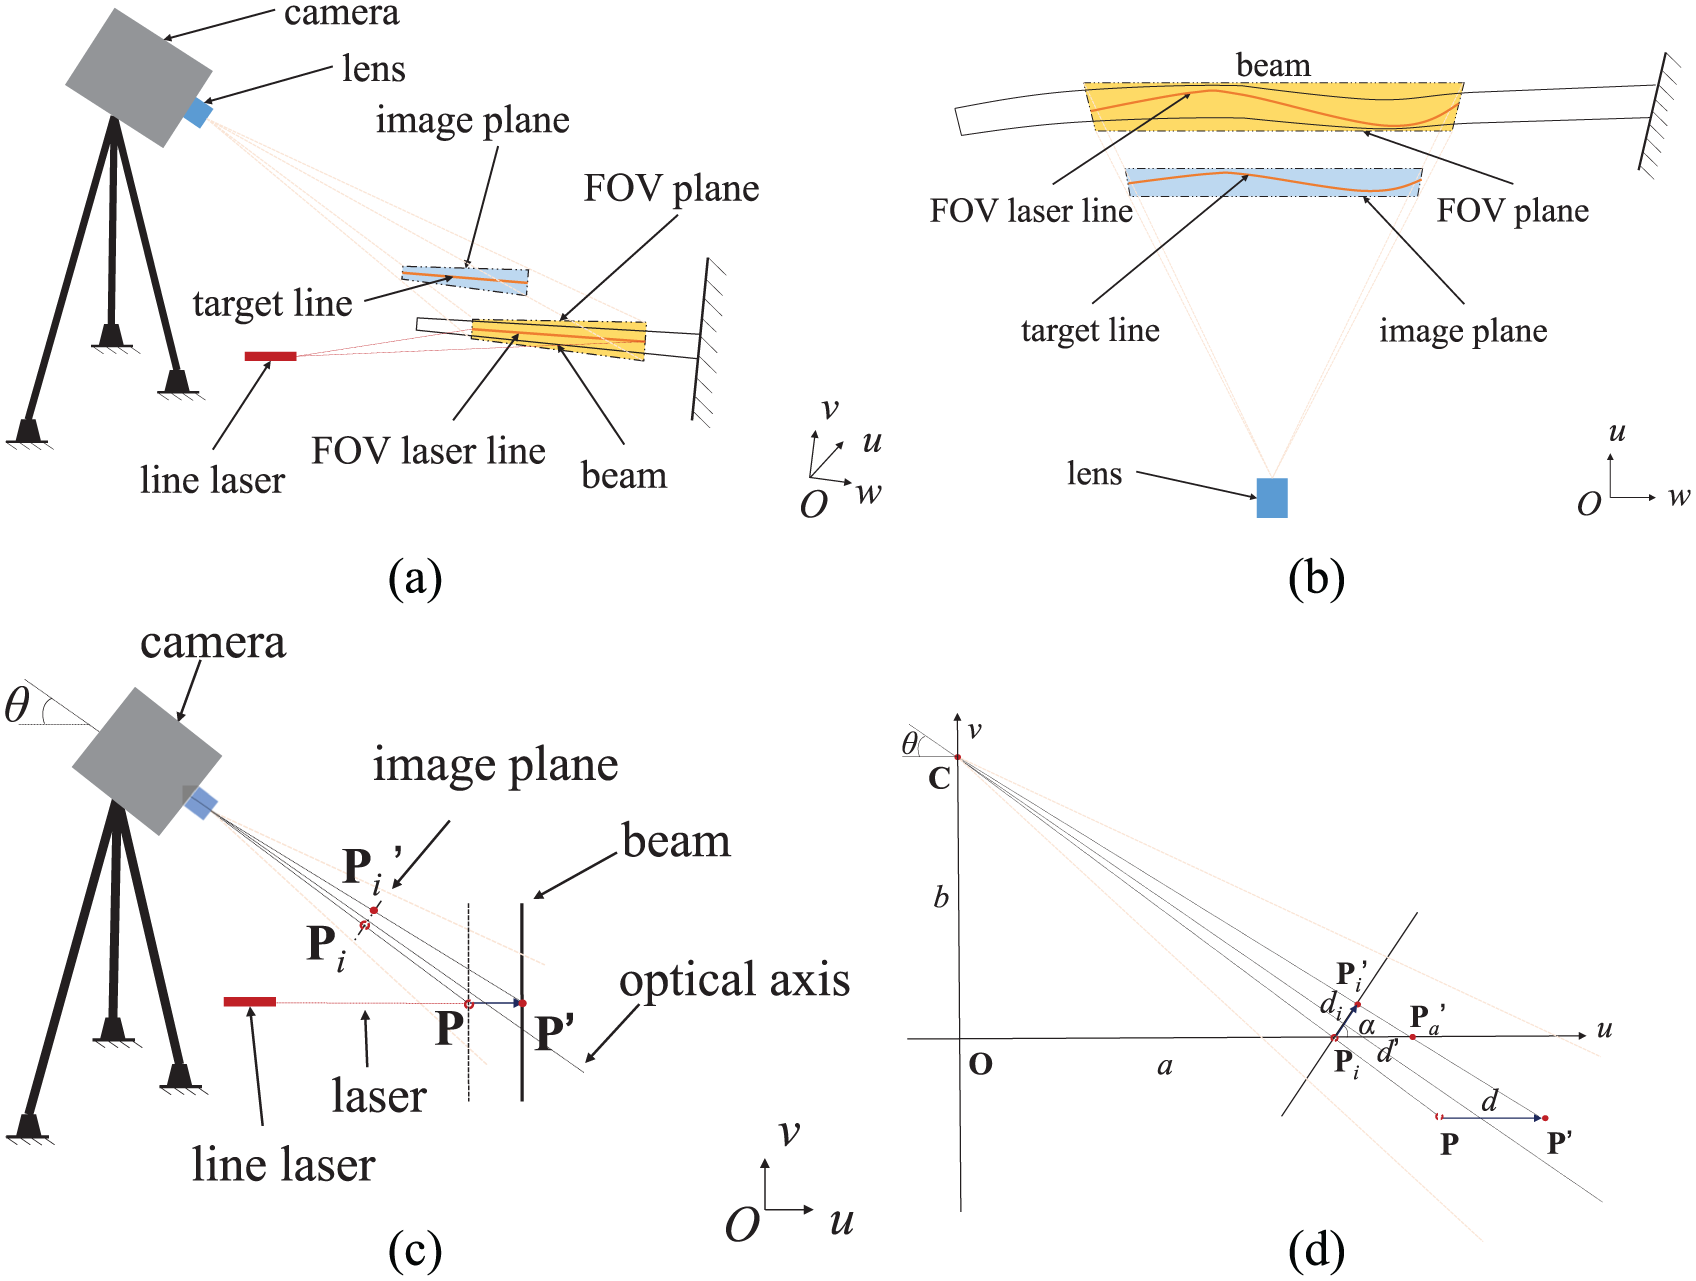
(a) Three-dimensional schematic of the laser-line-tracking technique, (b) a view of the schematic from the lens in (a) with the beam undergoing transverse deformation, (c) a cross-sectional view of the schematic in (a), and (d) a geometric description of the cross-sectional view in (c).
In the three-dimensional schematic shown in Figure 1(a), a Cartesian coordinate system
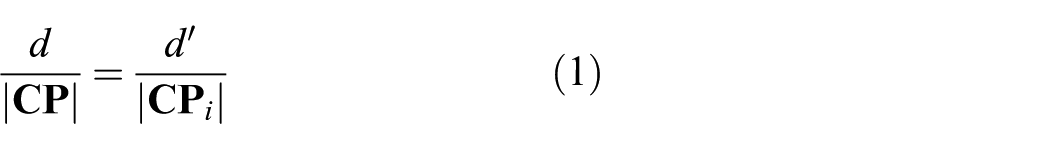
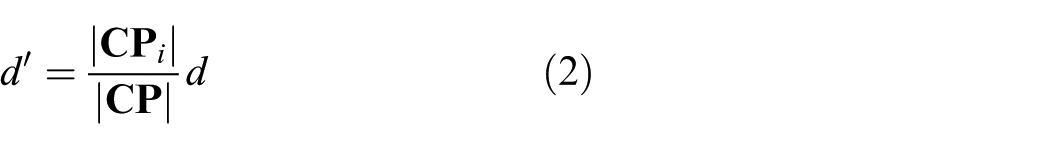
where |·| denotes the length of a straight line, and rearranging equation (1) yields
Let

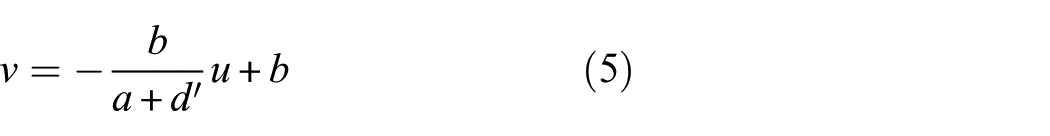
A straight line passing through
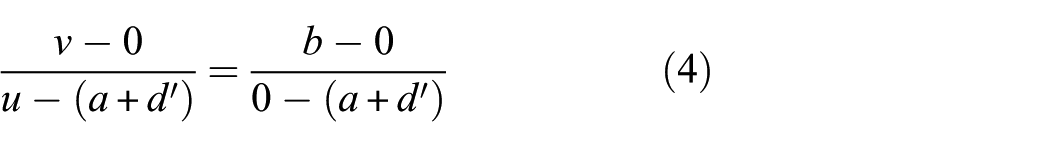
and rearranging equation (4) yields
Coordinates of
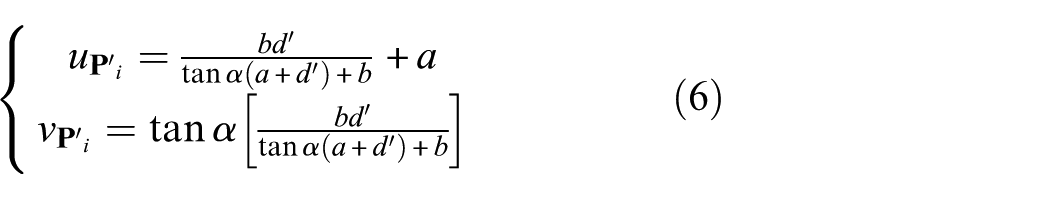
The length of
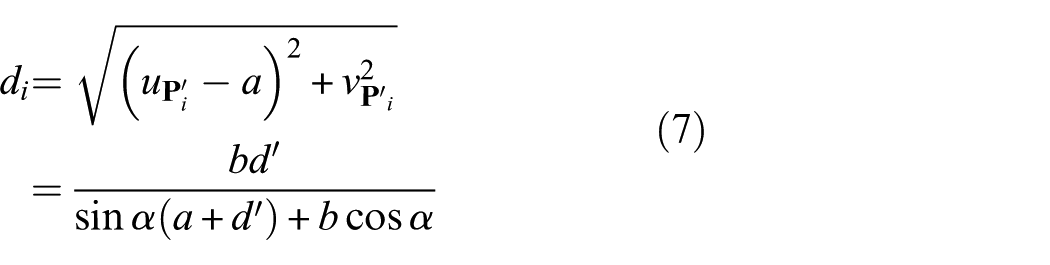
When the beam deforms transversely with a small amplitude and the stand-off distance of the camera is much larger than the deformation amplitude of the beam, one has
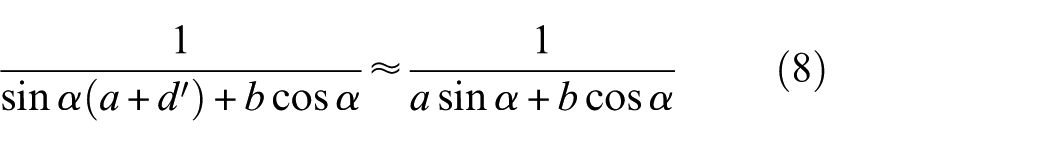
and
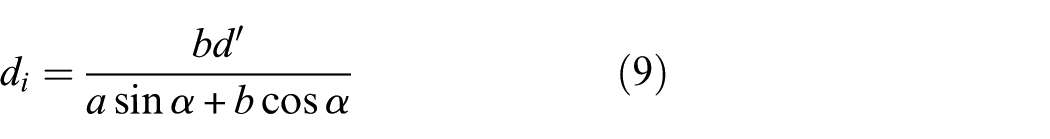
Substituting equation (2) into equation (9) yields
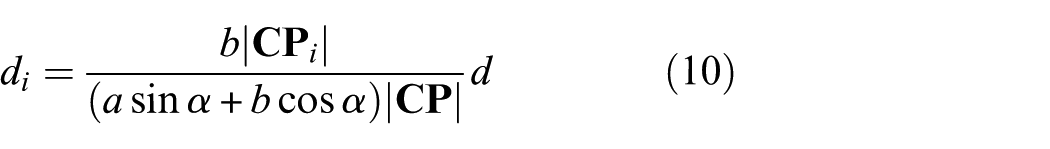
Since
An intensity profile of a target line corresponding to an FOV laser line resembles a one-dimensional Gaussian distribution 27
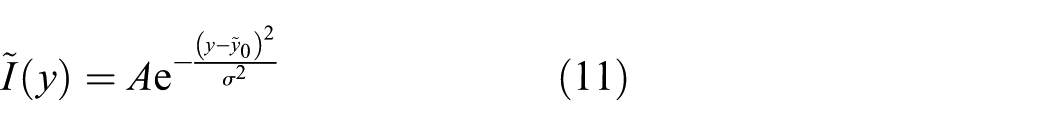
where
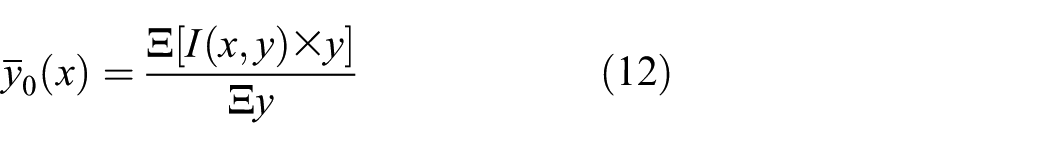
where
Experimental modal analysis of a target line
As shown in section “Laser-line-tracking technique,” when the beam in Figure 1(a) undergoes transverse vibration, the target line will undergo in-plane vibration on digital images captured by the camera, and one can track the corresponding vibrating target line using the gray-gravity rule. Assuming that the beam is a linear structure and its transverse vibration has a small amplitude, the ratio between
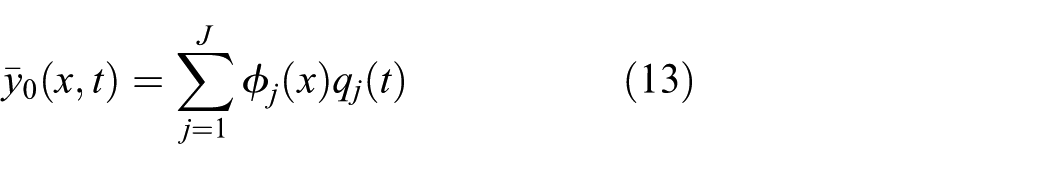
where
where
Structural damage detection technique
A curvature mode shape is the second-order derivative of a mode shape of a structure and damage can introduce local anomalies to curvature mode shapes. 29 On digital images captured by the camera in the setup of the laser-line-tracking technique, the local anomalies in curvature mode shape of the structure can be mapped to corresponding curvature mode shapes of the target line. Inversely, identifying the local anomalies in the curvature mode shapes of the target line can assist in detecting the damage by mapping the local anomalies to the FOV laser line.
A non-model-based damage detection technique by Xu et al.
30
is used here to identify local anomalies in curvature mode shapes of a target line, by mapping which locations and sizes of damage in a structure along a corresponding FOV laser line can be identified. An overview of the damage detection technique is provided here, and more details of the technique can be found in Xu et al.
30
An entry of a curvature mode shape vector of a target line at
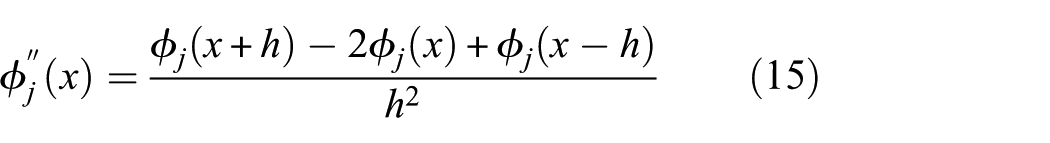
where a prime denotes spatial derivative and
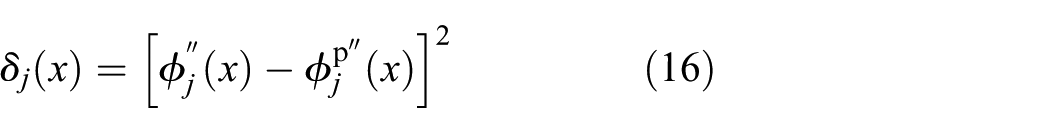
where
where
where
is larger than

where
Experimental investigation
Experimental setup
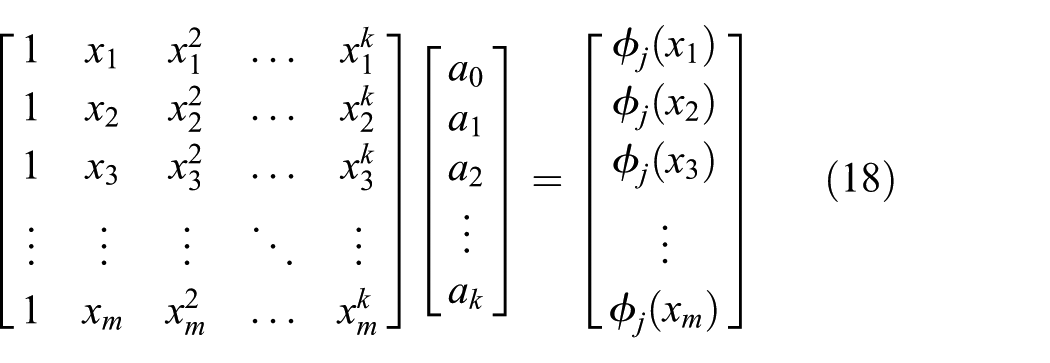
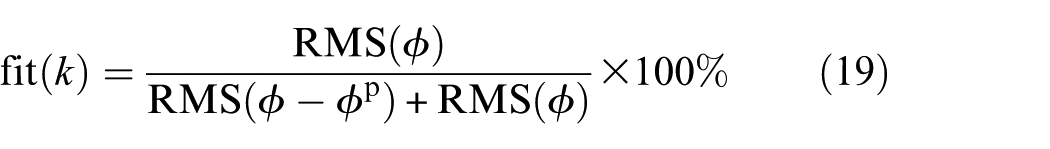
Experimental investigations of the laser-line-tracking, experimental modal analysis, and damage detection techniques were conducted on a damaged cantilever beam. Dimensions of the beam and experimental setup of the investigations are shown in Figures 2(a) and (b), respectively. One end of the beam was clamped by a bench vice to simulate a fixed boundary. The damage was in the form of a machined area with thickness reduced by 20% on one side of the beam, as shown in Figure 2(c). A visible laser line was projected to the intact surface of the beam using a class-2 line laser, Bosch GLL 50; the projected laser line is shown in Figure 2(d). The intact surface of the beam had a uniform background, without which the intensity profile of the target line associated with the projected laser line would not resemble a one-dimensional Gaussian distribution. A solid straight line was drawn on the intact surface along its length to assist in positioning the beam and line laser so that the projected laser line could be aligned with the length of the beam. Note that one could use a level to position the beam and line laser, with which the solid line would not need to be drawn on the beam. The plane that was defined by the line laser and projected laser line was perpendicular to the intact surface. A digital camera, Photron AX200, was used to capture digital images of a portion of the projected laser line on the beam. The camera was placed in front of the beam with
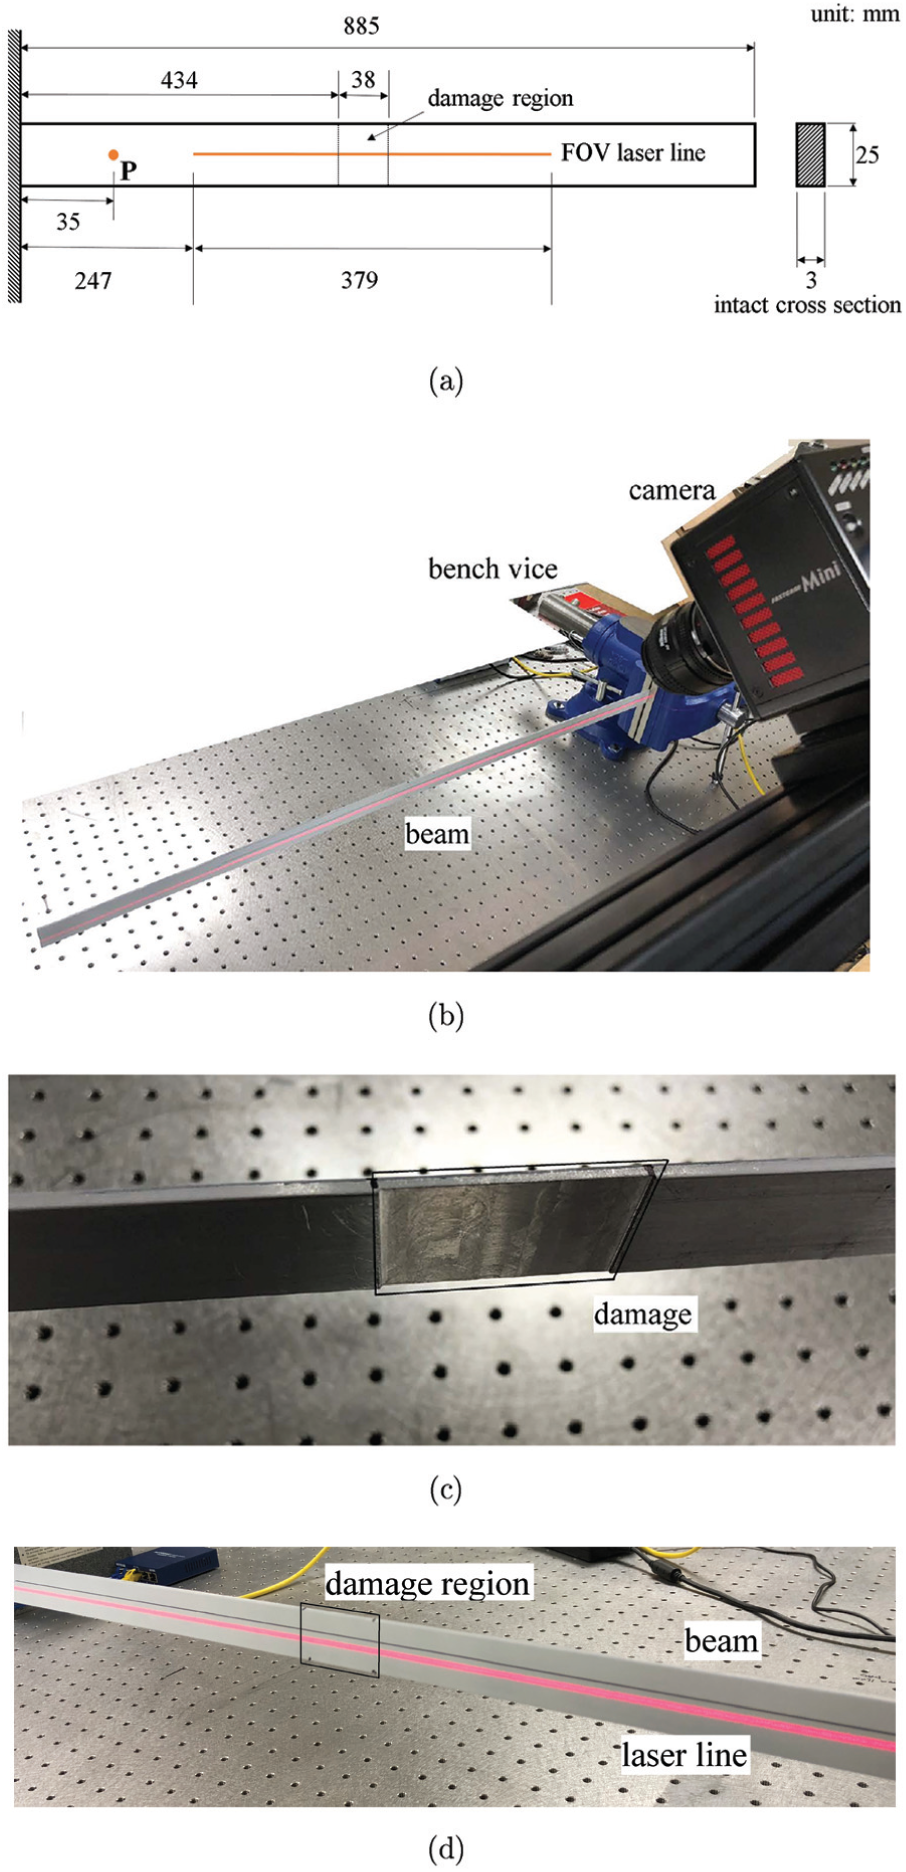
(a) Dimensions of the damaged aluminum cantilever beam, (b) the setup of the beam for experimental investigations, (c) damage in the form of a machined area on a side of the beam, and (d) the projected laser line along the length of the beam.
Laser-line-tracking results
A captured digital image of the target line is shown in Figure 3(a) and its measured intensity profile along
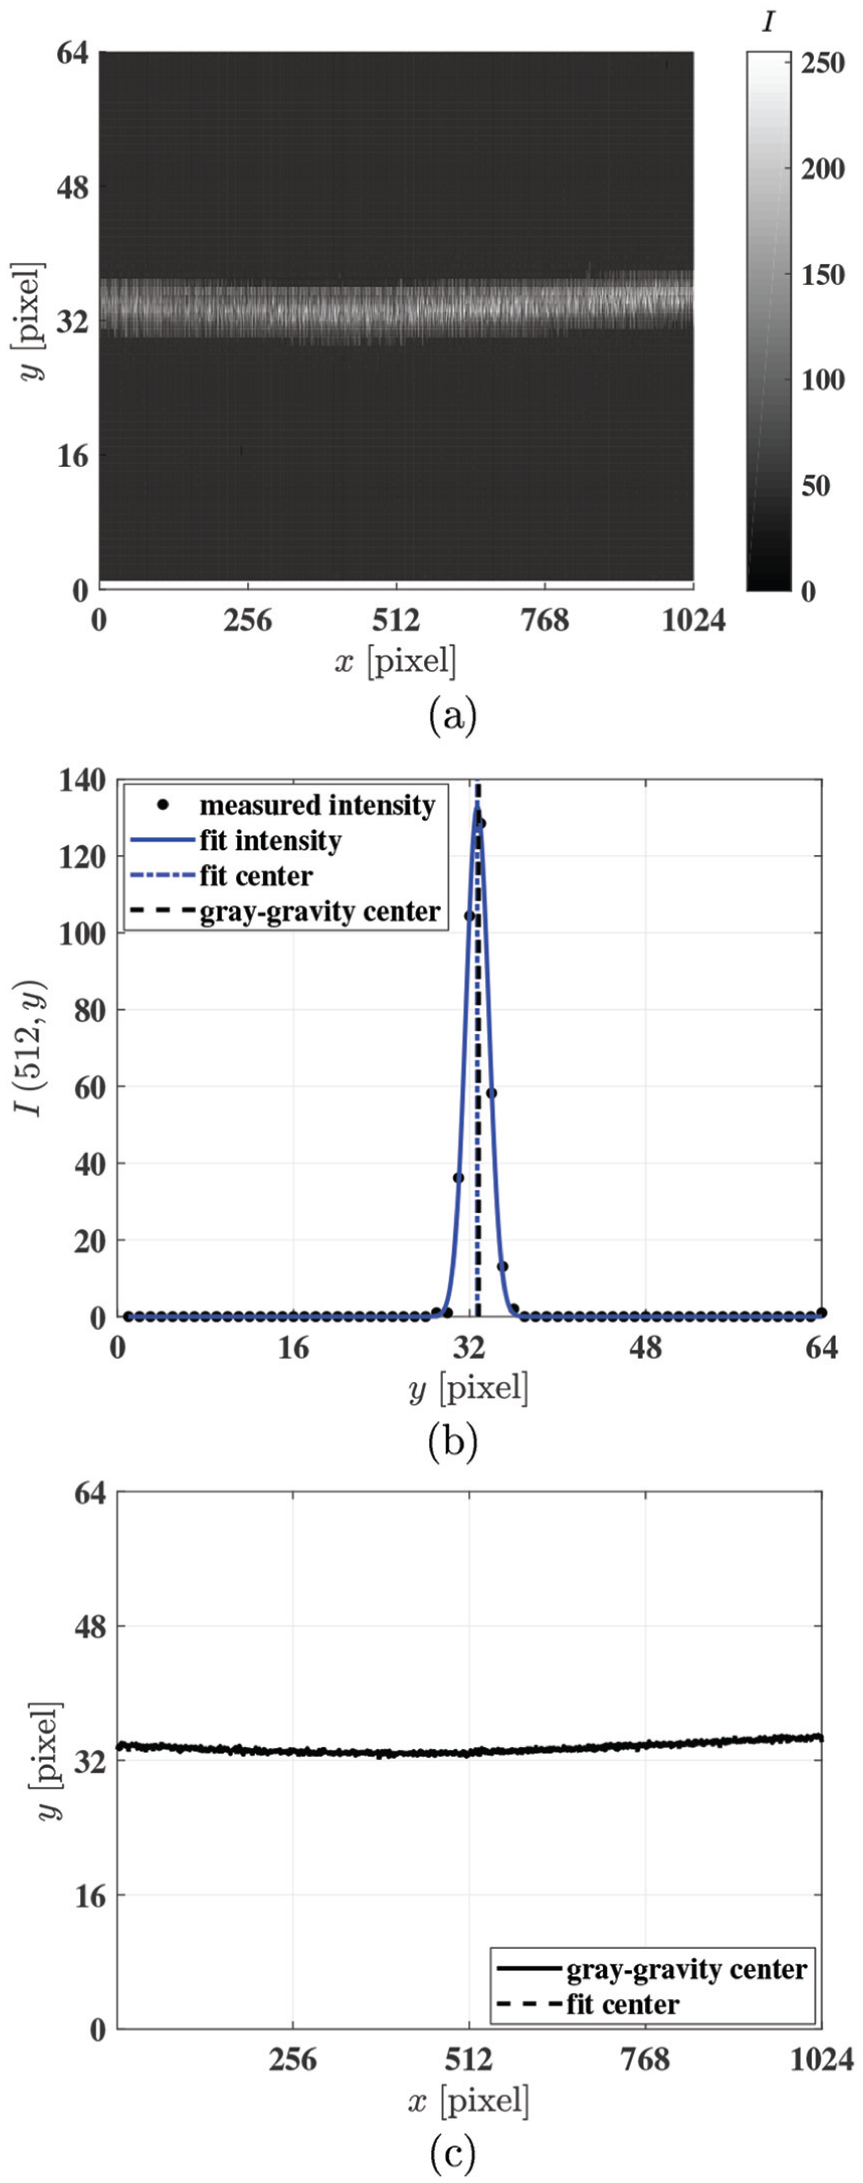
(a) Target line on a captured digital image; (b) measured and fit intensity profiles of the image in (a) at
A total of
Experimental modal analysis results
Experimental modal analysis was conducted on the target line with single impacts to
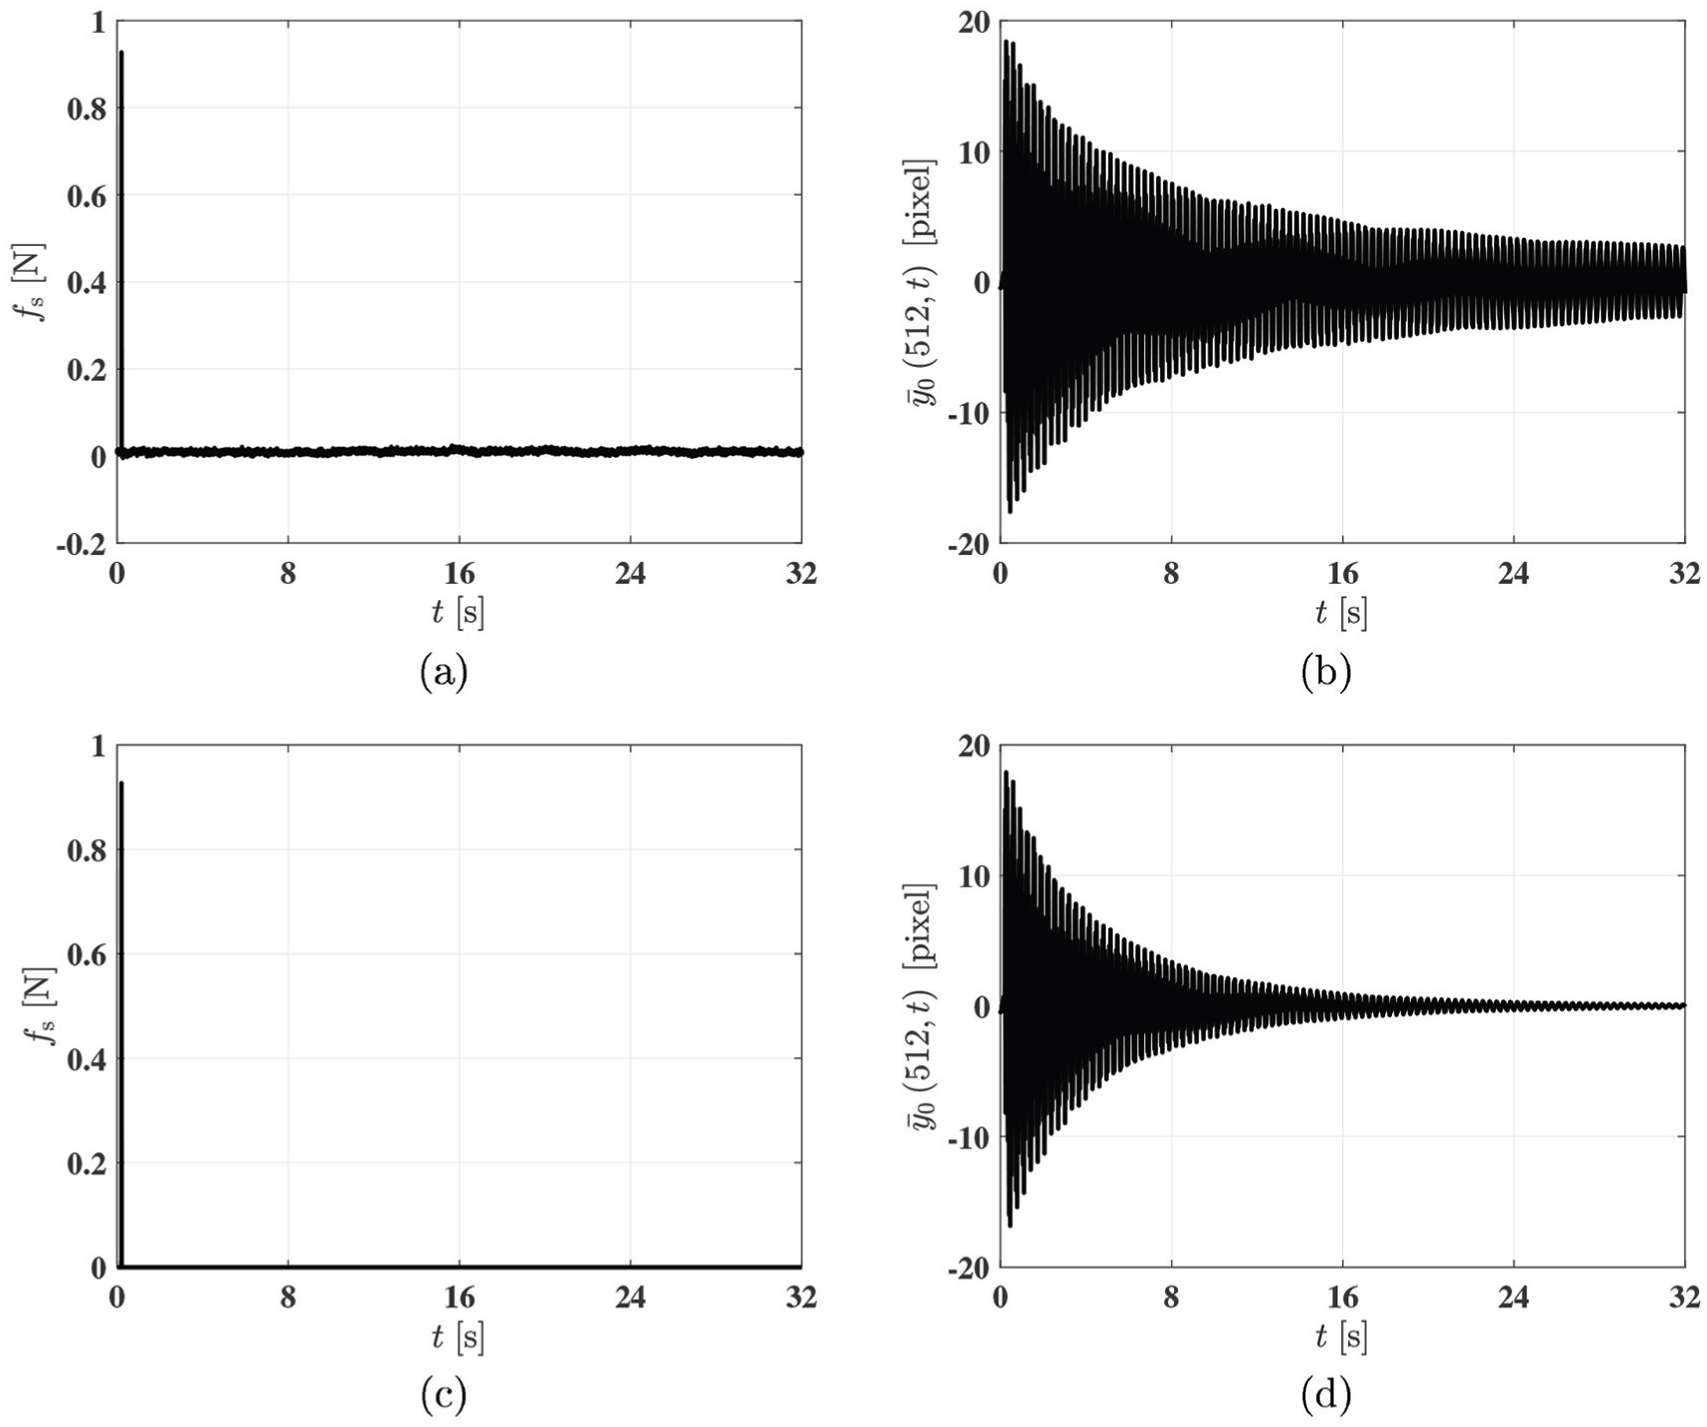
Measured (a)
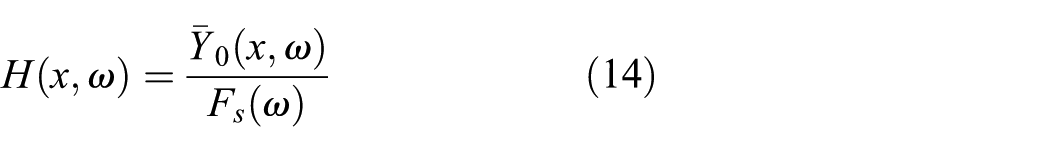
FRFs calculated from
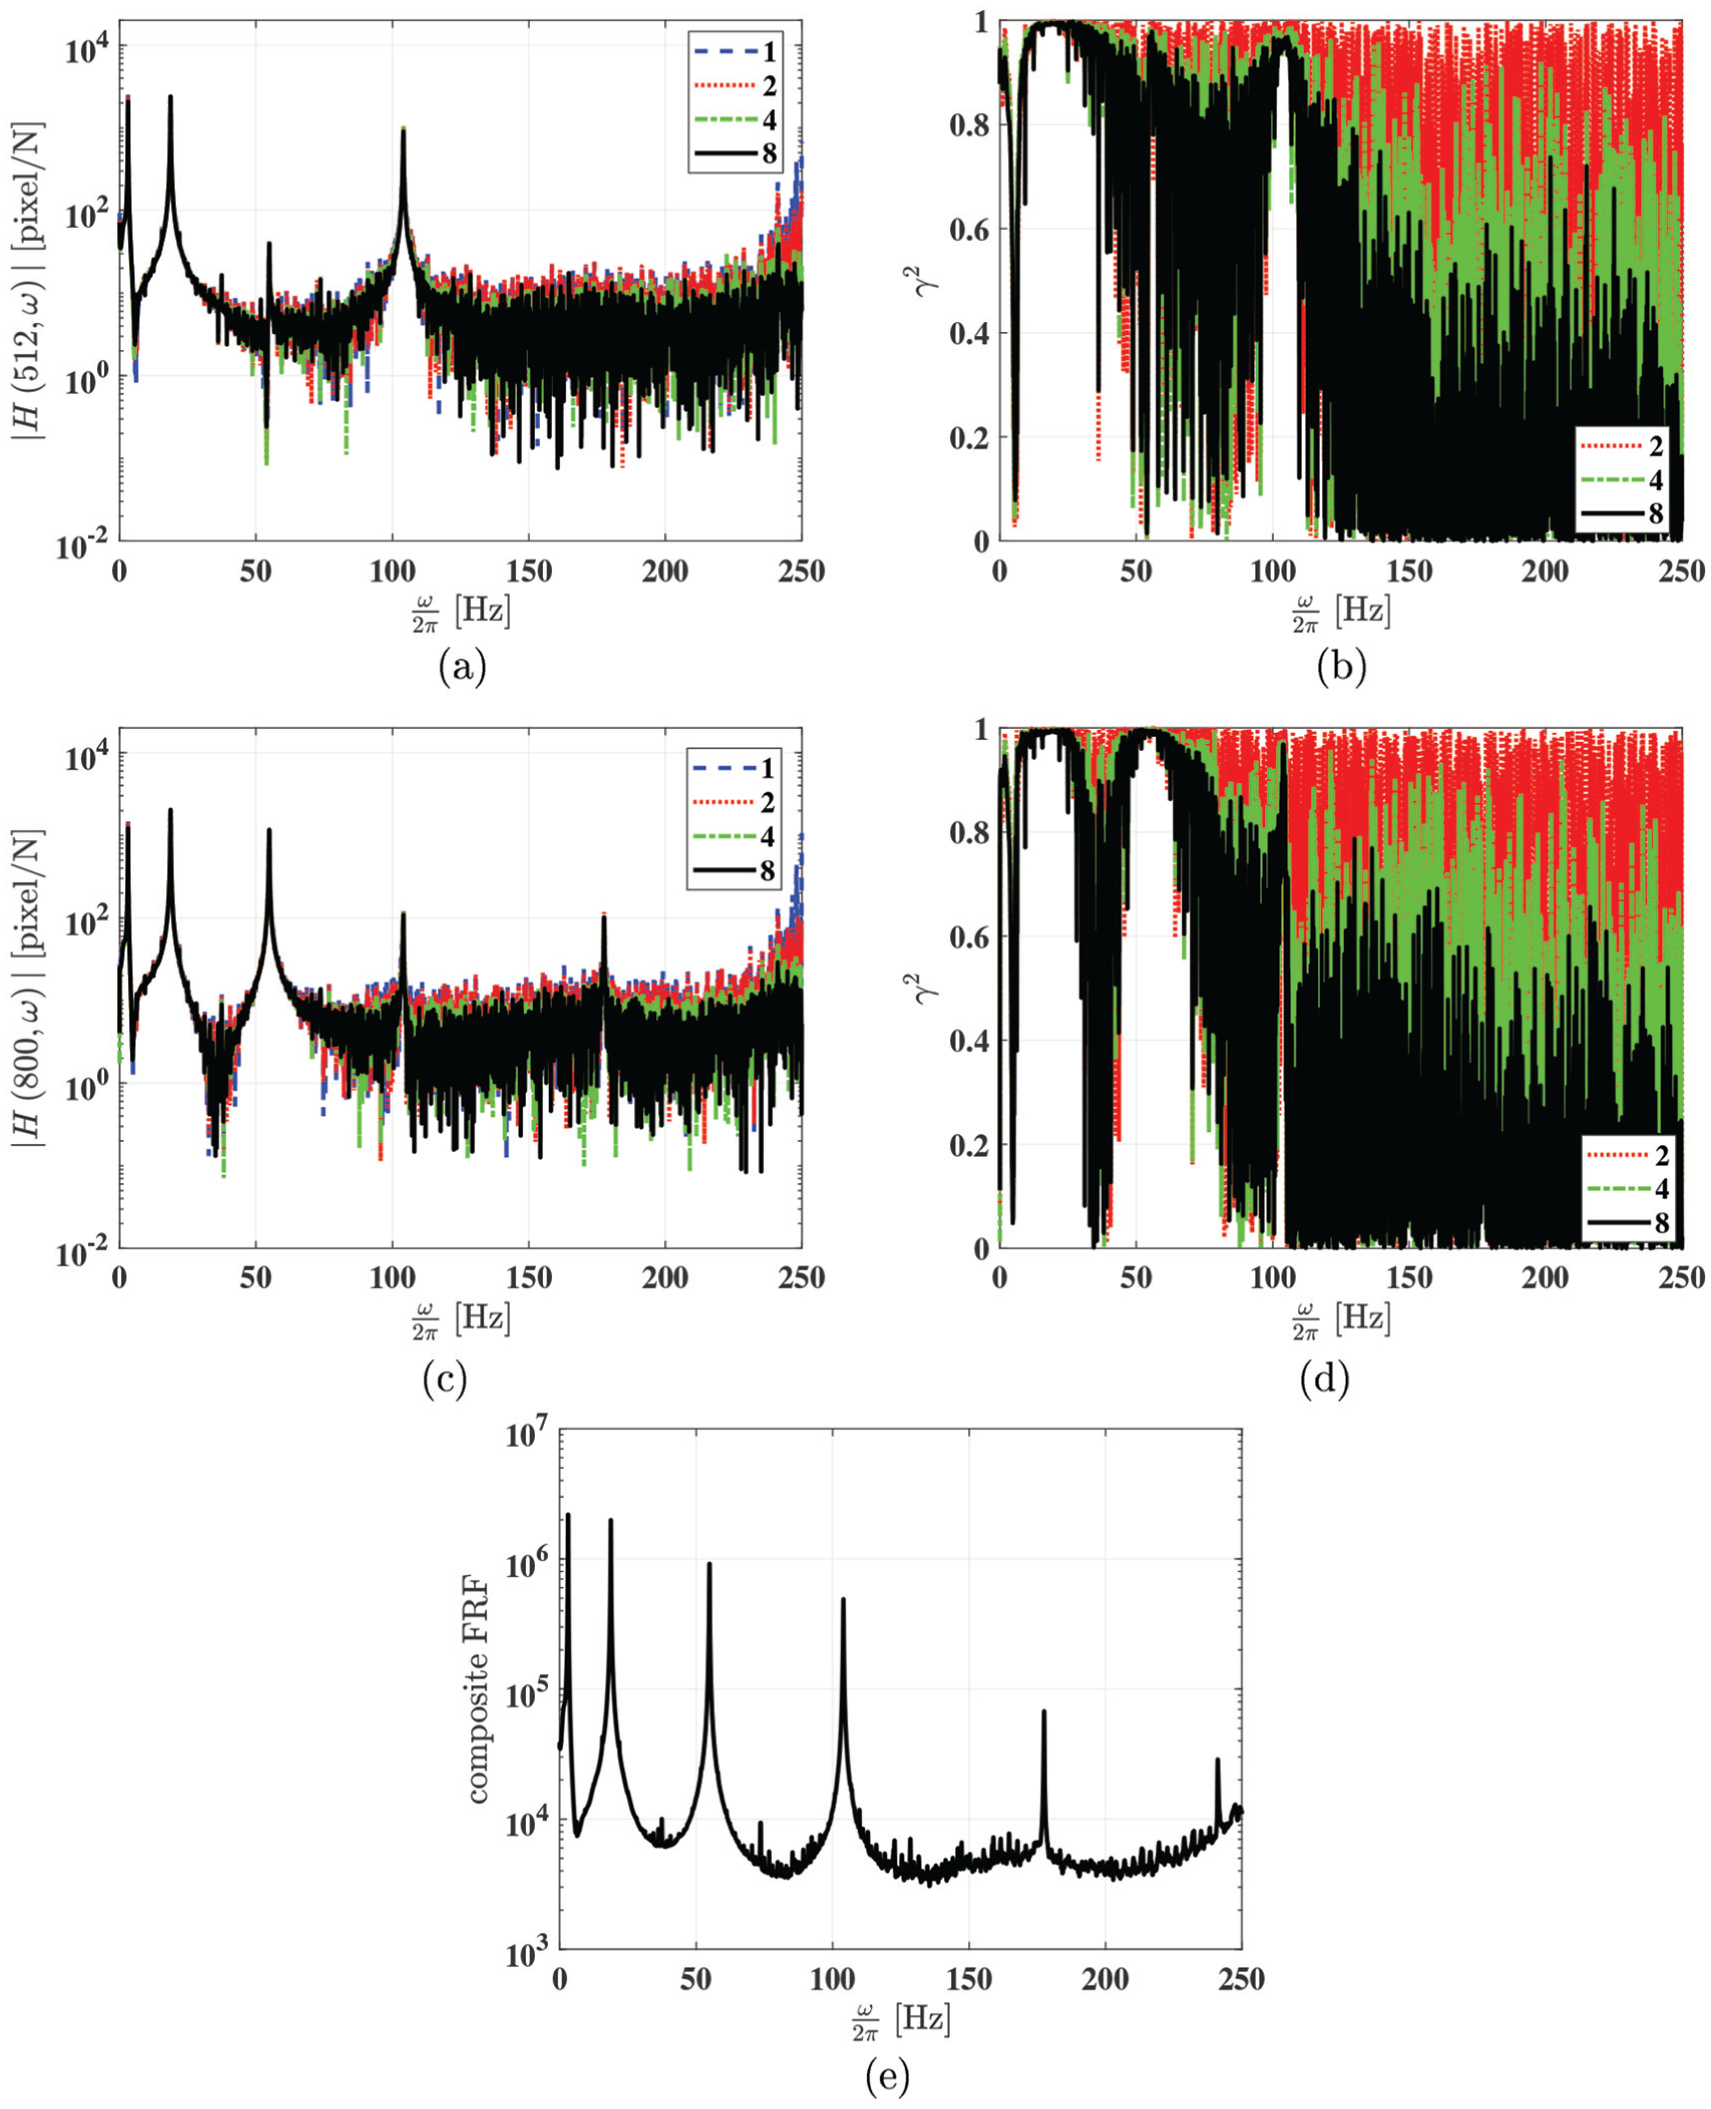
(a) Magnitude of
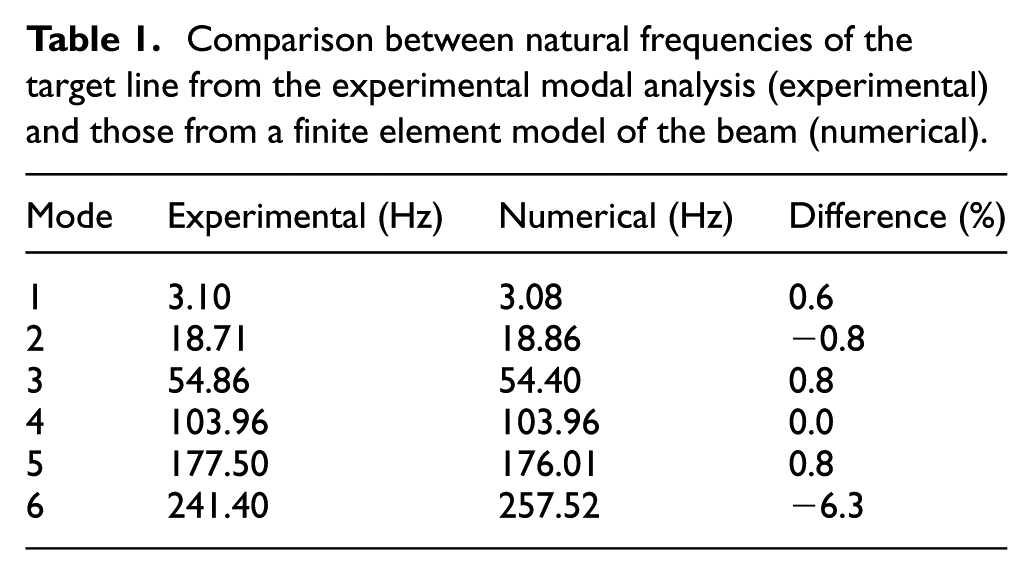
In order to better identify modes of the target line, a composite FRF, that is, the sum of magnitudes of available FRFs, was calculated and shown in Figure 5(e), where six peaks could be identified. A total of
Comparison between natural frequencies of the target line from the experimental modal analysis (experimental) and those from a finite element model of the beam (numerical).
Mode shapes from the finite element model of the beam along the FOV laser line are shown in Figure 6, and those of the target line were mapped to the beam along the FOV laser line and shown in Figure 6. A modal assurance criterion (MAC) matrix between the mode shapes from the finite element model and those of the target line is listed in Table 2. Diagonal entries of the MAC matrix were all over
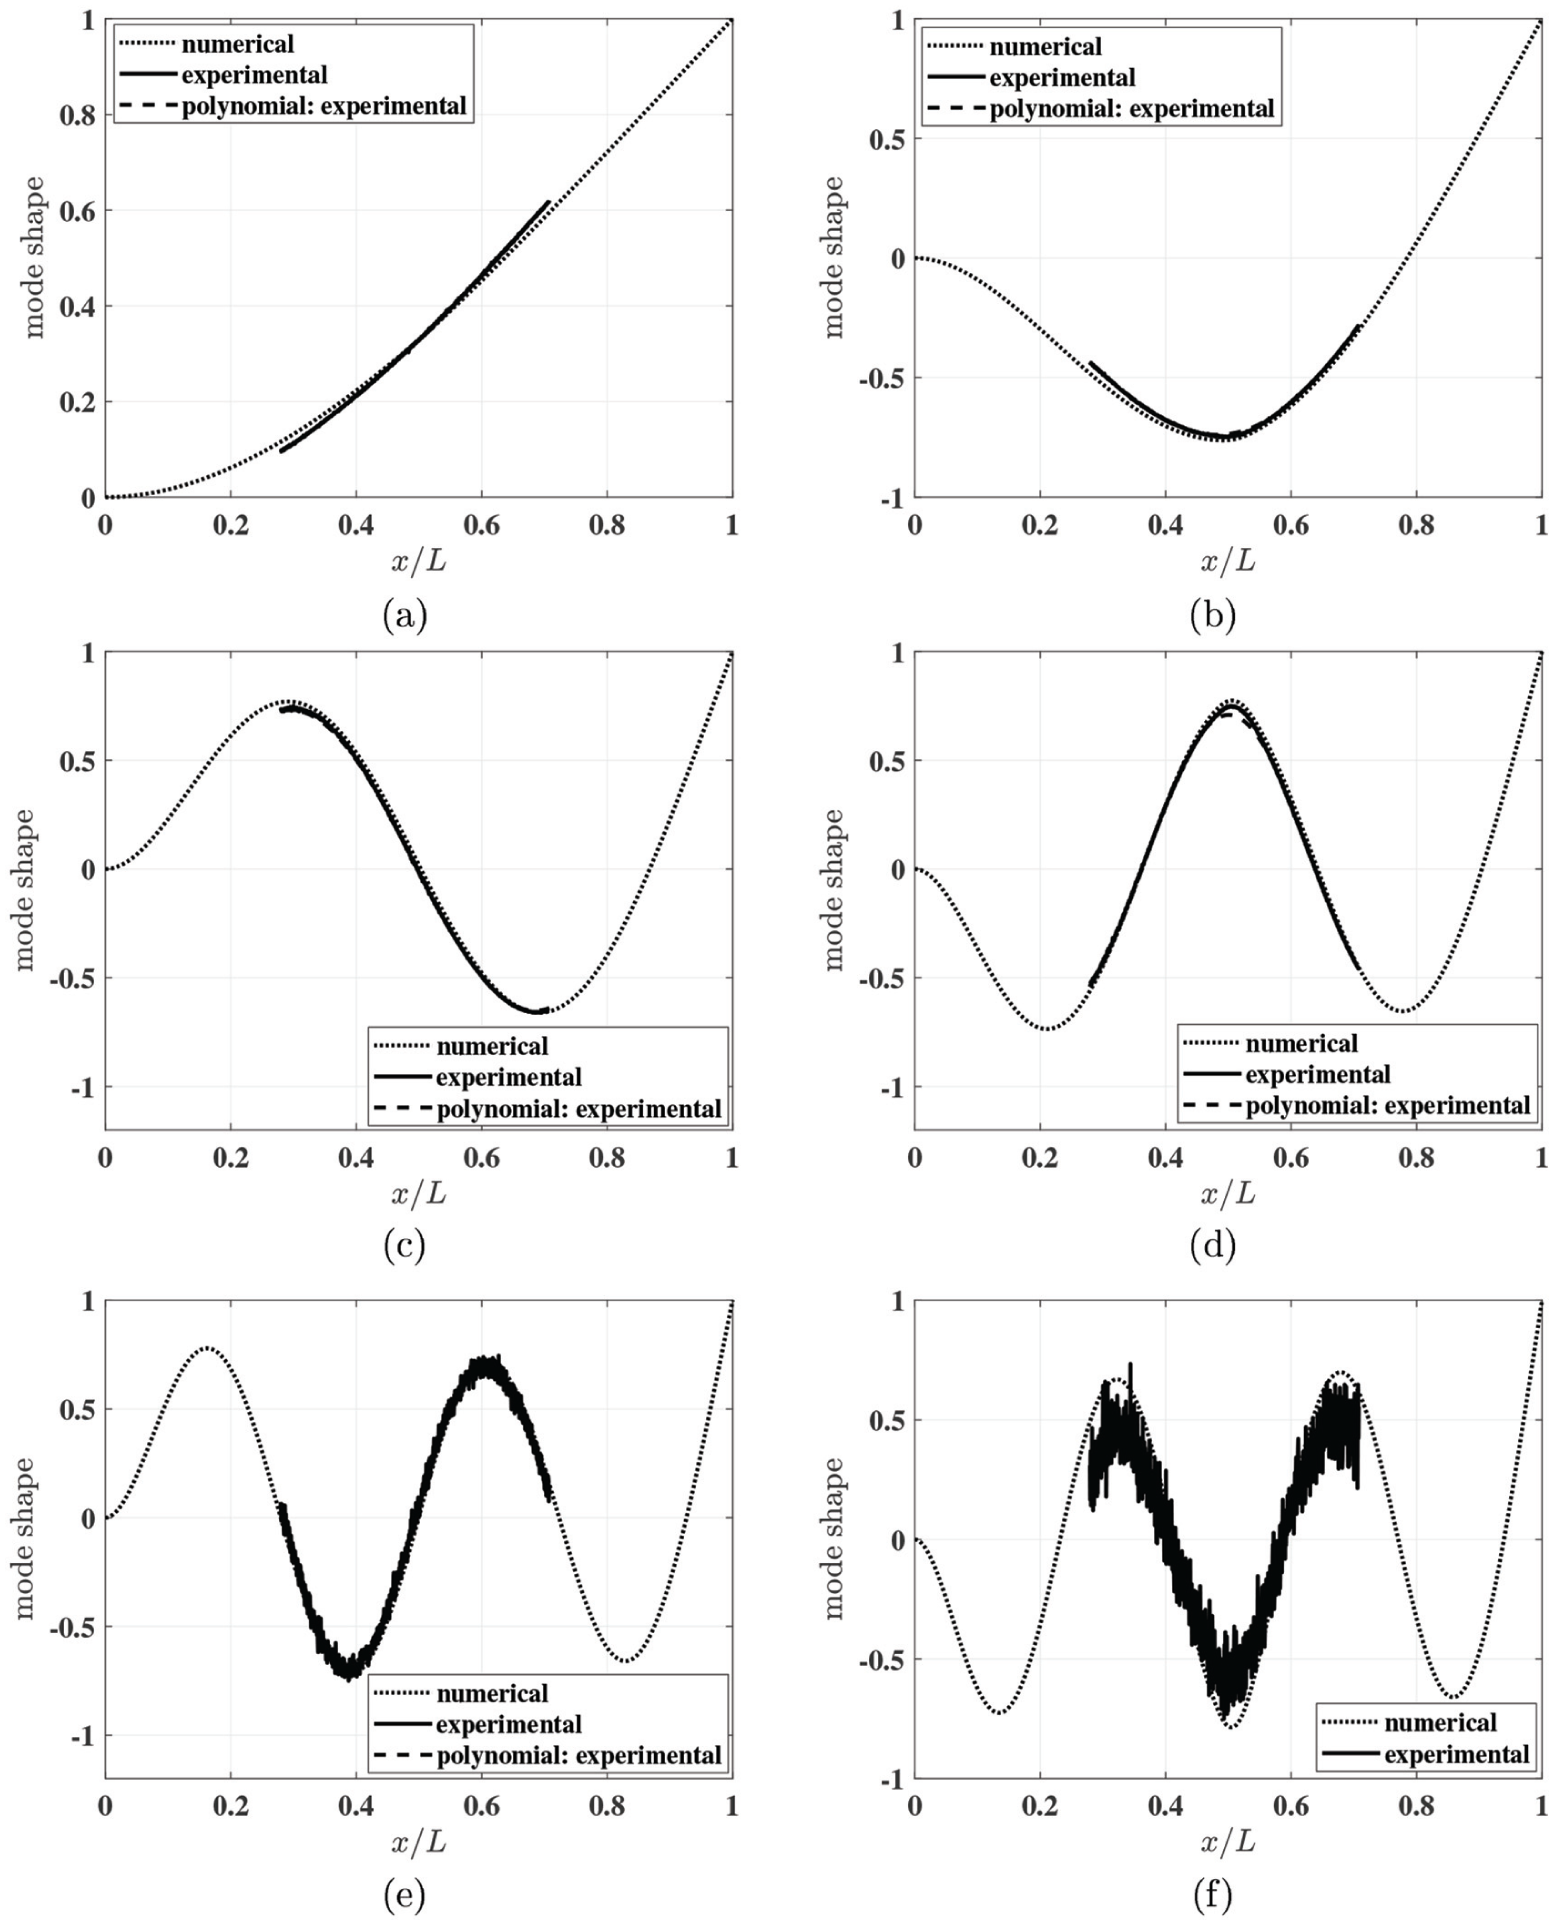
Mode shapes from the finite element model of the beam (numerical), mapped mode shapes of the target line (experimental), and mapped mode shapes from polynomials that fit the mode shapes of the target line (polynomial: experimental) associated with the (a) first, (b) second, (c) third, (d) fourth, (e) fifth, and (f) sixth modes.
Entries of the MAC matrix in percent between the first six mode shapes of the target line from the experimental modal analysis and those from the finite element model along the FOV laser line.
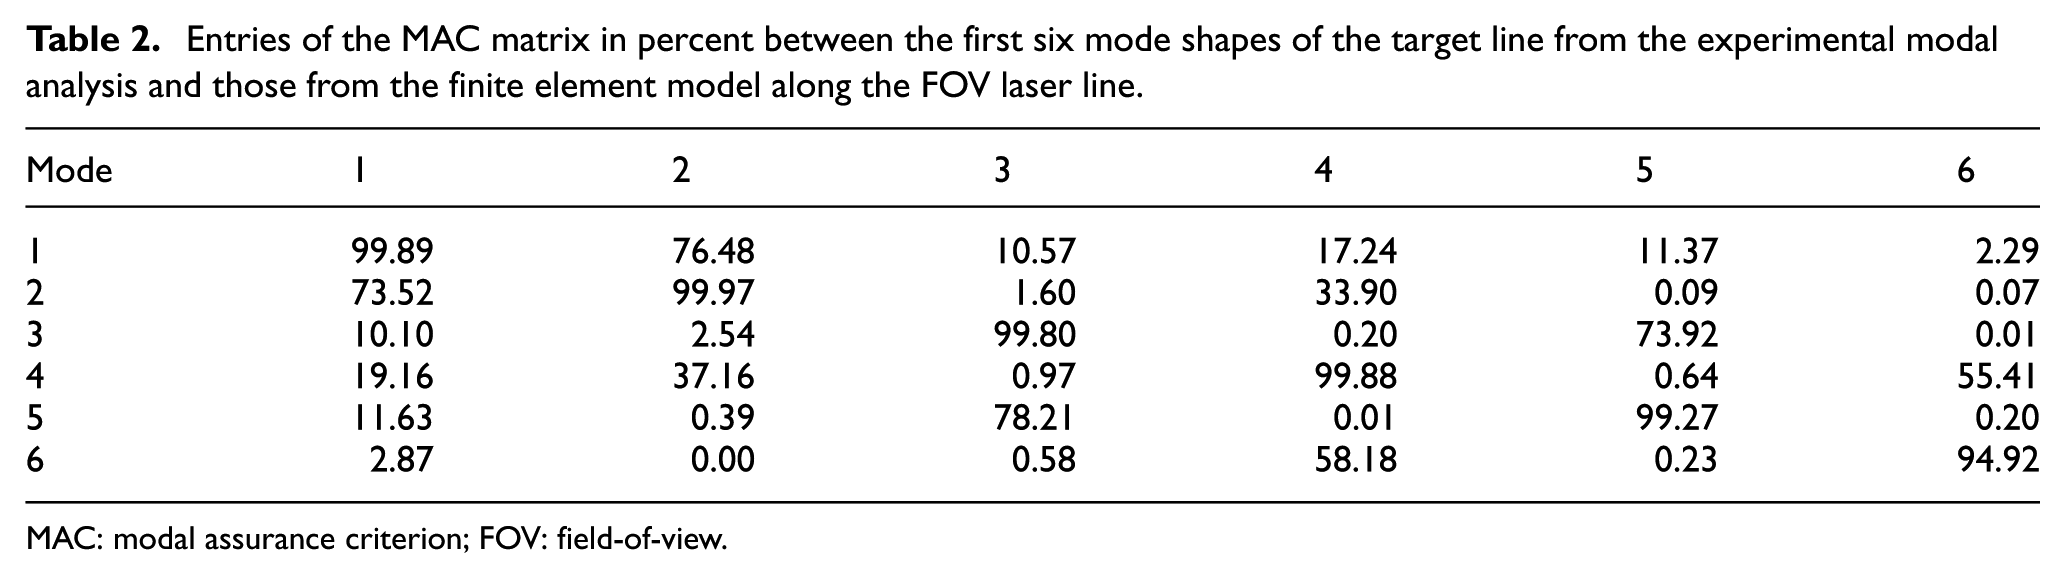
MAC: modal assurance criterion; FOV: field-of-view.
Structural damage identification results
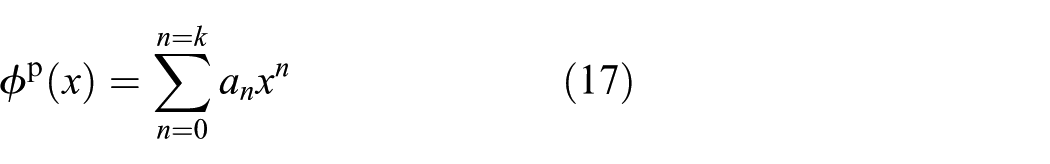
The first five mode shapes of the target line were fit by polynomials with proper orders determined based on
Proper orders of polynomials that fit measured mode shapes of the target line (experimental) and those from the finite element model along the FOV laser line (numerical).
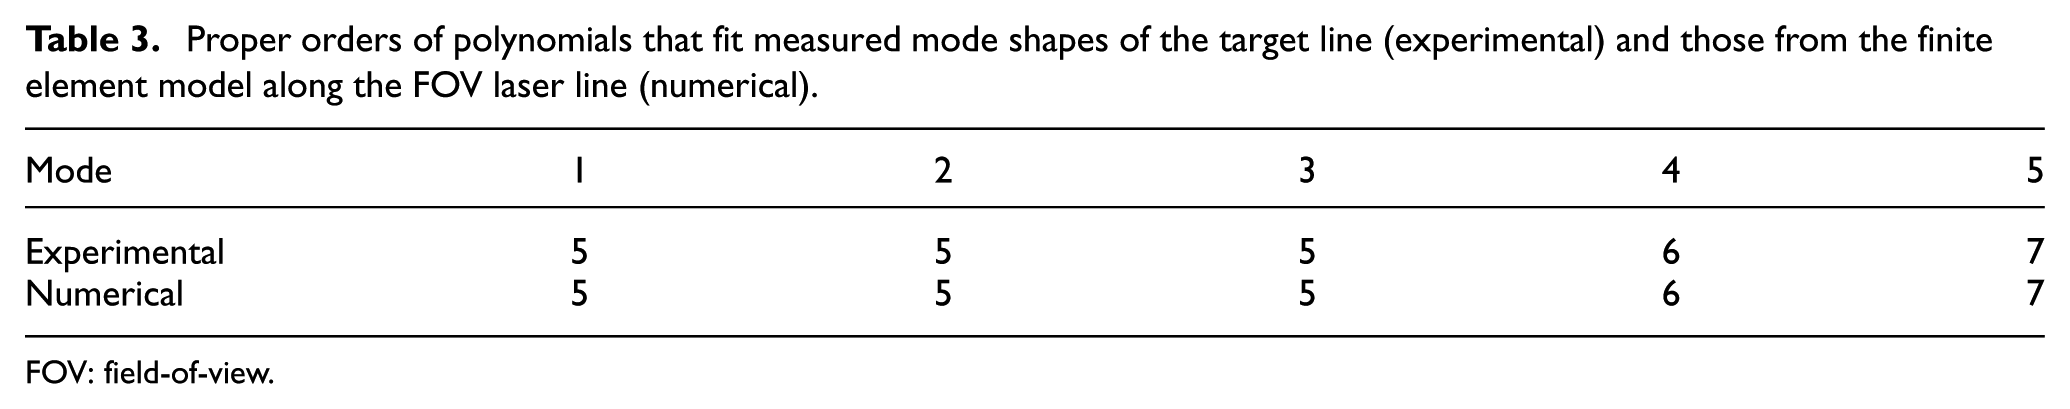
FOV: field-of-view.
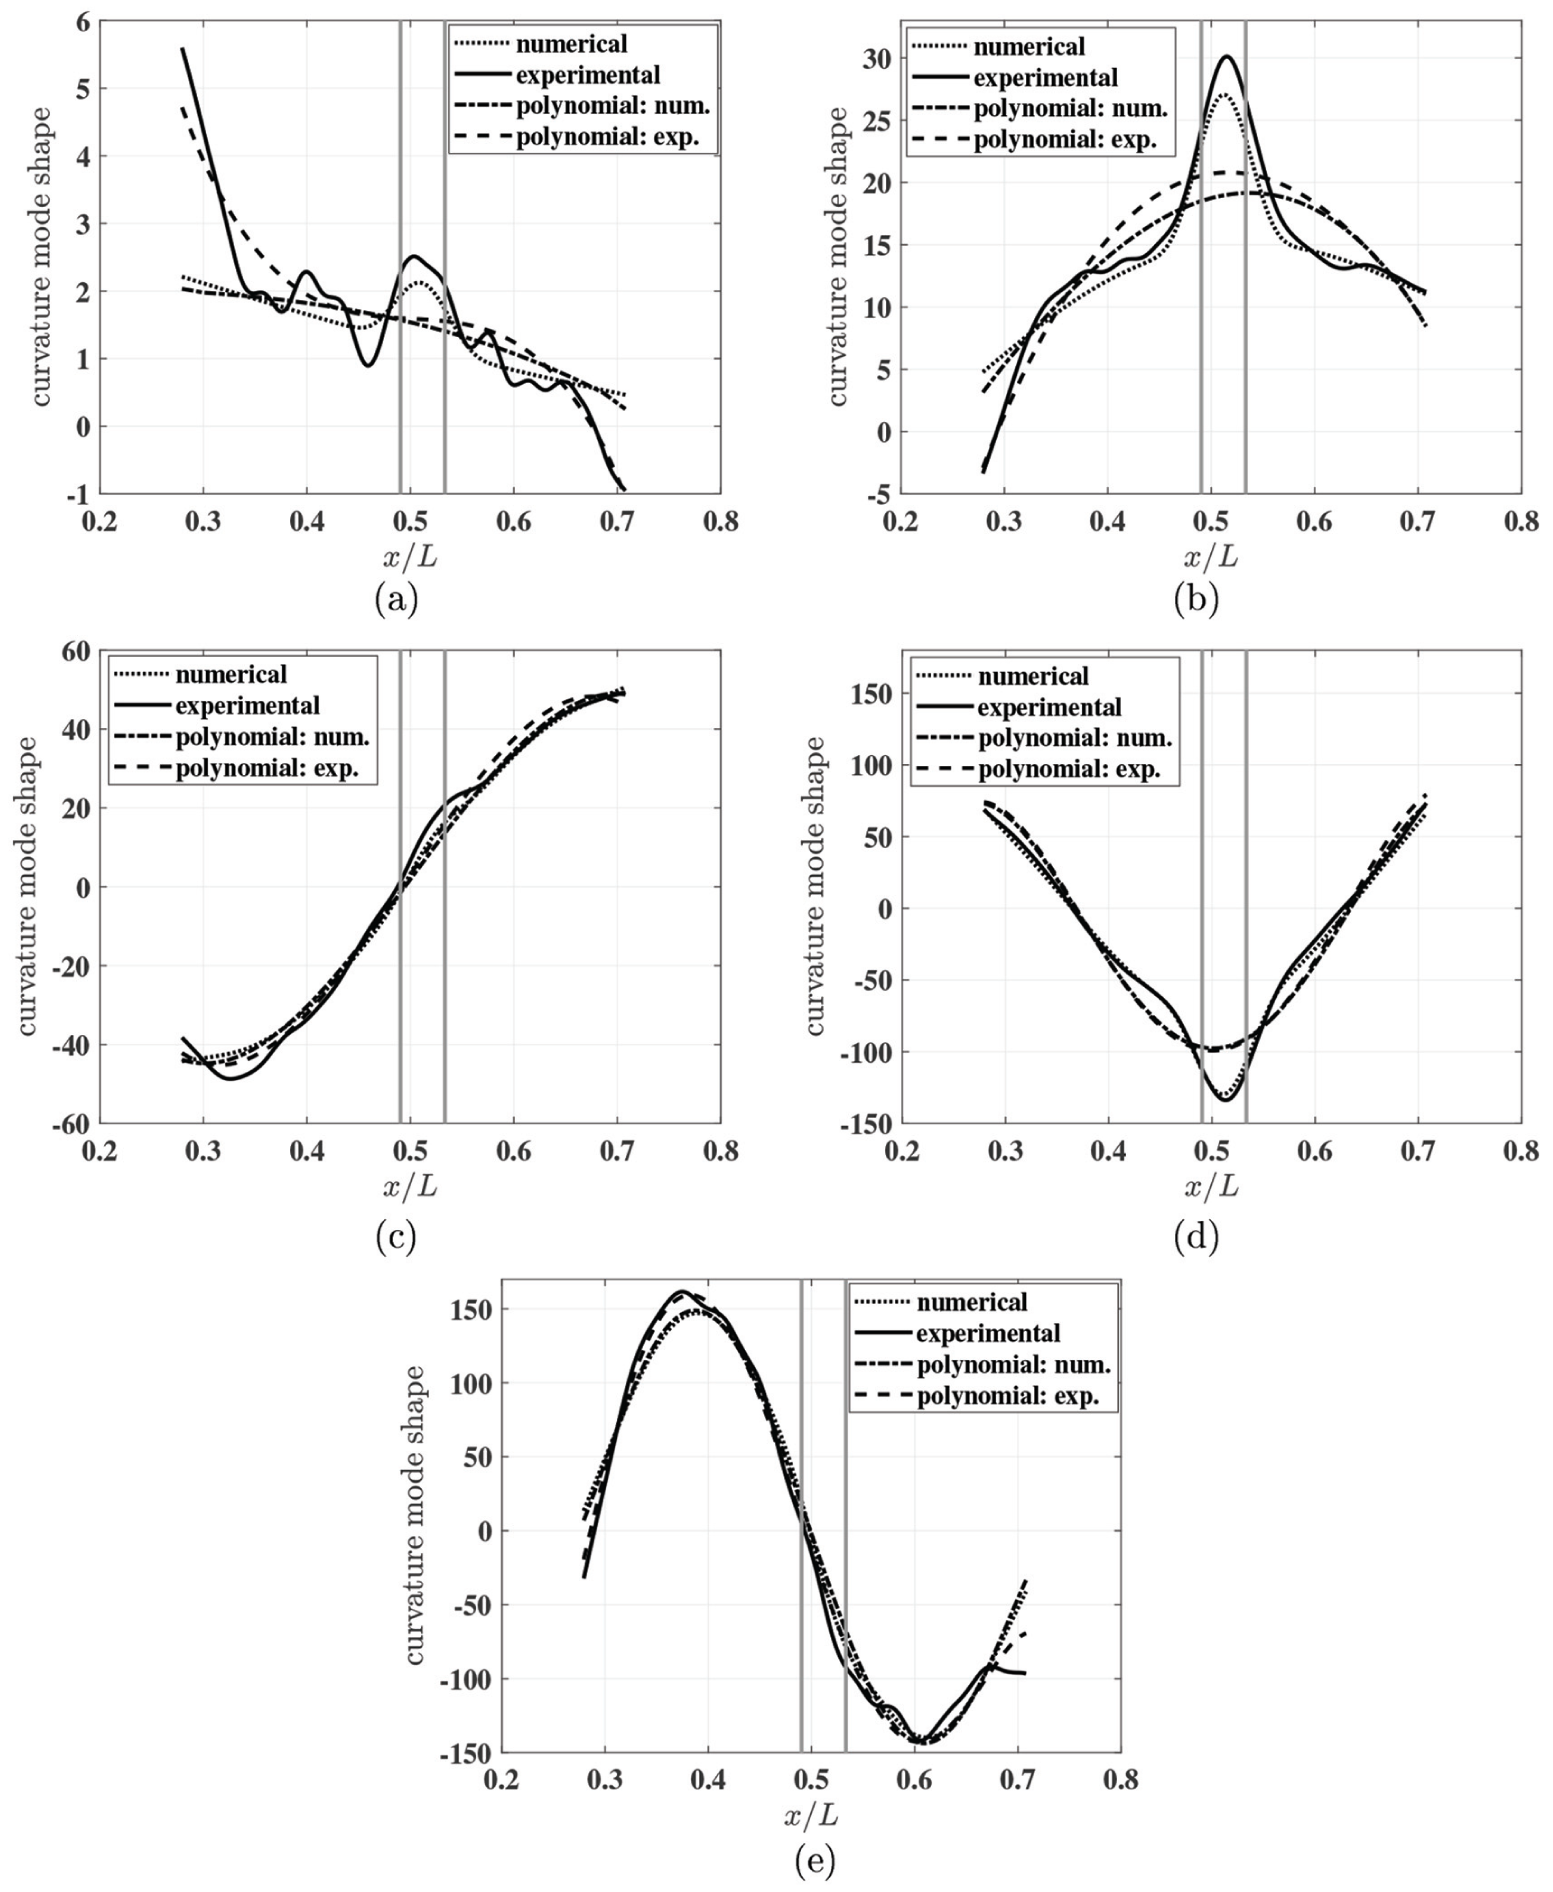
Curvature mode shapes from the finite element model of the beam (numerical), mapped curvature mode shapes of the target line (experimental), and mapped curvature mode shapes from polynomials that fit the mode shapes of the target line (polynomial: exp.) and those from the finite element model (polynomial: num.) associated with the (a) first, (b) second, (c) third, (d) fourth, and (e) fifth modes. The locations of the damage ends are indicated by gray lines.
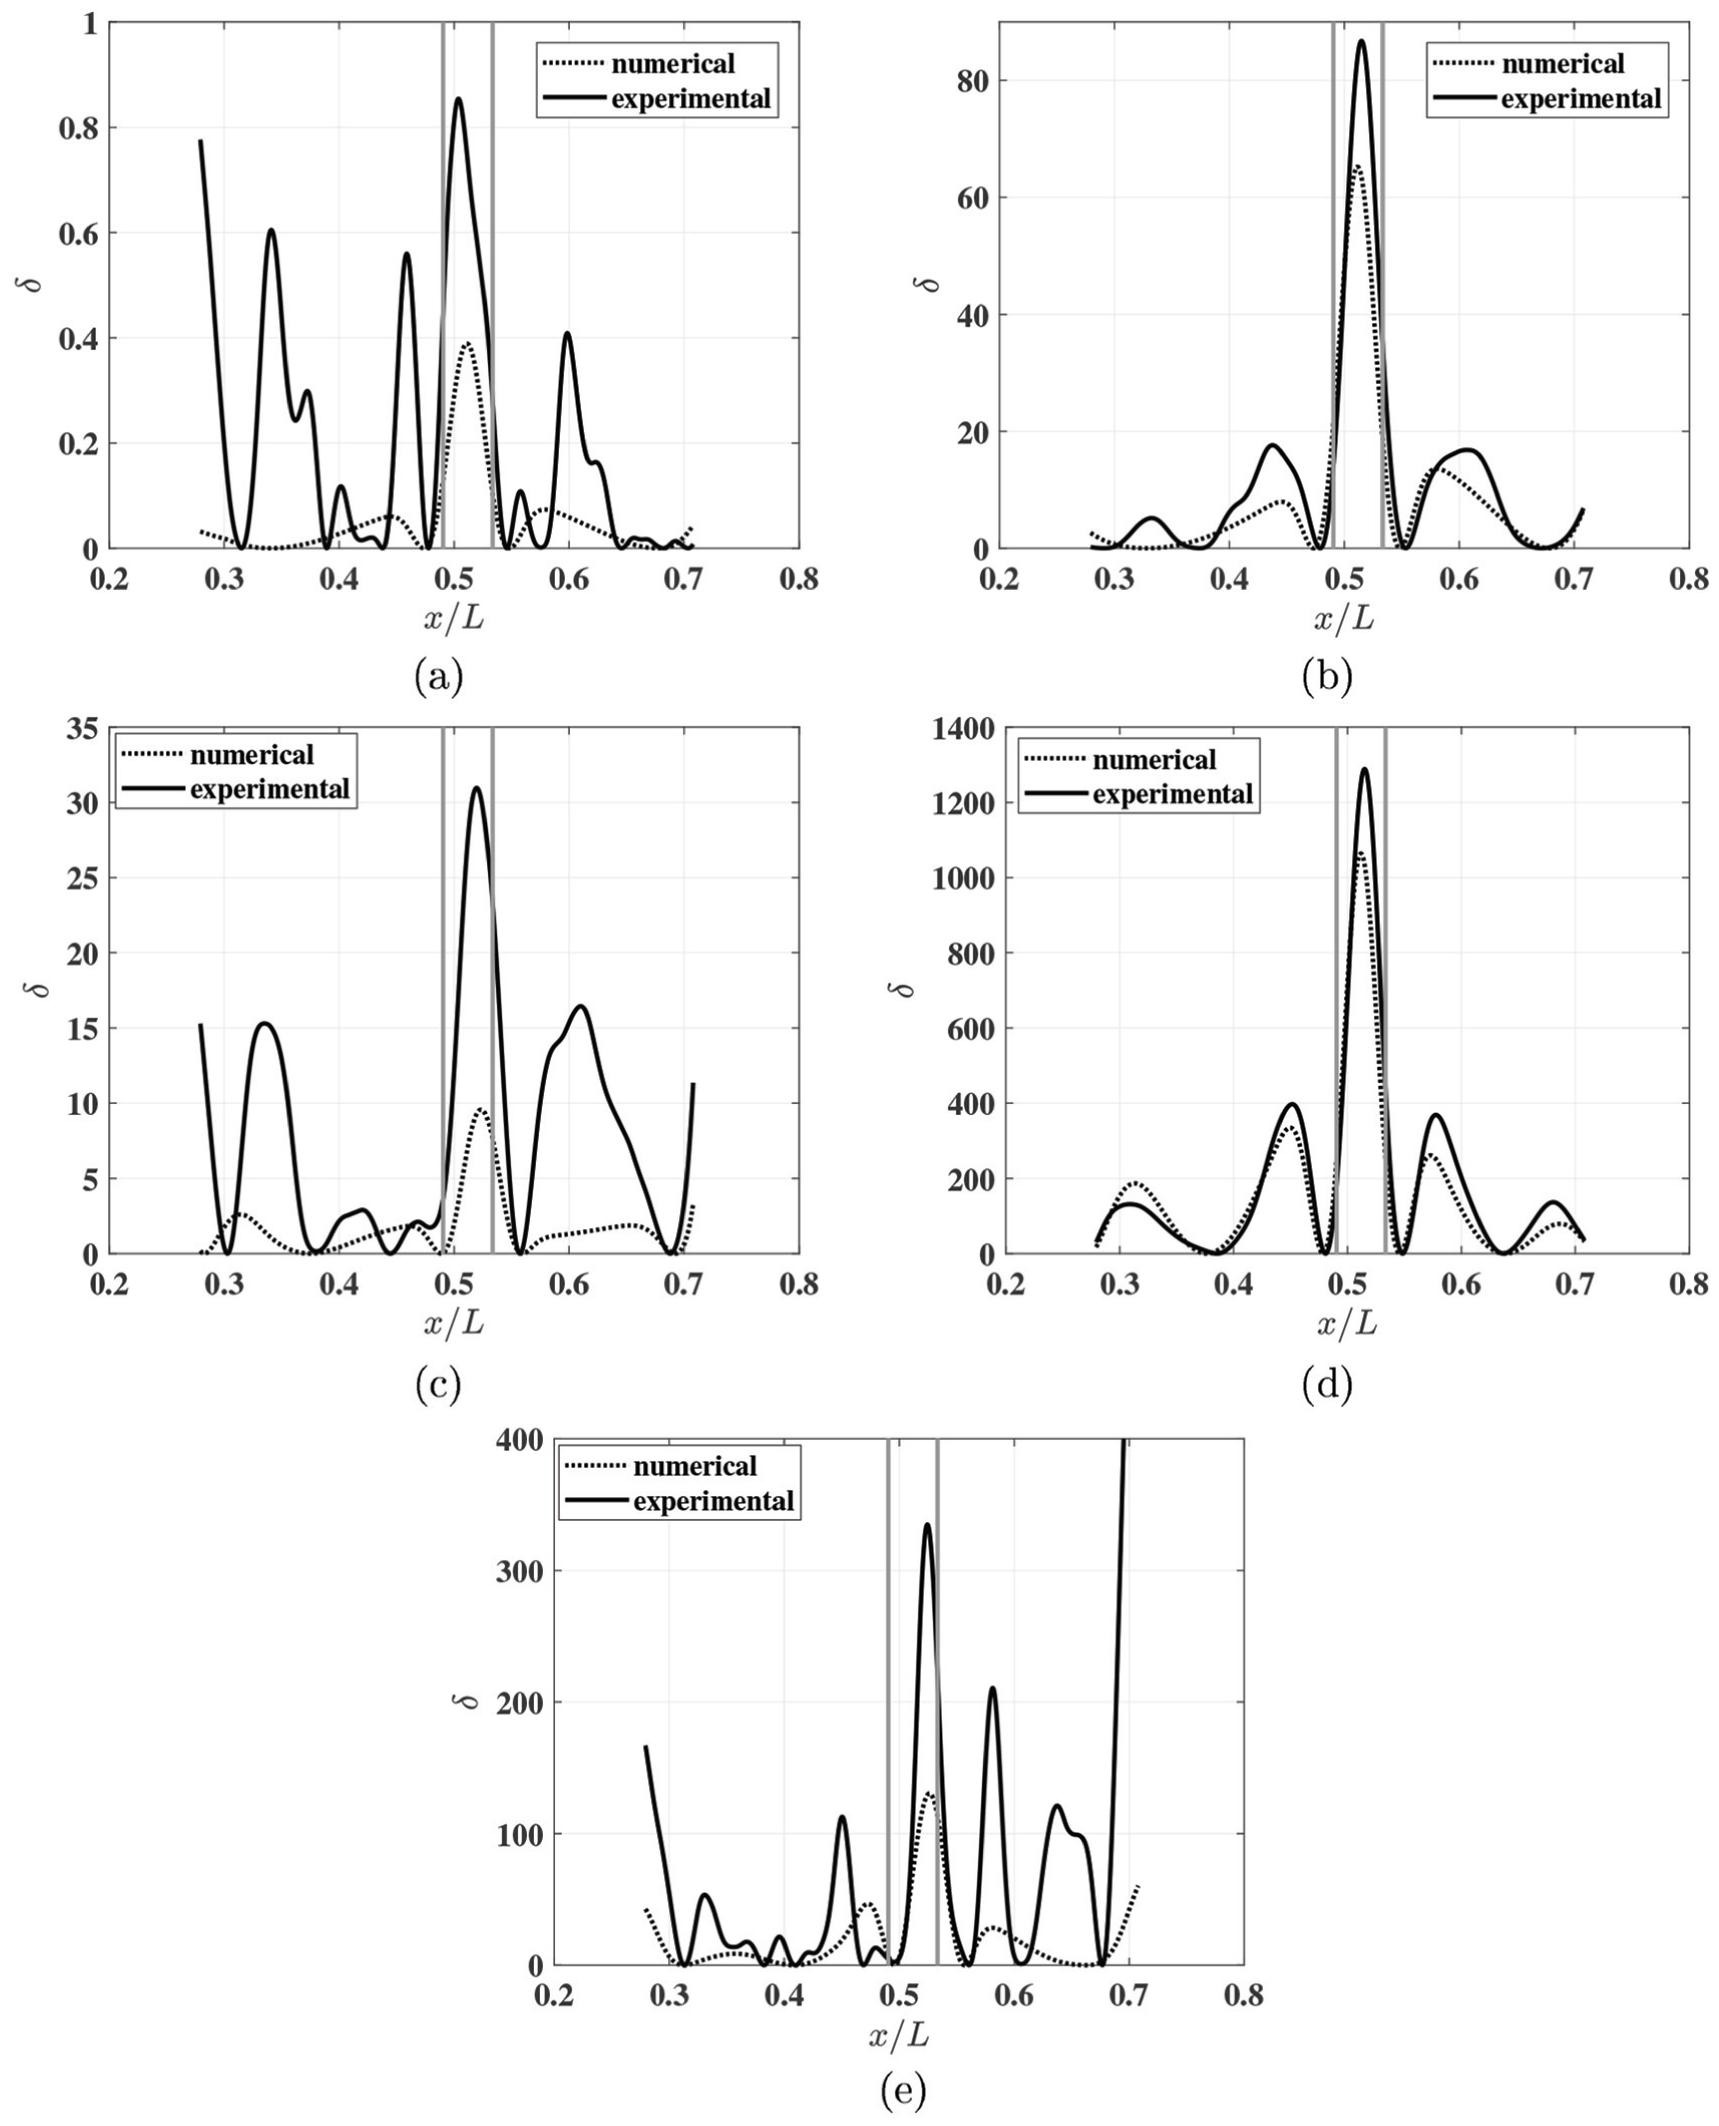
CDIs associated with the (a) first, (b) second, (c) third, (d) fourth, and (e) fifth modes from the finite element model of the beam (numerical) and those of the target line (experimental). The locations of the damage ends are indicated by gray lines.
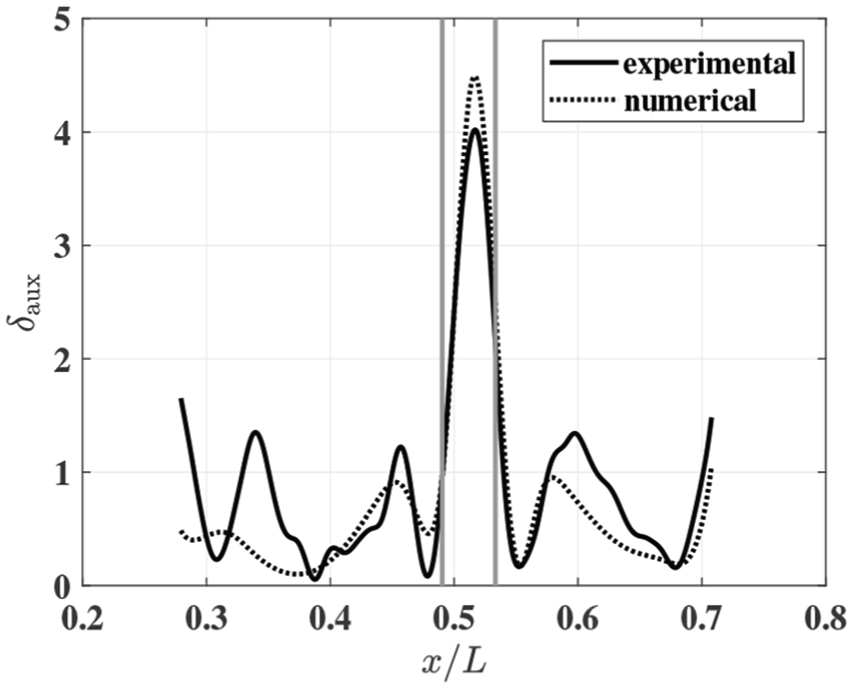
Auxiliary CDIs associated with CDIs from the finite element model of the beam (numerical) and experimental modal analysis of the target line (experimental). The locations of the damage ends are indicated by gray lines.
The first five mode shapes of the beam along the FOV laser line from the finite element model were then fit by polynomials with proper orders determined based on
Conclusion
A photogrammetry-based structural damage detection method is developed and experimental investigations of the method were conducted on a damaged beam. In the developed method, a digital camera is used to measure vibration of a structure by tracking a projected laser line. Structural damage can be detected by identifying anomalies in mapped curvature mode shapes of a target line that corresponds to the projected laser line. It was experimentally shown that a measured intensity profile of a target line on a digital image, which corresponded to a projected laser line, resembled a one-dimensional Gaussian distribution and centers of measured intensity profiles of the target line could be efficiently and accurately tracked using the gray-gravity rule in a laser-line-tracking technique. An experimental modal analysis technique is proposed to estimate modal parameters of a target line on a series of digital images captured by a camera. It was experimentally shown that estimated natural frequencies and mapped mode shapes of the target line compared well with those from a finite element model of the damaged beam. Anomalies in curvature mode shapes of the target line could be observed by comparing them with those from polynomials that fit the mode shapes of the target line. Using CDIs that quantify the anomalies in mapped curvature mode shapes, the damage of the beam was accurately detected in neighborhoods with consistently high CDI values corresponding to available mode shapes. Experimental damage detection results compared well with numerical ones from the finite element model. The developed damage detection method has two limitations in practice. One is that it requires a uniform background where a projected laser line exists, and the other is that it requires a high-power line laser in cases whose illumination environments are noisy.
Footnotes
Declaration of conflicting interests
The author(s) declared no potential conflicts of interest with respect to the research, authorship, and/or publication of this article.
Funding
The author(s) disclosed receipt of the following financial support for the research, authorship, and/or publication of this article: The author is grateful for the faculty startup support from the Department of Mechanical and Materials Engineering at the University of Cincinnati.