
Abstract
Although the cage slip of cylindrical roller bearings has been measured and studied experimentally, it is difficult to use current experimental measurement to detect the cage slip of the bearing in actual service or engineering environment. The problem is attributed to the limit on the space for current test instruments that can be installed arbitrarily in laboratory, but not in actual environment. A novel measurement based on strain detection is presented. This measurement can be used to obtain the cage slip of the bearing in service or large bench test. The technique is demonstrated and validated in principle by an experimental system. The system is developed to obtain the strain signal of the outer ring in loaded zone as well as the speed signal of the cage and the inner ring at the same time. Under given test load–speed conditions, the cage slip based on strain detection was compared with the cage slip based on speed detection. Experimental results showed that cage slip ratio curves based on strain responses agreed very well with those based on speed signals. In this way, it is revealed that frequency characteristics of strain signals can be used to obtain internal cage slip of cylindrical roller bearings.
Keywords
Introduction
Rolling element bearings are key components of rotating machinery. The cylindrical roller bearing is the most preferred choice to support and position shaft when only the radial load is involved and a higher load-carrying capacity is required. It is presumed to operate by virtue of pure rolling motions between the contacting surface of the rollers and raceways where the distance between rollers is maintained by the cage. However, in some situations of high speed and light loads such as the main shaft bearings in aircraft gas turbines, the essential epicyclical considerations of the cage and roller motion cannot be achieved. In those applications, the cage and roller assembly often travels at speeds lower than the predicted epicyclical values and so resulting in skidding of the cage and roller slip. The frequent occurrence of skidding causes wear on the rolling contact surfaces and results in smearing type of surface damage. 1 This damage can ultimately lead to the premature failure of the bearing.
Several investigators have worked on cage slip in roller bearings theoretically and experimentally. In previous studies,2–9 the influence of different factors on cage slip has been examined. The factors included the radial load, shaft speed, the number of rollers, out-of-roundness, the presence of misalignment, viscosity and temperature of the oil, traction force, and so on. Previous studies10–13 showed the effect of cage slip on the defect frequency response, bearing stiffness, and bearing damage. Markho et al. 14 and Chen et al. 15 observed a constant cage slip but a substantial, skew-symmetric variation in roller slip for different angular positions of rollers. In experimental investigations of the cage slip, how to measure the cage slip is a significant problem. Boness 4 monitored cage and roller speeds by using magnetic transducers and electronic pulse counters. O’Brien and Taylor 6 recorded the passing of cage rivets with a magnetic pick-up to obtain the cage speed. Ford and Foord 7 measured shaft and cage speeds optically by counting pulses from retro-reflective marks on the shaft and cage. Selvaraj and Marappan 8 used three proximity speed sensors to obtain the speed of inner race, cage, and roller. The speed sensor consisted of an optoelectronic sensor and a grating disk. Prashad 10 measured the acceleration signals of the bearing and characterized the cage slip using the frequency of the signals. Markho et al. 14 applied laser Doppler anemometer to measure the cage and roller speeds. Han et al. 16 pasted a reflective sheet on the cage and used the laser tachometer to determine the cage rotational speed as well as the cage slip.
Although the abovementioned instruments and experimental systems provide useful ways to investigate the cage slip and its influence factors in laboratories, an effective monitoring method of the cage slip for the bearings in real service is lacking. This may be partly attributed to the difficulties in modifying the bearing structures and applying sophisticated lab sensors in actual operation environment due to the space limit and safety issues.
In this study, a method capable of simultaneously measuring the cage slip of cylindrical roller bearing in actual operation was proposed. An experimental system was designed, and the effectiveness of proposed method was investigated.
Experimental
Measurement of cage slip based on strain detection
In general, the degree of cage slip of bearings is expressed by cage slip ratio. Most of the previous experimental studies determined the cage slip ratio by measuring the rotational speed of the cage. The cage slip ratio obtained by this way is derived in terms of kinematic and measured rotational speed of the cage

where
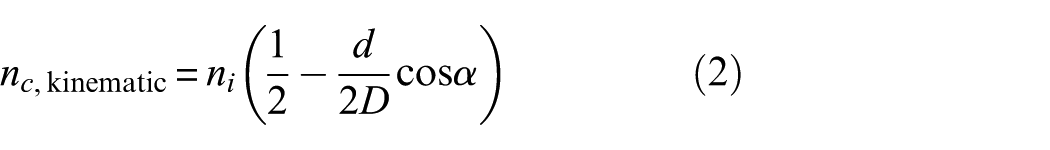
where
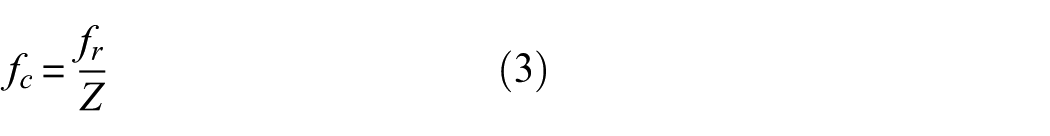
In order to measure the cage slip of bearings in service, a new method based on the detection of strain response is proposed. To get the strain signals, a notch is introduced to the outer ring as shown in Figure 1(a), which provides enough space to the strain gauge and makes it possible to detect the strain signal of the outer ring of the bearing. The principle of this method is shown in Figure 1(b). The part of outer ring with a notch can be considered as a beam structure fixed at both ends. According to beam theory, whenever there is a roller rolling over the notch position, a strain response can be produced at the outer surface of outer ring. Therefore, a cyclic strain response occurs when more rollers roll over the notch from the inner side raceway. The strain gauge is circumferentially placed at the center of the notch to obtain this strain response with better signal–noise ratio. The frequency characteristics of strain signals correspond to the actual rolling frequency of the roller through the notch, thus the actual cage rotational frequency can be calculated
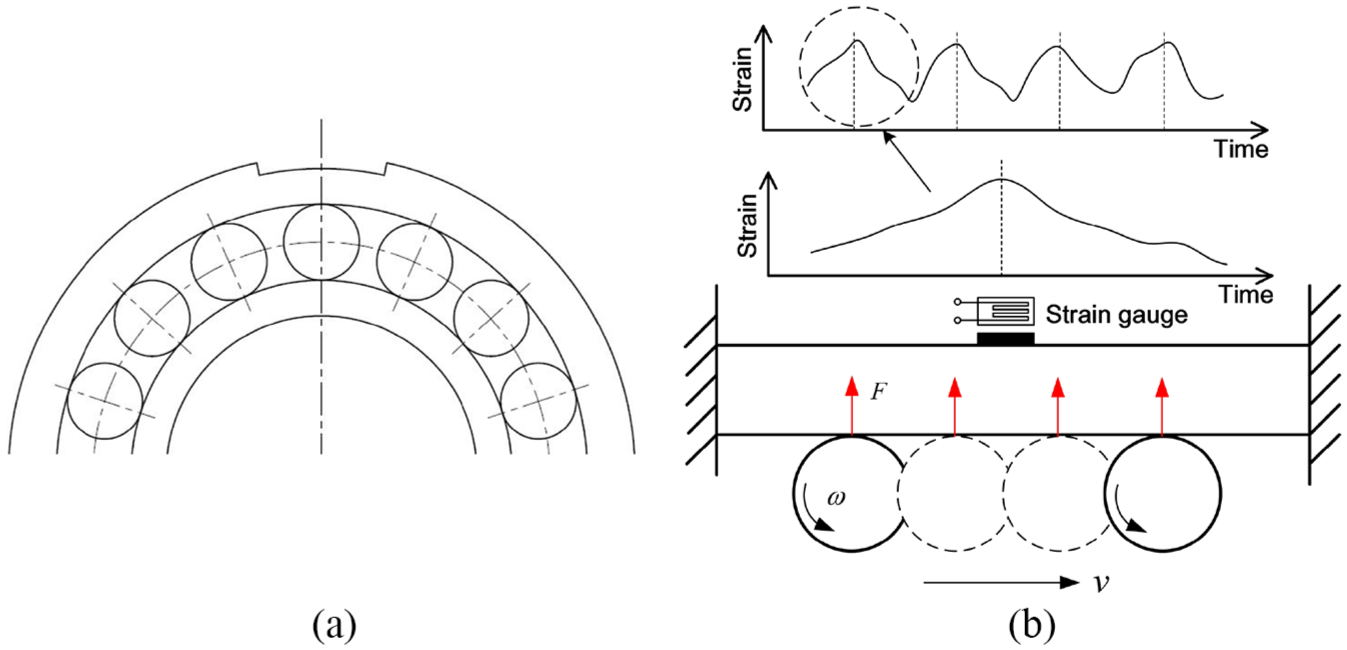
(a) Sketch of the bearing with a notch on the outer ring and (b) the principle of detecting cage slip with the strain gauge.
where

where
In summary, the cage slip can be measured by simply placing a strain gauge at the outer side surface of outer ring. The frequency characteristics of strain response can be related to the rotation velocity of cage and therefore the percentage of slip.
Test bearing
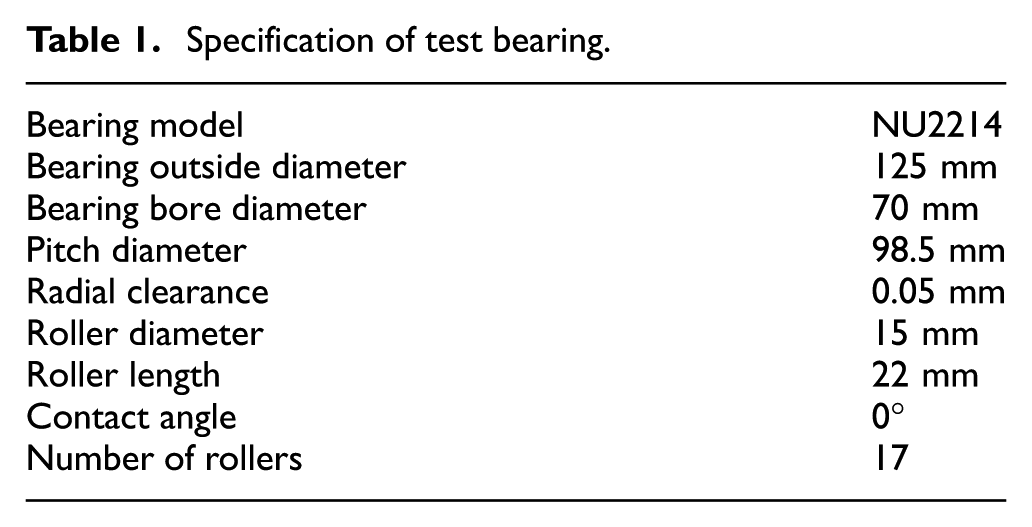
A test bearing is used to verify the feasibility of the proposed method experimentally. The test bearing is a cylindrical roller bearing of running flange on outer race type, and its specifications are given in Table 1. Figure 2 shows the picture of instrumented bearing. The notch is made by wire-electrode cutting and polished such that the strain gauge can be glued tightly on the surface. The depth of the notch is 2 mm, while the center angle corresponding to the notch is 21.2° which is equal to 360° divided by 17 (the number of rollers). The depth and angle of the notch can give enough space for the conventional strain gauge, while they are small enough to make sure the kinematic behavior of cage and roller in the bearing unchanged.
Specification of test bearing.
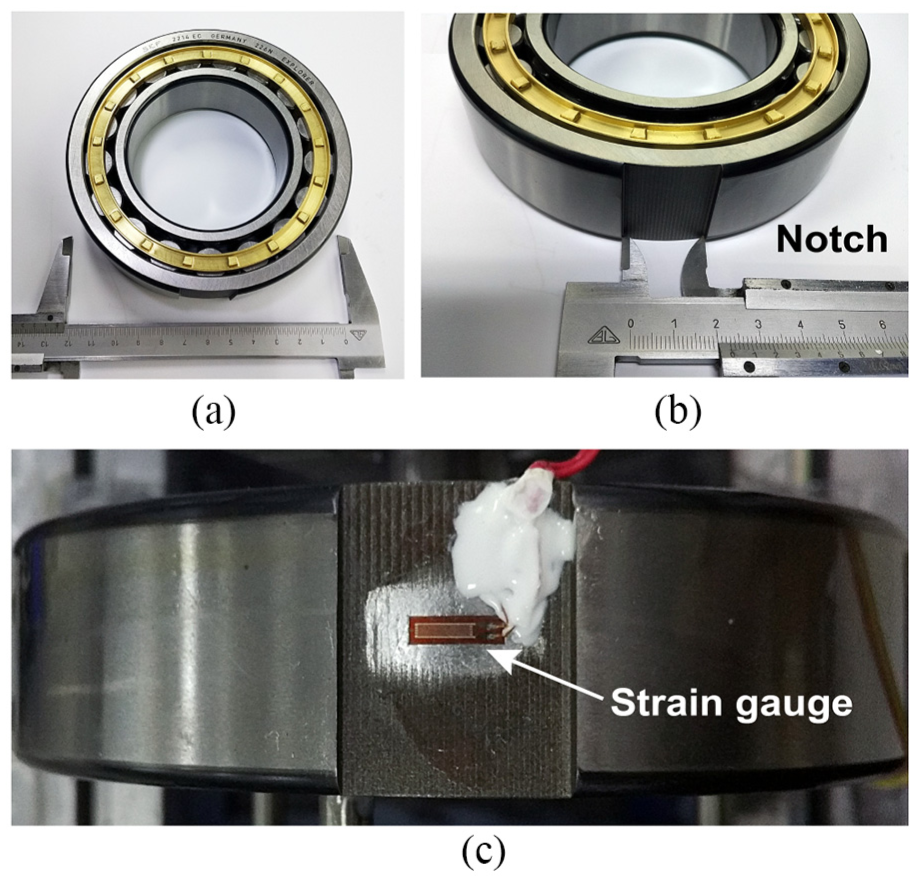
(a) Photo of investigated cylindrical roller bearing sample, (b) shape and size of the notch, and (c) the sticking of the strain gauge.
Experimental system and conditions
A roller bearing test rig is designed and developed to measure the cage slip of test bearing under given load–speed conditions as shown in Figure 3. The test rig is developed in a such manner that both the rotation speed sensor and the proposed strain method are utilized in the test. Under a given load–speed condition, if the cage slip measured based on strain can agree well with that measured based on speed, the feasibility of the strain measurement can be verified.
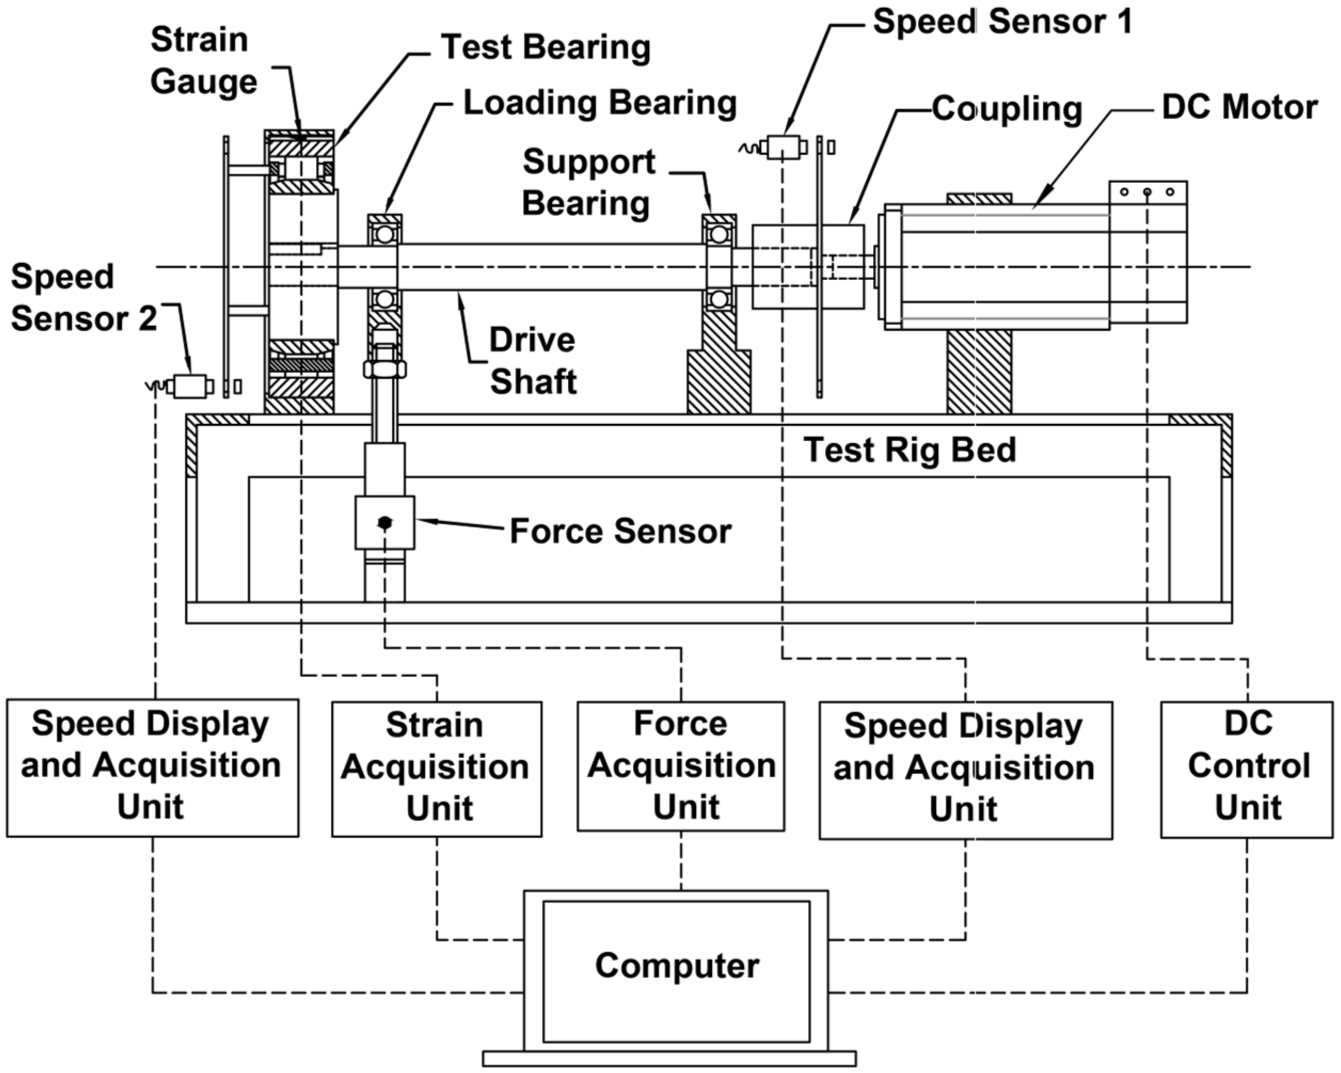
Schematic view of the experimental test rig and its instrumentation.
As shown in Figure 3, the test rig consists of a drive shaft which is supported by the support bearing and coupled with the direct current (DC) motor. Between the couplings, speed sensor 1 is installed to obtain the shaft speed continuously. The other end of the shaft is keyed with a metal bush on which the inner ring of the test bearing is mounted with appropriate fit. The outer ring of the test bearing is tightly fitted in a bearing housing which is fixed on the test rig frame. The notch with strain gauge is located at the top of the test bearing. An encoding disk is glued to the cage through three short rods at 120° angular space to keep the same rotation with the cage, so that the actual rotational speed of the cage can be measured by speed sensor 2. The two speed sensors mounted with the drive shaft and cage measure the rotation speed of inner ring and cage of test bearing, respectively, so that the cage slip ratio can be obtained.
Load is applied to the test bearing through the loading bearing. The loading system consists of a bolt, a nut, and a force sensor. The bolt is connected with a force sensor. By adjusting the position of the nut, the desired radial load is applied to the loading bearing. According to the force balance analysis of the shaft 1 kgf applied force on the loading bearing corresponds to a radial force of 0.8 kgf on the test bearing.
All the sensors are electrically connected with their own data acquisition system and display unit, respectively. The DC motor control unit and data acquisition systems are integrated with a computer for online measurement of load, speed, and strain response.
The photographic view of the roller bearing test rig is shown in Figure 4. The test rig is mounted on a vibration isolation table to minimize the influence of the vibration of the test rig on the test results. During experiments, the DC drive motor is operated at required speed by operating the DC control unit, and the desired radial load is applied on the test bearing. The lubricant oil is supplied from a reservoir with the rate of approximately 0.1 L/min by gravity-type lubrication to the test bearing through the oil nozzle. As shown in Figure 4(b), the oil nozzle is located between the cage and outer ring so that the oil can flow into the bearing easily.
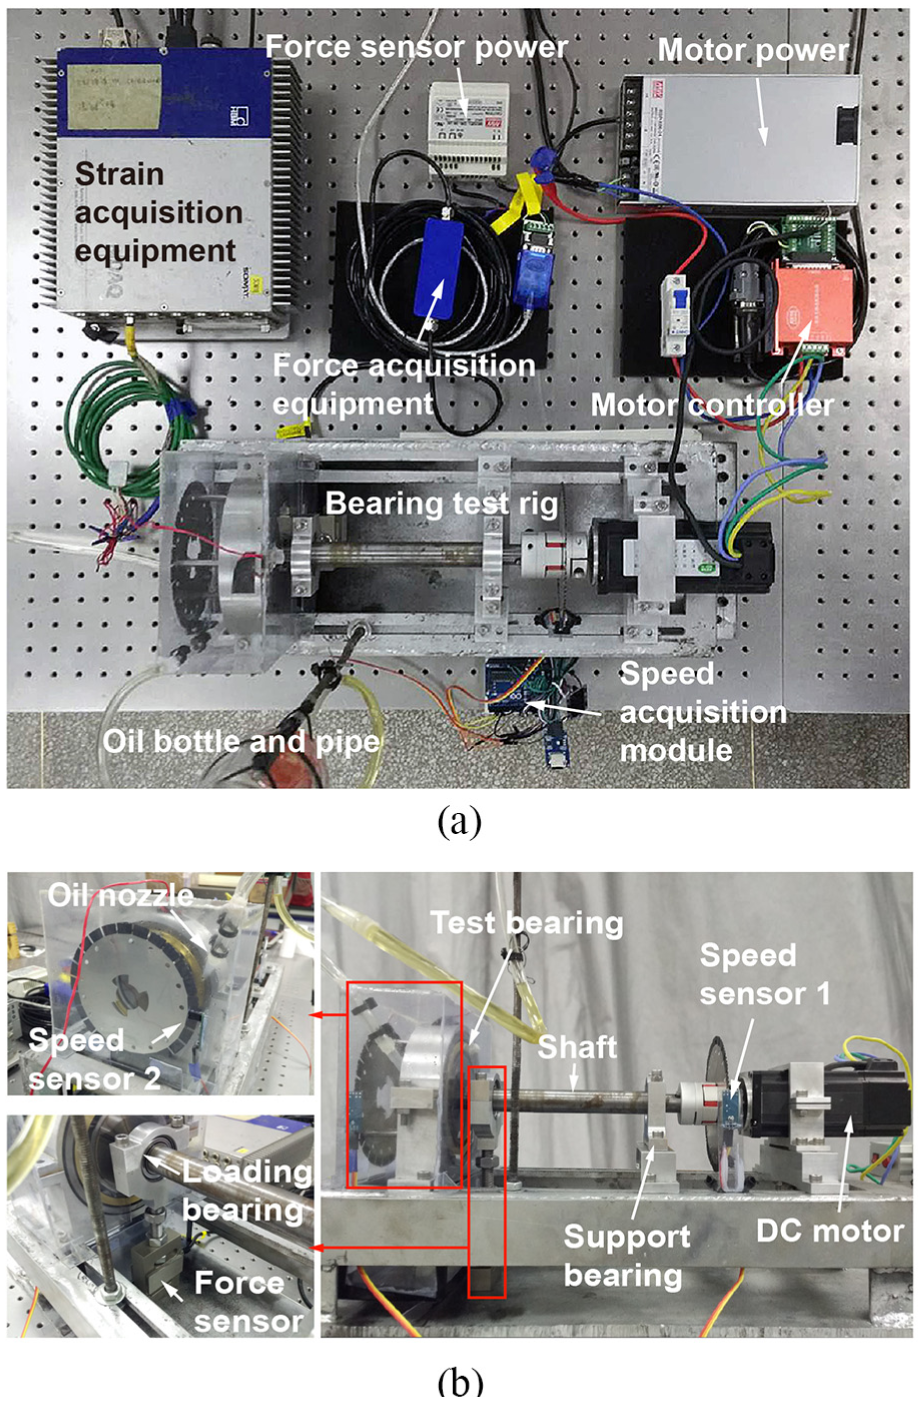
Photographic view of (a) the test rig and its instrumentation and (b) the details of the test rig.
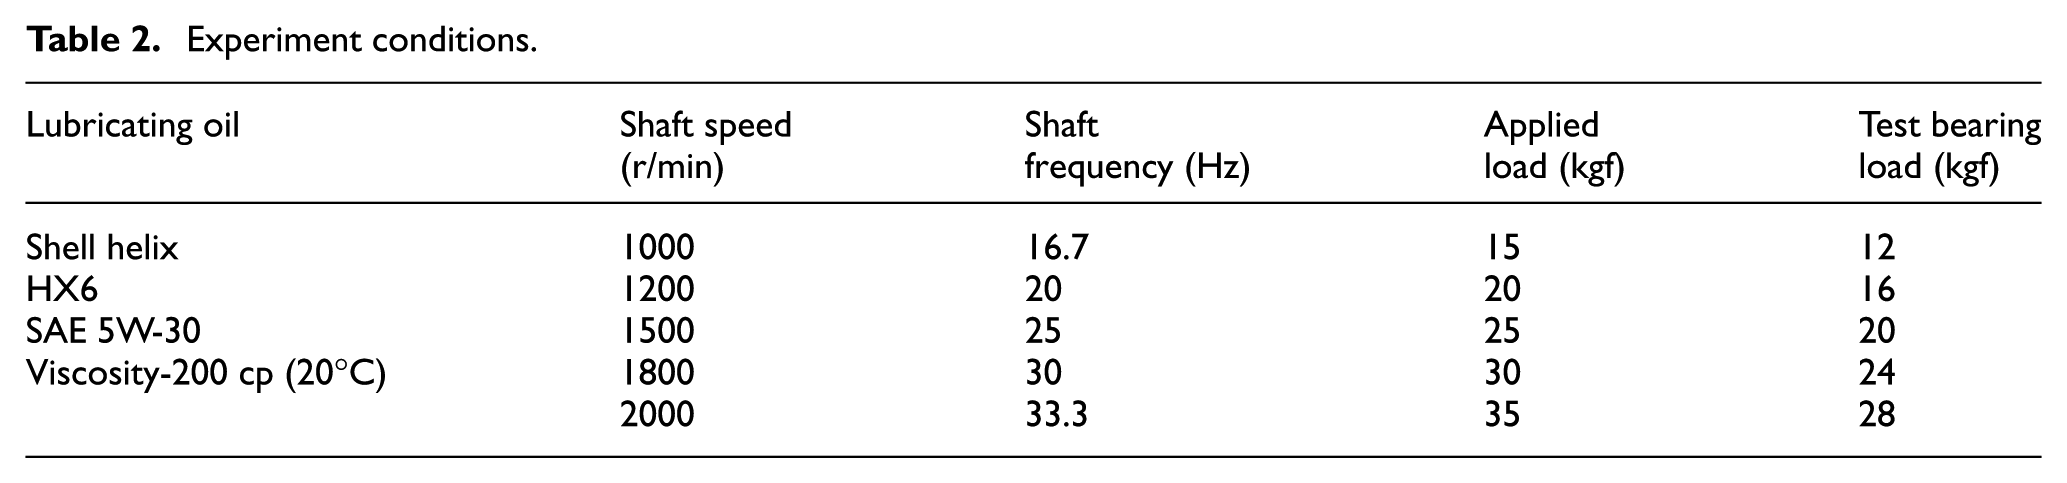
The experiment conditions are listed in Table 2. The lubricant is Shell Helix HX6 SAE5W-30 oil whose viscosity is 200 cp at room temperature. The radial load applied on the test bearing increases from 12 kgf, that is the self-weight of the inner ring and shaft, to 28 kgf with increment of 4 kgf. For a given radial load, the speed of shaft varies from 1000 to 2000 r/min during the experiment and the speeds of inner ring and cage and strain response were recorded. For each target shaft speed, the shaft speed was first increased to 1000 r/min, and the lubricant oil was supplied, and then the shaft speed was accelerated to the target speed and kept at the speed for a few minutes. The same procedure was then repeated for another applied load.
Experiment conditions.
Results and discussion
The typical real-time measurements of rotation speeds of the shaft and the cage are shown in Figure 5, where the radial load on test bearing was 12 kgf and the target shaft speeds were 1000, 1200, 1500, 1800 and 2000 r/min, respectively. The measurements for other bearing loads show similar behavior. The blue lines are the real-time cage slip ratios calculated by equations (1) and (2) based on the measured speeds. It is noted that during the acceleration stage of shaft speed to 1000 r/min without lubricant oil, the cage speed increases along with the shaft speed and the cage slip ratio gradually increases but stays at a relatively low level. When the lubricant oil is involved, the cage speed decreased gradually to a constant speed and stayed unchanged when the shaft speed accelerated to the target speed. During this phase, the cage slip ratio increased significantly and obvious cage slip occurred. It means that cage slip is easier to happen during acceleration under light load conditions and becomes severe at higher speed, which has been predicted by Tu et al. 9 using an analytical model. In general, for a given radial clearance and light load, increasing the shaft speed or introducing the lubricant oil would increase the oil film thickness between the roller and the inner raceway, tending to decrease the tangential driving force which is inversely proportional to the oil film thickness. The increase in oil film thickness also causes the radial outward movement of the roller, resulting in a larger frictional drag force between the roller and outer raceway. The cage must travel more slowly than that of its epicyclical value to re-establish equilibrium between the drag and driving tangential forces, resulting in cage slip.
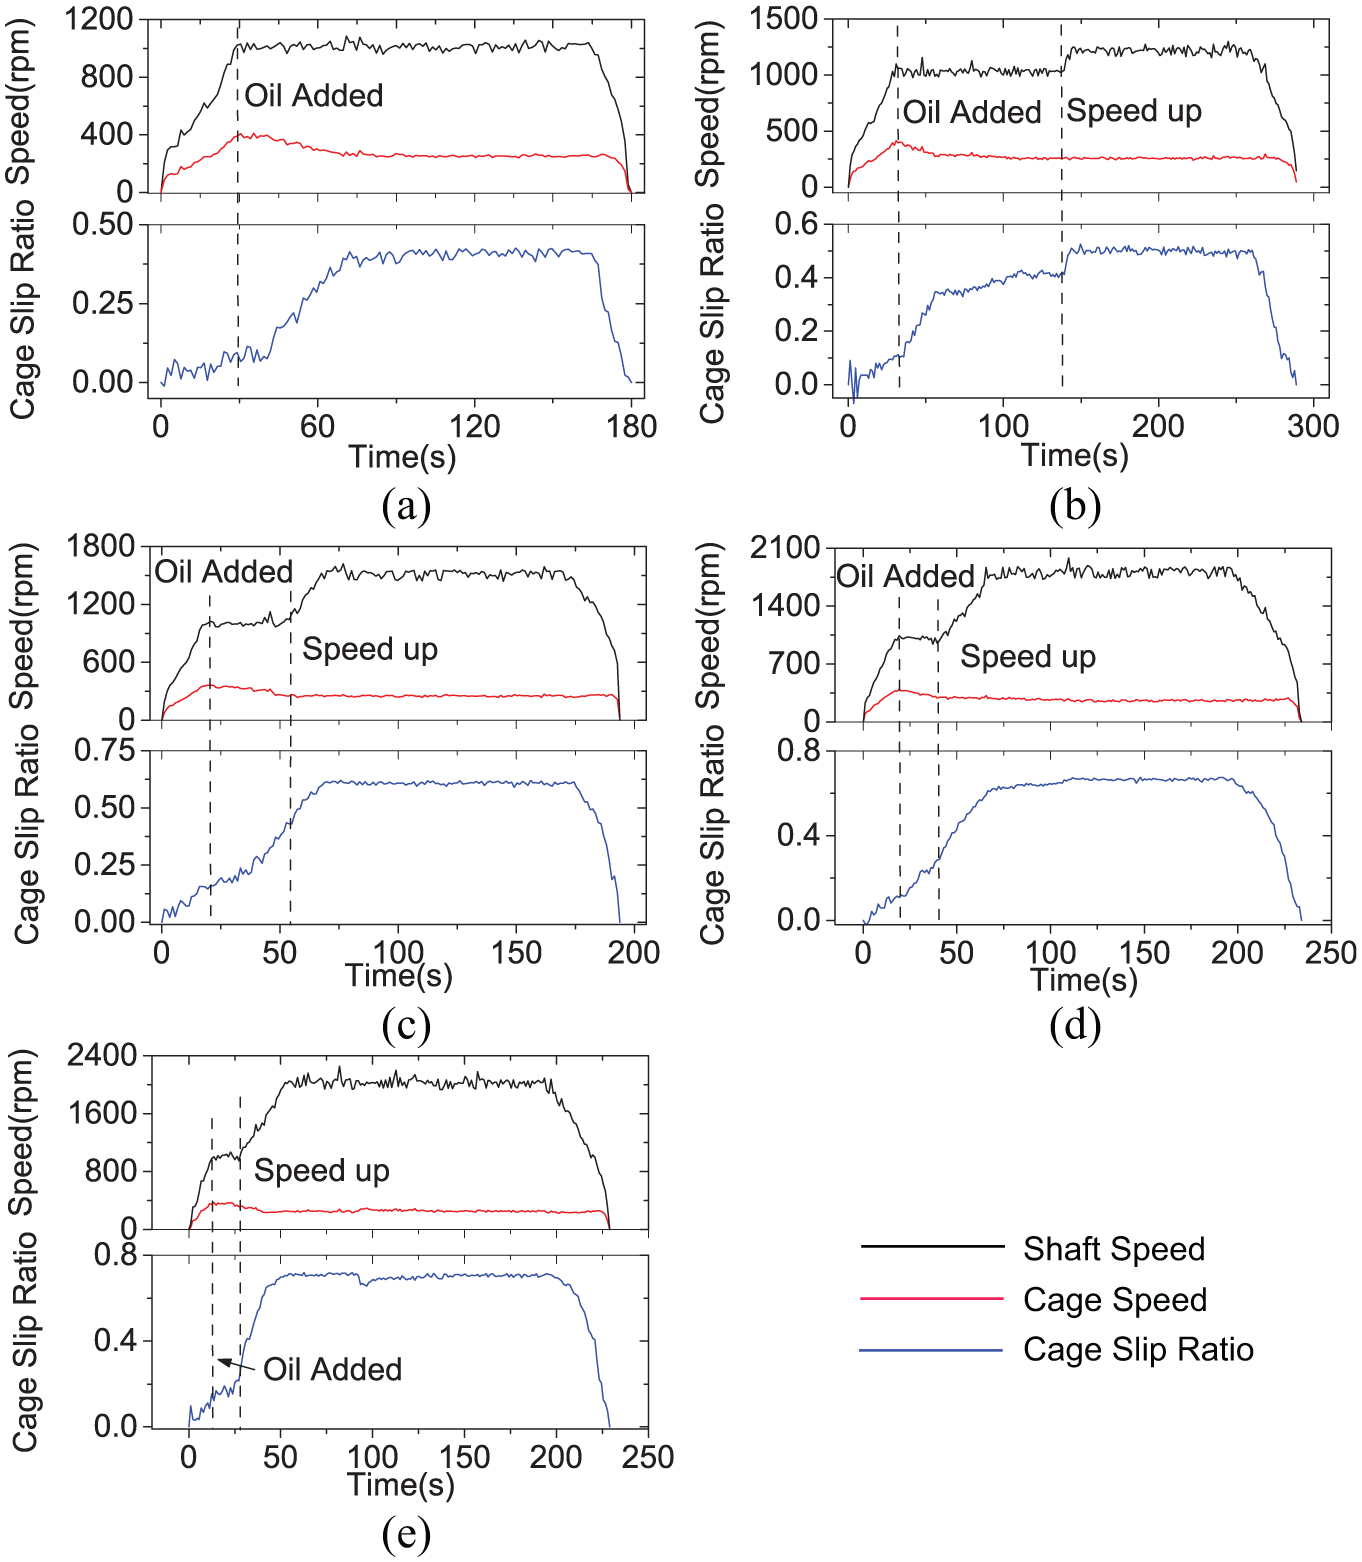
Real-time data of shaft speed, cage speed, and skidding ratio obtained from speed sensors at the same bearing load 12 kgf and different target test shaft speeds: (a) 1000 r/min, (b) 1200 r/min, (c) 1500 r/min, (d) 1800 r/min, and (e) 2000 r/min.
To verify the method proposed in this article, the strain signals from the strain gauge were analyzed and compared with the result from the speed signals described above. Figure 6(a) shows the entire strain time history with the test bearing load of 12 kgf and the test shaft speed of 1000 r/min (i.e. 16.7 Hz). The sampling frequency of the strain signal was 2500 Hz in the experiments. Under the same experimental conditions, by comparing this strain time history with the real-time cage speed depicted by the red line in the same figure, the strain signal can be divided into four phases. Phases A–D correspond to the acceleration process of the cage, the cage speed decrease caused by the oil involved, the unchanged phase of cage speed, and the final deceleration, respectively. Obvious boundaries of each two adjacent phases can be recognized according to the change in the waveform and peak to peak values. A magnified view of the waveform at phase C is shown in Figure 6(a) as well. It reveals that during a period of 1 s there are about 17 peaks with the amplitude greater than 2με and with the same time interval. The number of strain peaks is close to the intuitive characteristic frequency of shaft rotation speed at 1000 r/min, that is 16.7 Hz. However, unlike the waveform shown in Figure 1(b), the actual strain signal shows no evident frequency signatures about rollers passing through the notch in the time domain and it is the multi-component signal with more complex frequency components. The characteristic frequencies about the cage or rollers remained hidden among other frequency amplifications. To distinguish the frequency components and figure out their meanings, a time–frequency plot of the power spectral density (PSD) of the strain signal is given in Figure 6(b) using the joint time frequency analysis technique. It demonstrates the frequency components of the strain signal and their changes with time when the test bearing load was 12 kgf and the target shaft speed was 1000 r/min. From the spectral plot in Figure 6(b), two main trends of the frequency components, Trend I and Trend II, are shown. Figure 6(c) shows the real-time rotational frequency obtained by conversion of speed signal in the same experimental condition. The black line is the real-time frequency of the shaft rotation, that is, the frequency of the inner ring rotation, and the red line is 17 times the frequency of the cage rotation, namely, the frequency of the passage of rollers in notch zone because of 17 rollers in the test bearing. It is noted that the highlighted frequency components in Figure 6(b) agree very well with the frequencies transformed from the speeds in Figure 6(c) in terms of not only trends but also values. In detail, Trend I and Trend II in Figure 6(b) correspond to the black line and red line in Figure 6(c), respectively, which means that the strain signal can show not only the frequency signature of the inner ring rotation but also that of the rollers passing through the notch. In a word, it means that the strain signal can accurately identify and record the characteristic frequencies of inner ring rotation and rollers passing through the notch. However, besides the highlighted frequency components in Figure 6(b), there are some other frequency components. PSD spectrum analysis (fast Fourier transform (FFT)) of phase C was done and shown in Figure 6(d) to extract these frequency features and get the specific frequency values. The spectrum shows the dominant frequency component at the shaft running speed of 16.7 Hz and its harmonic of 33.4 Hz due to the presence of the shaft misalignment and/or the unbalance caused by the eccentricity between the speed measuring disk and the cage. A perfectly balanced rotor system is hard to achieve so that even under normal operating conditions the frequency spectrum using the traditional FFT technique may show spikes at the operating speed and its harmonics. 17 The frequency of rollers passing through the notch at about 71.3 Hz and its subharmonic of 35.7 Hz also appear in the spectra. The characteristic frequency of 71.3 Hz is equal to the frequency of cage rotation multiplied by 17 (the number of rollers) as well. The subharmonic resonance phenomenon at the frequency of 35.7 Hz can be explained in detail from the viewpoint of nonlinear vibration according to Bai et al. 18 The results under other experimental conditions show almost the same trend and hence are not reported here.
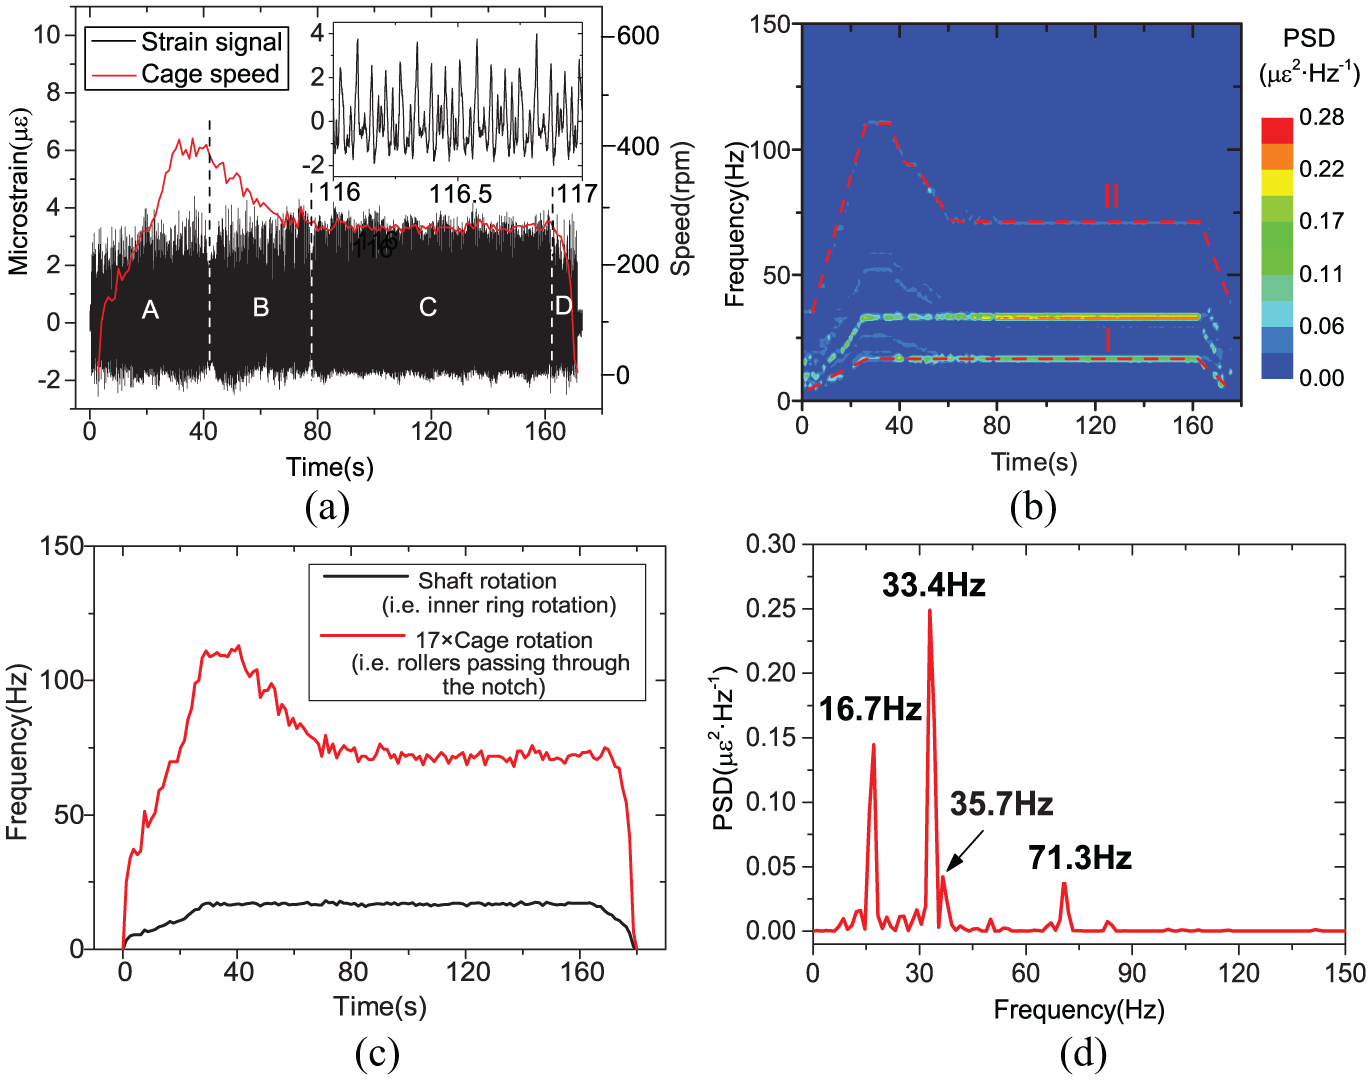
(a) The strain signal which removed zero drift and real-time cage speed, (b) the waterfall display of the power spectral density (PSD) of the strain signal, (c) rotational frequency obtained by conversion of speed signal, and (d) frequency components of the strain signal (test bearing load 12 kgf, test target shaft speed 1000 r/min).
The PSD spectra of the strain signals at each experimental condition are depicted in Figure 7. It demonstrates that the signals from the strain gauge involve the frequencies about the shaft rotation and the rollers passing through the notch in the FFT-based frequency spectra. At each test speed, the frequency components marked by dotted lines are the rotational frequency of the shaft and its harmonics. They are only affected by the shaft speed and do not change with the test load. Furthermore, there is a frequency component increasing with the applied load at each test speed, and it is the frequency of the rollers passing through the notch.
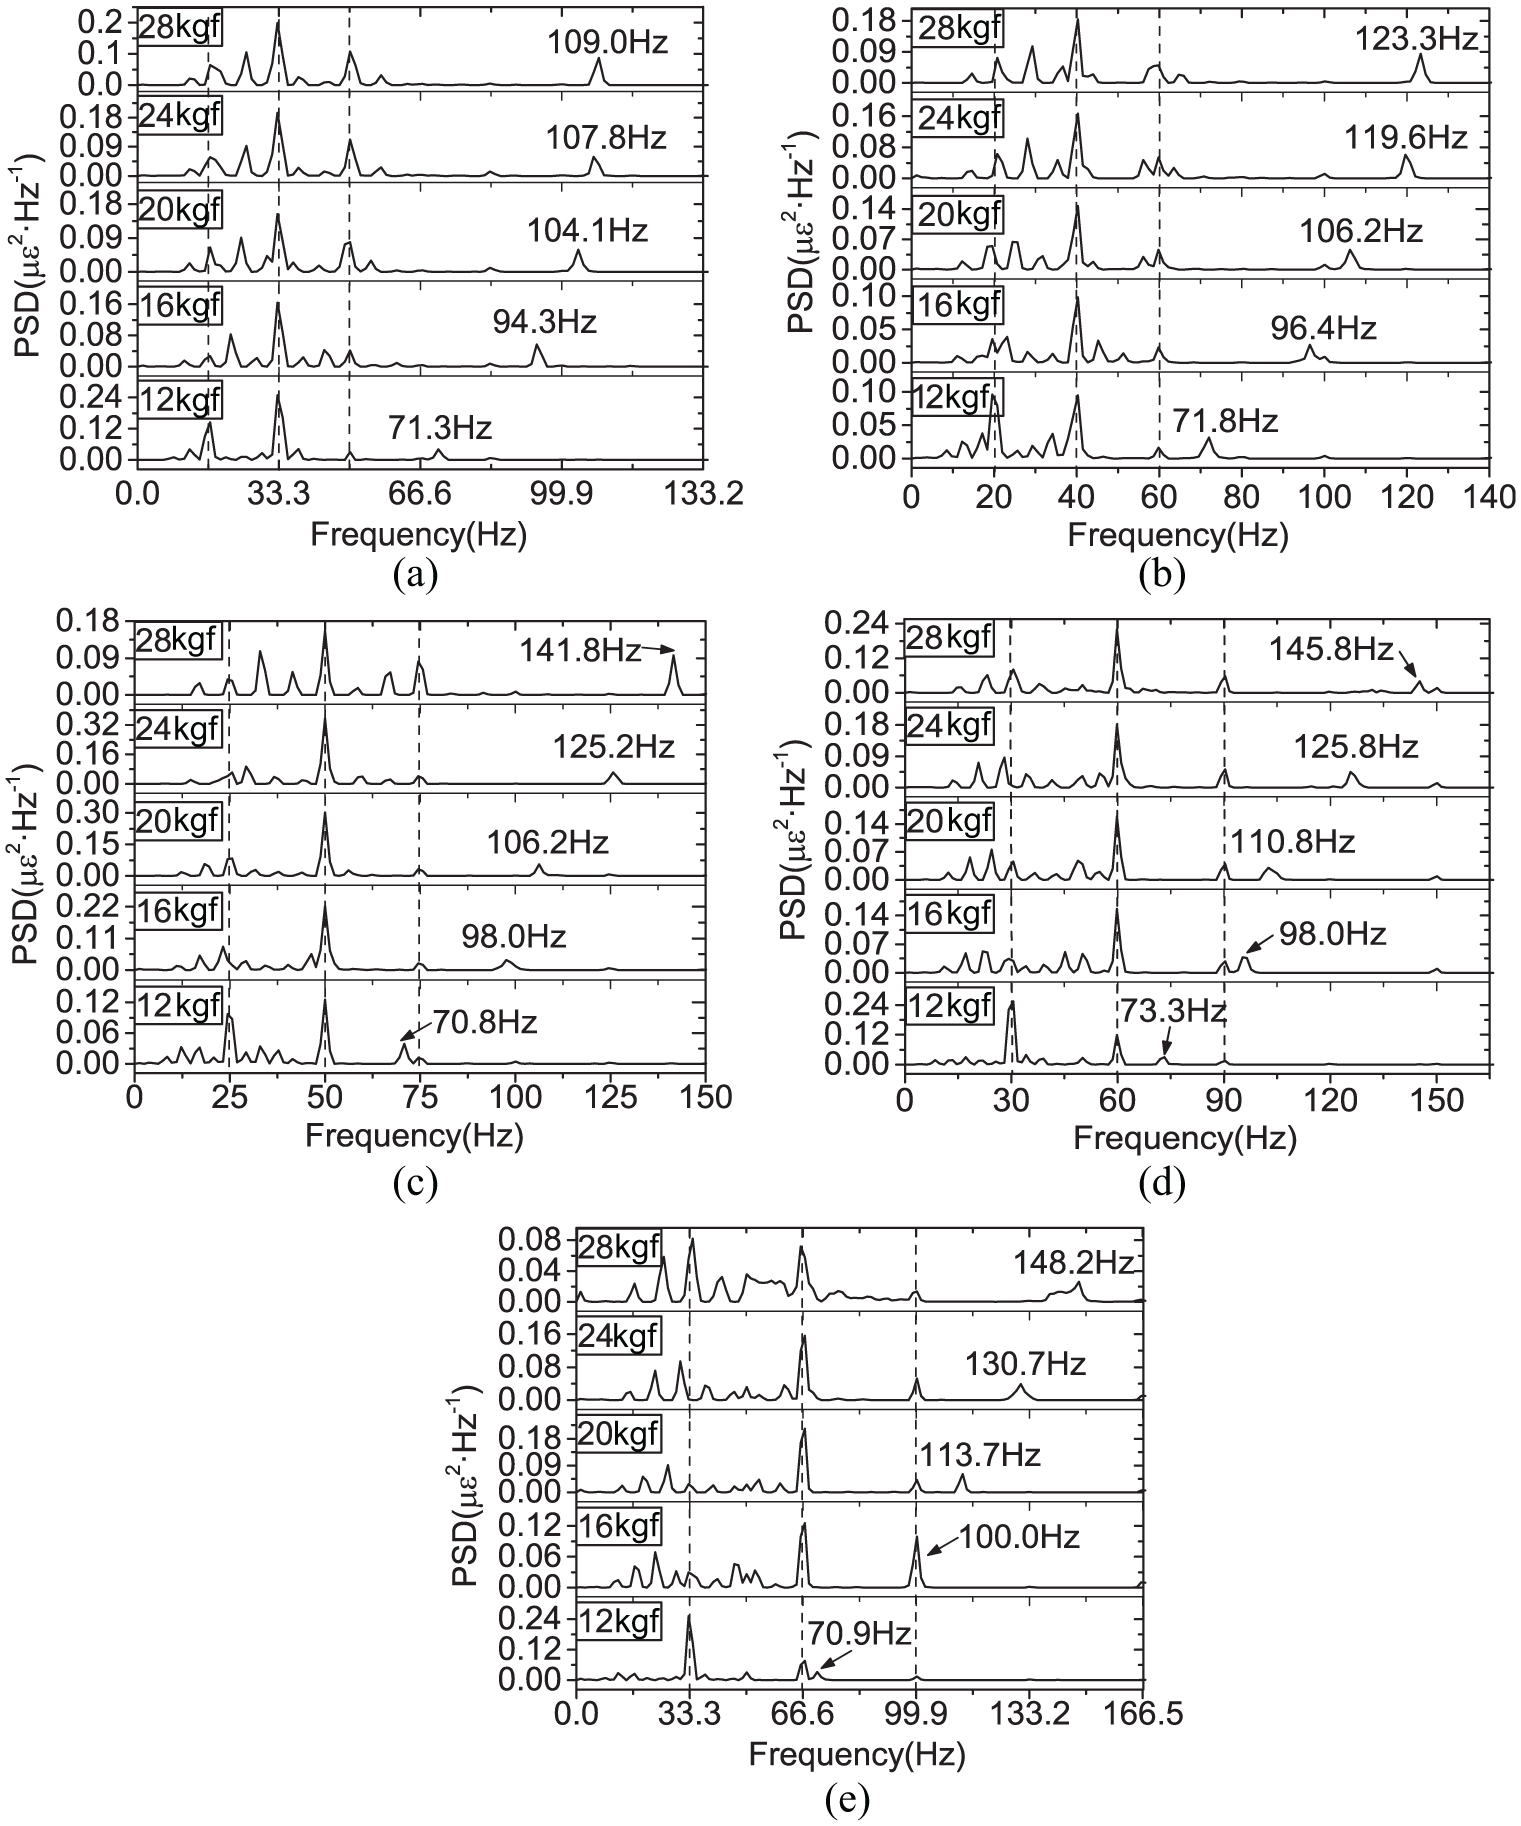
Frequency components of the strain signals at different test bearing load and different target test shaft speeds: (a) 1000 r/min, (b) 1200 r/min, (c) 1500 r/min, (d) 1800 r/min, and (e) 2000 r/min.
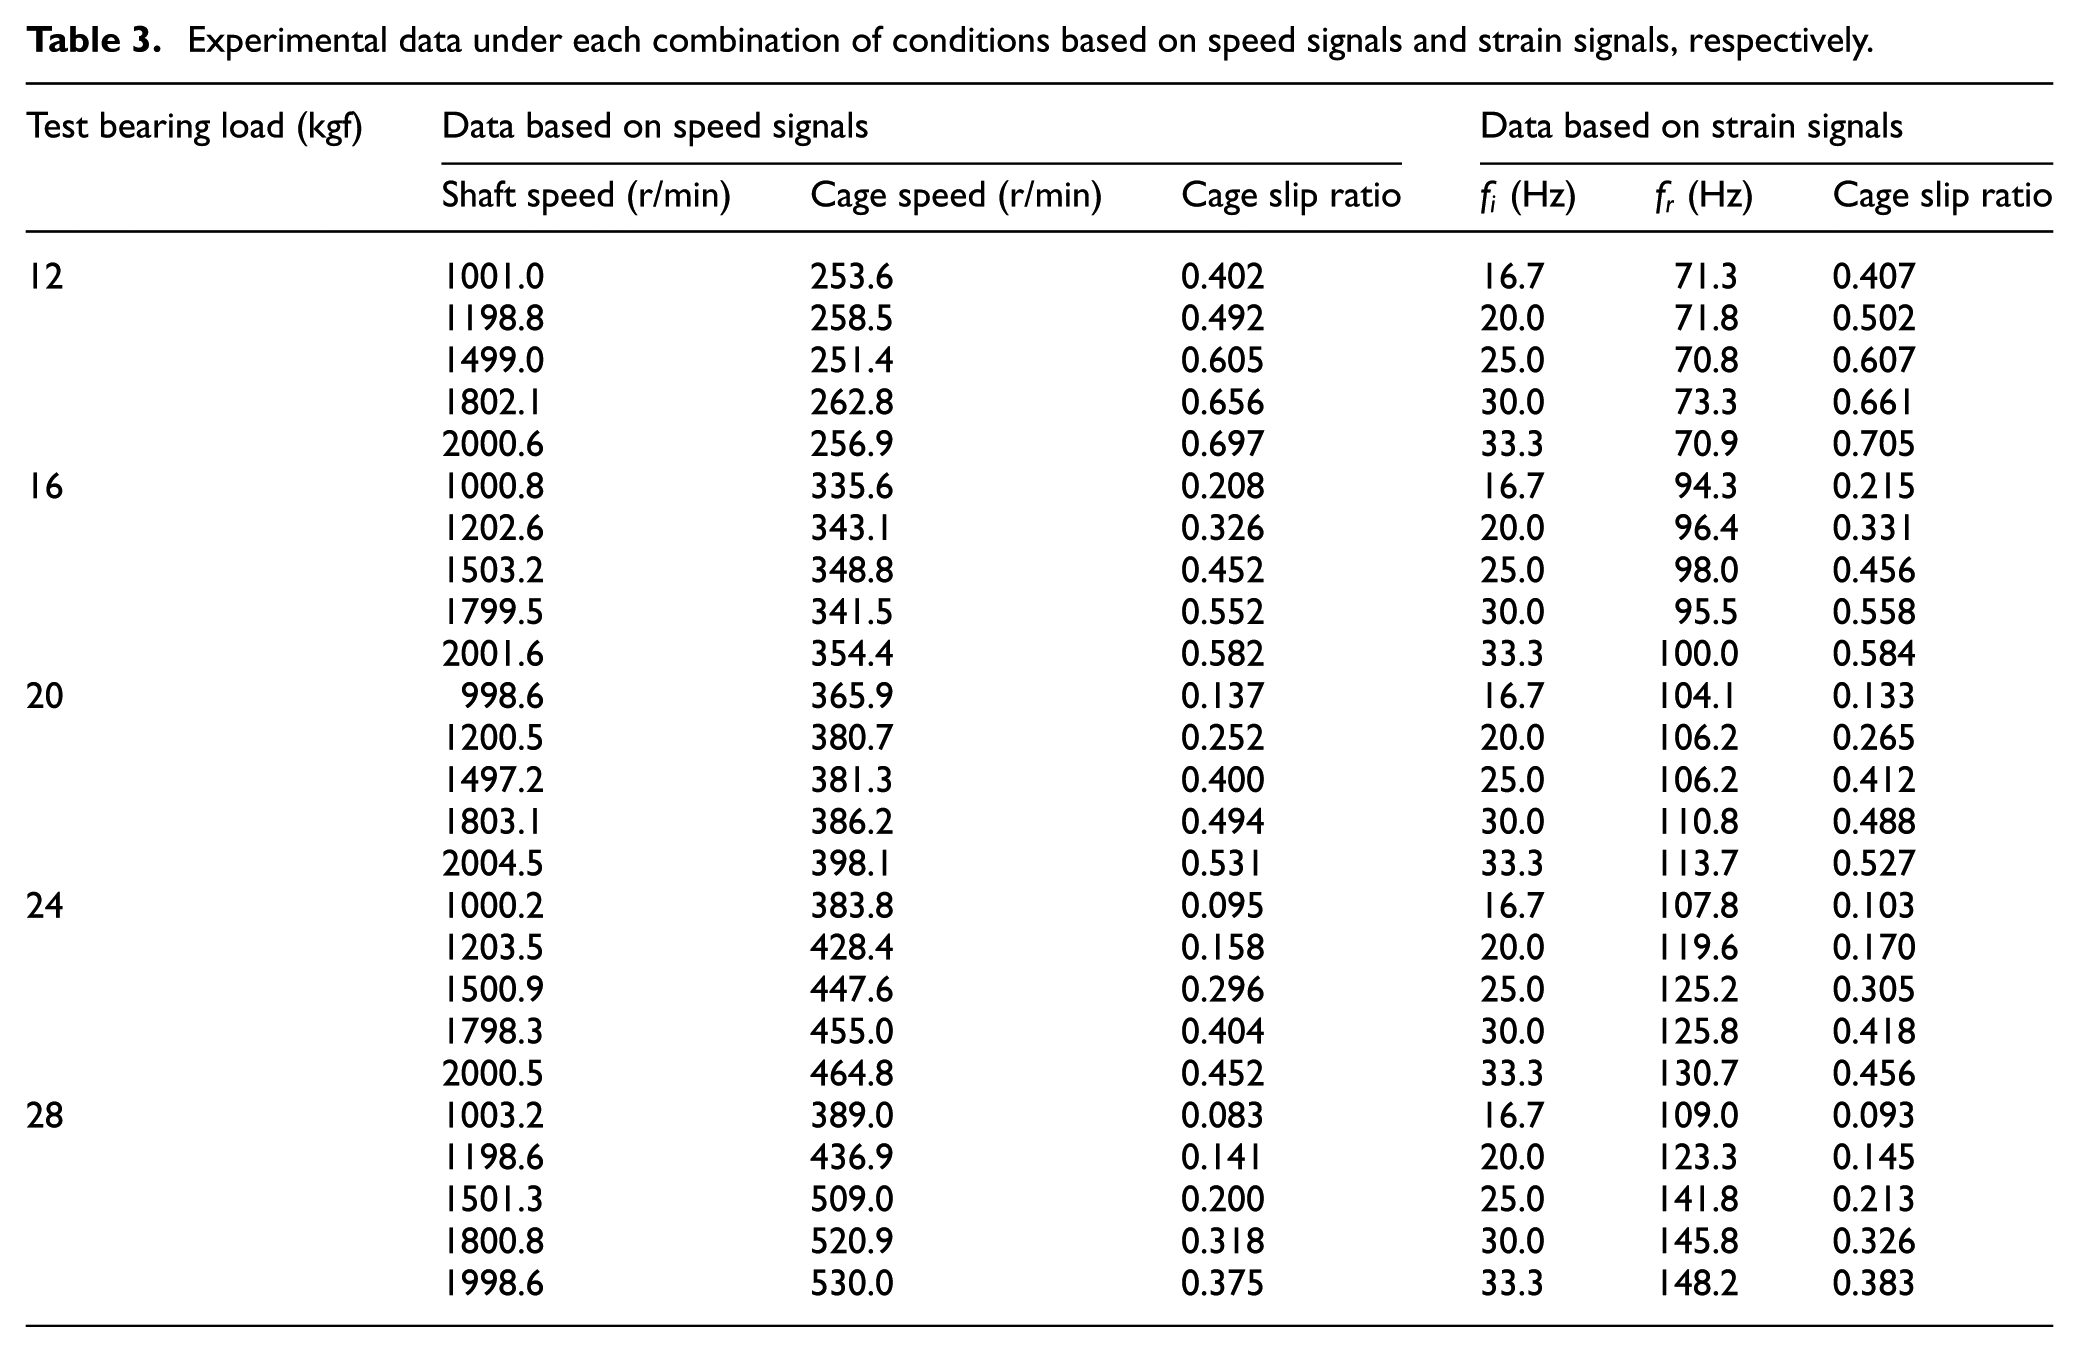
In general, Table 3 shows the experimental data under all operating conditions based on speed and strain signals, respectively. It includes the measured shaft speeds, cage speeds, and the cage slip ratios calculated by equations (1) and (2) as well as the characteristic frequencies of the strain signals and the cage slip ratios calculated by equations (3) and (4). It demonstrates that, at lighter test loads (12 and 16 kgf), the measured cage speed and the frequency of rollers passing through the notch almost remain unchanged although the shaft speed increases from 1000 to 2000 r/min. Trends become different when the test load is more than 16 kgf. The measured cage speed and the characteristic frequency of rollers increase with the increase in the shaft speed at heavier test loads (20, 24, and 28 kgf). It means that the rotation of the cage, namely, the revolution of the rollers, is mainly influenced by the radial load at lighter loads, while at higher loads, they are affected by the radial load and shaft speed simultaneously. Figure 8 shows, intuitively, the influence of the radial load and shaft speed on the cage slip as well as the comparison of the cage slip ratios based on speed signal detection and that based on strain signal detection. The cage slip ratio decreases with the increase in radial load and shaft speed. It indicates that where there are a lighter load and a higher speed, there is more serious cage slip. This phenomenon agrees with the analysis by Harris 2 and the experimental studied by Selvaraj and Marappan. 8 However, in the study by Selvaraj and Marappan, 8 the cage in the test bearing is completely removed and the rollers were connected rigidly with planetary gears, so that the rotation and revolution speed of the rollers can be obtained by the epicyclical gear trains. It is noted that the modification of the test bearing cased not only all the rollers in the loaded or unloaded zone rolling at a same speed at a moment but also the disappearance of interaction force between the cage and rollers. However, the fact is that the roller slipping occurs when the rolling element enters into the loaded zone15,19 and the cage load should not be ignored. 2 Compared with the study by Selvaraj and Marappan, 8 the way to measure the cage speed in this experiment avoids the problems mentioned earlier. Moreover, when the bearing is in service, it is difficult to measure rotational speed of cage by external sensors because of no enough space. Thus, it is more practical and effective to measure cage slip through strain signals using internal strain gauges. In addition, it is shown that the cage slip ratio curves based on strain responses agree very well with the cage slip ratio curves based on rotational speed data under the given load–speed conditions. This agreement verifies the feasibility of the proposed measurement of the cage slip based on strain detection.
Experimental data under each combination of conditions based on speed signals and strain signals, respectively.
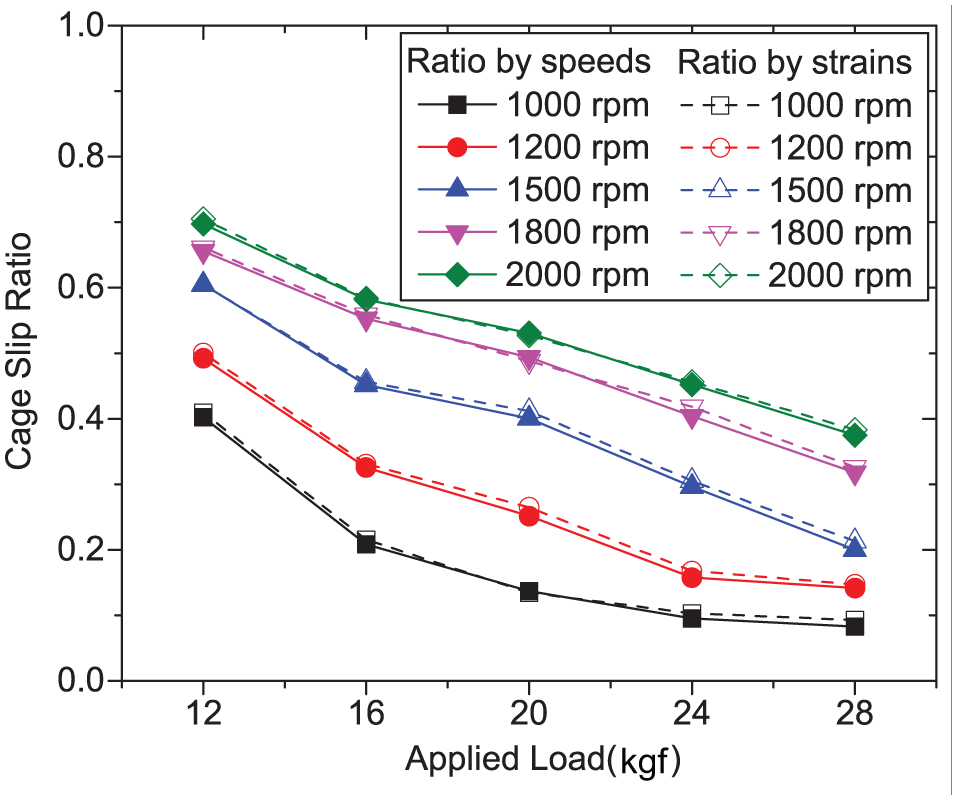
The influence of the radial load and shaft speed on the cage slip and the comparison of the cage slip ratios based on speed signals between that based on strain signals.
Conclusion
In this study, a new method for measuring cage slip of the cylindrical roller bearing was proposed focusing on the actual service environment, and an experimental system was developed to investigate its effectiveness. The bearing test rig in the experiment is designed to be able to measure the strain of the outer ring of the cylindrical roller rearing and the rotational speed of the shaft and cage at the same time. It was found that:
Cage slip in the bearing can be characterized based on not only speed signal but also strain signal, which is easier to be obtained than the speed signal when the bearing is in service.
Under high speed and light load conditions, the cage slip was found to decrease with the increase in radial load or with the decrease in shaft speed.
Cage slip ratios determined from strain signal were found to have good agreement with that from rotational speed. This agreement verified the feasibility of the new measurement method.
Footnotes
Declaration of conflicting interests
The author(s) declared no potential conflicts of interest with respect to the research, authorship, and/or publication of this article.
Funding
The author(s) disclosed receipt of the following financial support for the research, authorship, and/or publication of this article: This research was supported by the Joint Funds of the National Natural Science Foundation of China (grant no.: U1834202).