
Abstract
The monitoring data makes it feasible to quickly evaluate the cracking of the prestressed concrete box-girder bridge. The live-load strain can accurately quantify the load effect and cracking of bridges due to its explicit datum point of signal. Based on the live-load strain data from bridge monitoring system, this study develops a comprehensive data-driven method of state evaluation and cracking early warning for the prestressed concrete box-girder bridge. The feature of vehicle-induced strain is extracted using the deep learning and classification of long short-term memory network. The vehicle-induced strain features are clustered via Gaussian mixture model, and the cracking early warning of the bridge is conducted according to the reliability of heavy vehicle clustering data. This method can be used as an indicator for the bridge inspection, truck-weight-limit and reinforcement work. The results demonstrate that (1) using the long short-term memory network, a deep learning model can be trained to intelligently classify the non-stationary and stationary sections of vehicle-induced strains, of which the test accuracy of classification surpasses 99%, and (2) according to the Gaussian mixture model probability distribution of data, the vehicle-induced strain features can be clustered by the corresponding Gaussian mixture model crest, which is the premise for reflecting relational mapping between vehicle loading and strain response.
Keywords
Introduction
Prestressed concrete box-girder bridges are commonly used as small and medium span bridges on China highways. Cracking is the main problem for concrete bridges. Although prestressing tendons can prevent structural cracking to a certain extent, it cannot fundamentally solve the cracking problem of concrete bridges. Benefit from structural health monitoring (SHM) system, the monitoring data makes it feasible to quickly indicate the cracking of bridges. Hence, a data-driven method for quick and accurate evaluation of the bridge cracking needs to be developed.1,2
Scholars and engineers have tried to develop the data-driven evaluation method for the state of infrastructures since the SHM technology began to apply in civil engineering. Phares et al.,3,4 An et al., 5 Nagarajaiah and Yang, 6 Wang and Xu, 7 Sun et al., 8 and Koto et al. 9 developed the innovative identification technology for the damage detection of bridges and structures. Seo et al.,10,11 Bao et al., 12 Li et al., 13 and Yu and Cai 14 analyzed the load effects of bridge components using advanced signal and data processing method. Ding et al. 15 and Zhao et al.16,17 conducted the real-time early warning of long-span bridges to monitor the safety of vehicle–bridge system. Wang et al., 18 Li and Ou, 19 Ni and Xia, 20 Zhao et al., 21 Zhu et al., 22 and Erazo et al. 23 investigated the state evaluation methodology of the existing bridge structure based on the SHM system. The study of the data-driven evaluation for the bridge structure has made great progress by employing such continuous studies.
The utilization rate of massive monitoring data has long been a short-board in the field of SHM. The processing and deep learning of big data in this era provides an opportunity for the effective use of massive monitoring data. Atha and Jahanshahi, 24 Cha et al., 25 Xu and colleagues26,27 developed vision-based deep learning approaches to identify multiple types of structural damage such as crack and corrosion. Bao et al. 28 and Tang et al. 29 used the convolutional neural network (CNN) to detect the data anomaly from the original monitoring data to improve the effectiveness of your data. Weinstein et al. 30 and Zhou et al. 31 evaluated the degradation of structure by the data deep learning of artificial neural networks. Li et al. 32 and Lu et al. 33 made data clustering about long-term environmental load and then predicted system state based on clustering data. According to the above research, we can find that: the data processing and deep learning can intelligently transform massive monitoring data from the computer language into the indexes of structural state required by engineers, so that monitoring data can be quickly and intuitively linked to structural inspection, maintenance, and management. However, research works in this area are only a small-scale exploration within the engineering requirements.
Based on the live-load strain data from SHM system, this study develops a comprehensive data-driven method of state evaluation and cracking early warning for the prestressed concrete box-girder bridge. The analysis in this study mainly involves three parts. The first part is the elaboration on problems and difficulties in the evaluation for the cracking of prestressed concrete bridges. The second part is the feature extraction of vehicle-induced strain using the deep learning and classification of artificial neural network. The third part is the data clustering and the reliability analysis of vehicle-induced strain features. Finally, the state evaluation and cracking early warning of the bridge are conducted according to the reliability of heavy vehicle clustering data.
Problem and strategy of the evaluationfor the existing bridges
Existing prestressed concrete bridges in the highway have long been faced with prestress relaxation, corrosion, and downward deflection during operation. Stress changes and structural cracking are intuitive reflections of these deterioration phenomena. Based on the long-term data of a 25 m continuous beam bridge in China highway, the method of state evaluation and cracking early warning of bridges are required to be established and promoted for the similar types of precast bridges. Figure 1 shows the monitoring locations of strain and temperature sensors. The sampling frequency of strain and temperature sensors is 200 Hz, in this article, the sampling frequency of data analysis takes 50 Hz (one value is taken for every four monitoring values). All the sensors are installed at the middle section of the bridge span. The longitudinal direction is along the length of the bridge span, and the transverse direction is along the upstream–downstream direction.
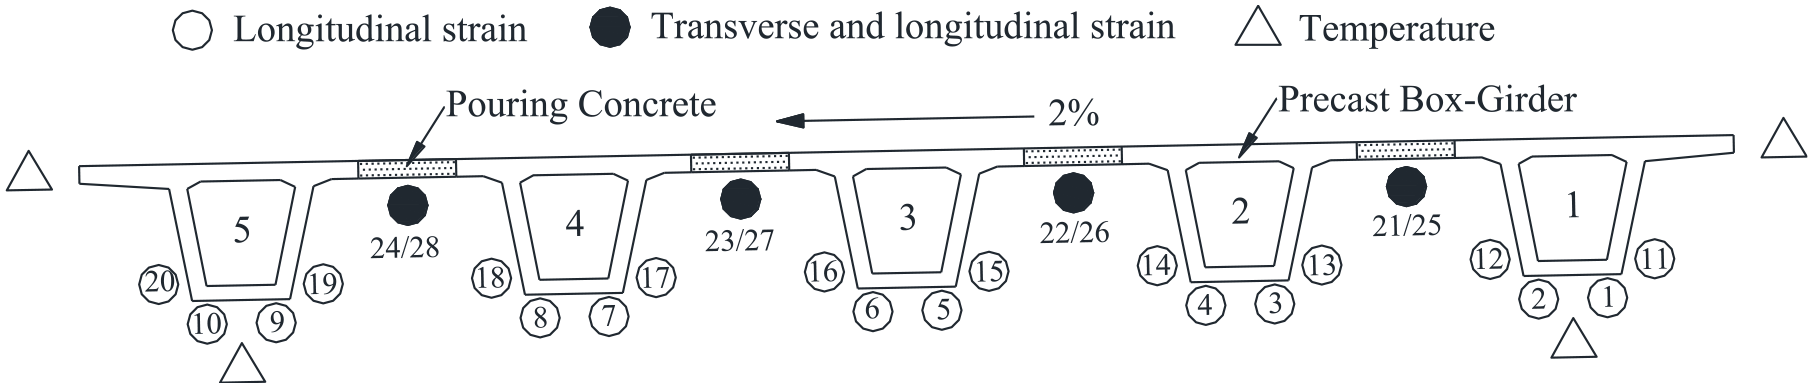
Strain and temperature monitoring of a prestressed concrete box-girder bridge.
The measured strain data are a time-varying sequence, and the different strain parts in different frequency bands can be decomposed by a discrete wavelet transform. The temperature-induced strain is in the low-frequency band and the vehicle-induced strain is in the high-frequency band.15,16 The decomposition scale of the wavelet transform can be determined by the frequency spectrum of the signal. 17 Assume that the signal frequency of structural temperature data is mainly concentrated at [0, ft]. According to the sampling theory, the frequency band available for the strain signal with a sampling frequency of fs is [0, fs/2]. The zeroth decomposed sequence of the Nth layer using the N-scale wavelet packet belongs to [0, fs/2N+1]. The optimal decomposition scale of the wavelet transform can be determined by selecting an appropriate N which makes fs/2N+1 slightly larger than ft. Figure 2 shows the wavelet transform results of the temperature-induced and vehicle-induced strains from Sensor 9 in 15 days, and the temperature data at the same location.
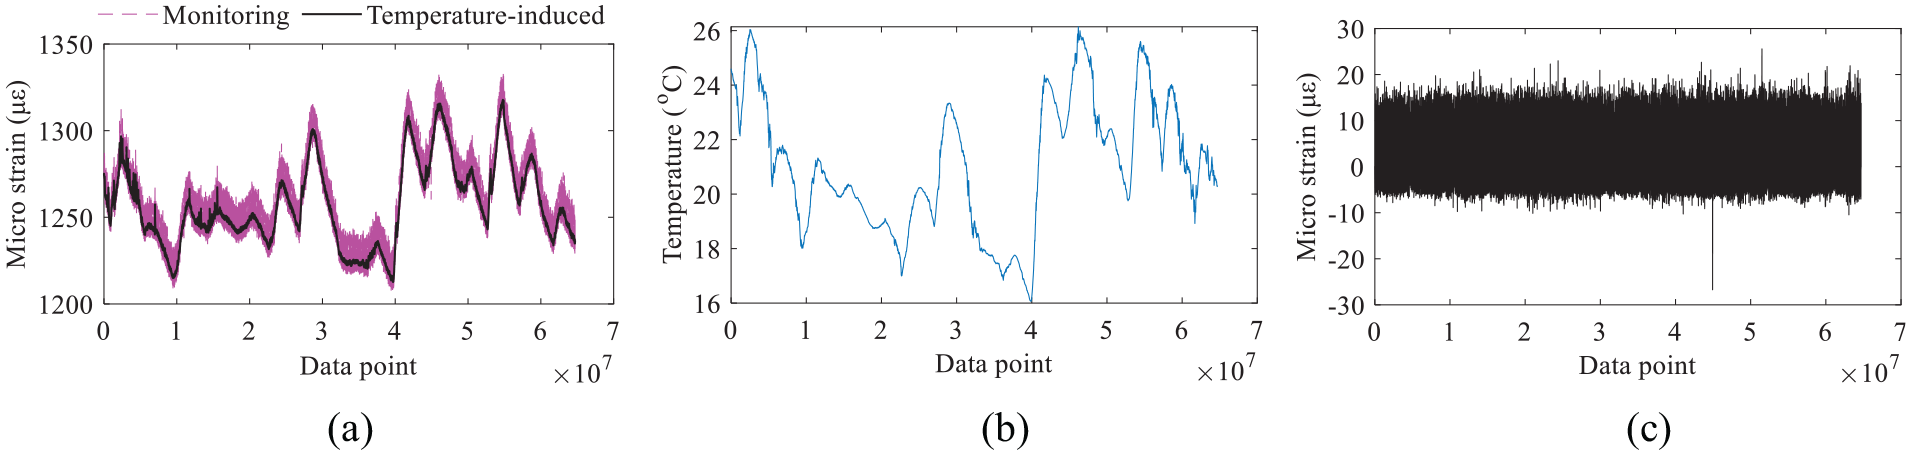
Temperature-induced and vehicle-induced strains from Sensor 9, and the temperature at the same location: (a) strain data and its temperature-induced part, (b) temperature data at the same location, and (c) vehicle-induced strain.
As shown in Figure 2, the strain response of a single measuring point has correlation with the temperature, but they are not completely consistent. It is because the strain response of a single measuring point of the bridge is affected by average temperature, the temperature difference, and the temperature-induced secondary stress. The strain variation at this measuring point in 15 days is approximately 125 με, where the temperature-induced strain variation is about 105 με. However, the thermal expansion and contraction of concrete will cause the value change of the strain sensor, but not directly generate stress. Hence, the effective temperature-induced strain of the structure, which will cause the structural stress, approximately equals as
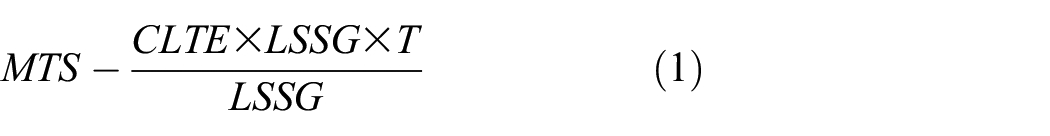
where MTS denotes the variation of measured temperature-induced strain, CLTE denotes the coefficient of linear thermal expansion, LSSG denotes the length of sensor sensitive grid, and T denotes the variation of temperature. Assume that the linear expansion coefficient of concrete is 0.000093/°C, the temperature variation in Figure 2(b) is about 10°C, the effective temperature-induced strain variation in Figure 2(a) should be 105 − 93 = 12 με. The effective strain variation in Figure 2, including the temperature-induced strain and vehicle-induced strain, is approximately 32 με. For the concrete with an elastic model of 3.45 × 10⁴ N/mm2, the stress is about 1.104 MPa, it does not exceed the ultimate tensile strength (2.64 MPa) and design tensile strength (1.89 MPa). 34 It should be noted that, in the China code, ultimate tensile strength means the concrete ultimate tensile stress of the standard test piece in the laboratory and design tensile strength means the concrete ultimate tensile stress considering construction variability.
Since the initial value of strain sequence cannot be determined, and the thermal expansion and contraction does not directly cause stress, the temperature-induced strain may not be a good indicator for evaluating the long-term service performance of the bridge structure. In contrast to the temperature-induced strain, the signal of the vehicle-induced strain of each vehicle crossing has the explicit datum point, which can accurately quantify the load effect and indicate the long-term evolution of the cracking of bridge.
After the decomposition of the temperature-induced and vehicle-induced strains from the monitoring strain data, it is necessary to extract the features of the vehicle-induced strain when each vehicle crosses the bridge. Figure 3 shows a segment of data in Figure 2(c). As shown in Figure 3, the data history of the vehicle-induced strain consists of the stationary section and the non-stationary section. The non-stationary section is the bridge strain response under each crossing vehicle, which characterizes the live-load strain feature. Due to the weights, lanes, and other random factors, the amplitude of each non-stationary section has variability. The threshold method is generally used to extract the non-stationary sections and their features from the vehicle-induced strain history: the vehicle-induced strain features are extracted by pre-setting an empirical threshold, if an extreme point is larger than the empirical threshold, it will be judged as a live-load feature. However, the threshold method will be interfered by the abnormal data in monitoring, the small responses will be neglected if the empirical threshold is set inaccurately. Moreover, the extraction process of the threshold method requires manual supervision and judgment.
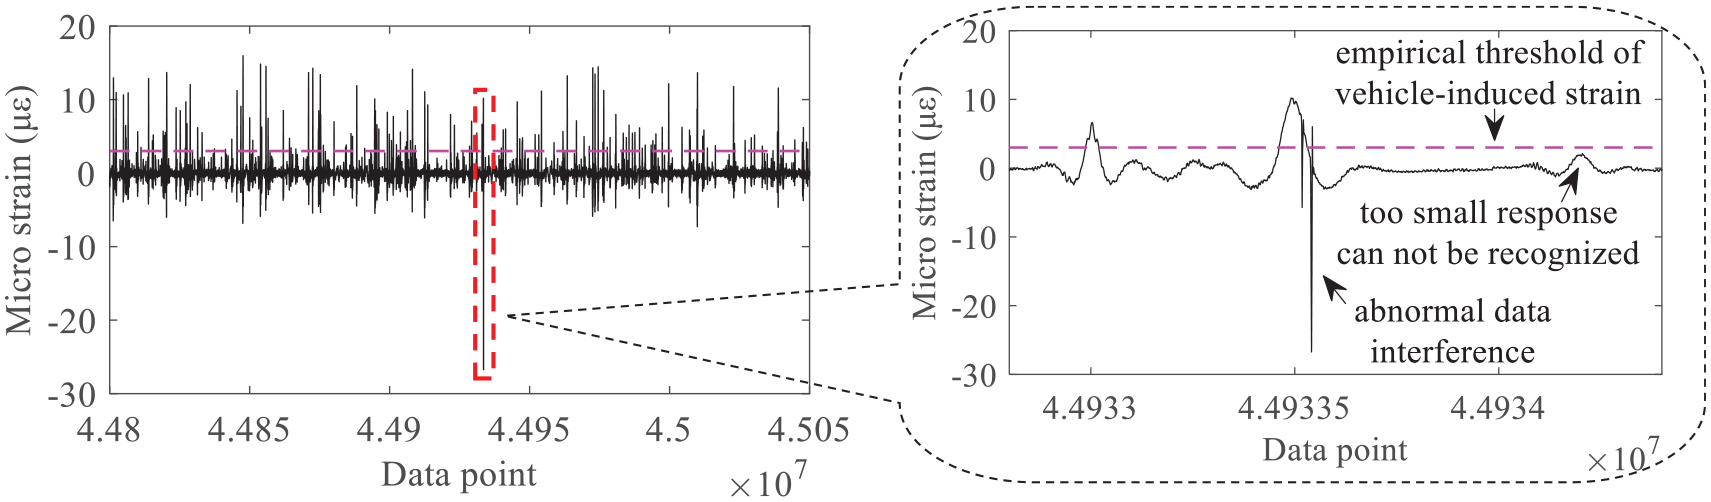
Defects of the threshold method for extracting the non-stationary sections of vehicle-induced strains.
Hence, an intelligent extraction method of the non-stationary section of the vehicle-induced strain is needed. The deep learning and classification using the artificial neural network are the effective means to solve this problem. The non-stationary and stationary sections of vehicle-induced strain for training and testing are labeled by experts. The labeling principle of the non-stationary and stationary classifications depends on not only the amplitude value (the maximum of amplitude should be greater than the fuzzy threshold judged by the supervisor of labeling, the fuzzy threshold is not a constant) but also the characteristic of signal trend. The trained deep learning network with enough accuracy of test can intelligently classify non-stationary sections of vehicle-induced strain. According to the vehicle-induced strain signal from different types of component strains, the fuzzy thresholds are selected to be around 1.2 mm in this article, different types of component strains have different fuzzy thresholds, but all fuzzy thresholds are within 0.9–1.5 mm. After extracting the non-stationary section of the vehicle-induced strain, the feature value of vehicle-induced strains can be obtained. Then, based on the big data of vehicle-induced strain feature, the clusters of feature data under different types of vehicles could be clustered. Finally, the state evaluation and cracking early warning of the bridge will be conducted according to the reliability analysis of heavy vehicle strain cluster. The strategy in this article is shown in Figure 4.
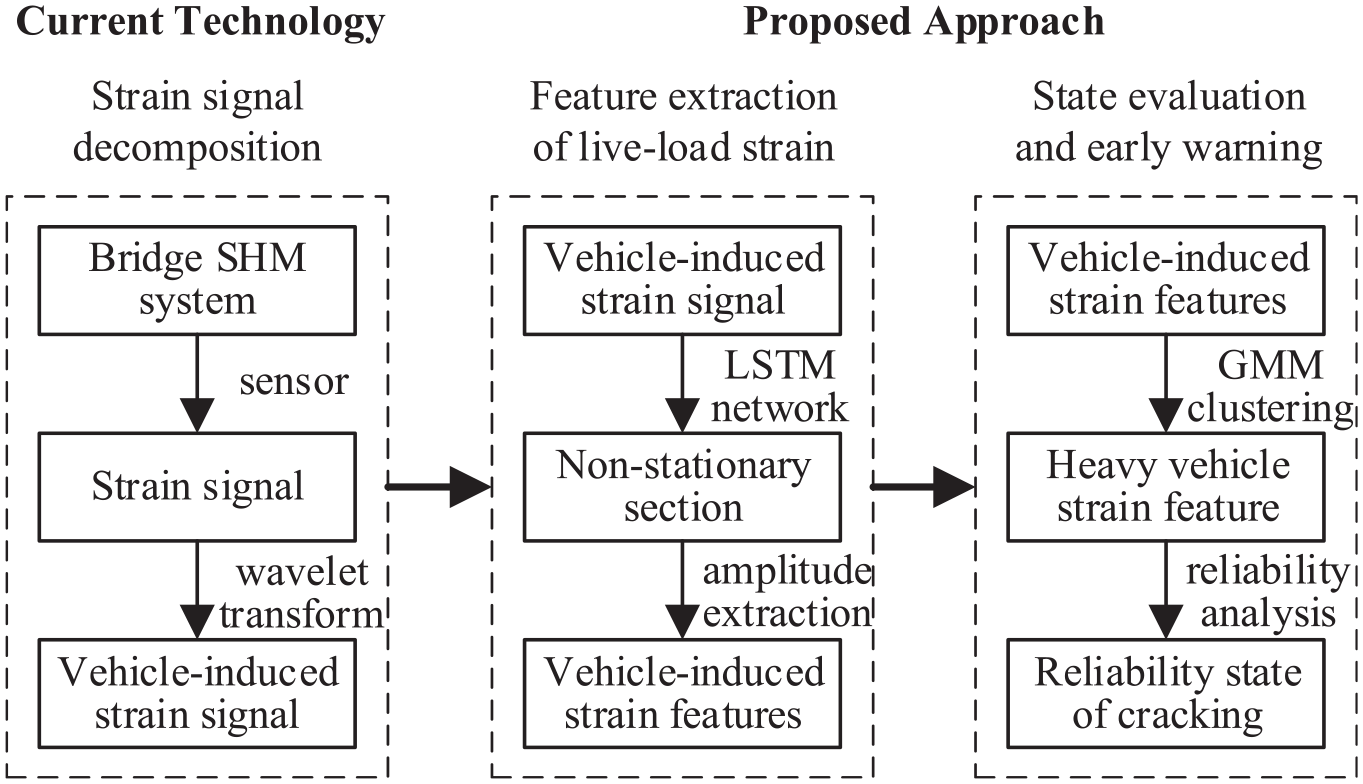
Proposed approaches facing the problem of the evaluation for the existing bridges.
Feature extraction of vehicle-induced strains using deep learning
Although the vehicle-induced strain responses of bridge components have randomness and variability, they also obey some certain regularity. Using the artificial neural network to deeply learn the vehicle-induced strain sample, the vehicle-induced strain non-stationary section can be intelligently extracted, and the vehicle-induced strain feature value can be obtained.
Methodology: long short-term memory network
Recurrent neural network (RNN) is widely used in time series analysis. RNN refers to a class of recursive neural network, where connections between nodes form a directed graph along a temporal sequence. This allows it to exhibit temporal dynamic behaviors of sequences and to use its internal state to process sequences of inputs. 35 Typical RNN is a directed acyclic architecture composed of an input layer, a hidden layer, and an output layer. The hidden layer is the core of the recurrent procedure, which consists of multiple units. The output value of its unit depends not only on the input of this unit (time) but also on the output of the last unit (time), and the higher unit will not propagate information to the lower unit. The “recurrent procedure” of RNN will save the outputs of the hidden layer in the network and then calculates the next moment outputs together with the next moment inputs. The common RNN architecture is shown in Figure 5.
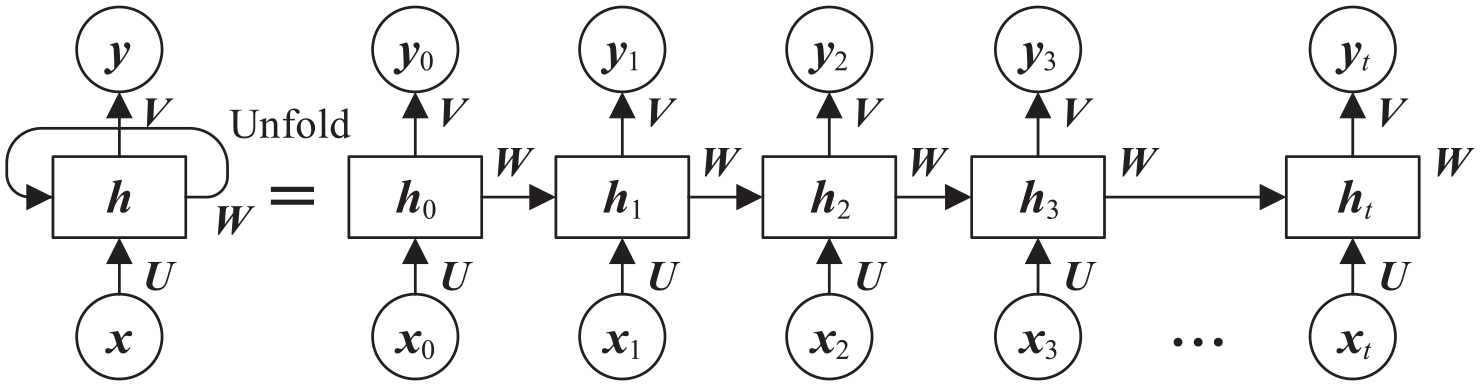
Common architecture of RNN.
At time t (in Figure 5), the input of the network is


Equation (2) is the calculation formula of the hidden layer calculation formula, this layer is a recurrent layer,
Long short-term memory (LSTM) network is a special RNN architecture designed to solve the problem of gradient disappearance of RNN. It has been widely used in deep learning tasks such as the machine translation. 36 A common LSTM unit is composed of a cell, an input gate, an output gate, and a forget gate. The cell remembers values over arbitrary time intervals and the three gates regulate the flow of information into and out of the cell. In the process of deep learning, the weights will be updated, some information can be directly forgotten, and some information can be saved. Figure 6 shows the common architecture of the LSTM network unit.
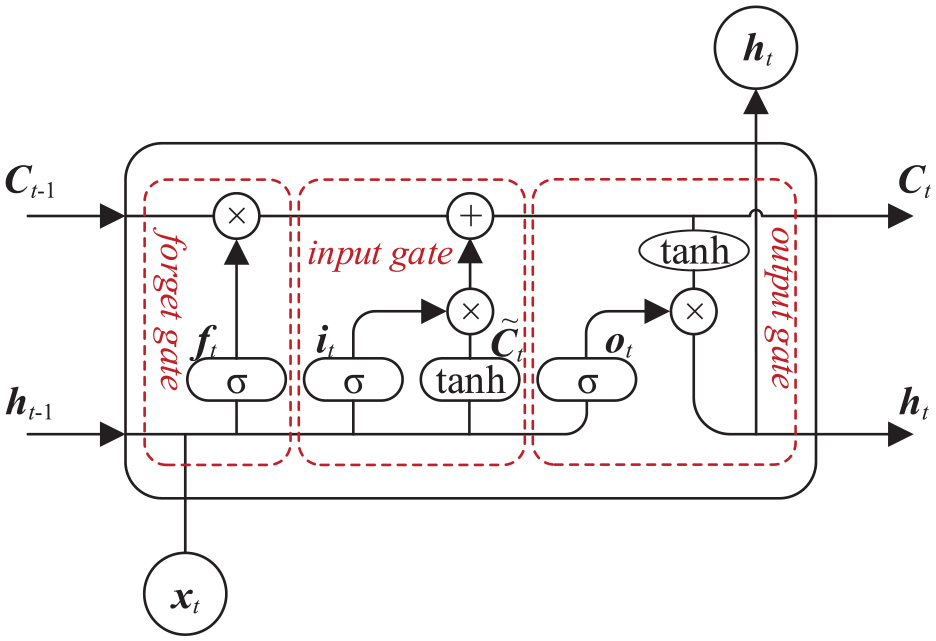
Unit architecture of LSTM network.
The LSTM network unit can be described by equations (4)–(9)


where σ denotes the Sigmoid function. · denotes the dot product.
In accordance with the principle of RNN and LSTM, it can be found that RNN and LSTM network (which is developed for the sequence data) may have higher computational efficiency for most one-dimensional monitoring data than CNN (which is developed for the image data).
Adaptive extraction of vehicle-induced strain feature by LSTM network
Using LSTM network to learn the sample data of the vehicle-induced strain, it is feasible to adaptively extract the non-stationary section of the vehicle-induced strain from the continuous signal, that is, the vehicle-induced strain influence line. Then, the feature parameters of the vehicle-induced strain can be further obtained such as the maximum, minimum, or amplitude (maximum − minimum).
Design a bidirectional LSTM (BiLSTM) network to learn and classify the stationary and non-stationary vehicle-induced strains. The BiLSTM network architecture is shown in Figure 7(a), the architecture consists of five layers: the sequence input layer, the BiLSTM hidden layer, the fully connected layer, the softmax layer, and the classification output layer.
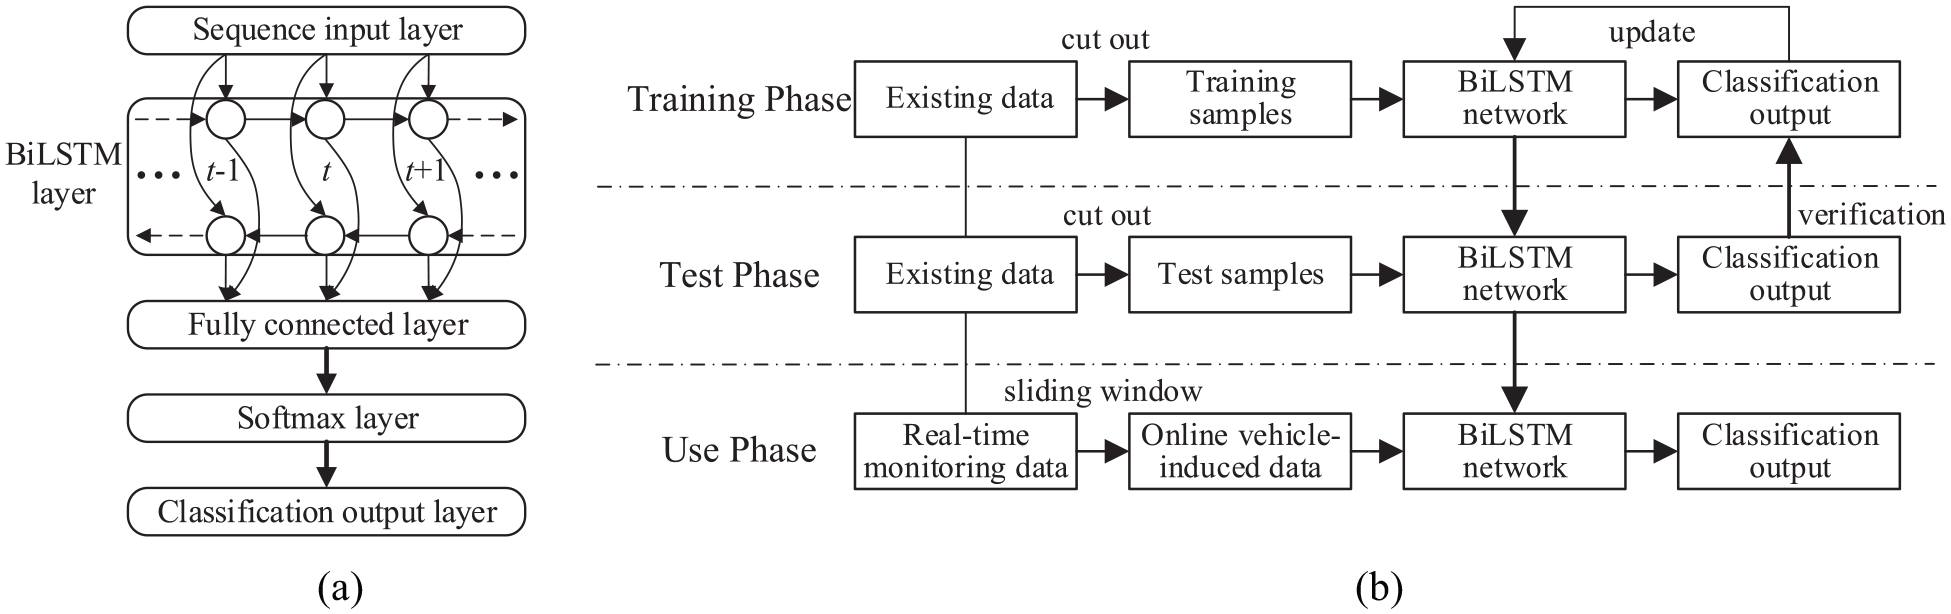
Feature extraction of vehicle-induced strains by LSTM network: (a) architecture of BiLSTM network and (b) classification strategy using deep learning.
Figure 7(b) shows the strategy for the online classification and extraction of non-stationary sections of vehicle-induced strains using BiLSTM network structure: (1) in the Training Phase, cut out the non-stationary and stationary samples of the vehicle-induced strain from the existing data, train the BiLSTM network model, and optimize the network parameters and training parameters according to the training time and test accuracy; (2) in the Test Phase, use other samples to test the accuracy of the network model, and if the test accuracy is less than the expected value (e.g. 99%), then return to the Training Phase and continue training the network model with updated parameters; and (3) in the Use Phase, use the BiLSTM network model with enough accuracy of test to classify and extract the non-stationary sections of vehicle-induced strains, and the online extraction uses a sliding window to capture the input sources.
In this article, the solver for network training uses adaptive moment estimation (Adam) optimizer. The training data and test data are from different periods, and all of them have been labeled with non-stationary and stationary by manual supervision (H.Z.). The sequence length of training and test data is from 10 to 3000. After several rounds of trials, the BiLSTM network model in this article finally selects a BiLSTM hidden layer with 20 units, the maximum epoch of network training is set to 300, the minimum batch size is set to 200. Table 1 shows the training and test details of the BiLSTM network models for each component. The classification is considered accurate in the Test Phase, if the prediction of the trained BiLSTM network matches the manual labeling. Each kind of vehicle-induced strain responses at different locations can share one model, for their signal obeys similar law. As shown in Table 1, the classification accuracy of test for all four types of strain responses surpasses 99%. Using BiLSTM network, the non-stationary sections of vehicle-induced strains can be effectively classified and extracted, meanwhile, the sensor abnormal signal (noise) is removed.
Training and test details of the BiLSTM network models for each component.
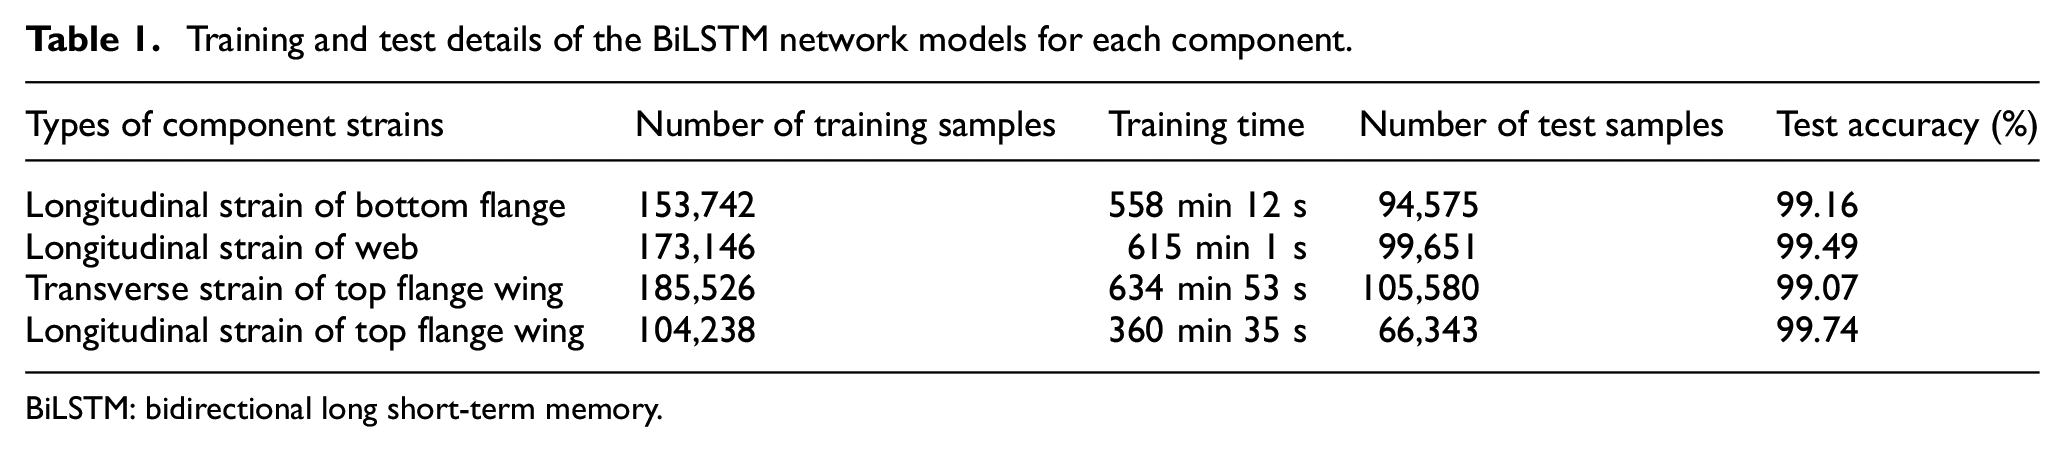
BiLSTM: bidirectional long short-term memory.
During the classification process in the Use Phase, a sliding window is moved in a certain step and used as an online classification input source, and each step records its position (time). If several adjacent input sources are judged to be the non-stationary vehicle-induced strains with the repeated peak (extreme point) positions, only the middle one will be recorded.
Figure 8 shows the typical feature of each type of vehicle-induced strains. As shown in Figure 8, the longitudinal vehicle-induced strains of the bottom flange and the web are similar, the strain amplitude of the bottom flange is slightly larger than the web, and the transverse and longitudinal vehicle-induced strains of the top flange wing have their laws, their number of peaks are the same as the number of vehicle axles.
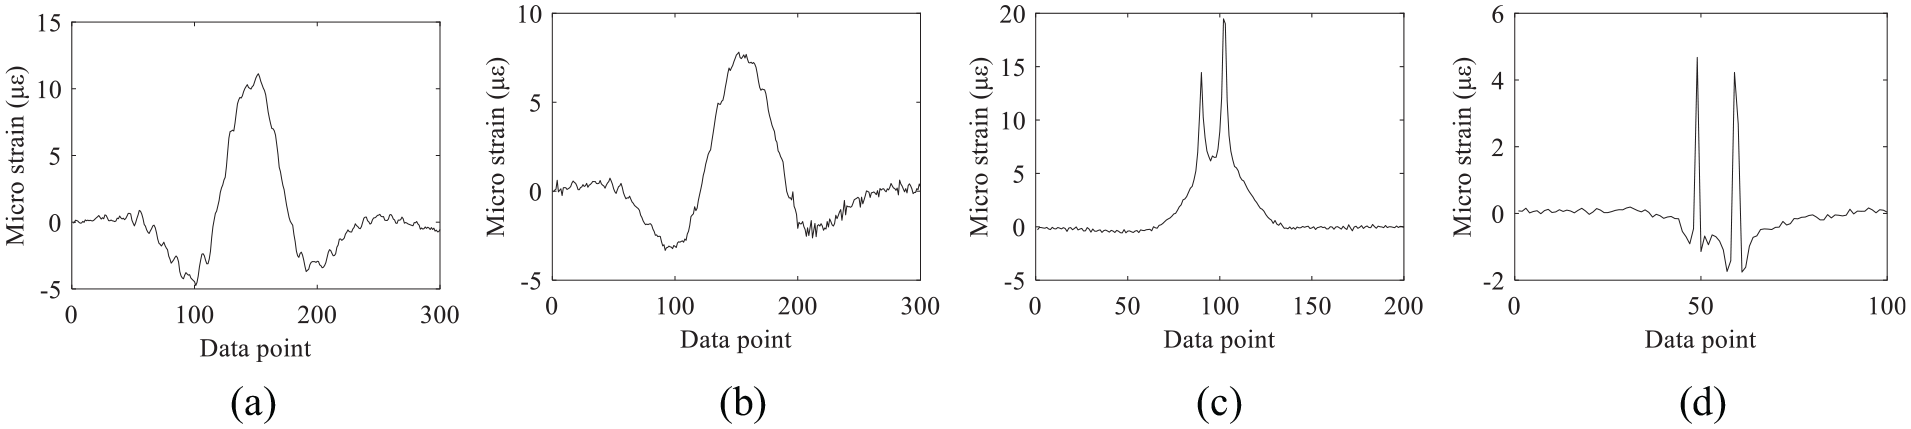
Typical vehicle-induced strains of the prestressed concrete box-girder bridge: (a) longitudinal strain of bottom flange, (b) longitudinal strain of web, (c) transverse strain of top flange wing and (d) longitudinal strain of top flange wing.
Based on the strain monitoring data within 3 months, the feature value (amplitude) of vehicle-induced strains for each vehicle load is extracted using the trained BiLSTM network. The mean of the amplitude of vehicle-induced strains for each sensor is shown in Figure 9. The Girder 4 has the largest bottom flange and web longitudinal strains. The pouring concrete between Girder 3 and Girder 4 has the largest top flange wing transverse and longitudinal strains. They mean that the Lane 3 (heavy vehicle lane) of highway is the most commonly used lane for heavy vehicles. However, the mean value of the amplitude of vehicle-induced strains cannot reflect the randomness of the live-load effect, nor can it conduct the live-load strain evaluation for the bridge cracking.
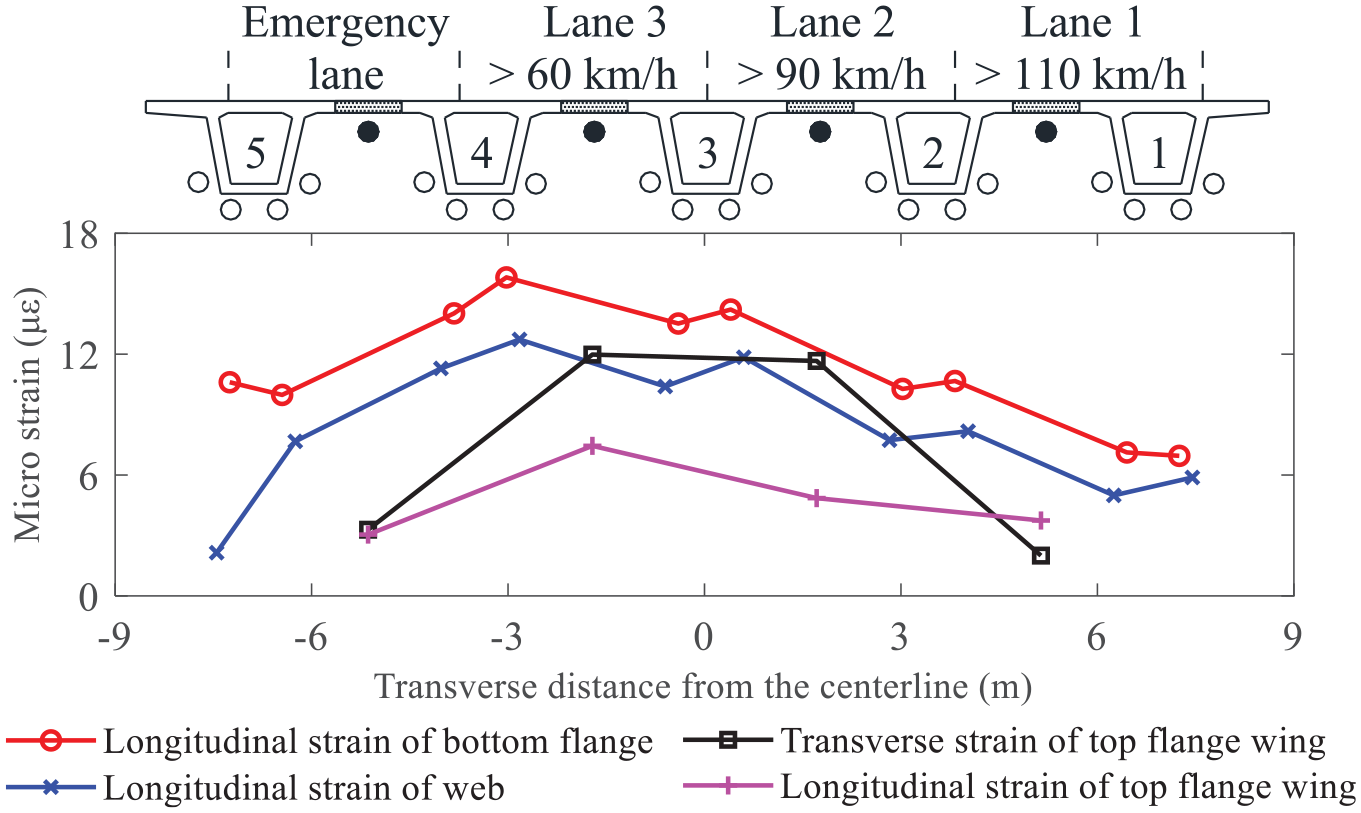
Mean of the amplitude of vehicle-induced strains from the bridge strain sensors.
Reliability and early warning of the bridge cracking via clustering features
After obtaining the feature value of vehicle-induced strains by the artificial neural network, the feature values of vehicle-induced strain should be clustered to find the data cluster related to concrete cracking. Based on the probabilistic reliability of this data cluster, the state evaluation and cracking early warning of the bridge can be realized.
Strain features clustering via Gaussian mixture model
The vehicle-induced strain amplitude of a single measuring point will concentrate on multiple clusters (as shown in Figure 10). This phenomenon may be due to the different vehicle weights and different transverse locations of vehicle loading. With the accumulation of data, the data distribution of the amplitude of vehicle-induced strains can be fitted using Gaussian mixture model (GMM). And, these data can be clustered via GMM-based clustering method.
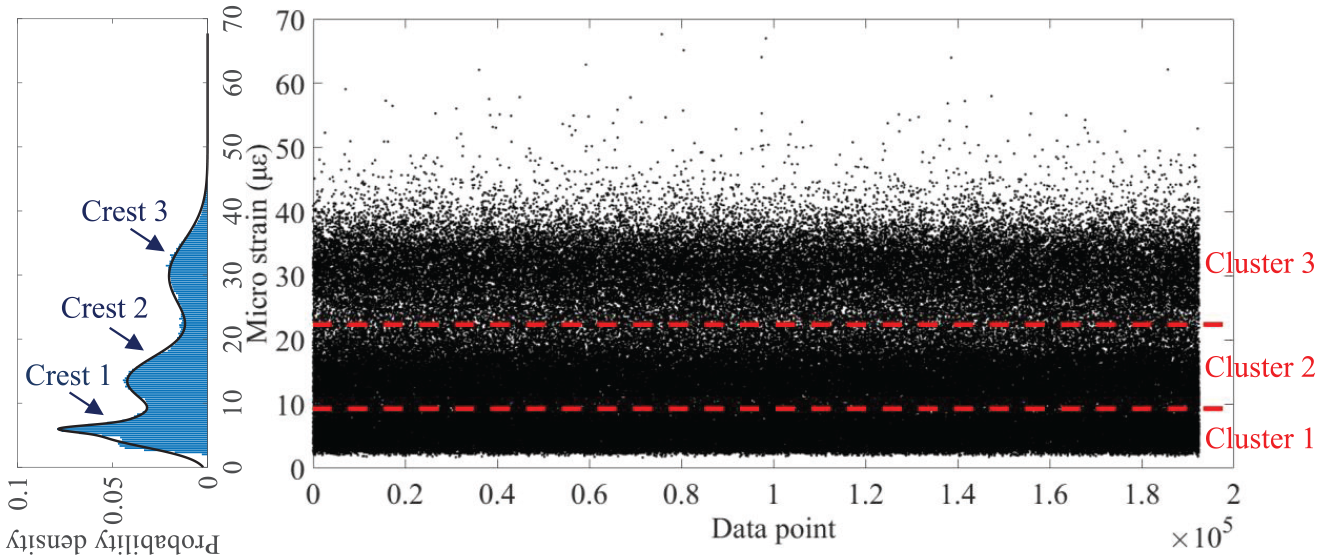
Clustering of strain feature data of Sensor 7 via GMM.
Equations (10) and (11) are the expressions of Gaussian distribution and mixture Gaussian distribution
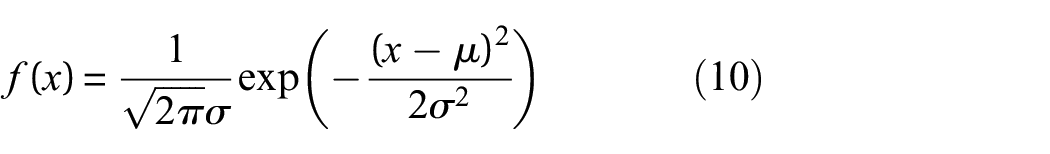
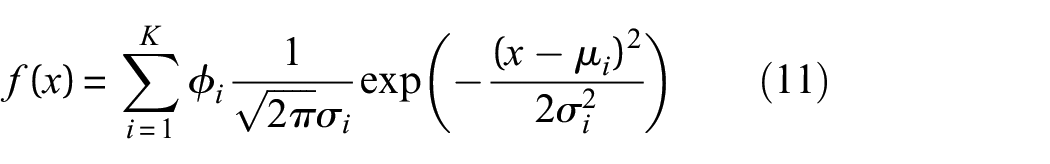
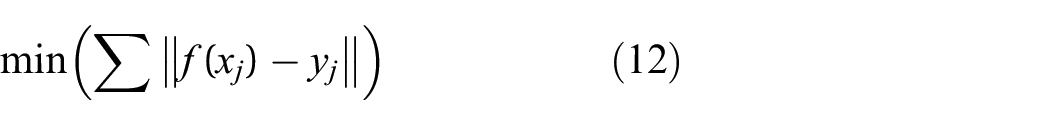
where μ and σ denote the mean and standard deviation of Gaussian distribution, respectively. Based on the frequency histogram of vehicle-induced strain amplitude data, a mixture Gaussian curve can be fitted using the least squares method (equation (12)). In this article, the vehicle-induced strain amplitude data are divided to n bins of frequency histogram (n = 200–300). xj denotes the value of each bin center in the x-axis (the strain-axis), yj denotes value of each bin in the y-axis (the frequency-axis), and f(xj) denotes the value of the fitting function of least squares method at xj.
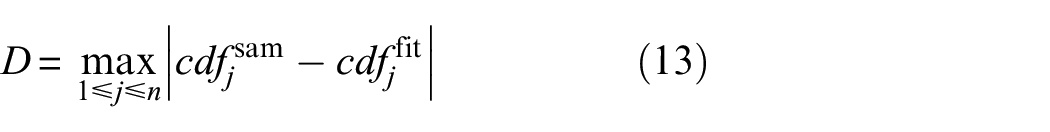
Normalize the integral value of the fitted curve on [−∞, ∞] to 1 and then the GMM probability density function (PDF) and its parameter estimation value can be obtained. The fitting result of GMM PDF should be passed by Kolmogorov–Smirnov goodness-of-fit test (equation (13)) at the confidence level of 0.95 (or even higher). In equation (13),
Use the minimum-point or inflection-point (when there is no minimum-point) between two crests of GMM as clustering boundaries of vehicle-induced strain feature data. Then, the live-load effect is divided to different clusters.
Figure 10 shows the clustering results of the vehicle-induced strain feature data from the longitudinal strain of bottom flange (Sensor 7). As shown in Figure 10, the GMM has three crests which, respectively, correspond to three data clusters of vehicle-induced strain features; from 0 με, the first crest is fitted by two weighted Gaussian distributions, and the second and third crests are fitted by one Gaussian distribution, respectively. Three crests correspond to three clusters of the vehicle-induced strain feature data. Cluster 3 can be understood as the strain responses from the loading effects of heavy vehicles, Cluster 2 can be understood as the strain responses from the loading effects of medium vehicles, Cluster 1 can be understood as the strain responses from the loading effects of light vehicles. The concrete design and ultimate cracking strains of the bridge are 54.78 and 76.52 με, respectively. The third cluster of the longitudinal strain of bottom flange has exceeded the concrete design cracking strain, and it has approached the ultimate cracking strain. This phenomenon means the study case of bridge in this article may have entered into the working-with-cracks stage, resulting in a so-called live-loaded breathing effect of the prestressed concrete: the crack appears under the heavy vehicle effect; after vehicles crosses the bridge, the crack disappears due to the prestressing. According to the above analysis, the heavy vehicle cluster of vehicle-induced strain feature data will first reach the concrete cracking strain during the structure deterioration. Hence, it can be used to evaluate the cracking reliability of the prestressed concrete box-girder bridge. The clustering process of vehicle-induced strain feature data for other sensors is similar with Sensor 7.
The bridge is installed with a vehicle weighing in motion (WIM) system at the bridge end to monitoring the gross weight, axle weight, wheelbase, and other vehicle parameters. After the clustering of vehicle-induced strain feature data, the correlation between the heaviest cluster of vehicle gross weight, the heaviest cluster of vehicle maximum axle weight, and the heaviest cluster of vehicle-induced strain amplitude can be gained. After data clustering, the input–output correlation will be more obvious. Considering that the bridge strain responses caused by some of the light vehicles is too small, here only analyzes the vehicle data with a total weight of more than 5 t. Figure 11(a) and (b) shows the GMM of the vehicle gross weight and the vehicle maximum axle weight data in 50 days. Figure 11(c) shows 52 day-correlation between the mean of the heaviest cluster of vehicle gross weight, the mean of the heaviest cluster of vehicle maximum axle weight, and the mean of the biggest cluster of vehicle-induced strain amplitude; every 2 days, a data clustering is made, and the mean value from the corresponding single Gaussian distribution of GMM is calculated. As shown in Figure 11, the degree of correlation between vehicle maximum axle weight and vehicle-induced strain amplitude is higher than the degree of correlation between vehicle gross weight and vehicle-induced strain amplitude. The relational mapping between the (heavy) vehicle and the (heavy) vehicle-induced strain can be established after data clustering.
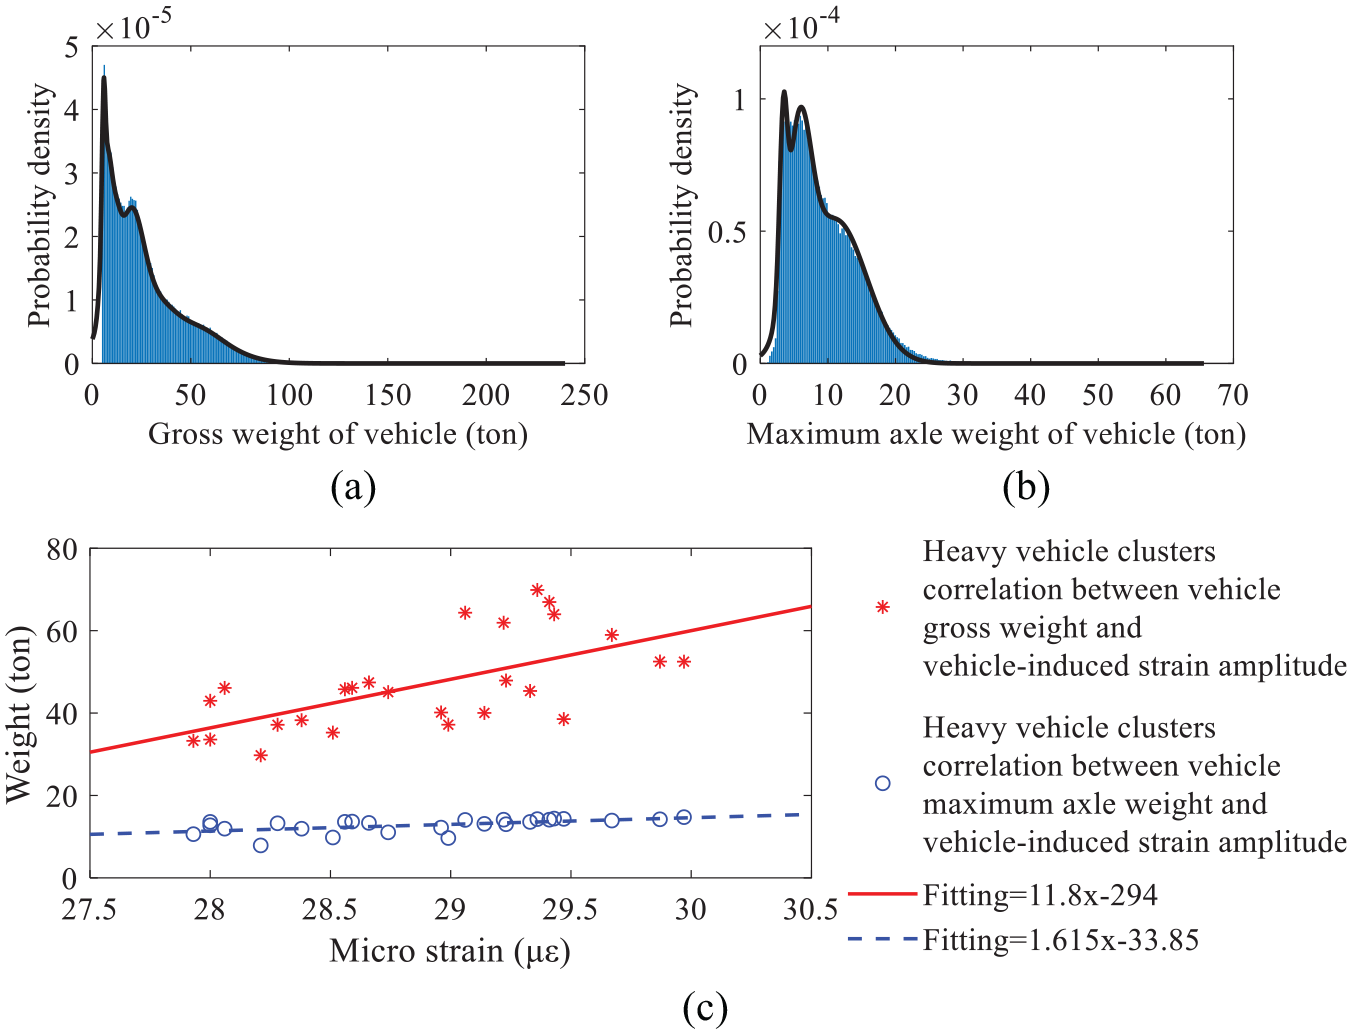
Vehicle weights and their correlation with the heavy vehicle strain: (a) GMM of vehicle gross weight; (b) GMM of vehicle maximum axle weight; and (c) heavy vehicle cluster correlation between vehicle gross weight, vehicle maximum axle weight, and vehicle-induced strain amplitude.
Based on the GMM of the vehicle-induced strain feature and WIM data, it can be found that the biggest cluster of vehicle-induced strain amplitude has a high degree of correlation with the heaviest cluster of vehicle weight as above analysis. In this article, the data in the heaviest cluster of vehicle weights are defined as the heavy vehicle data according to the characteristics of data probability distribution. Hence, the biggest cluster of vehicle-induced strain amplitude can be used to evaluate the effects of the heavy vehicle.
Reliability and early warning of the bridge cracking
Heavy vehicle strain is the main cause of the bridge cracking. The clustering data of heavy vehicle strain feature should be used to analyze the cracking reliability and then conduct the early warning of the bridge cracking.
Normalize the integral value of the single normal distribution curve, which is corresponding to the heavy vehicle strain feature, to 1 on [−∞, ∞]. Then, the PDF of the heavy vehicle clustering data can be obtained as
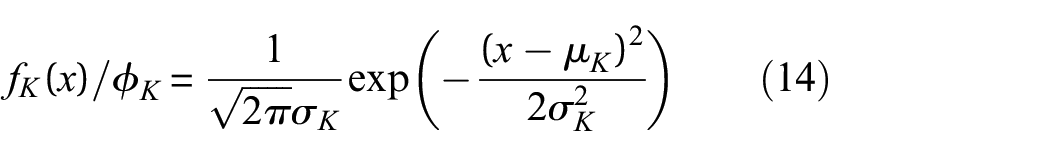
Integrate equation (14) to obtain CDF of the heavy vehicle clustering data. Next, assuming that
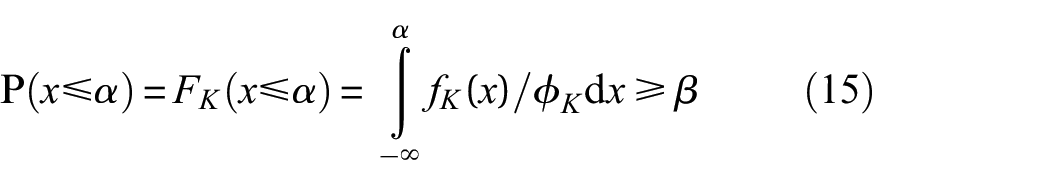
Define the α (corresponding to a certain β of guarantee rate) as the state of the live-load effect about the bridge cracking under the effects of heavy vehicles and then the cracking reliability of bridge components can be quantified using α.
In this article, the β equals 95%, and it is assumed that the amplitude of heavy vehicle strains exceeds α (corresponding to β) as an event of small probability. Based on the existing data in 3 months, the value of α for Sensor 7 is 38.93 με. It should be noted that the prestressed structure is allowed working with cracks; therefore, it is considered as an event of small probability if the occurrence probability is less than 0.05; for other important structures or reinforced concrete structures, the β should take a higher value.
As shown in Figure 12, when α is greater than the design or ultimate cracking strain, it means that the bridge cracking occurs frequently under the effects of heavy vehicles. With the degradation of bridge structure during service, the α will gradually approach or even exceed the design and ultimate cracking strains. Then, the heave trucks should be restricted crossing the bridge, and the bridge needs to be inspected and reinforced.
Reliability analysis and early warning of Sensor 7 for the bridge cracking: (a) CDF estimation and (b) early warning principle.
Figure 13 shows the value of α for each sensor based on the existing data of 3 months. The longitudinal strain of bottom flange (Sensor 7) has the largest value under the effects of heavy vehicles, considering the 25-m prestressed concrete box-girders are all precast in similar standard-design in China, it may be one of the most dangerous index for the monitoring and inspection of existing prestressed concrete box-girder bridges. Comparing Figure 9 with Figure 13, it can be found that the high–low order of α values of each sensor is not the same as the mean values. This is because the α value contains the live-load variation, it will be more accurately to reflect the current service state of the bridge under the effects of live-load, especially under the effects of heavy vehicles. Furthermore, α value of can be dynamically updated with the update and accumulation of monitoring data.
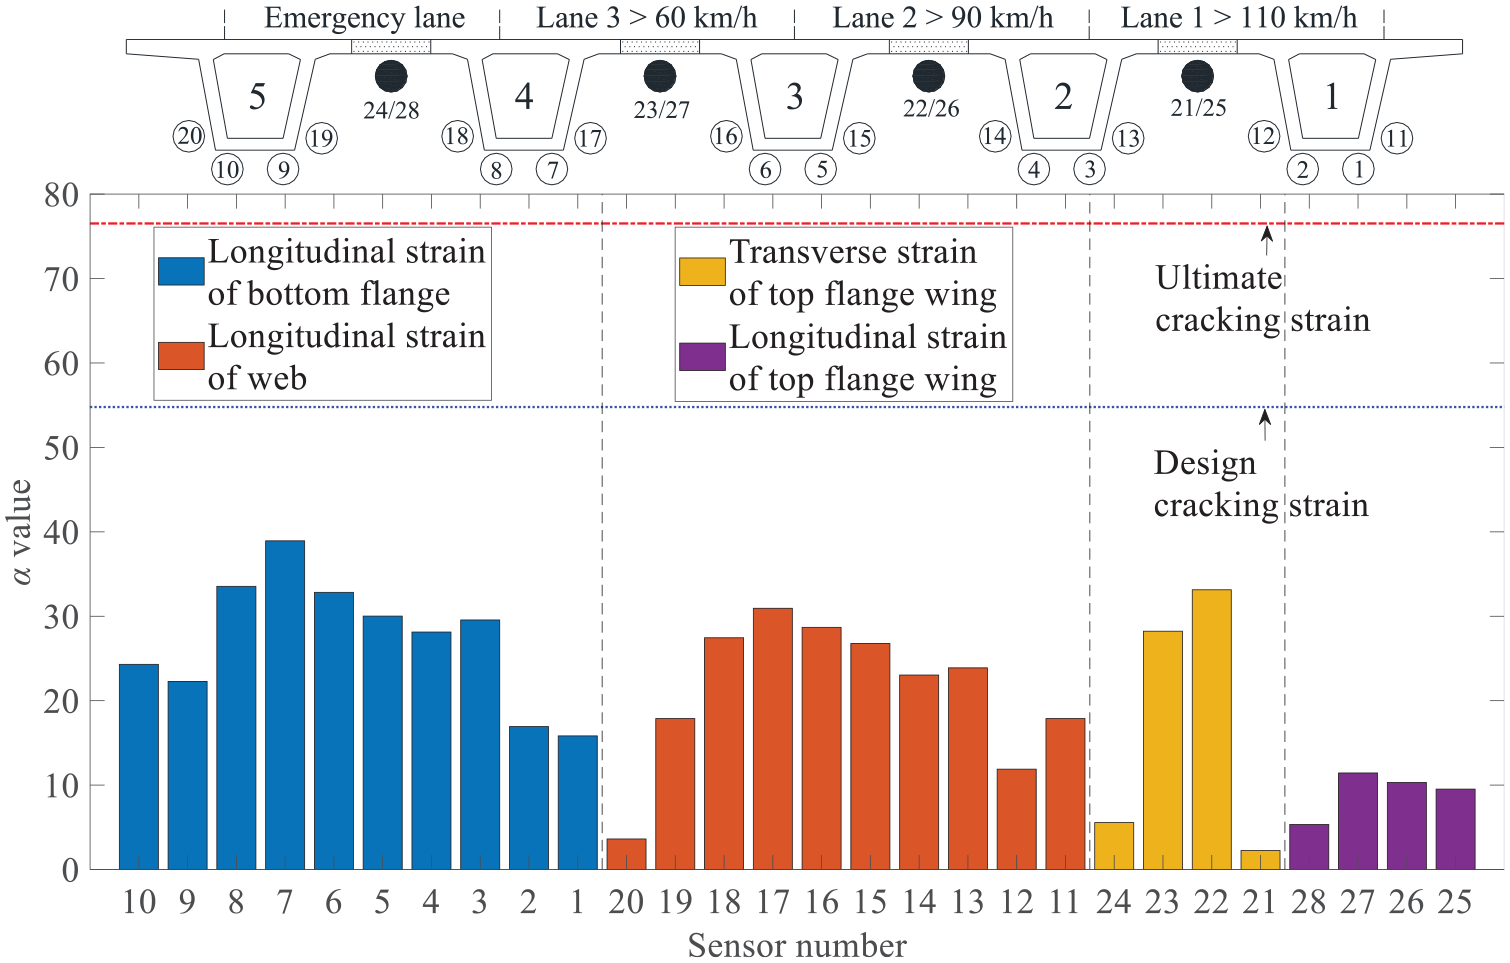
α value of each sensor.
When the value of α approaches and exceeds the design or ultimate cracking strain, the SHM system will send an alert to the staff of the bridge inspection, truck-weight-limit and reinforcement. Comprehensively using the deep learning and classification of LSTM network, the GMM-based clustering of vehicle-induced strain feature data, and the reliability analysis of heavy vehicle strains, the state evaluation and cracking early warning of the prestressed concrete box-girder bridge can be conducted. With the accumulation of monitoring data, the statistical redundancy of the early warning system can be updated for more informed long-term bridge operation. The approaches facilitate intelligent monitoring and maintenance of the cracking of the prestressed concrete box-girder bridges.
It should be noted that this article focuses on the live-load strain evaluation. For the evaluation of the bridge cracking, the evaluation of the uncertainty resistance of bridge structure is another important problem. In the field of bridge monitoring and maintenance, the cracking of bridge can be obtained by manual or unmanned aerial vehicle (UAV) inspection. Then, the design and ultimate cracking strain thresholds in Figures 12(b) and 13 can be dynamically updated by the analysis of the inspection results and monitoring data. The authors’ group wishes to present the related methods for this topic in the future study.
Conclusion
The cracking of the prestressed concrete box-girder bridges during operation is difficult to evaluate. The strain is the intuitive indicator of structural cracking. Since the signal of live-load strain has the explicit datum point, it can accurately reflect and quantify the load effect and cracking of bridges. This study develops a comprehensive method of state evaluation and cracking early warning using LSTM deep learning and GMM-based clustering. The main conclusions are drawn as follows:
The vehicle-induced strain responses of each type of bridge component obey some certain regularity with randomness and variability. Using the LSTM network, a deep learning model can be trained to intelligently classify the non-stationary and stationary sections of vehicle-induced strains. The sensor abnormal signal will be removed, and the test accuracy of the classification surpasses 99%. The vehicle-induced strain feature value, amplitude of each non-stationary section, can be obtained for evaluating the live-load effects and the bridge state.
The vehicle-induced strain feature data of a single measuring point will concentrate on different clusters, which depends on the statistical characteristics of vehicle loading. According to the GMM probability distribution of data, the vehicle-induced strain features can be clustered by the corresponding GMM crest. Based on the analysis on the heavy cluster correlation between vehicle weight and vehicle-induced strain amplitude, the accuracy and necessity of the data clustering are verified.
Comprehensively using the LSTM deep learning, the GMM-based clustering, and the reliability analysis, a data-driven method can be conducted for the state evaluation and cracking early warning of existing prestressed concrete box-girder bridges, which is based on the vehicle-induced strain data from bridge SHM system.
Engineering conclusions: (1) the largest bottom flange and web longitudinal strains and top flange wing transverse and longitudinal strains occur at heavy vehicle lane, (2) the degree of correlation between vehicle maximum axle weight and vehicle-induced strain amplitude is higher than the degree of correlation between vehicle gross weight and vehicle-induced strain amplitude, and (3) under the effects of heavy vehicles, the longitudinal strain of bottom flange have the largest value than other component strains, it may be paid more attention in the monitoring and inspection for the in-service prestressed concrete box-girder bridges.
Footnotes
Declaration of conflicting interests
The author(s) declared no potential conflicts of interest with respect to the research, authorship, and/or publication of this article.
Funding
The author(s) disclosed receipt of the following financial support for the research, authorship, and/or publication of this article: This research was supported by the National Key R&D Program of China (grant no. 2017YFC0840200) and the National Natural Science Foundation of China (grants nos 51978154, 51438002, and 51578138).