
Abstract
The detection of cracks in concrete structures is a pivotal aspect in assessing structural robustness. Current inspection methods are subjective, relying on the inspector’s experience and mental focus. In this study, an ad hoc You Only Look Once version 2 object detector was applied to automatically detect concrete cracks from real-world images, which were taken from diverse concrete bridges and contaminated with handwriting scripts. A total of 3010 cropped images were used to generate the dataset, labelled for two different detection classes, that is, cracks and handwriting. The proposed network was then trained and tested using the generated image dataset. Three full-scale images that contained disturbing background information were used to evaluate the robustness of the trained detector. The influence of labelling handwriting as an object class for network training on the overall crack detection accuracy was assessed as well. The results of this study show that the You Only Look Once version 2 could automatically locate crack with bounding boxes from raw images, even with the presence of handwriting scripts. As a comparative study, the proposed network was also compared with faster region-based convolutional neural network. The results showed that You Only Look Once version 2 performed better in terms of both accuracy and inference speed.
Introduction
Concrete structures are heavily influenced by environmental conditions. Chemical erosion, neutralisation, frost-salt scaling and alkali aggregate reaction are some common degradation mechanisms that result in cracks. 1 In particular, concrete cracks pose a threat to the health of the structure and the safety of its users. In the United States, civil infrastructure systems are estimated to be worth US$20 trillion. 2 Inspections of these prevalent systems allow agencies to predict future conditions, to support investment planning and to allocate their limited maintenance and repair resources. 3 Several incidents have been directly related to insufficient inspection and condition assessment of concrete structures. For example, 10 people died as a result of the sudden collapse of the New York State Thruway Bridge over Schoharie Creek in 1987. In the final accident report, the New York State Thruway Authority identified major safety issues including lack of inspection guidance for the initiation and unstable propagation of the curvilinear crack in the pier. 4 Current concrete inspection methods include manual visual assessment using a crack scale. Typically, condition assessment procedures are performed manually by certified inspectors or structural engineers, either at regular intervals or after disasters. This, however, is both time and labour consuming and relies on the inspector’s experience and mental focus. Areas of structures that are difficult to examine may be inspected using binoculars, or dangerously disregarded altogether. Moreover, in an extreme event, such as terrorism or earthquake, real-time structural monitoring would be paramount to quickly identify the change in structural soundness, such as cracking characteristics, which may pose a threat to the public safety if it is not analysed on time. With increases in labour costs, the need for automatic and real-time damage detection is escalating.
Recently, to address the shortcomings of manual inspection, computer vision (CV) has been integrated into bridge inspection and evaluation.5–8 CV, which enables the computer to recognise and understand the images and scenes, has become an integral part of structural health monitoring (SHM) systems of bridges. For faster and more reliable asset management, automatic crack detection systems have been developed to minimise the subjectivity of traditional human inspection procedures, in particular with the involvement of unmanned aerial vehicles (UAVs).9,10
A number of approaches have been proposed to address the challenge of manual inspection using CV-based crack detection. From the aspect of manual inputs, existing approaches can be divided into rule-based and machine learning–based (ML-based) methods.11,12 Rule-based or image processing techniques (IPTs) use predefined features to identify cracks from images such as edge detection methods and pattern recognition techniques.13–18 The edge detection technique is based on the assumption that crack pixels are generally darker than their surroundings, although some techniques based on the gradient of pixel values and brightness are available, which may be more robust to wider cracks and more complex geometries. 19 IPT approaches are fast and easily embedded in vision systems, but results are greatly affected by brightness, shading and resolution of images. 20 Standard rule-based feature crack detections were generally combined with different IPTs and different researchers have used several combinations of the available IPTs to achieve the optimal automated system so as to produce useful and real-time results, with a reliable level of precision and consistency. Conventional IPTs mostly deal with the pixels and regions inside the images directly and generate the regions of interest (RoIs). However, the results based on these methods heavily rely on the predefined parameters and are prone to the environmental effect in real-life situations. In addition, these methods all require some form of manual input.
However, ML-based approaches such as convolutional neural networks (CNNs), which are able to conduct highly nonlinear mapping that outputs the target features in a specified form based on the input image, show more potential in real-time detection of structural damages.21–26 In this respect, deep neural networks (DNNs) have shown remarkable potential in image-based classification, detection and recognition.27–33 DNNs have more layers and parameters than typical ML-based techniques, which promote more accurate object detection. 34 Furthermore, a fully convolutional network (FCN)-based algorithm has been developed to detect different types of concrete surface damage, such as cracks, spalling, efflorescence and holes, which is an end-to-end, pixel-to-pixel convolutional network for semantic segmentation.12,35–38 The proposed FCN successfully detected the damage at pixel level and showed low levels of noise. However, the method required a large number of images to train a robust model and the training process can be laborious in terms of time as well.33,39 Labelling the images manually is hugely time-consuming and is therefore another limitation of this method. CrackNet, an efficient architecture based on CNN, was proposed for automatic crack detection on three-dimensional (3D) asphalt surfaces with high accuracy at the pixel level. 40 However, CrackNet required substantial processing time and had more difficulty in detecting hairline cracks successfully. 40 The biggest challenge of automated crack detection is maintaining consistent accuracy under complex environments, such as rough asphalt. Subsequently, CrackNet-V was developed using a Visual Geometry Group (VGG) network to automatically detect cracks on 3D asphalt pavement images. 41 Compared to CrackNet, CrackNet-V has a deeper architecture but fewer parameters, resulting in improved accuracy and efficiency. CrackNet-V is better at detecting fine cracks and is three to four times faster. However, performance on wide cracks is less accurate than that of CrackNet.
Determining the location of structural defects such as cracks from images using region-based methods has also achieved remarkable results.42–45 However, they all require an external method (i.e. a selective search) to generate region proposals. To address this issue, a faster region-based convolutional neural network (faster R-CNN) was proposed to identify different types of damage: concrete cracks, steel corrosion (medium and high), bolt corrosion, steel delamination and other surface damages.46–48 Moreover, Single Shot MultiBox Detector (SSD) is a CNN object detector to predict different object classes with bounding boxes by offsetting the predefined anchor. 49 SSD was used to detect eight types of road damages from smartphone images. 50 Most of the training images used for concrete crack detection as a particular type of damage in the reported studies were relatively clean and showed little disturbance, although some studies have been conducted to deal with complex background issues. For example, some algorithms were proposed for the identification of cracks with complex background information (e.g. hand marked information) on a steel structure, which however cannot predict the location of the cracks.32,51 The extraction of cracks still required certain complex post-processing techniques. A more advanced ML algorithm is therefore required that can recognise cracks in concrete structures with complex backgrounds.
You Only Look Once (YOLO) is a single-stage object detection network that is capable of predicting the location of objects through bounding boxes with high detection accuracy at considerable speed.52,53 The YOLO detection network was performed to detection potholes and damage with relatively clean concrete surface with promising results, showing the potential for more complicated scenarios.54–56 With the introduction of anchor boxes in You Only Look Once version 2 (YOLO v2), it provided much better and stronger detection performance compared to its predecessor (i.e. You Only Look Once version 1 (YOLO v1)). To the best of the authors’ knowledge, no research has been conducted on detecting concrete cracks using YOLO v2 network from real-world images with complex backgrounds (e.g. handwriting scripts), which are commonly seen in reality. Inspired by the region-based CNN, this study proposed a modified YOLO v2 network for crack identification using real-world images, where concrete cracks and handwritten texts co-exist. No predefined filter was required, different from the traditional image-based methods. The main challenge to implement the YOLO v2 was to differentiate the concrete cracks from the crack-like features (e.g. handwriting scripts) which have similar patterns. In this respect, the anchor box was predefined carefully, and the algorithm was fine-tuned.
The contributions of this study are as follows.
An ad hoc YOLO v2 algorithm was implemented for fast concrete crack detection in real-world situations.
Experiments were conducted on different scenarios of images including those with poor lighting (e.g. images with bright and dark regions).
YOLO v2 and faster R-CNN were compared in terms of accuracy and computational cost.
Influence of labelling handwriting for network training on the overall crack detection accuracy was highlighted.
This article is organised as follows. The proposed methodology is introduced in section ‘Methodology of YOLO for crack detection’, followed by the network database and implementation details in section ‘Image dataset setup and implementation’. The evaluation results and detailed discussion are addressed in section ‘Experimental results and discussion’. Finally, a conclusion is presented in section ‘Conclusion and future work’.
Methodology of YOLO for crack detection
Figure 1 shows the overall schematic mechanism of the YOLO v2 object detector, where a single-stage object detection network is used as opposed to two-stage detectors such as faster R-CNN. A base feature extraction network CNN, acting as object detector, is implemented to generate bounding boxes through decoding the predicted outcomes from the CNN network. Bounding boxes with the highest intersection over union (IoU) will be selected as the detection results, so as to reduce the number of redundant boxes for more precise results. The structure of the YOLO v2 detector was ad hoc modified in this study to better detect cracks on concrete structures from real-world images in which handwriting scripts co-existed as the background. The implementation details of the YOLO v2 network are explained in the following sections.
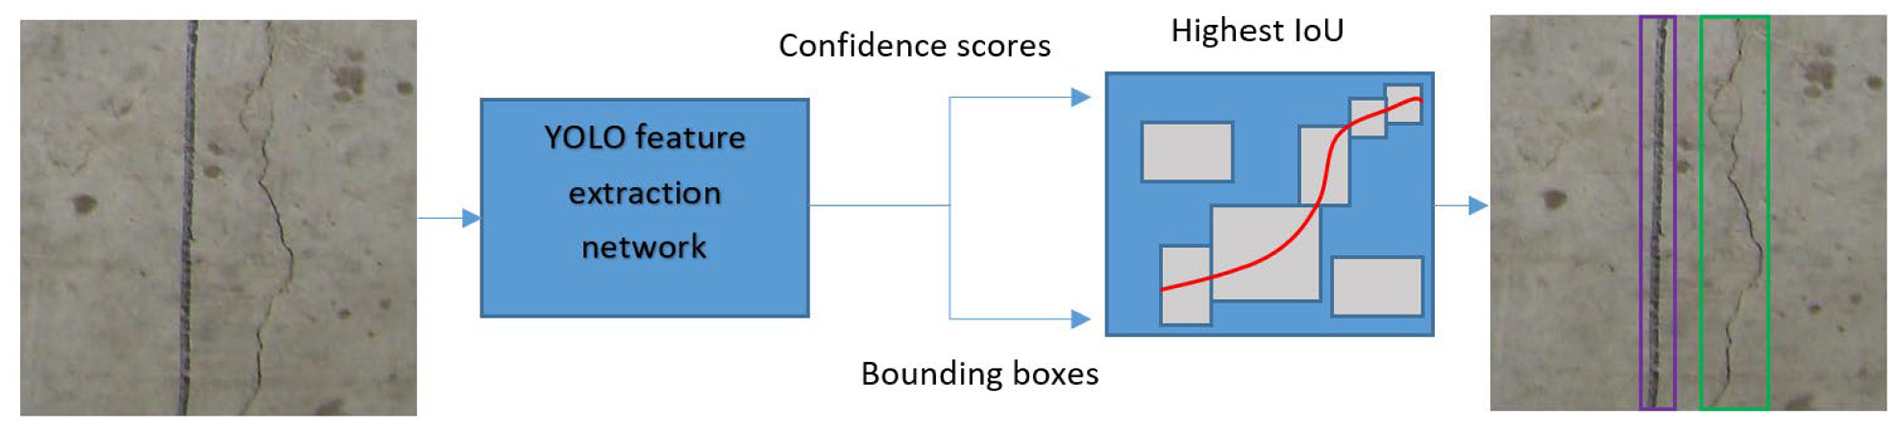
Concrete crack detection using YOLO v2 object detector.
The base extraction CNN (VGG16)
In this section, the fundamental architecture of the YOLO v2 detector network is presented, where the base extraction CNN was used to extract object features and pass them to the final YOLO layers. The detailed structure of the YOLO v2 is included in Table 1, consisting of convolution, rectified linear unit (ReLU), max pooling, batch normalisation and YOLO prediction layers. Many well-established networks for CNNs were available, such as ResNet-152, Alexnet, GoogleNet and Zeiler-Fergus network (ZF-net).57,58 However, the original VGG16 series network 57 was used due to its excellent performance in improving AlexNet in ImageNet Large-Scale Visual Recognition Challenge 2014 (ILSVRC-2014). VGG16 was then modified in this study to generate the YOLO v2 network for the detection of a crack in images with a complex background (i.e. handwriting scripts). The architecture of the modified VGG16 network consisted of 39 layers: 13 convolutional, 15 ReLU, 5 max pooling, 2 dropouts, 3 fully connected and 1 softmax. To establish a damage detector that could distinguish concrete cracks from complex background, the layers of the VGG16 were replaced by YOLO detection layers after the feature extraction layer ReLU 5-3 in Table 1. A good feature extraction layer for YOLO v2 should have an output size between 8 and 16 times smaller than the input image to facilitate a good trade-off between spatial resolution and quality of output features. In this study, the output size after ReLU 5-3 is [28 28] and the original image size is [448 448]. Therefore, the downsampling factor is 16, which is desirable for YOLO v2 detection. The number of filters in the last convolution layer is calculated as numAnchors × (numClasses + numPredictionsPerAnchor) = 182.
Overall architecture of the proposed YOLO v2 (based on VGG16).
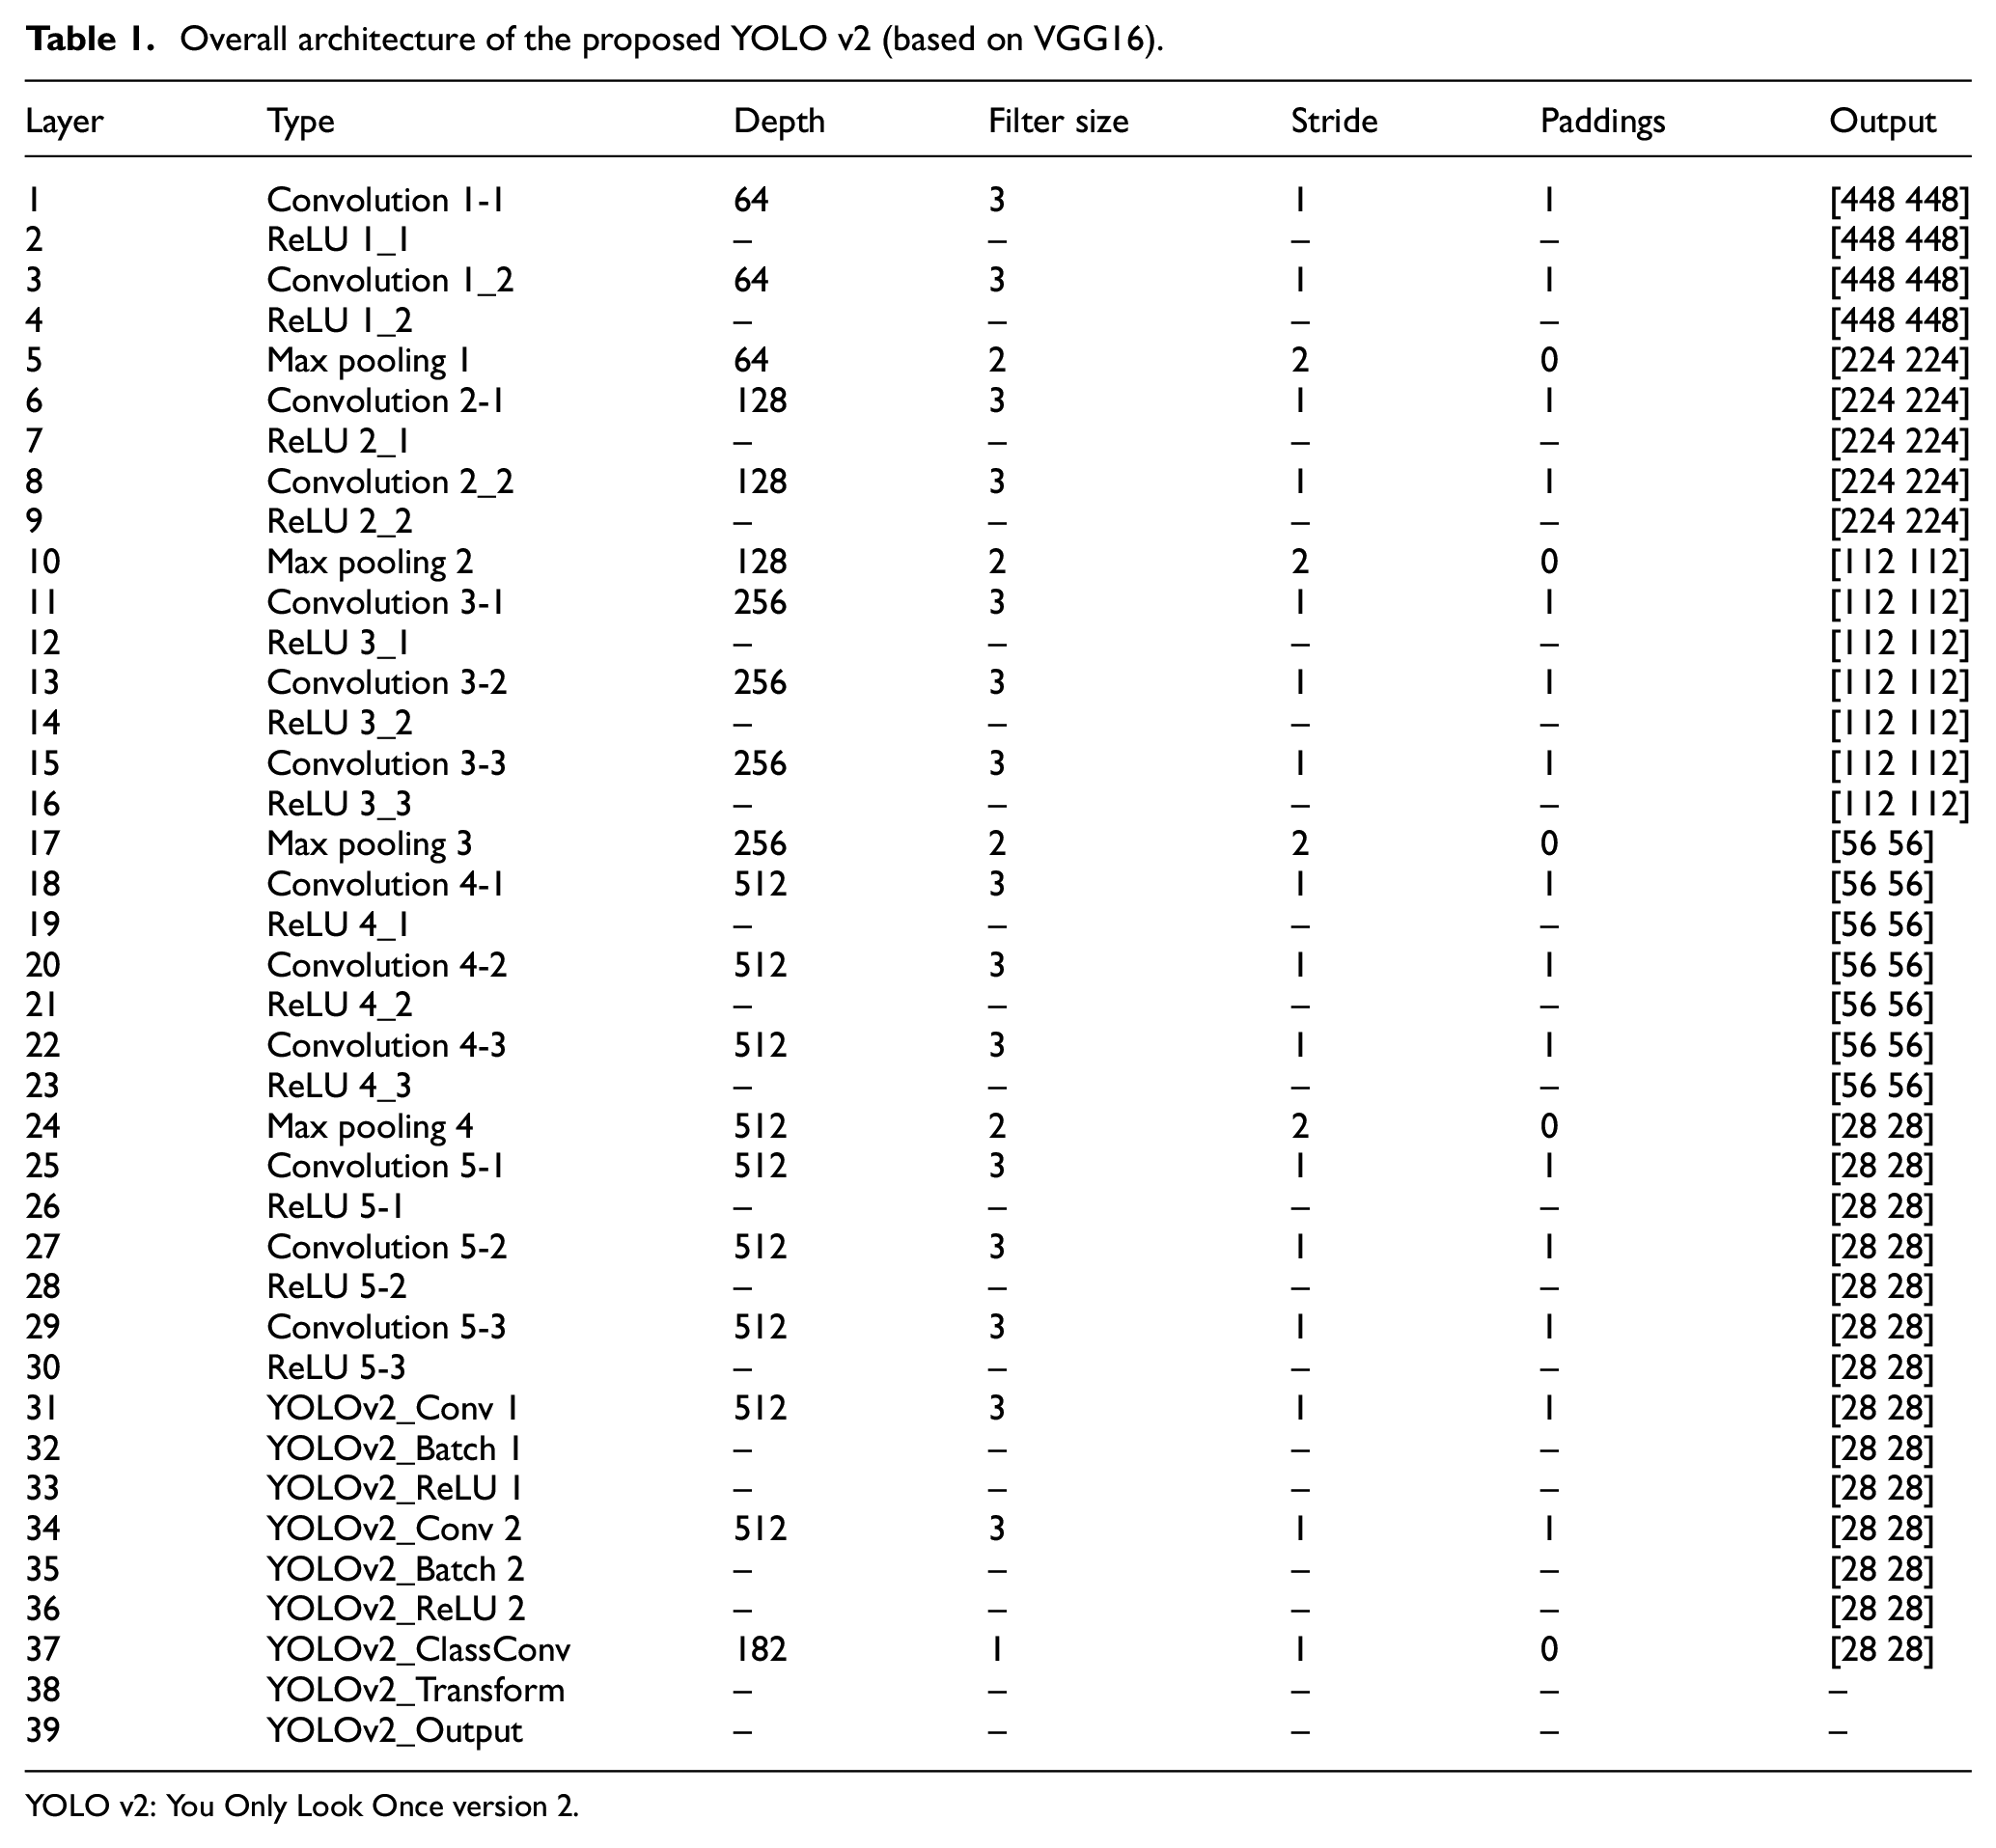
YOLO v2: You Only Look Once version 2.
Figure 2 illustrates the schematic structure of the YOLO v2 detector for defect detection. The most important aspect of this network is that feature maps are computed through the base CNN and predicted by the YOLO layers. The detailed operations of the layers used in CNN can be found in the study by Ziou and Tabbone. 20 The YOLO transform layers are utilised to transform the raw CNN output into a form required for object detection and also to improve the stability of the network by constraining the location predictions of the bounding box to fall within the boundary of the ground truth.
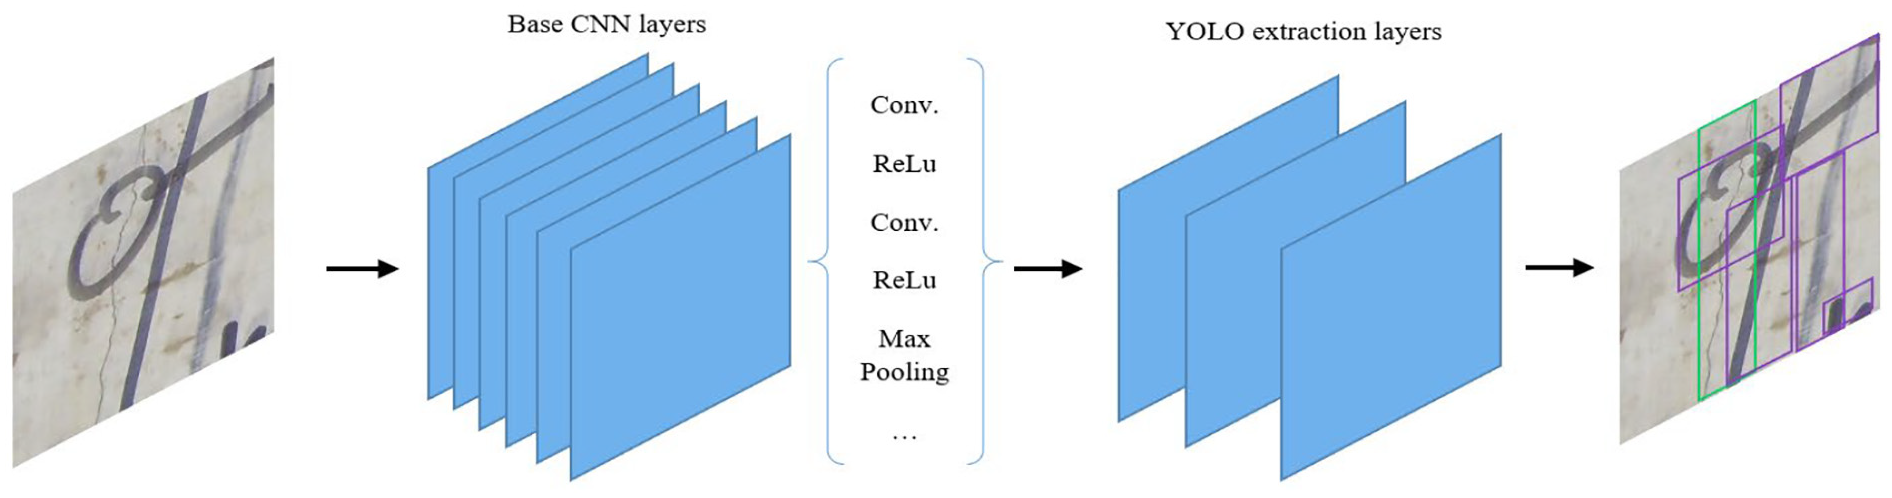
Schematic architecture of the YOLO v2 object detector network.
YOLO v2 anchor box
The input images were divided into a number of grid cells (28 × 28) by the YOLO v2 detector, and a number of object regions were proposed at each grid cell location with a defined number of reference boxes called anchors consisting of different scales and aspect ratios, as shown in Figure 3. The centre of the anchor boxes (the blue dots in Figure 3) fell within the grid cell. Therefore, each grid cell location in the images had k anchors associated with it. The combination of these anchors in each position was determined by the predefined geometries of the bounding boxes. Each bounding box included five parameters, that is [x, y, w, h] which specify the top left corner coordinate (x, y) and the width and height of the boxes, as well as a box confidence score of containing an object. Three attributes were predicted by the YOLO v2 network, namely IoU, anchor box offsets and class probability. An IoU concept was adopted to calculate the object score of each anchor box, whereas the bounding box offsets refined the location of the box. Each anchor box was assigned a corresponding class label. Due to the fact that the YOLO v2 network could make multiple detections for the same object at each grid cell, non-maximal suppression was applied to remove all bounding boxes predicted with low confidence scores and therefore to retain just one box with the highest IoU.
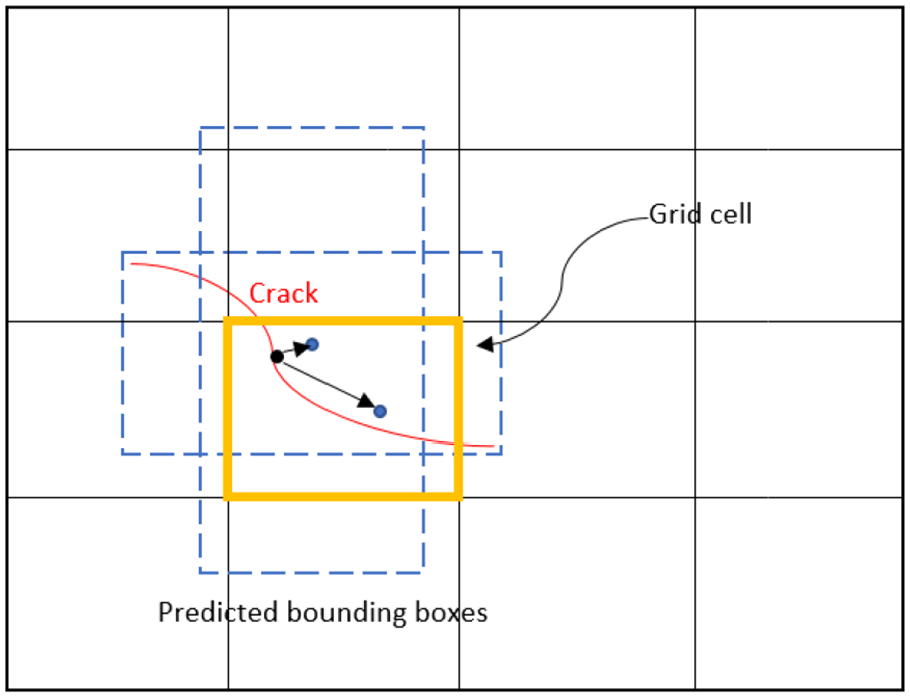
Example of grid cell divisions.
YOLO v2 loss function
The YOLO v2 network was trained end-to-end using stochastic gradient descent with momentum (SGDM). As mentioned in the previous section, YOLO v2 predicts multiple bounding boxes per grid cell. However, only one box was required, which was determined by the highest IoU with the ground truth. The probability of objects in an image patch was updated during the training process to minimise the difference through offsetting. YOLO v2 introduced sum-squared errors between the predictions and the ground truth to calculate the loss for bounding box refinement. The geometrical coordinate and the confidence score of a bounding box were then predicted, and the network could be trained to map the predicted box to a ground truth box through the total loss function as
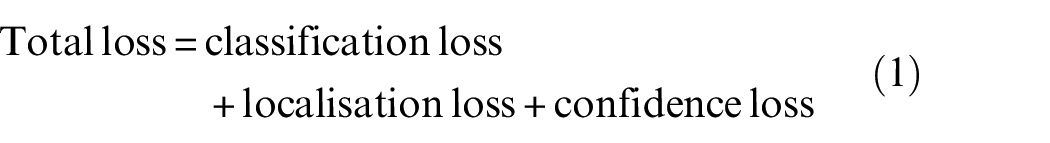
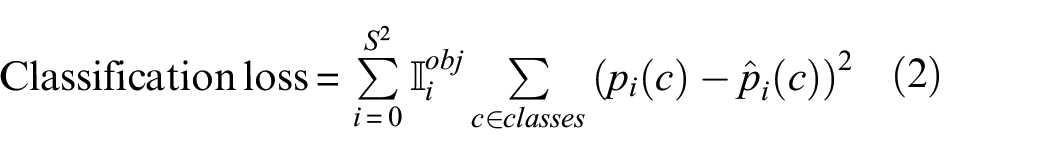
where
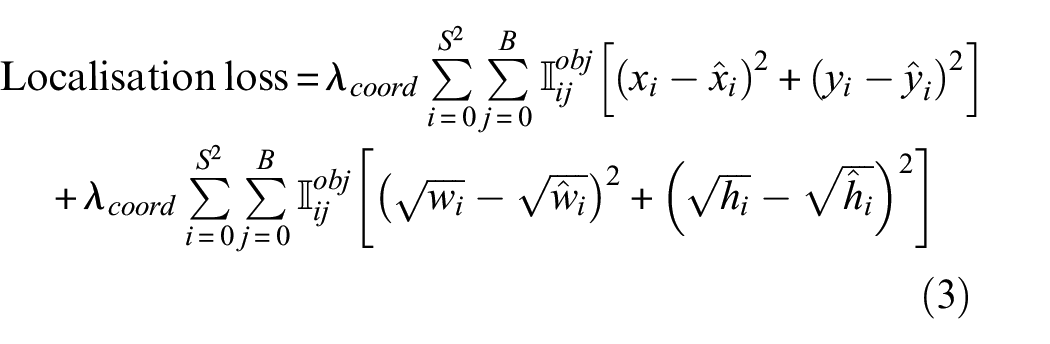
where
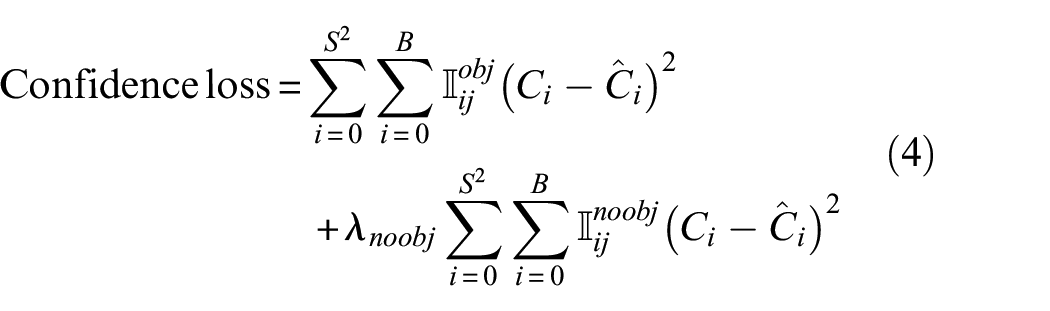
where
Image dataset setup and implementation
Training and testing datasets
The YOLO v2 was trained in one step and its detection performance was evaluated by the generated test dataset. A single network was created for detection using the pre-trained network VGG16 as the base feature extraction network.
To generate a dataset of training and testing images, real-world images 3264 × 2448 pixels in size, taken by different digital single-lens reflex cameras at different angles and distances with complex background information from a variety of concrete bridges, were used and cropped to 448 × 448 pixels to increase the number of training and testing samples, while maintaining suitable resolution for concrete crack detection. These original full-scale images with handwriting scripts marked on the concrete surface for the cracks were all taken by inspectors during annual visual inspections. In total, 3010 images were generated for the database to detect objects as cracks and handwriting for both training and testing processes. Then 80% of the image data were randomly selected and used for the YOLO v2 training, while the remaining 20% of the images were used for the testing dataset.
The Image Labeler app in MATLAB was implemented to create the labelled ground truth data for all the previously prepared dataset. Examples of annotated images are shown in Figure 4. Each bounding box is in the format [x y w h] as described previously. Horizontal flipping of sub-images as data augmentation technique was used in this study to not only increase the number of data for training, but also help reduce a possibility of overfitting by increasing the diversity of the data, thereby creating a more robust classifier by preventing the network from memorising exact details of what was being trained.58,59 Furthermore, horizontal flipping was also beneficial in situations where the available dataset is unbalanced. In addition, YOLO v2 featured batch normalisation on all of the convolutional layers, which helps regularise the model and avoids overfitting problem. 53
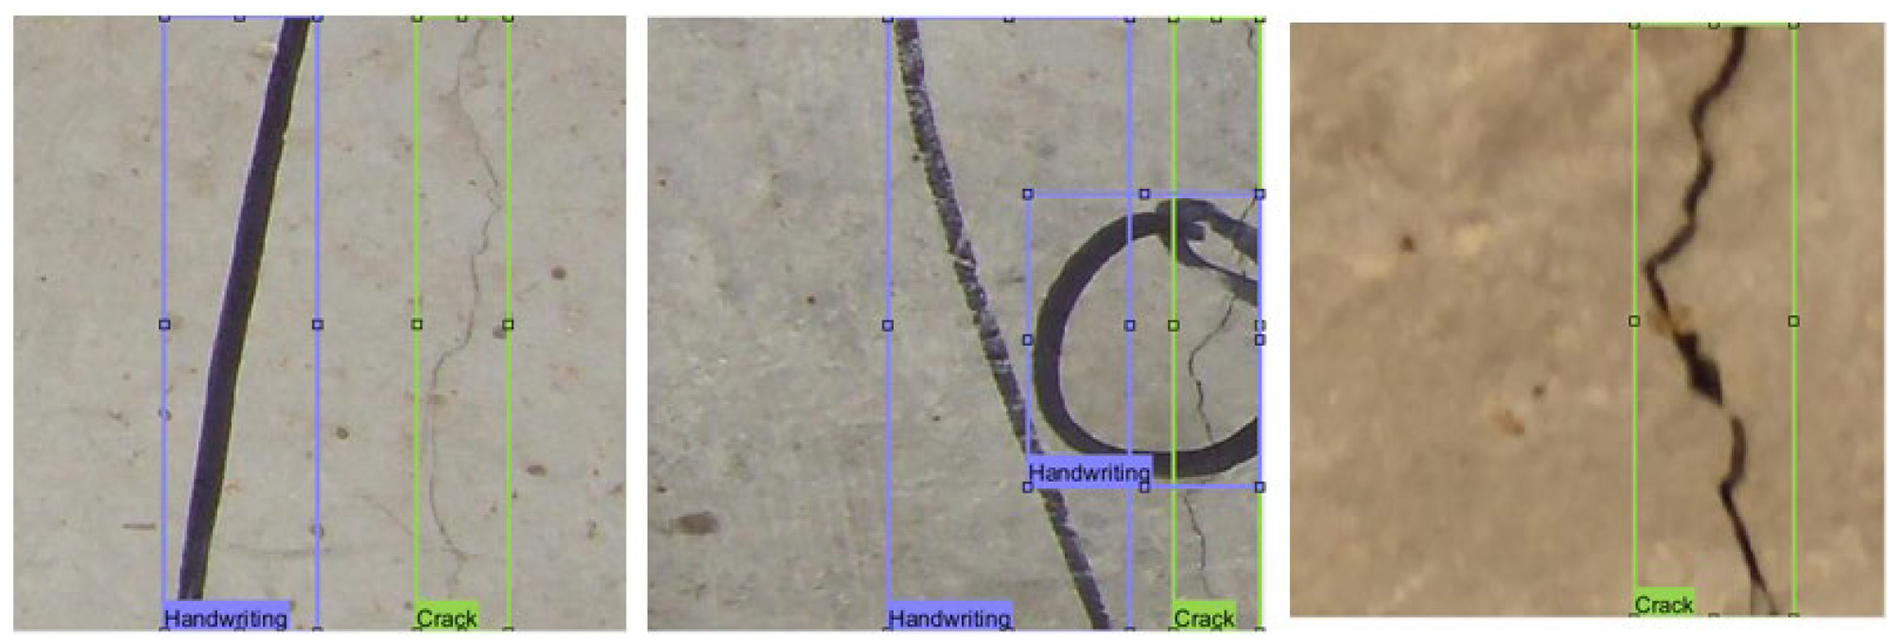
Examples of ground truth images with boxes and labels.
The proportions of crack and handwriting in the dataset were kept similar to make sure that there was no bias towards any of the detection classes. Accordingly, the image dataset included three main image types: containing both crack and handwriting, only crack and only handwriting. Examples of the training samples are shown in Figure 5.
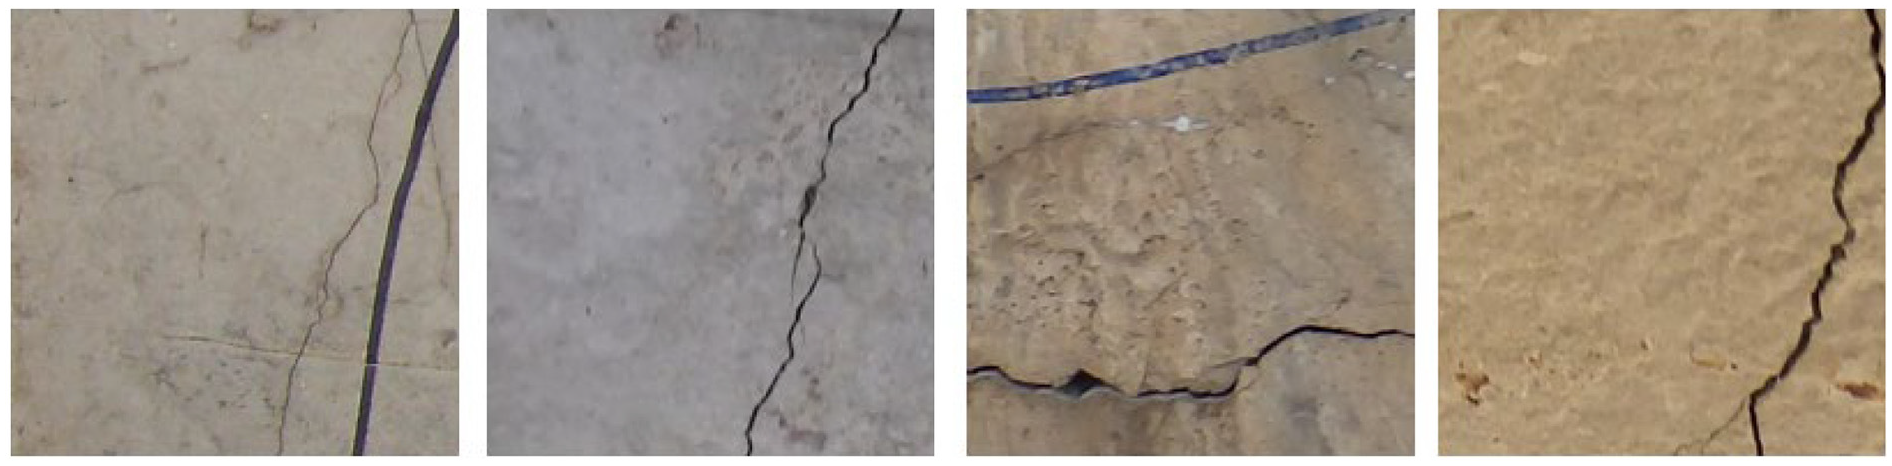
Examples of training samples.
Implementation
All experiments were conducted in MATLAB 2019a, CUDA 9.2 on a computer with an Intel® Core™ i7-6700 @ 3.40 GHz CPU, 64 GB installed memory (RAM) and a 4 GB GDDR5 memory NVIDIA Quadro P1000 graphics processing unit. This study used the Image Processing Toolbox™, Neural Network Toolbox™ and Computer Vision System Toolbox™ in MATLAB.
The YOLO v2 network was trained end-to-end with SGDM loss function by training one image per iteration. The hyperparameters selected in this study are summarised in Table 2. A momentum of 0.9 was chosen, which was used to update the parameters between iterations. A full pass through the entire training dataset was denoted as an epoch. In this study, the MaxEpochs of 200 was chosen due to the trade-off between detection accuracy and computational cost. The number of iterations in each epoch was always equal to the number of training images since the YOLO v2 network used the ‘image-centric’ training scheme. In this study, a mini-batch size of 10 was used for the network training, which controlled multiple RoIs that were sampled from each training image per iteration to evaluate the gradient of the loss function and to update the weights. Moreover, the training options were set to ensure that the network had a weight decay of 0.0005 and a learning rate of 0.001.
Table of confusion for prediction in a bounding box.
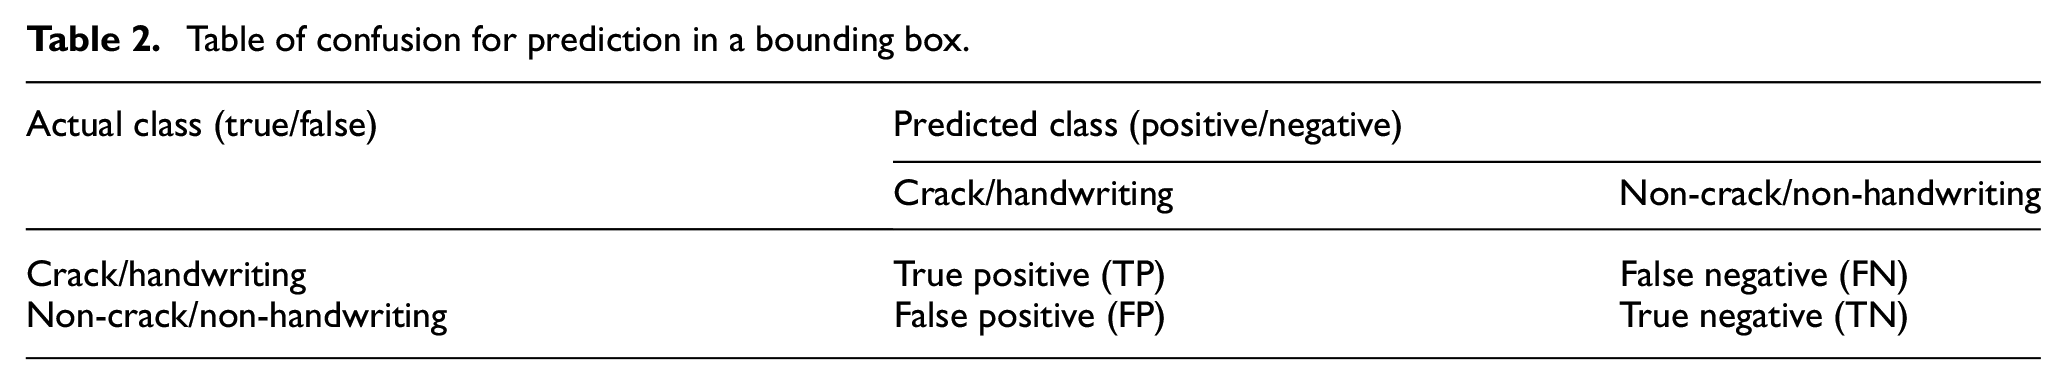
The performance of the YOLO v2 was evaluated by adopting precision and recall concepts, based on a measure of relevance. As shown in Table 2 and equation (5), precision, also known as positive predictive value, was defined as the ratio of true positive (TP) instances to all positive detection results. Recall, also called sensitivity, was denoted by the ratio of TP to the sum of TP and false negative (FN). The concept of average precision (AP), defined as the area under the precision and recall curves (P-R curves), was calculated to assess the robustness of the proposed YOLO v2. The AP provided a single value demonstrating the capability of the detector to make correct classifications (Precision) and to find all corresponding objects (Recall). The mean average precision (mAP) was also computed, determined by the average value between APs for different classes

Miss rate and false positive per image (FPPI) concepts were also adopted to generate missing rate curves for evaluating the performance of the YOLO v2. Log-average miss rate metrics were computed for both classes, indicating the percentage of objects missed during detection. In theory, a lower average miss rate signified fewer objected being missed

As the cracks and handwriting contained in the dataset were mostly elongated and of irregular shape in this study, a predefined number of anchor boxes was assigned for the network evaluation at each grid cell location, where redundant boxes were removed by the use of non-maximal suppression computed to discard prediction results with low probability. This allowed the network to include the predicted boxes that overlapped with the ground truth more accurately. In this way, the predicted bounding box that overlapped most heavily with the ground truth box had the highest IoU value. Examples of the predicted test images are shown in Figure 6 including the IoUs with the ground truth boxes.
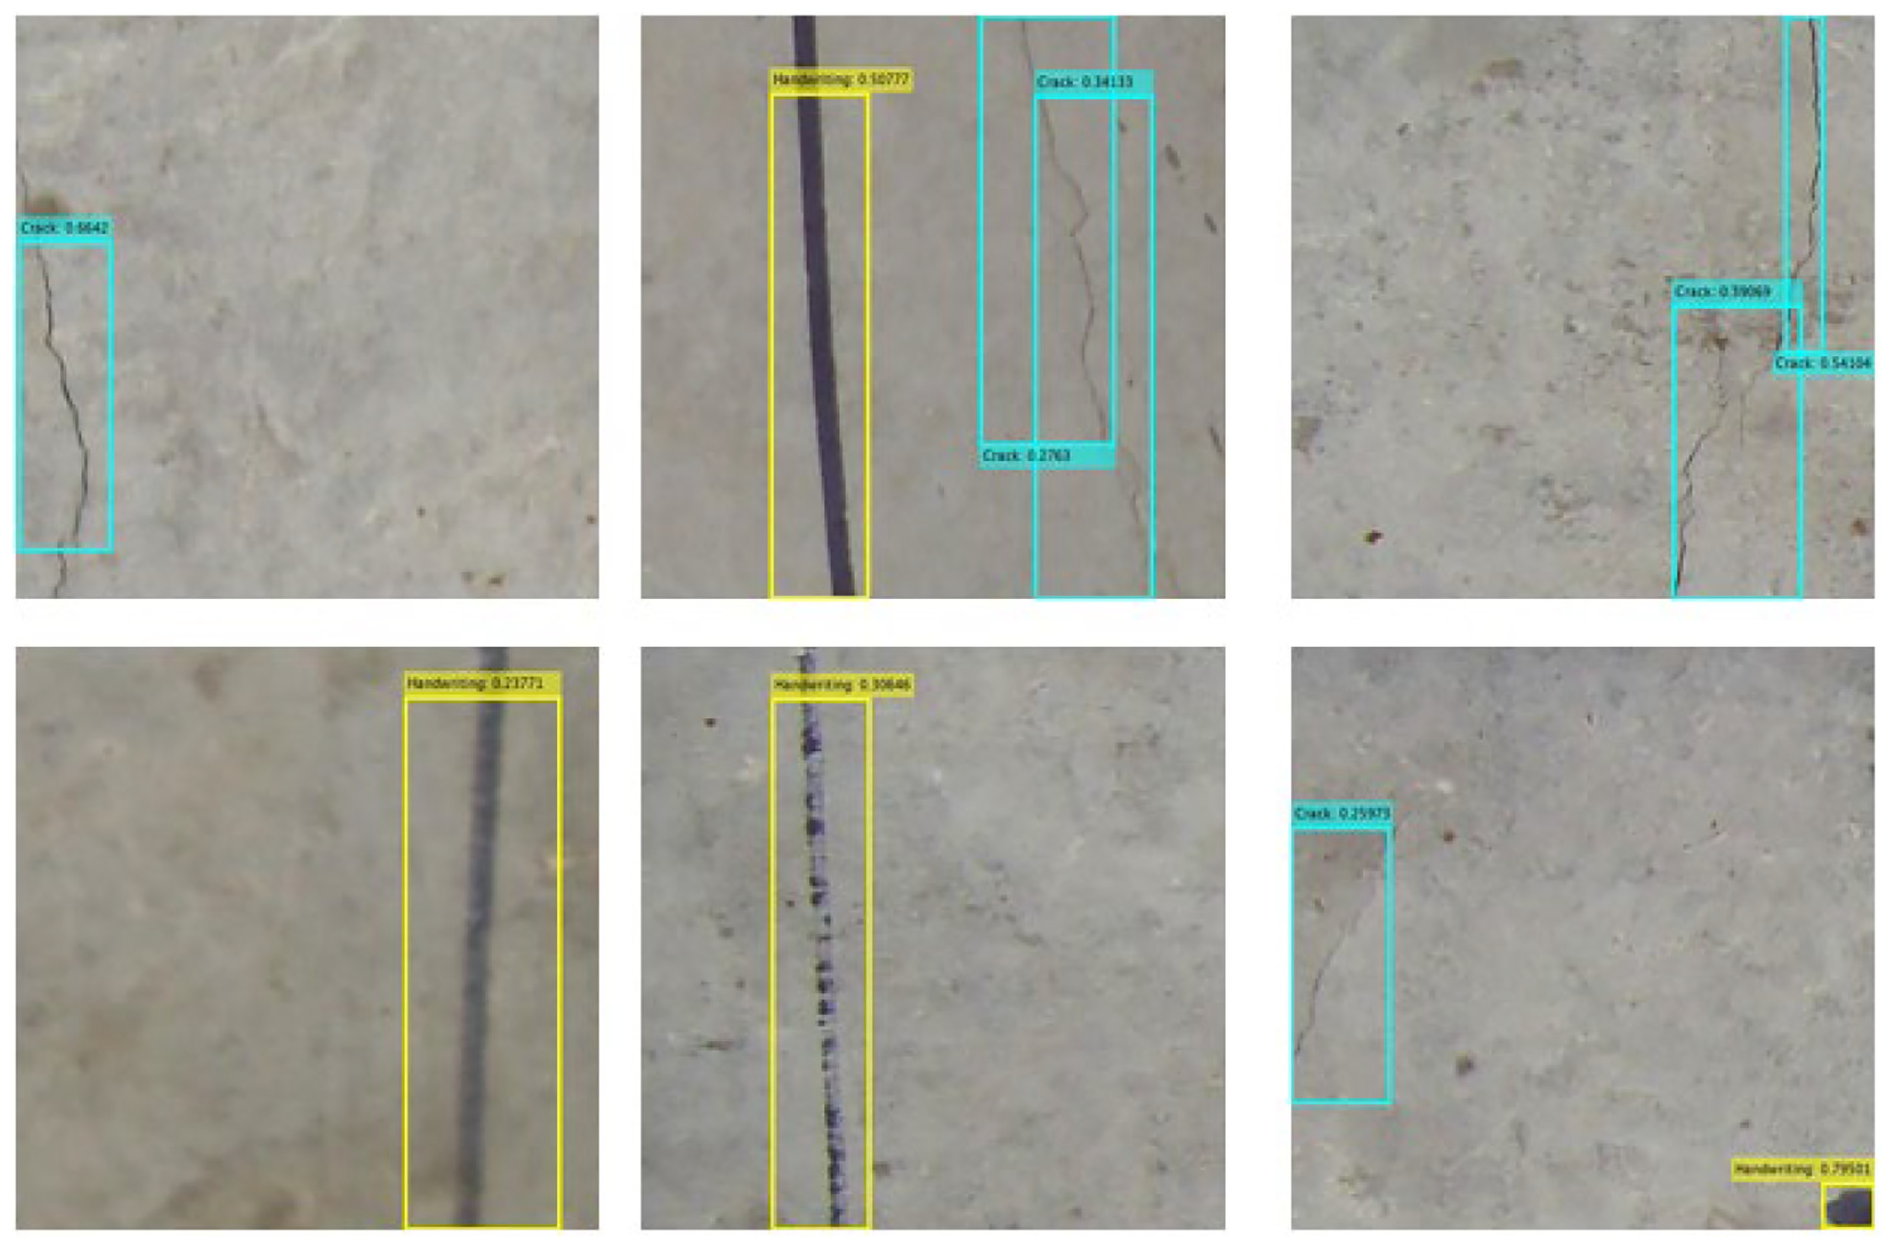
Examples of test results for images 448 × 448 pixels in size with confidence levels.
A parametric study was conducted to estimate anchor boxes using a clustering estimation method. The selection of appropriate anchor boxes provides important parameters for detecting elongated concrete cracks with a complex background. The size, aspect ratios and number of anchor boxes have significant impacts on the efficiency and accuracy of the detection network. For this reason, anchor boxes were estimated based on the training dataset using the K-Medoids clustering algorithm that attempts to minimise the distance between points in a group and a point (medoid) defined as the centre of that group. 53 The anchor boxes were then clustered with the custom IoU distance metric (equation (7)), which resulted in boxes of similar aspect ratio and size being clustered together

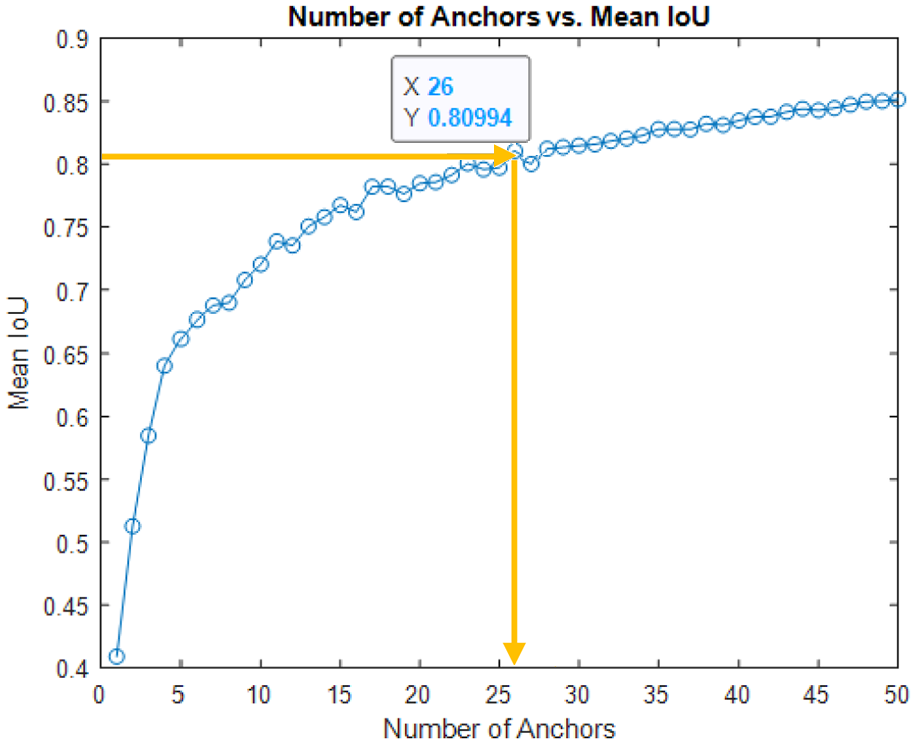
The number of anchors was chosen carefully. This is because the selection of this hyperparameter has a significant effect on the overall detection accuracy. As a result, the number of anchors was selected using empirical analysis, based on the mean IoU of the boxes in each cluster. The mean IoU was chosen to be greater than 0.8 to ensure that anchor boxes overlapped well with the boxes in the training data. In reality, increasing the number of anchors may increase the mean IoU measure, but this can result in an increase in computational cost and can lead to overfitting. Therefore, a trade-off between a larger number of anchors and a corresponding higher mean IoU is required. The K-Medoids clustering algorithm was applied to the training datasets with various numbers of anchors against the corresponding average IoU with the closest medoid, as shown in Figure 7. Using 26 anchors provided an average IoU above 0.8 and only minor improvement was observed after 40 anchors. As a result, the detector was trained and evaluated using 26 anchors. Given these results, the number of anchors and the mean IoU, where 26 anchors had the mean IoU of 0.80826, were adopted in this study to achieve a good balance between accuracy and computational cost.
Selection of number of anchors in the training samples.
The original labelled ground truth box distribution should be studied to better understand the range of object sizes presented in the training dataset, where a few groups of objects may have similar size and shape, but they are dispersed. Therefore, through the use of the distance metric as described previously by grouping similar ground truth boxes together, the data were classified and grouped in accordance to size and shape into groups using 26 clusters as shown in Figure 8. In this way, boxes which had similar aspect ratios and size were clustered using the IoU distance metric, where the sizes of the predefined anchor boxes estimated and chosen automatically fitted well with the data. Consequently, the automatically generated anchor boxes were used in the training of the proposed detector.
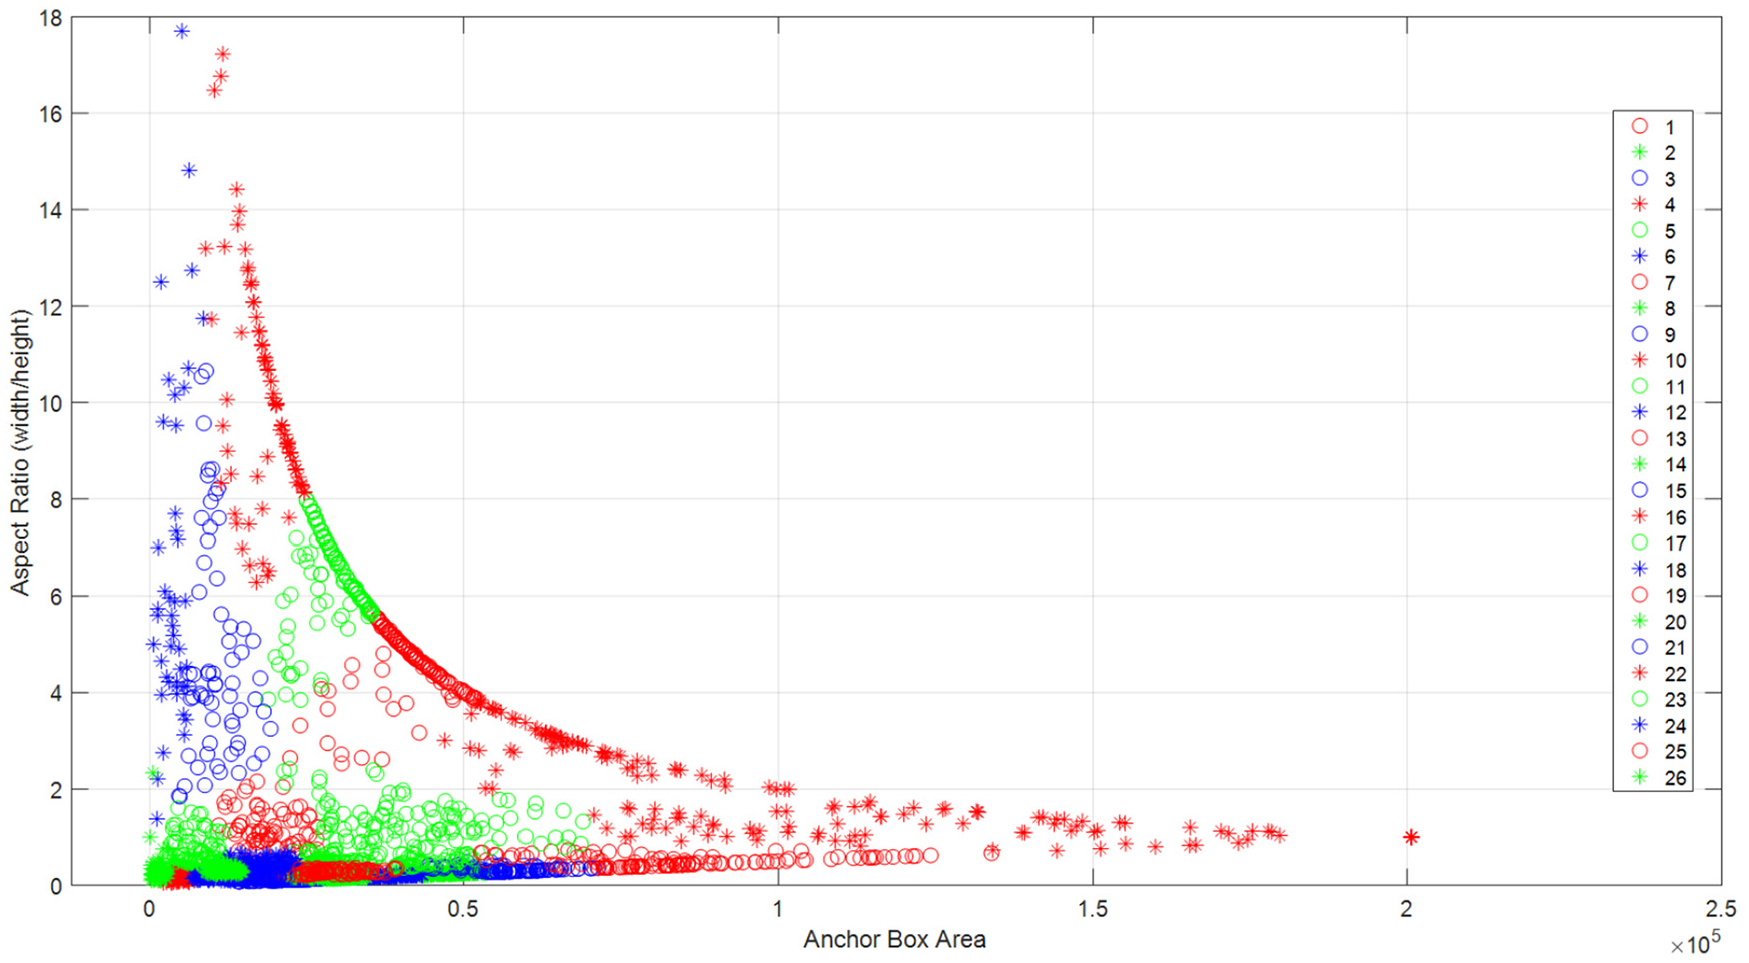
Visualisation of ground truth box distribution in the training data after K-medoids with 26 clusters.
Parametric study: dataset size
In order to determine the sufficiency of the dataset size for training, three different training datasets (A, B and C) were generated with 1204, 1806 and 2408 images, respectively. The same dataset with 602 images was used for testing the three trained networks. As can be seen from results in Table 3, dataset C demonstrates the best performance with the mAP of 77% compared with datasets A and B, a result which could be attributed to the larger and more diverse training set.
Size effect of the dataset.
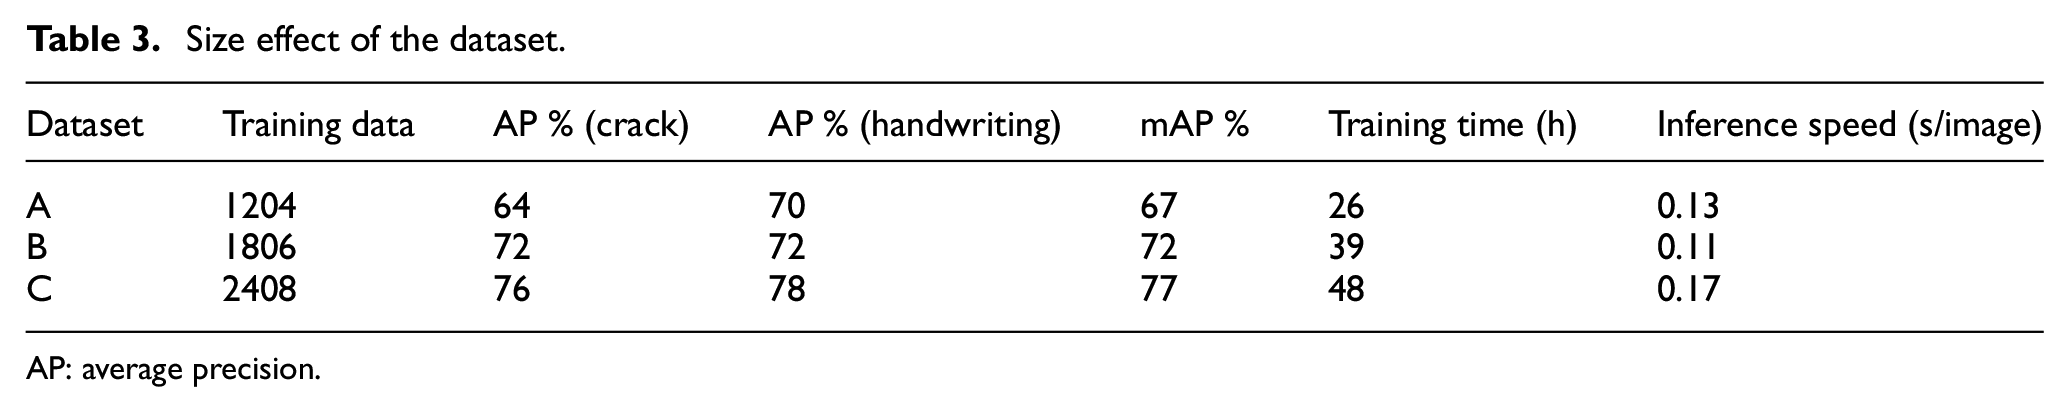
AP: average precision.
The P-R curves for these training datasets (A, B and C) were plotted in Figure 9 for crack (left) and handwriting (right). The corresponding APs which were calculated by integrating the area under the curves were 76% and 78% for crack and handwriting, respectively, based on dataset C, the highest among three dataset sizes. In addition, the log miss rate over FPPI curves for these training datasets was plotted in Figure 10 for crack (left) and handwriting (right). The corresponding log average miss rate was 34% and 30% for crack and handwriting, respectively, based on dataset C, which are the lowest among three dataset sizes. This also means that a certain number of objects were missed during the network testing, which could be due to tiny cracks on the blurred images.
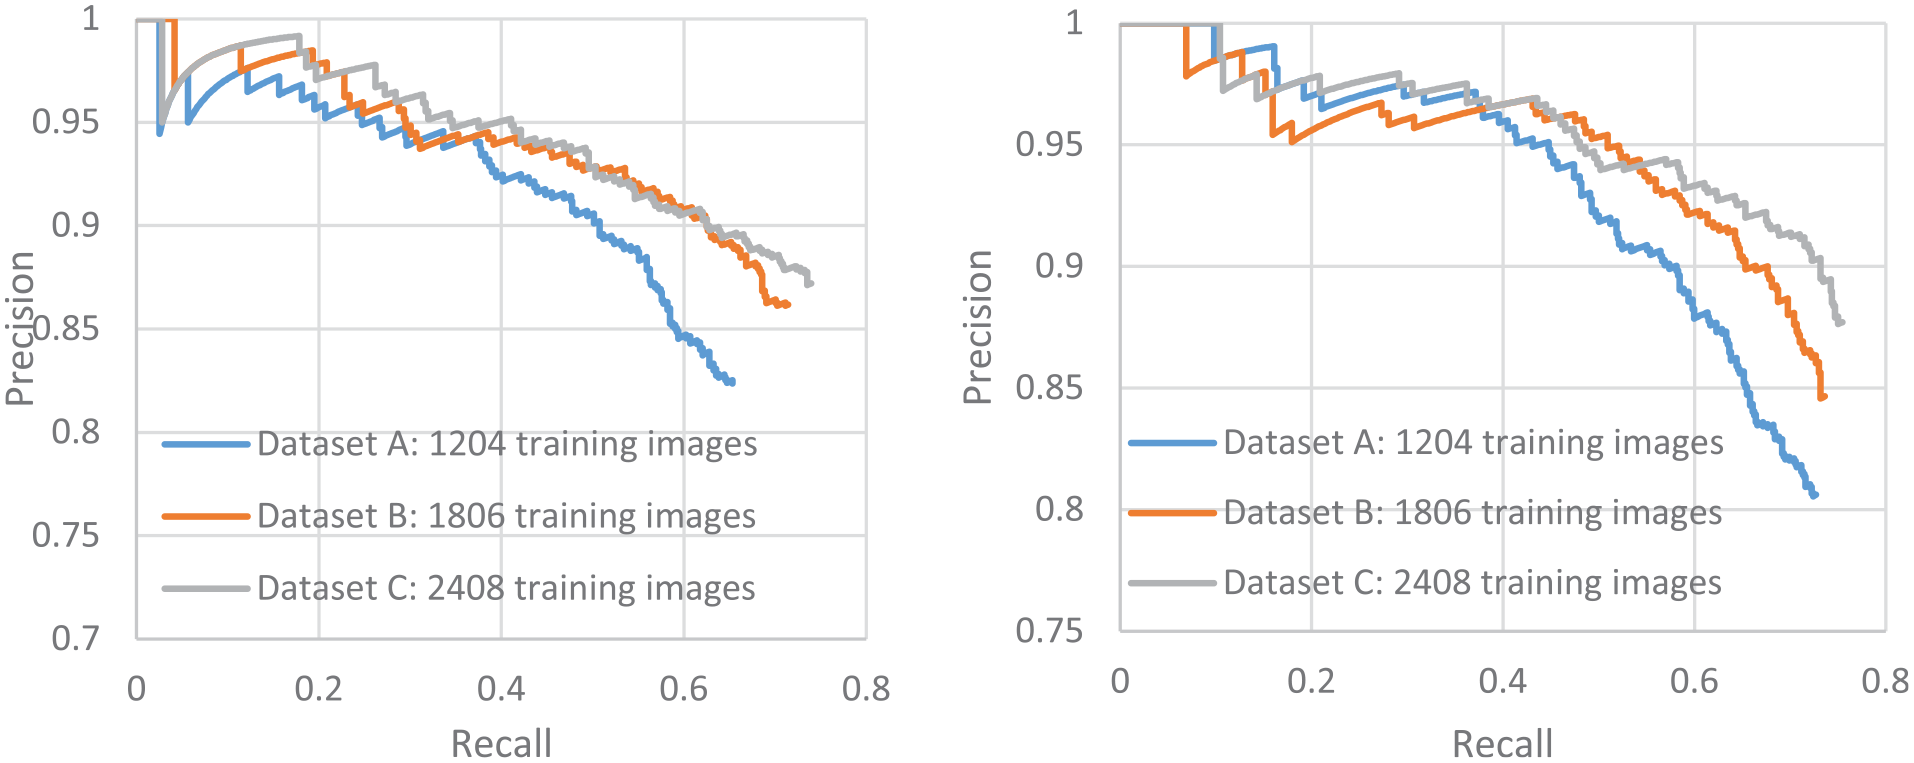
Precision and recall curves for crack (left) and handwriting (right).
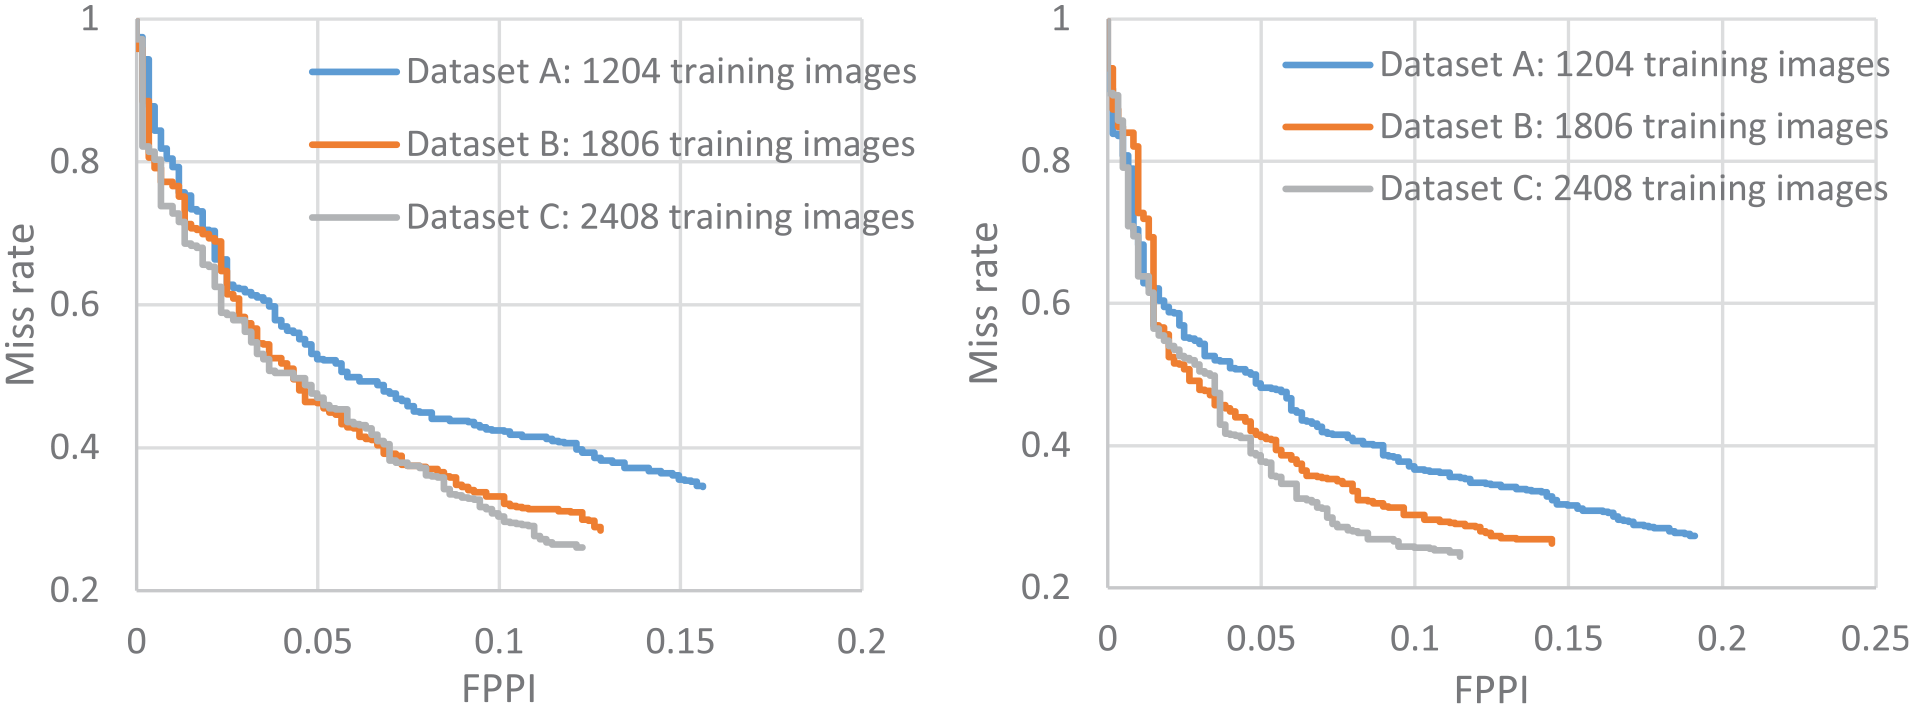
Miss rate curves for crack (left) and handwriting (right).
Experimental results and discussion
Full-scale image evaluation
Three new full-scale images (3264 × 2448 pixels) were utilised to evaluate the performance of the proposed YOLO v2 detector. The images were photographed by bridge engineers with handwriting scripts marked on them. Before images were assessed by the trained detector, each full-sized image was scanned with a window size of 448 × 448 pixels to provide the same level of detection accuracy. Each scanned image patch was then input into the trained network and output with corresponding bounding boxes for crack and handwriting with corresponding confidence scores as shown in Figure 11. It was evident that the proposed YOLO v2 could successfully localise concrete cracks despite the potential interference of pre-existing handwritten background. However, some undetected objects (FN instances) were shown in the images, which in general were acceptable because of the images with complex background (e.g. crack-like handwriting, stains). Moreover, the images were taken in various positions of bridges, and the various distances from the concrete surface where the photographs were taken could also have an impact on the detection results (e.g. lighting, shadow, object angle). The non-uniform sunlight also made it difficult for the detector to locate the real tiny cracks in the dirty concrete surface. However, these disturbing factors did not cause significant numbers of FP instances in this study and could be ameliorated by training the network with a larger and more diverse dataset.
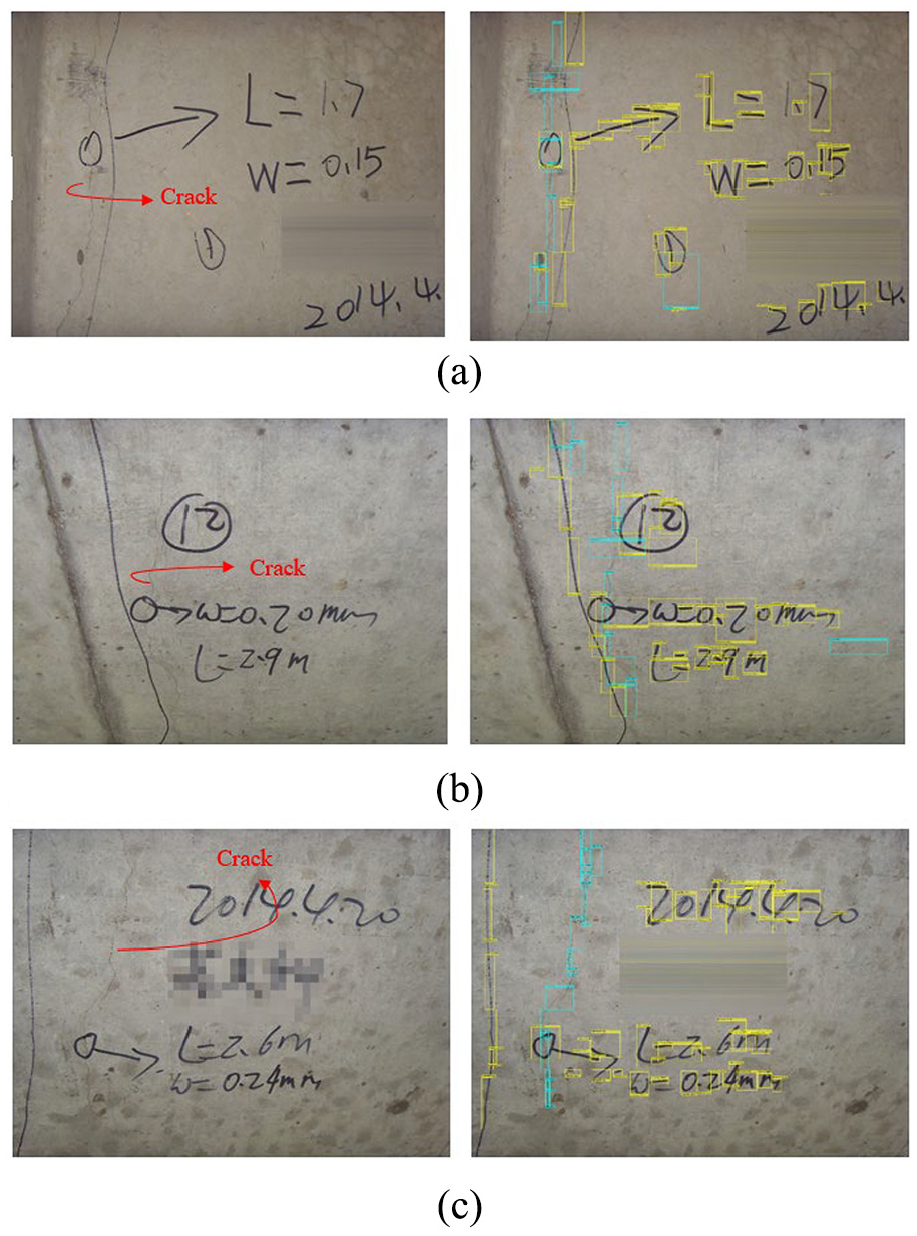
Detected crack damages and handwriting scripts; three new full-scale test images (left) and labelled images (right).
However, handwriting scripts presented in the images were in general correctly identified using the proposed YOLO v2. At some locations, the handwriting was not detected, which could be attributed to the aforesaid possible reasons. These false detections could also be mitigated by developing a larger dataset containing a greater variety of situations for more accurate detection.
Network performance on images with clustered background and poor lighting
In order to assess the robustness of the proposed network under dark environment, the trained YOLO v2 was evaluated with two images taken under poor lighting condition. As can be seen from Figure 12 (right), the distribution of the crack can be clearly captured by the trained YOLO v2. However, the results also showed that the evaluated images experienced more false detection. Therefore, the lighting condition and complexity of the background have a significant effect on the overall accuracy of the network for concrete crack detection. However, it is understood that the provision of lighting difference (e.g. lux) will be more informative for a quantitative study, as illuminance can be calculated, which measures the amount of light falling on a surface. However, since the images in this study were taken by different inspectors at different times, it is impossible to conduct such lighting measurements, where the specifications of the camera with which the image was taken must be available in advance, for example, shutter opening time, sensitivity of the charged coupled device (CCD), analog-to-digital units. Therefore, the lighting difference can only be perceived qualitatively in Figure 12. For example, the darker areas are those in the shaded regions. Quantitative information in terms of lighting difference will be a focus in the future study with well-controlled experimental settings.
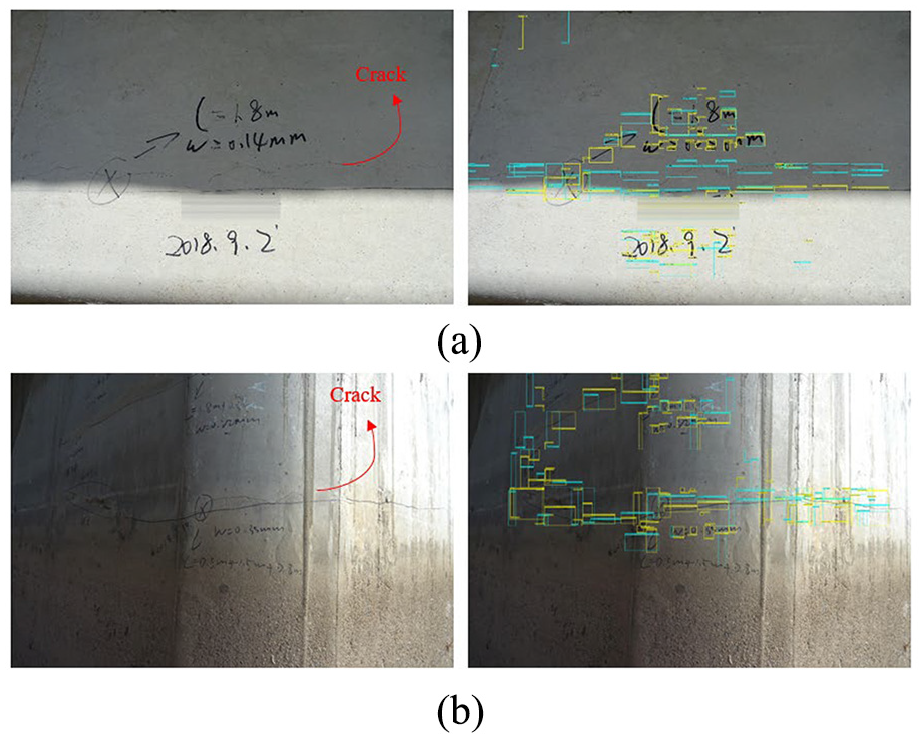
Detected crack damages and handwriting scripts under poor lighting condition; two full-scale test images (left) and labelled images (right).
Confidence levels of bounding boxes
For a better and more straightforward application of the proposed algorithm, a grading system (i.e. excellent, good, acceptable and bad) as shown in Table 4 was defined to group these prediction results based on the predicted confidence scores, where 80% confidence score was selected as a threshold due to the fact that the bounding boxes in general have high confidence scores to be correct. More details regarding the confidence level grading system can be found in Deng et al. 60 As can be seen from Table 5 for images shown in Figure 11, it can be concluded that the overall performance of the proposed network is satisfactory for all the three images and there is no bad prediction for the crack, as there are no incorrectly detected objects with high confidence scores.
Grading system used in Table 5.
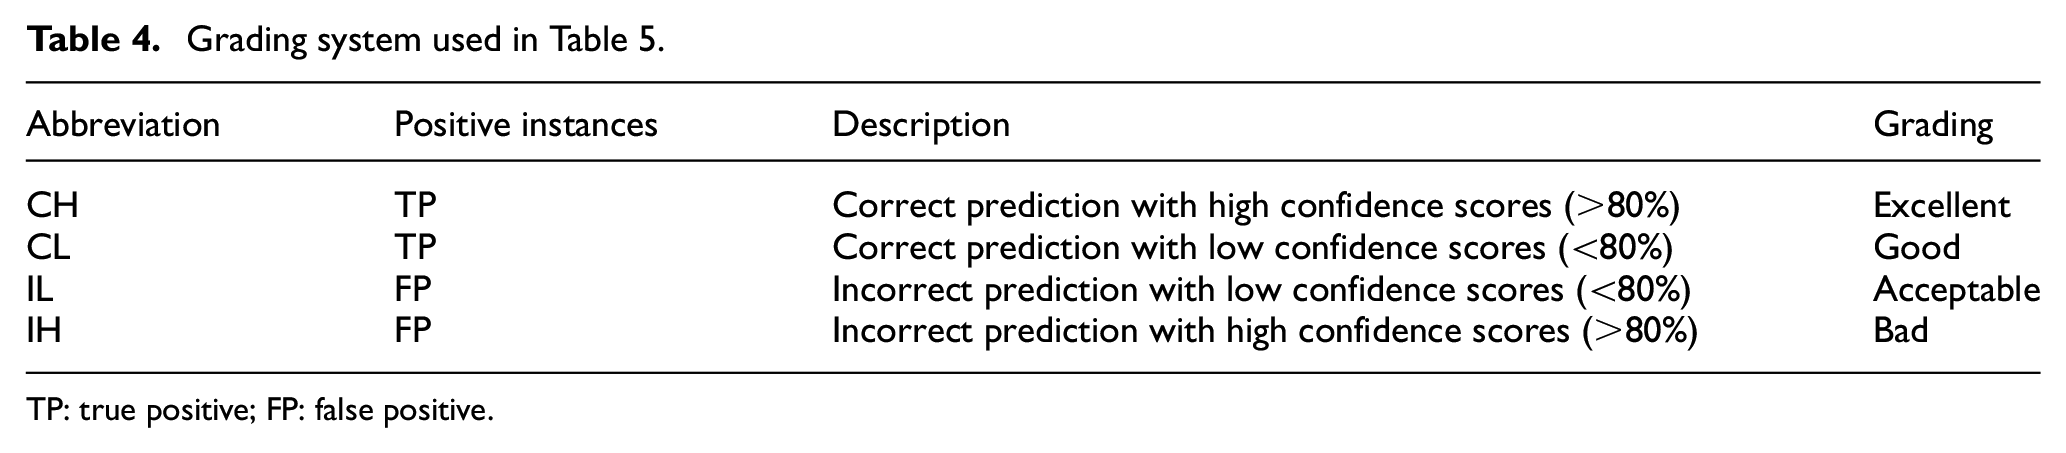
TP: true positive; FP: false positive.
Relative confidence scores for images shown in Figure 11.
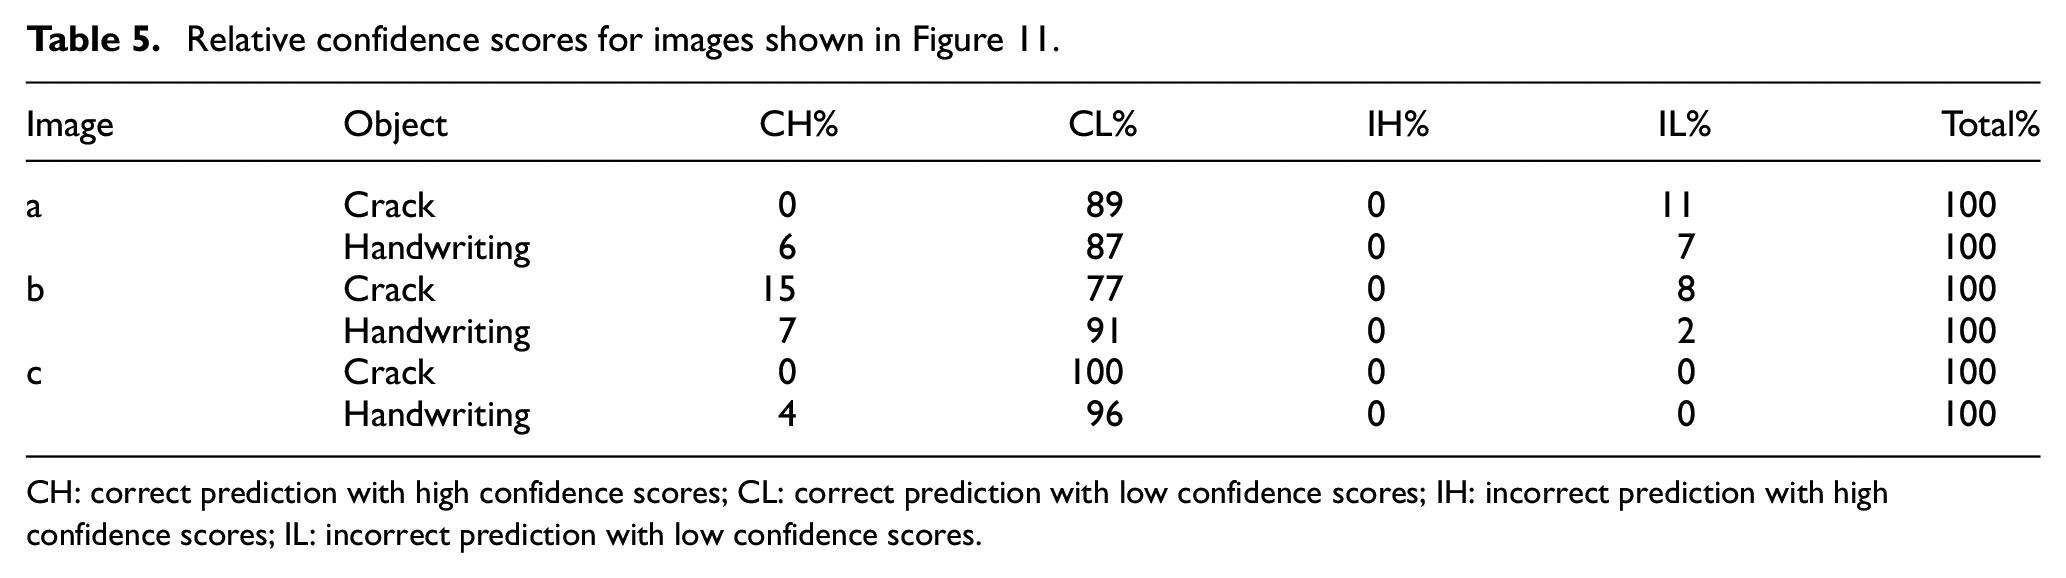
CH: correct prediction with high confidence scores; CL: correct prediction with low confidence scores; IH: incorrect prediction with high confidence scores; IL: incorrect prediction with low confidence scores.
It is worth mentioning that negative outcomes (i.e. TNs and FNs) are not shown in Table 4 as they cannot be directly quantified by counting the number of bounding boxes with corresponding confidence scores. In particular, an FN instance was normally the worst case for crack detection, because it meant that some crack regions were overlooked by the network, potentially leading to underestimation of bridge safety. As observed in Figure 11, certain tiny cracks were still undetected. Such an issue could be ameliorated by increasing the size of the training datasets so that the network was exposed to a wider range of scenarios and possibilities.
Comparison between faster R-CNN and YOLO v2
To evaluate the performance of the proposed YOLO v2, faster R-CNN was applied and trained on the same dataset C for comparison, where the pre-trained VGG16 was also used for more accurate comparison. The detected classes included crack and handwriting as well. As can be seen in Table 6, the mAPs are 74.5% and 77% for faster R-CNN and YOLO v2, respectively, which are comparable in terms of detection accuracy. However, the training time required by the faster R-CNN is more than fourfold that of YOLO v2. Therefore, YOLO v2 was superior, with fewer false detections at the remarkably faster training and inference speed. As can be seen from Figure 13 for two more new images, the faster R-CNN evinced more incorrect detection of crack compared to that of YOLO v2. The relative confidence levels for images shown in Figure 13 are summarised in Table 7. Although the faster R-CNN has a higher percentage of correct prediction with high confidence scores (CH) compared to that of YOLO v2, which actually comes at the cost of long training time, the percentage of incorrect detection with the high confidence score of the faster R-CNN in general is still higher than that of YOLO v2, further reaffirming that YOLO v2 is more reliable.
Comparison of YOLO v2 with faster R-CNN algorithm on crack detection.
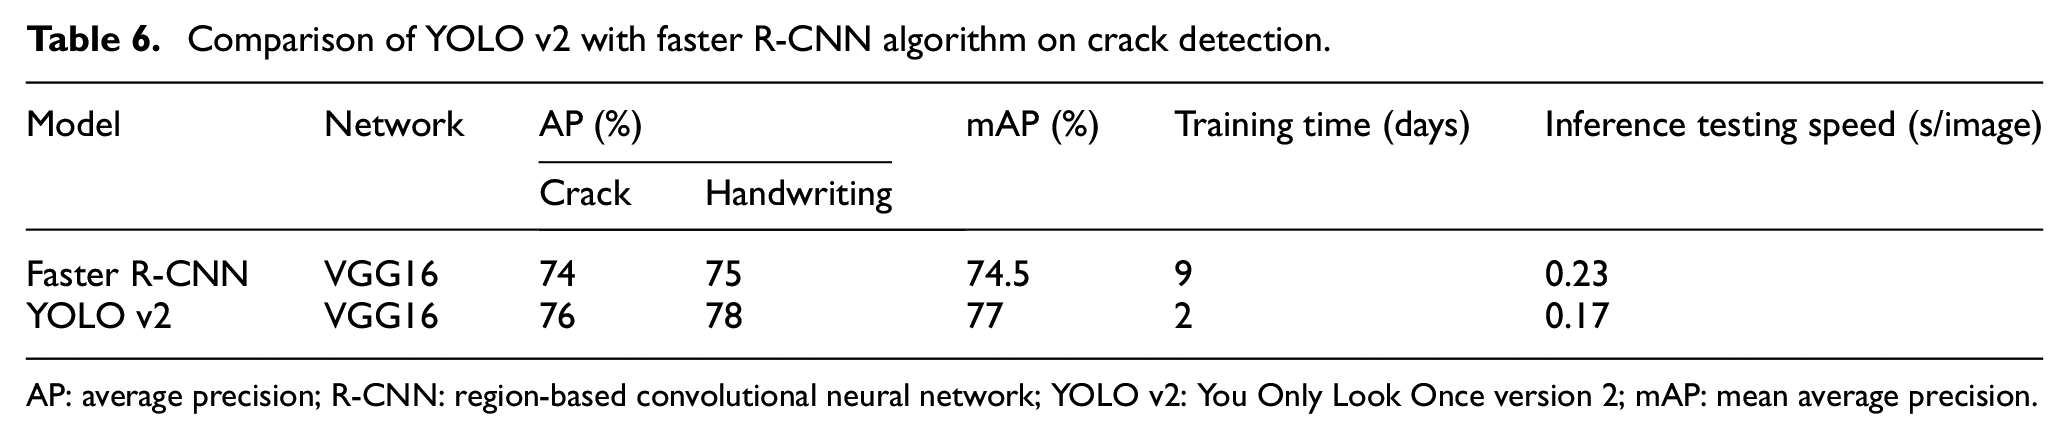
AP: average precision; R-CNN: region-based convolutional neural network; YOLO v2: You Only Look Once version 2; mAP: mean average precision.
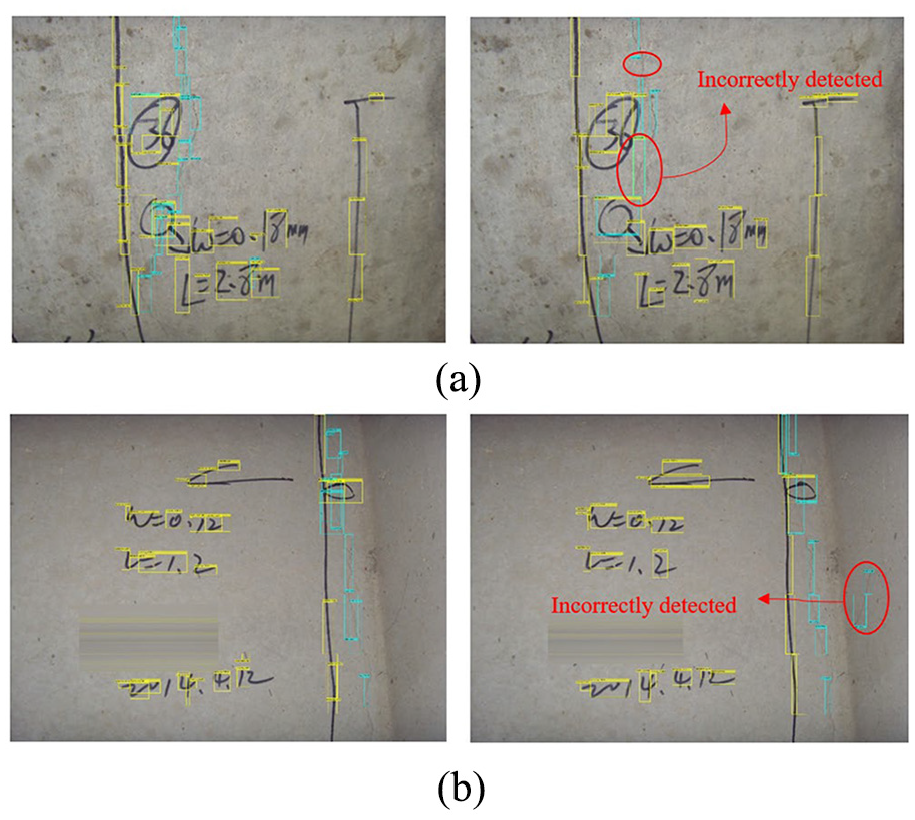
Detected crack damages and handwriting scripts; two new full-scale test images with YOLO v2 (left) and faster R-CNN (right).
Relative confidence level for images shown in Figure 13.
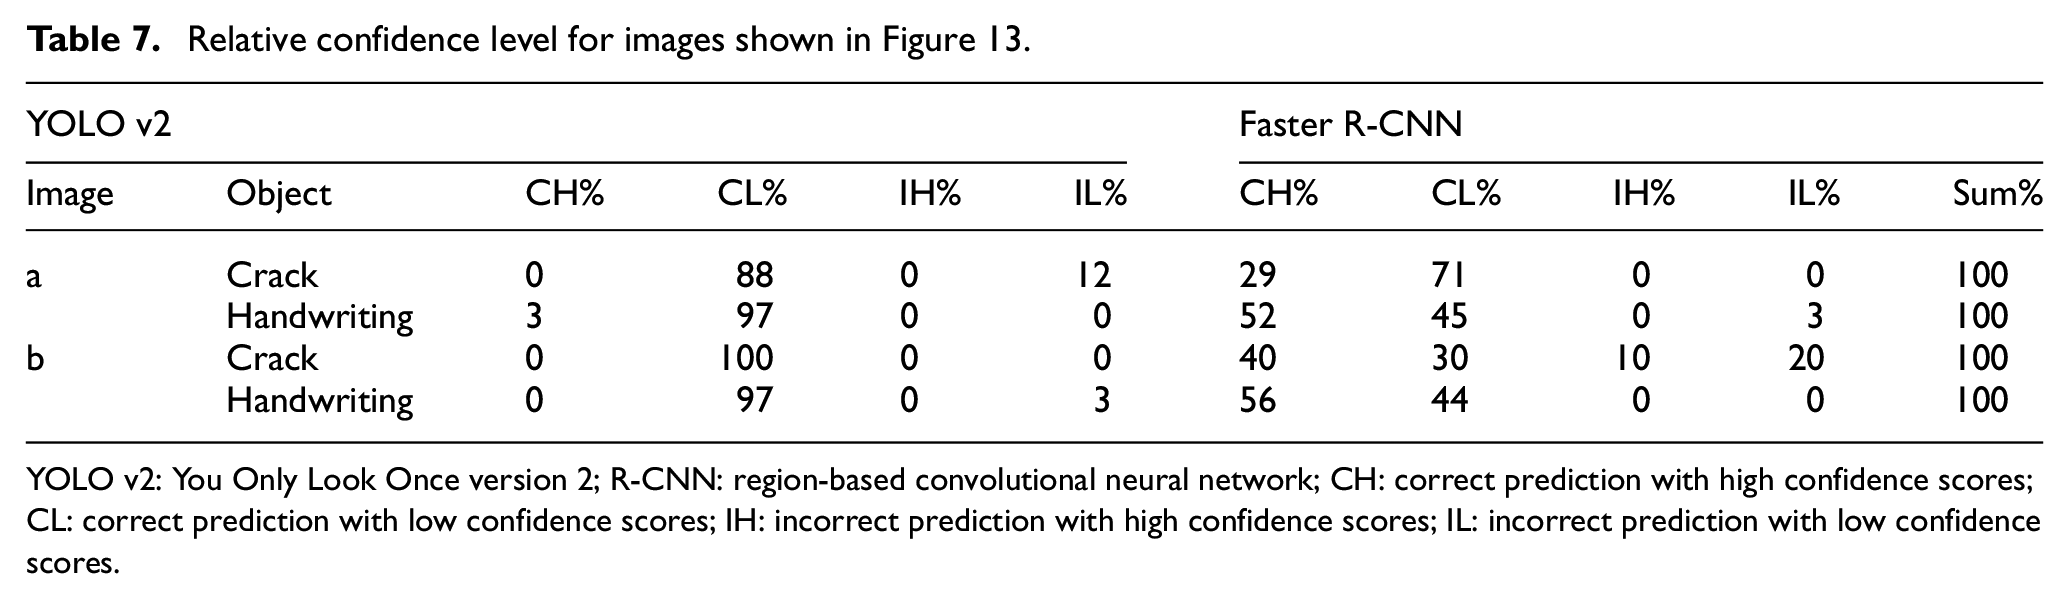
YOLO v2: You Only Look Once version 2; R-CNN: region-based convolutional neural network; CH: correct prediction with high confidence scores; CL: correct prediction with low confidence scores; IH: incorrect prediction with high confidence scores; IL: incorrect prediction with low confidence scores.
Effect of labelling handwriting for training
An experiment was further conducted to investigate the influence of labelling handwriting as an object class for network training on the overall crack detection accuracy. In detail, the YOLO v2 network was retrained with the same dataset C without considering handwriting as an object class. As can be seen from Table 8, the training time was threefolds with a significantly increased MaxEpochs value from 200 to 500 for considering crack only to reach similar crack detection accuracy; otherwise, the network cannot recognise any crack from images. It is thus obvious that considering handwriting as one kind of complex background and explicitly labelling it as an individual object class during the network training would avoid potential overlook of concrete crack and significantly improve the efficiency of correctly identifying the crack from complex background.
Comparison of YOLO v2 with/without handwriting as object class on crack detection.
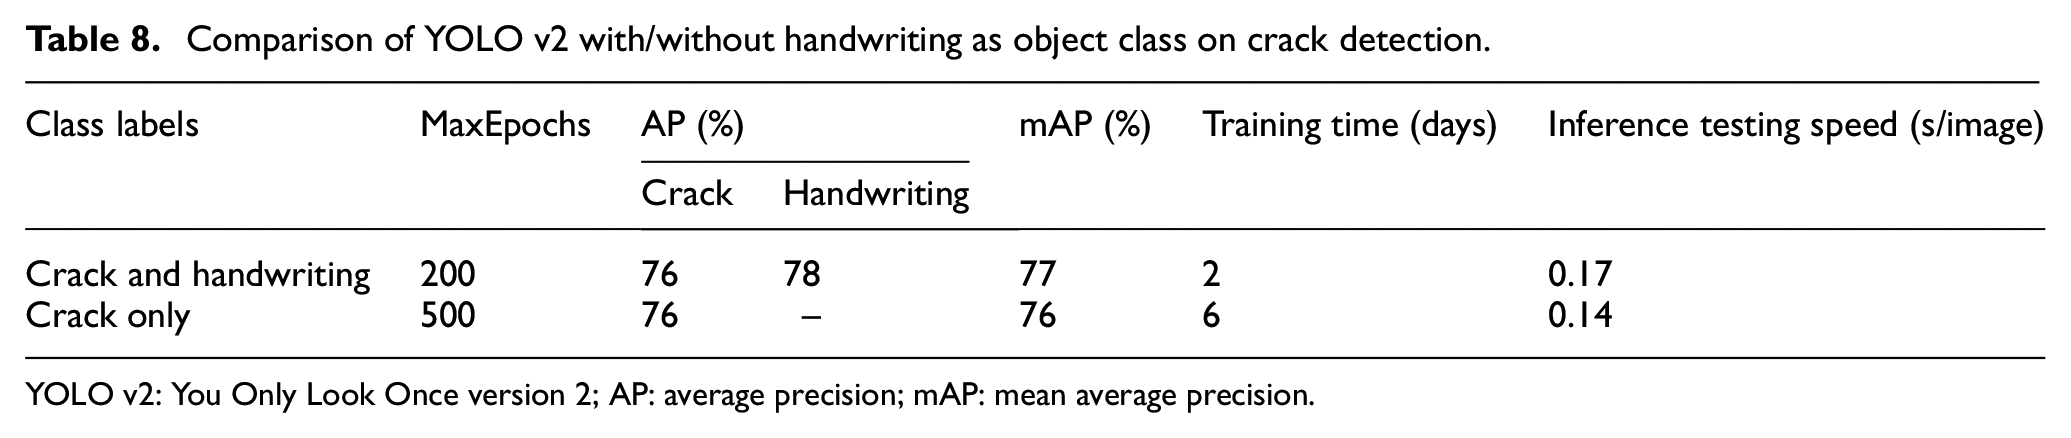
YOLO v2: You Only Look Once version 2; AP: average precision; mAP: mean average precision.
It is also understood that bounding box techniques such as YOLO v2 provide an immediate mean for engineers to evaluate the structural soundness, so as to determine whether the structures require further assessments. This is usually the first and most important step to identify the conditions of a structure. However, the current trend also leads to the semantic segmentation, such as FCN, to allow pixel-level classification and damage quantification. Both bounding box techniques and FCN are comparable in terms of object detection. It is acknowledged that FCN is good for object localisation, but it may take more time to infer and bear higher computational costs due to the fact that its detection is at the pixel level. However, YOLO v2 network is faster and good for real-time monitoring, as it is at the image level while it is less precise as compared to FCN. It is therefore suggested that once the structure is quickly identified to be safety suspicious based on the outcomes from the YOLO v2 bounding boxes, semantic segmentation should come into the picture, allowing for more precise structural assessments and quantification.
Conclusion and future work
This study presented a novel application of YOLO v2 to detect the two most commonly seen structural features in onsite collected images, that is concrete crack and handwriting script, which are quite similar in shape and easily misclassified. Experiments were carried out to verify the ad hoc YOLO v2 trained with a dataset with these two different classes of objects. The results showed that although there were some FNs in the three full-scale evaluation images, the majority of the concrete cracks were correctly identified. As a result of that finding, it is considered that the proposed YOLO v2 network can be used to determine crack locations and efficiently differentiate cracks from co-existing handwriting script marked on the concrete surface during onsite inspection. A similar object detection network, faster R-CNN, was applied to the same dataset for comparison of the network performance. The results showed that YOLO v2 had similar accuracy in crack detection, but demonstrated much faster processing, indicating the potential for real-time crack detection using UAVs. As concrete cracking is usually the first sign of structural damage, this work will also allow us to track the progression of cracks as the crack develops over time, which will trigger early alarm for the bridge failures. Finally, the proposed algorithm can be extended to any other surface defects, for example, corrosion, spalling.
Although YOLO v2 has proven to be robust in concrete crack detection with relatively fast speed, the algorithm still requires further improvement to achieve real-time concrete crack assessment. First, further study on the influence of different hyperparameters used in the training stage should be conducted to achieve better performance of the network. Second, based on the outcomes from YOLO v2 where crack location can be determined, semantic segmentation algorithm, such as FCN should be deployed to quantify the damage, which will be another focus of future study. Moreover, the global locations of concrete cracks are to be determined in the future with the aid of UAVs with global positioning system (GPS) coordination when the photo is taken. A bridge information modelling (BrIM) platform will also be set up to integrate image database, by which concrete cracks can be identified and visualised globally, highlighting the corresponding location of the crack on the bridge.