






Abstract
By providing accurate and efficient crack detection and localization, image-based crack detection methodologies can facilitate the decision-making and rehabilitation of the roadway infrastructure. Deep convolutional neural network, as one of the most prevailing image-based methodologies on object recognition, has been extensively adopted for crack classification tasks in the recent decade. For most of the current deep convolutional neural network–based techniques, either intensity or range image data are utilized to interpret the crack presence. However, the complexities in real-world data may impair the robustness of deep convolutional neural network architecture in its ability to analyze image data with various types of disturbances, such as low contrast in intensity images and shallow cracks in range images. The detection performance under these disturbances is important to protect the investment in infrastructure, as it can reveal the trend of crack evolution and provide information at an early stage to promote precautionary measures. This article proposes novel deep convolutional neural network–based roadway classification tools and investigates their performance from the perspective of using heterogeneous image fusion. A vehicle-mounted laser imaging system is adopted for data acquisition (DAQ) on concrete roadways with a depth resolution of 0.1 mm and an accuracy of 0.4 mm. In total, four types of image data including raw intensity, raw range, filtered range, and fused raw image data are utilized to train and test the deep convolutional neural network architectures proposed in this study. The experimental cases demonstrate that the proposed data fusion approach can reduce false detections and thus results in an improvement of 4.5%, 1.2%, and 0.7% in the F-measure value, respectively, compared to utilizing the raw intensity, raw range, and filtered range image data for analysis. Furthermore, in another experimental case, two novel deep convolutional neural network architectures proposed in this study are compared to exploit the fused raw image data, and the one leading to better classification performance is determined.
Keywords
Introduction
Cracking distress is one of the most common types of defects in civil infrastructure, 1 which is caused by various factors such as vehicle loading, aging of materials, and long-term environmental effects. 2 For example, the freeze-thaw effect3,4 can cause concrete cracking due to moisture freezing and expansion; the alkali-silica reaction (ASR) can lead to aggregate expansion and cracking. 5 As such cracks gradually evolve, propagate, and coalesce into major structural cracks, the integrity and serviceability of the infrastructure are largely deteriorated, which is one of the pressing concerns facing today’s civil engineering community.
The Moving Ahead for Progress in the 21st Century Act (MAP-21) 6 sets the course for transportation investments in highway infrastructure to address the challenges facing the U.S. transportation system such as improving safety and maintaining infrastructure condition. To fulfill the requirements by MAP-21, the federal and state transportation agencies and local governments devote long-term efforts to implementing performance management activities and methodologies, including the collection of right-of-way imagery data.7,8 In this context, the development of accurate and efficient methodologies for infrastructure surface crack detection using real-world imagery data is of great importance, as it facilitates a prompt transportation decision-making and rehabilitation by detecting and providing cracking information for health monitoring and condition assessment of the infrastructure. For example, the bridge element inspection manual by American Association of State Highway and Transportation Officials (AASHTO) 9 requires certain types of cracking features to be detected as quantitative measures to categorize the structural surfaces into different health condition states.
On surface crack detection, image-based methodologies by leveraging computer vision techniques have been extensively explored in recent decades, 1 as this type of methodology provides a better alternative to the traditional visual inspection approach 10 by offering higher efficiency and more consistency. It has been a rising interest among professionals and researchers to develop advanced image-based crack detection methodologies to provide accurate cracking information for prompt health monitoring and condition assessment.
Early applications utilized image intensity data for crack detection, generally under the assumption that cracked regions have lower intensity values than non-crack regions. Common techniques using intensity images include filter-based,11–14 model-based,15–17 and pattern-based18,19 methods. In practical situations, the acquired intensity images usually suffer from shadows, varying ambient lighting conditions and poor contrasts between cracks and surrounding regions, 20 which can bring additional uncertainties to the detection results; moreover, many non-crack features, such as blemishes, oil stains, and concrete spalls, lead to difficulties in intensity-based crack detection. 21 To address these issues in intensity images, many pre-processing techniques including histogram equalization,22,23 median filtering,24–26 and adaptive thresholding27,28 are developed for background rectification and crack enhancement. In general, the performance of these pre-processing techniques is case-dependent and prone to subjectivities induced by parameter selection.
With the rapid development of image acquisition devices in recent years, researchers have explored the use of image range (i.e. elevation) data for crack detection. The image range data, obtained through laser scanning or three-dimensional (3D) reconstruction techniques, contain the depth information of structural surfaces. Range-based methods distinguish cracks and the surrounding non-crack regions based on changes in elevations. 20 Different than the intensity data, the laser scanned range data are insensitive to uneven illumination conditions and non-crack features such as oil stains. 20 Recent range-based applications include Ouyang and Xu, 29 Jiang and Tsai, 30 Zhang et al., 31 Qiu et al., 32 and Zhang et al. 33 However, as stated in Jiang 2 and Zhou and Song, 34 for applications using range images, several image-related issues still exist such as surface variations and grooved patterns. These issues can negatively impact the crack detection performance and thus need to be properly addressed. Several image pre-processing techniques, such as surface fitting, 29 image filtering,30,34,35 and shadow modeling, 33 are applied to address the issues in range images. Similar as the scenarios with intensity images, upon applying pre-processing techniques for range images, the choice of parameters or prior knowledge is still critical, and the associated subjectivity cannot be completely avoided.
As introduced above, an image pre-processing procedure for noise removal and crack enhancement is usually required for crack detection methods using intensity or range data. Thus, the corresponding detection performance is to a large extent dependent upon the effectiveness of the image pre-processing, which is further involved with a selection on the associated parameters. However, as it relies on prior user input which is expertise-intensive, the parameter selection is inevitably a subjective process. Furthermore, the real-world complexities often exist in the form of the irregularities of cracks, diversities in structural surfaces, variabilities of ambient environment, and uncertainties induced by non-crack features. Such issues lead to the reality that it is very challenging to select universally applicable parameters or determine a robust crack detection scheme that can thoroughly address such complexities. Therefore, it remains a challenge for image-based methods to achieve consistent and reliable detection performance in real-world situations. 36
In recent years, deep convolutional neural network (DCNN), as one of the deep learning-based methods, has been extensively explored and applied for crack detection research. Compared with traditional approaches, DCNN has the capability of directly learning from data, making self-adaptations and adjustments, and realizing a high-level feature abstraction through a multi-layer network layout. Instead of assigning user-dependent prior parameters, the parameters in a DCNN are updated through a supervised learning process. Thus, DCNN can potentially alleviate the issue from subjective parameter selection and outperform the traditional approaches, given that the data samples used in DCNN are diversified and representative of the actual scenarios. Majority of current DCNN-based crack classification methodologies37–42 adopted raw intensity image data for analysis. Nevertheless, some other applications adopted pre-processing techniques such as intensity correction and thresholding, 43 image binarization and noise removal, 44 and image smoothing 45 to address the issues in intensity images prior to applying DCNN. Besides, some recent DCNN-based applications also applied image pre-processing procedures on laser scanned range images. Zhang et al. 46 employed a feature extractor based on line filtering for crack enhancement. A surface flattening technique was adopted in Zhang et al. 36 to eliminate surface variations in 3D range images prior to training and testing. Despite their wide adaptability, some DCNN-based methodologies36,43,46,47 still employ image pre-processing procedures, due to the real-world complexities in image data.
The above DCNN applications utilized either intensity or range image for analysis. Depending on the image type, crack detection methodologies may suffer from issues such as uneven illumination and low contrast in intensity images or surface variations and grooved patterns in range images. For example, as observed in Zhang et al., 36 grooved patterns in concrete pavements resulted in false-positive detections. Besides, several DCNN-based applications36,43–47 adopted image pre-processing techniques for crack enhancement, which may bring uncertainties and subjectivities due to parameter selection. From the viewpoint of image data, it may be beneficial to jointly consider multiple data sources to address image-related issues and improve DCNN performance. This study aims to develop a novel DCNN-based roadway crack classification methodology by leveraging heterogeneous data fusion on raw range and intensity image data. Heterogeneous data fusion is a process to integrate information from different types of data sources to provide more comprehensive information and reduce uncertainties.48–51 By correlating different types of data with distinct characteristics, heterogeneous data fusion is potentially more beneficial than homogeneous data fusion which uses a single type of data.50–52 In crack detection applications using image data, some studies, such as Chen et al. 53 and Chen and Jahanshahi, 54 leveraged homogeneous data fusion. Heterogeneous data fusion has also been explored in defect detection applications. Heideklang and Shokouhi 55 combined the measurements from three types of data sources for improved detection of near-surface defects, but they have not considered DCNN techniques in their study. Although Beckman et al. 56 proposed a method to detect concrete spalling using region-based DCNN and two types of data sources, the DCNN is only applied to one type of the data sources. None of these studies have proposed a DCNN-based crack detection framework capable to analyze multiple sources during data fusion. Therefore, the use of DCNN for crack detection with multiple types of image data sources has not been fully explored; the effects of heterogeneous image data on DCNN-based crack classification have not been thoroughly demonstrated and discussed; and strategies to improve DCNN performance by exploiting heterogeneous image data are also yet to be determined.
In this study, DCNN-based roadway crack classification methods that consider heterogeneous data fusion of both intensity and range images have been proposed and developed. The performance of the proposed methods is also evaluated and compared to seek a better fusion strategy for roadway crack classification application. A laser imaging system that can capture both image range and intensity data is used for DAQ on concrete roadways. The contributions of this study can be seen in the following aspects:
A novel data fusion approach is proposed for DCNN-based crack classification by integrating the range and intensity image data to offer robust crack classification performance.
The effects of heterogeneous image fusion and pre-processing on the proposed DCNN architectures are demonstrated using four types of image data including raw intensity, raw range, filtered range, and fused raw image for analysis.
Two DCNN architectures representing different data fusion strategies to exploit the fused raw image data are proposed and evaluated. Neither of the architecture requires image pre-processing procedures to tackle the issues of image disturbances existing in the fused raw image input. Through the experimental study, the one achieving better classification performance with fused raw image data is determined.
The rest of this article is organized as follows: section “Proposed methodology” describes the heterogeneous image data and the proposed DCNN architectures for roadway crack classification; the two experimental cases are then presented in section “Experimental study;” and the concluding remarks are summarized in section “Conclusion.”
Proposed methodology
This section describes the proposed methodology, including the heterogeneous image data and the proposed DCNN architectures for roadway crack classification. As mentioned in section “Introduction”, one of the objectives of this study is to investigate the effects of heterogeneous image data on DCNN performance on roadway crack classification. A novel approach that combines the information in raw intensity and raw range images is then proposed, as described in section “Proposed heterogeneous image fusion.” And, correspondingly, several DCNN architectures that exploit raw intensity, raw range, filtered range, and fused raw image data are proposed.
Image data types
In this study, a 3D laser imaging system (see section “DAQ”) is adopted to capture both range image and intensity image simultaneously from roadway surfaces. Besides, filtered range images are generated through an image pre-processing technique. 34 Moreover, fused raw images by combining the information in the raw range and corresponding raw intensity images are created. Therefore, in total, four types of image data are prepared for training and testing.
Intensity image
As explained in section “Introduction,” using image intensity data for crack detection is generally based on the assumption that cracked regions are darker (i.e. lower intensity value) than non-crack regions. 20 Thus, the performance of intensity-based methodologies may potentially be deteriorated due to the issues of uneven illumination condition, low contrasts between crack and non-crack pixels, and non-crack features (e.g. shadows and blemishes) which also have low intensity values. Some intensity image samples suffering from low intensity contrasts are illustrated in Figure 1. In Case I of the experimental study, one of the proposed DCNN architectures, Net-A (see section “Net-A: a DCNN architecture for single-channel image input”) is trained and tested on a raw intensity image data set (see section “Data generation”), to evaluate the effects of raw intensity image on roadway crack classification.
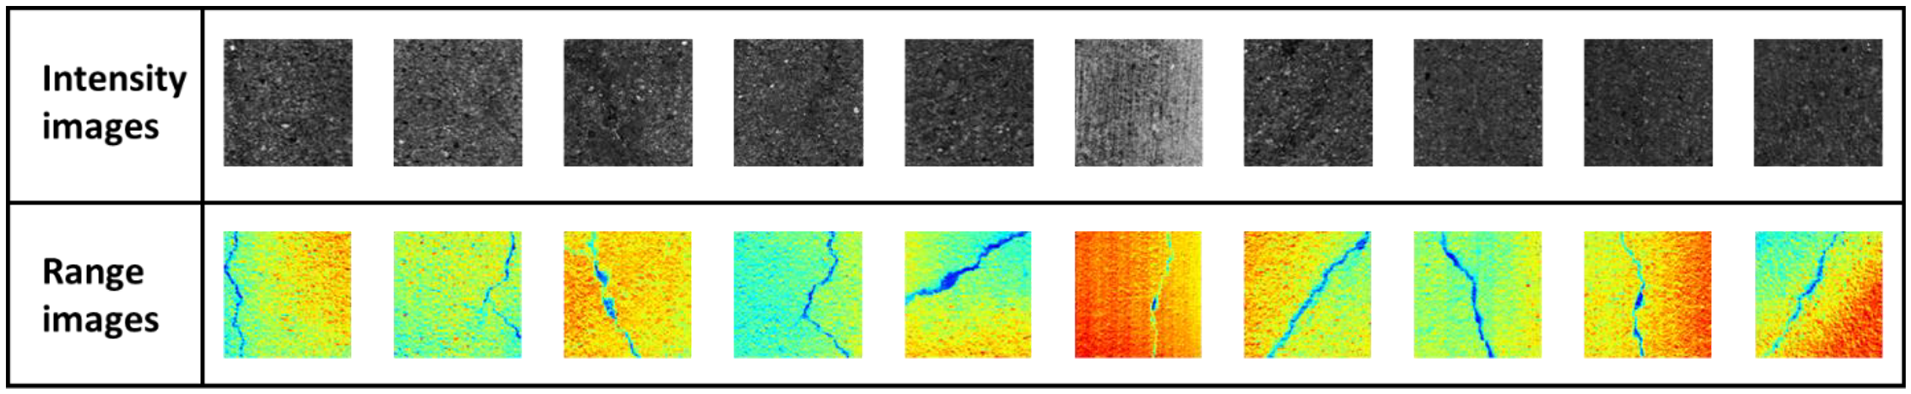
Cracks that are apparent in range images but not noticeable in intensity images.
Range image
In recent years, image range data have been adopted by many researchers as a better alternative to interpret the existence of cracks through changes in surface elevations.30,31,33,36,46,57 Compared with intensity image, range image is less sensitive to varying lighting condition and low contrasts between cracks and surrounding regions. 20 As illustrated in Figure 1, cracks are significant in the range image samples but very difficult to be distinguished in the corresponding intensity images, due to low intensity contrasts in some samples. In Case I, a raw range image data set (see section “Data generation”), which is a counterpart of the intensity image data set, is also utilized to train and test Net-A for comparison purposes.
Filtered range image
Despite the advantages over intensity images, range images also suffer from several issues that may bring uncertainties to crack detection. Such issues include surface variations, scanning noises, and crack-like patterns such as pavement grooves. 34 Therefore, an image pre-processing technique 34 is adopted to eliminate these disturbances from the acquired range images. Through this technique, which is based on frequency domain filtering, filtered range image data that are free from the influence from surface variations and pavement grooves can be obtained. The purpose of using the filtered range versus raw range data for analysis is to investigate the effect of image pre-processing on the DCNN classification performance. Subsequently, the filtered range image data set is utilized by Net-A for training and testing. Thus, the impacts from image pre-processing can be demonstrated through a comparison on DCNN performance using raw range images versus filtered range images. Figure 2 illustrates some raw range image samples contaminated with surface variations, scanning noises, and grooves, and the corresponding filtered range images that are free from such disturbances.

Raw range images versus filtered range images.
Proposed heterogeneous image fusion
Because range-based methodologies rely on elevation reduction to interpret the presence of cracks, their performance may be deteriorated due to shallow cracks. 34 The shallow cracks referred in this study are structural cracks with low depths. Although shallow cracks do not pose a major threat to the health condition of the infrastructure, they can reveal the trend of crack evolution and provide necessary information (e.g. location) to promote precautionary measures. Therefore, accurate detection of the shallow cracks is of importance to the health monitoring and condition assessment of the infrastructure. A data fusion approach that can combine the information in both the intensity image and range image is developed in this methodology. Data fusion is a process to integrate information from multiple sources to generate more informative and comprehensive new data instead of considering each data source separately.48,52,58,59 Generally, performing data fusion has a series of advantages such as improved detection accuracy, confidence, and reliability, and reduction in data ambiguity. 48 In this study, a heterogeneous image fusion approach is proposed by integrating raw range image and raw intensity image to create fused raw image data. The idea of heterogeneous image fusion proposed in this study is inspired by the concept of hyperspectral imaging. 60 Hyperspectral images are volumetric image cubes that consist of multiple channels of spatial images (or spectral bands), with each image containing information at a specific wavelength. Likewise, the heterogeneous image fusion proposed in this study can be achieved by treating each type of image data (i.e. raw intensity and range image) as a specific channel in a hyperspectral image.
In this study, a 3D laser imaging system (see section “DAQ”) that can obtain both intensity and range image is adopted for image acquisition on roadway surfaces. The simultaneous acquisition of the raw range and intensity data is enabled by the camera, which provides spatial correspondence at pixel level. Then, each acquired image pair is used to generate a hyperspectral image, with the first channel as the raw range image and the second channel as the raw intensity image. This heterogeneous image fusion process is illustrated in Figure 3. In this figure, the dimensions of the intensity and range image patches are 256 × 256 × 1; therefore, the corresponding hyperspectral image has the dimension as 256 × 256 × 2. The advantage of heterogeneous image fusion is that it generates a spatial co-location feature of cracks (see Figure 3), where the term “co-location” indicates the spatial correspondence of the crack pixels in the range and intensity image pairs. Furthermore, the use of heterogeneous image fusion can potentially improve the detection performance on low-contrast cracks in intensity images and shallow cracks in range images by cross-domain information extraction from their image counterparts. Thus, a DCNN architecture utilizing the fused raw image data instead of using the range or intensity data alone can potentially yield better classification performance.

A dual-channel hyperspectral image.
Proposed DCNN architectures
In this section, a total of three DCNN architectures are proposed for different tasks. Net-A is designed to take single-channel image input including raw intensity images, raw range images, and filtered range images. Then, Net-B is modified from Net-A by changing the input layer and the first convolutional layer, such that it can utilize fused raw image data for analysis. In addition, another DCNN architecture, Net-C, is proposed as a different layout than Net-B to be trained and tested on the fused raw image data. The proposed architectures include convolutional layer, fully connected layer, and auxiliary layers such as batch normalization, leaky rectified linear unit (leaky ReLU), dropout, and softmax layers. Because information on these network layers are readily available from the literature,61,62 their technical details are not described herein. The design of these DCNN architectures and the associated training scheme are based upon successful applications in the literature. The hyperparameters that govern the performance of the DCNN include those related with DCNN architecture such as kernel size and network depth and those related with training such as learning rate and weight decay. In this study, 3 × 3 convolutional kernels are adopted in the convolutional layers, because the use of small kernels is reported to have good performance.36,63,64 The network depth (i.e. number of weight layers) is determined through a preliminary parametric study, such that the DCNN is capable to analyze the data with real-world complexity. The hyperparameters related with training are determined under the successful experience from similar applications. For example, the weight decay factor involved in the optimization is the same as used in Zhang et al. 36 It is worth noting that upon designing these architectures, the total number of learnable parameters among these architectures is kept similar to each other, as a means to balance the model complexity for comparison purposes.
Net-A: a DCNN architecture for single-channel image input
The architecture of Net-A is illustrated in Figure 4, with its detailed configuration on each layer tabulated in Table 1. This DCNN is a deep architecture which takes single-channel image patches as the input and predicts the images as containing cracks or not.

Net-A: proposed DCNN architecture with single-channel image input.
Detailed configuration of Net-A and Net-B.
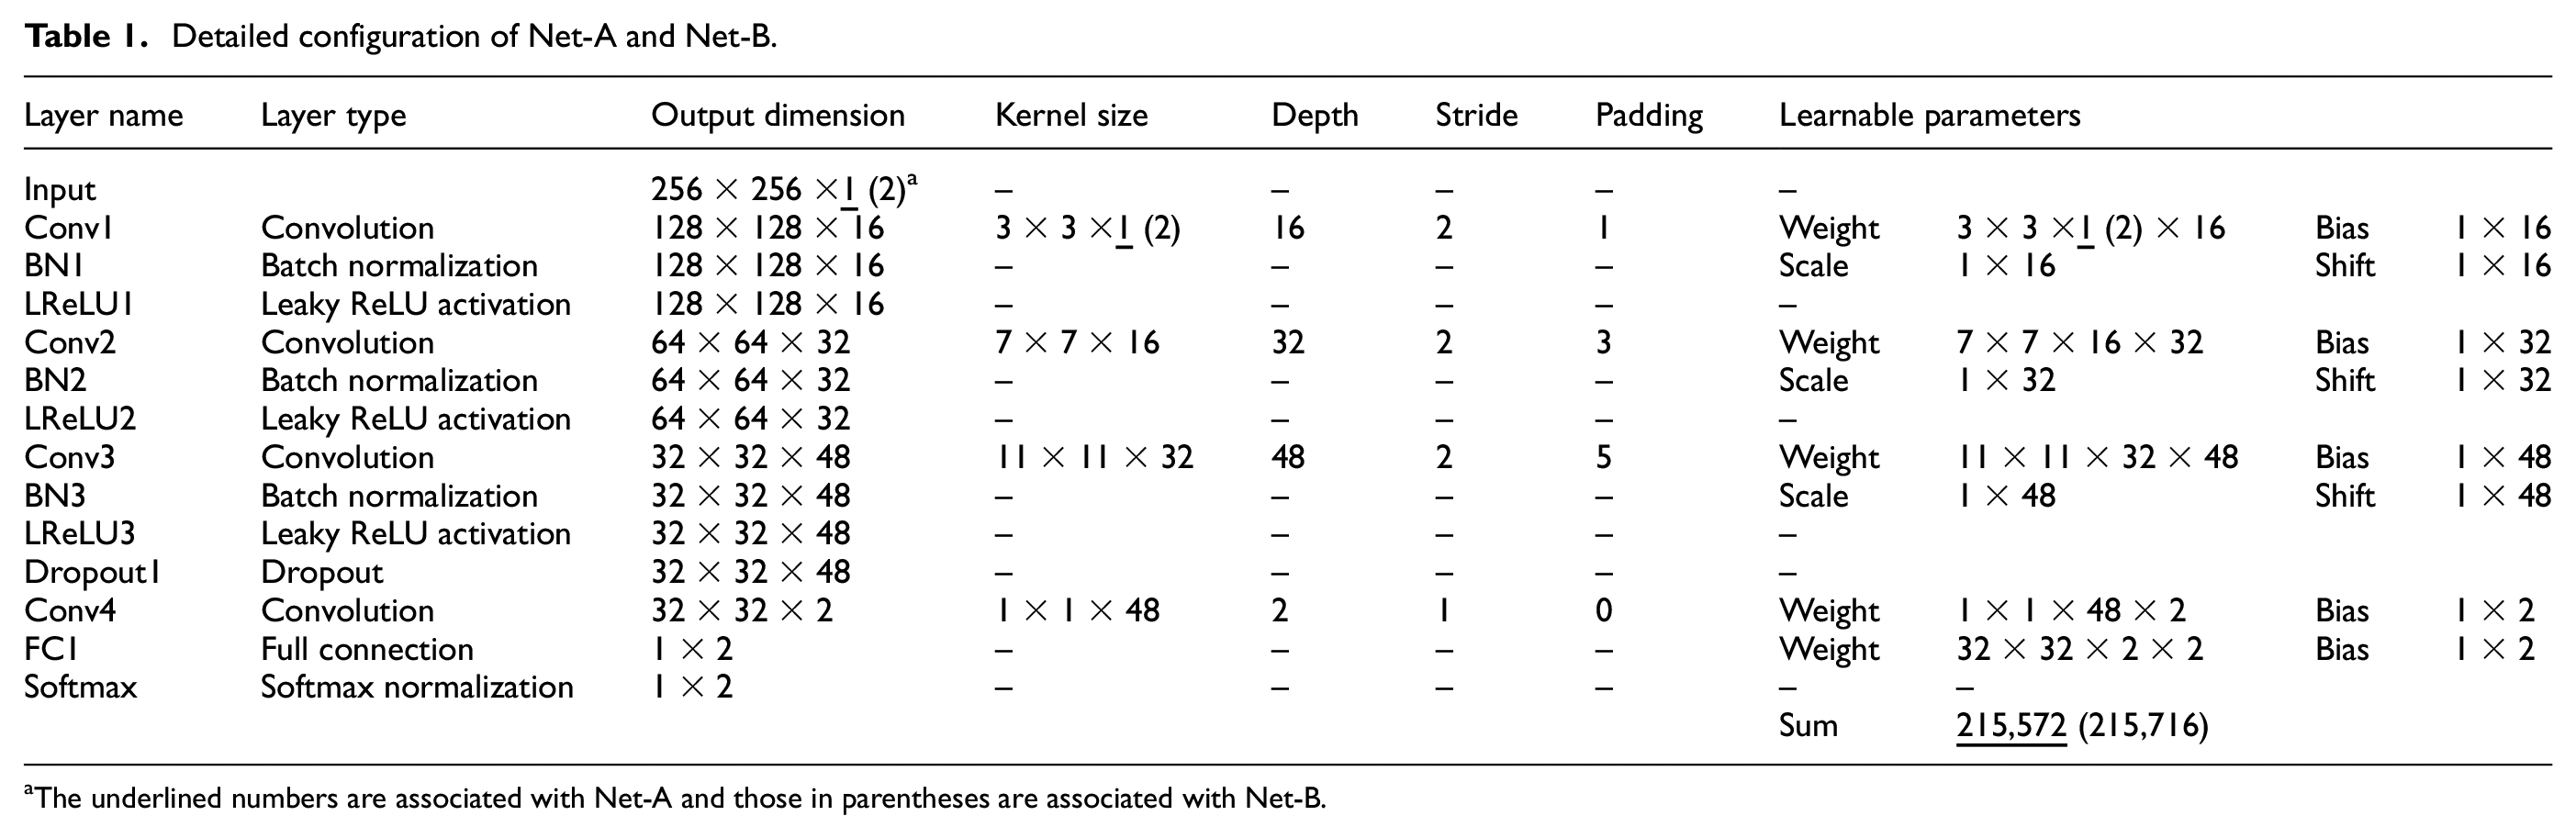
The underlined numbers are associated with Net-A and those in parentheses are associated with Net-B.
Net-B and Net-C: DCNN architectures for dual-channel image input
Two architectures, namely, Net-B and Net-C, are configured for fused raw image data. These architectures are designed to have completely different layouts: Net-B directly extracts the spatial co-location feature in the fused raw image data at a lower level; On the contrary, Net-C first separates the intensity and range information from the input, then performs individual feature extraction, and finally merges the extracted features from the intensity or range data at a higher level.
Net-B: data fusion at input layer
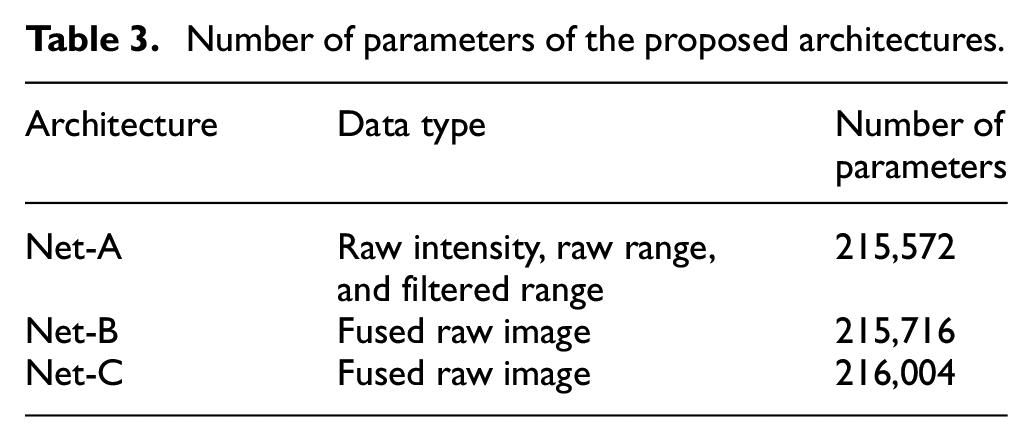
Having a similar architecture as Net-A, Net-B employs a straightforward yet very intuitive approach to take advantage of the fused raw image data; that is, to modify the kernel sizes of the first convolutional layer (“Conv1” in Table 1) from 3 × 3 × 1 to 3 × 3 × 2 to directly convolve with the dual-channel image input. The detailed layer configuration of Net-B is also tabulated in Table 1. The layout of Net-B is illustrated in Figure 5. Such a configuration allows to exploit the spatial co-location features existing in the fused raw image data through the first convolutional layer. Induced by changes in the filter kernels, the total number of parameters is slightly increased from 215,572 (Net-A) to 215,716 (Net-B).
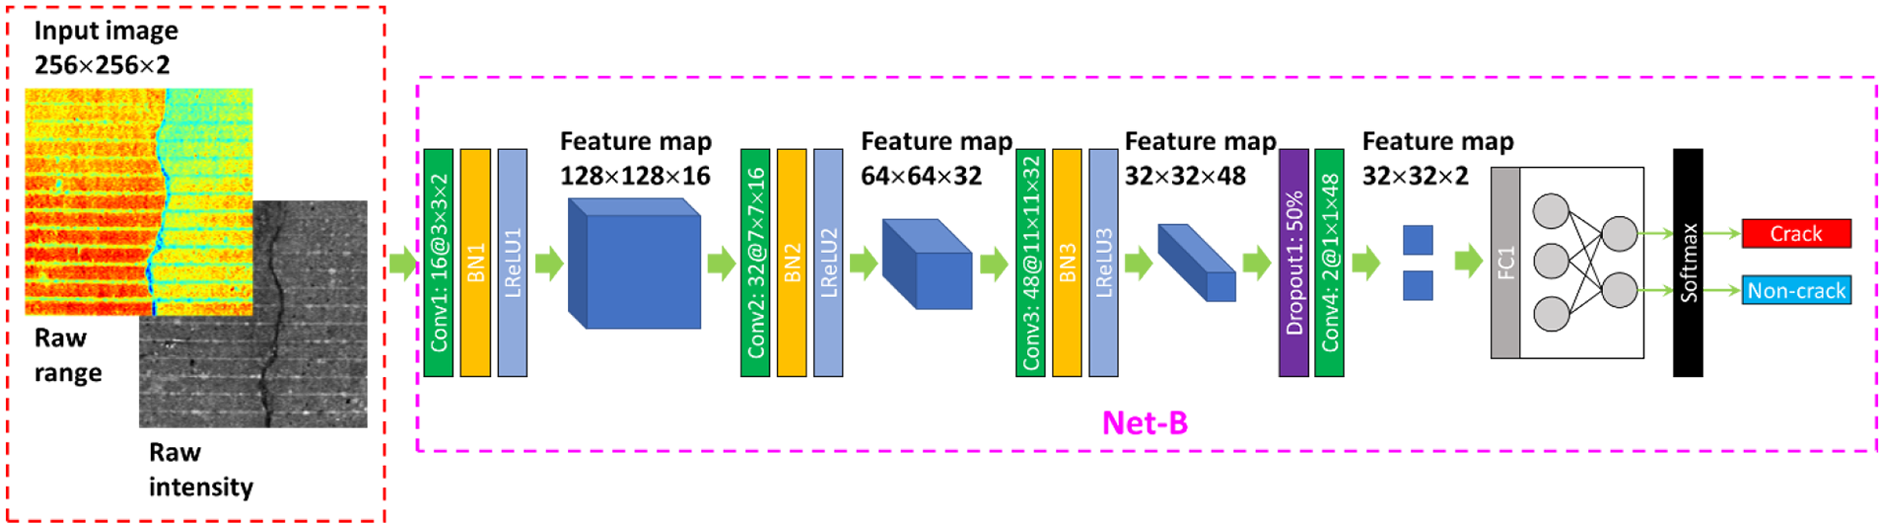
Net-B: proposed DCNN architecture with dual-channel image input.
Net-C: data fusion at concatenation layer
Different than Net-B, Net-C is designed to perform individual feature extraction on the intensity or range data separated from the fused raw image input, as illustrated in Figure 6. The detailed layer configuration is tabulated in Table 2. Separation on the input data is achieved by convolving the fused raw image input with a fixed-weight 1 × 1 convolutional layer, which acts like a channel switch. After feature extraction on separate channels, the high-level information is merged through a depth concatenation layer, labeled as “Concat1” in Figure 6 and Table 2. The major difference between Net-B and Net-C lies in that Net-B fuses image information at a lower level through a convolutional layer, referred to as a “fuse-extract” pattern; Net-C, however, fuses features extracted from separate image channels at a higher level through a concatenation (i.e. fusion) layer, which can be referred to as a “extract-fuse” pattern. As demonstrated in Case II, different patterns on the data fusion and feature extraction govern the network performance.
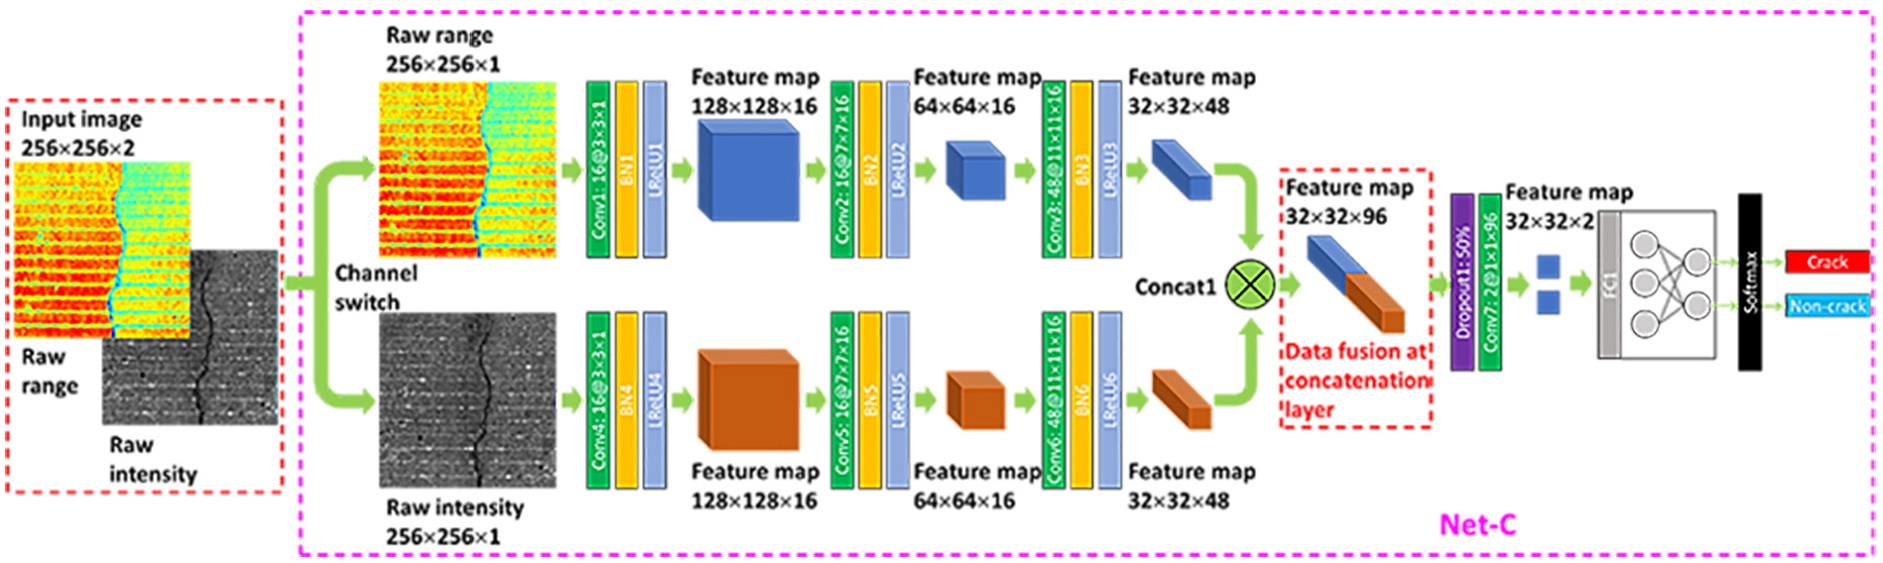
Net-C: proposed DCNN architecture with dual-channel image input.
Detailed configuration of Net-C.

As mentioned previously, these DCNN architectures are designed such that they contain similar amounts of learnable parameters, as indicated in Table 3. With all three architectures sharing the similar level of model complexity as reflected by the number of parameters, the major impact factors on the network performance thus originate from different types of image data and the associated architecture layouts.
Number of parameters of the proposed architectures.
Experimental study
The flowchart of the proposed methodology is illustrated in Figure 7. As shown in this figure, the first step is to obtain raw range (section “Range image”) and intensity image data (section “Intensity image”) using the laser imaging system (section “DAQ”). Second, the novel heterogeneous image fusion approach as described in section “Proposed heterogeneous image fusion” is proposed to integrate the raw range and intensity data. Then, the fused raw image is processed through a data generation process, including image patch generation through the sliding window technique, ground truth label (i.e. “crack” vs “non-crack”) generation, data augmentation, and training/validation data sets generation. Details on these data generation procedures are described in section “Data generation.” The next two steps (section “Experimental setup and results”) are to train the proposed DCNN architectures on the fused image data and then utilize the trained DCNNs to predict a crack map on a new roadway image data.
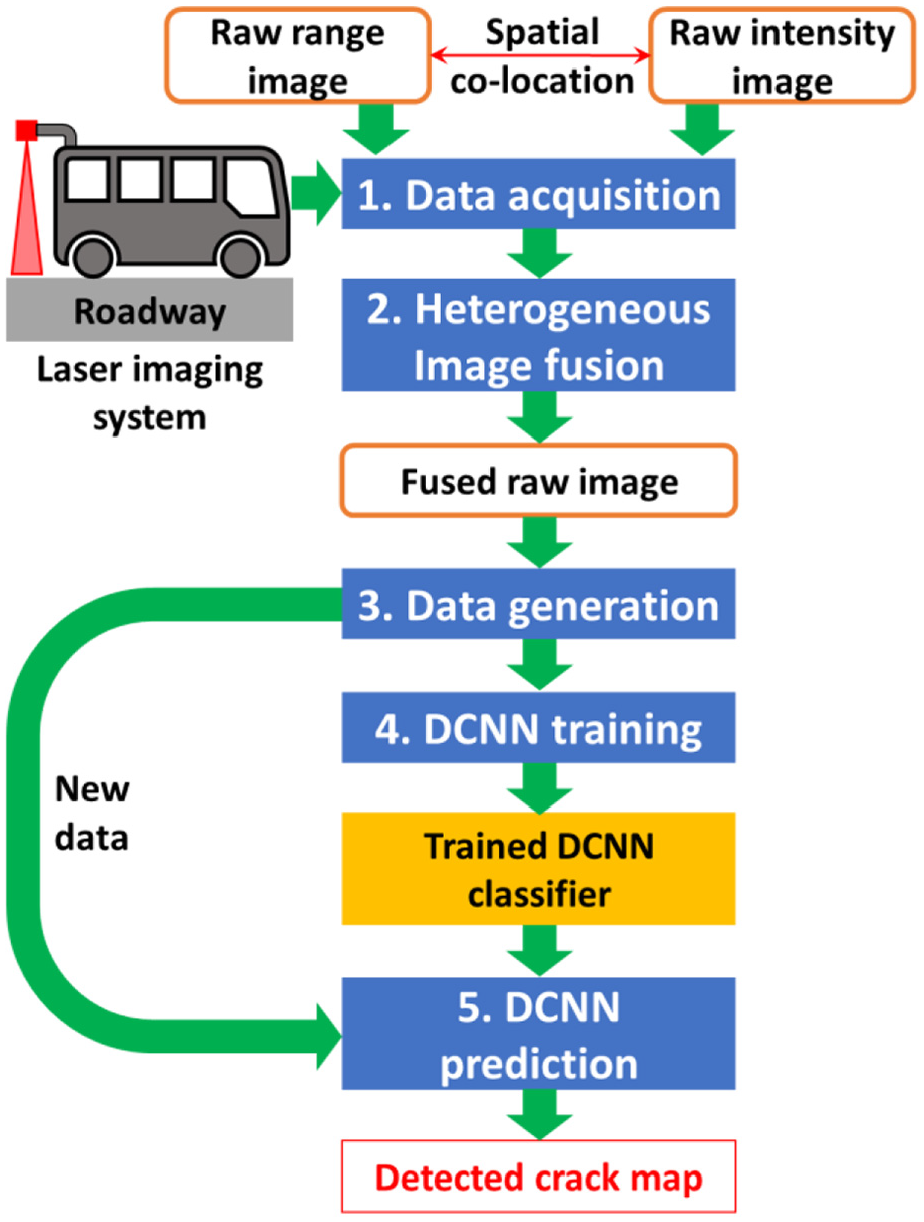
Flowchart of the proposed methodology.
DAQ
A 3D laser imaging system manufactured by AMES Engineering is adopted to simultaneously acquire both the image range data and intensity data. The obtained range and intensity images are co-located with spatial correspondence, which is enabled by the camera. As illustrated in Figure 8, this system features a 3D laser camera module mounted on the rear top of a vehicle, an on-board DAQ device to capture both the range image and intensity image and a high performance laptop for data processing and analysis. The camera module is mounted 2.13 m (84 inch) above the ground. During each scan, it captures a transverse profile of both range and intensity data with spatial correspondence. Each transverse profile contains 4096 pixels and is 3.96 m (156 inch) wide; thus, the transverse pixel resolution is 1 mm/pixel (0.04 inch/pixel). Along the longitudinal direction, to maintain a uniform longitudinal pixel resolution as 2 mm/ pixel (0.08 inch/pixel), the sampling rate of the DAQ is set as 4856 Hz when the vehicle is driving under 9.83 m/s (22 mph). The depth resolution of the vehicle-mounted imaging system is 0.1 mm with an accuracy of 0.4 mm. An example of the captured image range and intensity data on a roadway surface is illustrated in Figure 9.
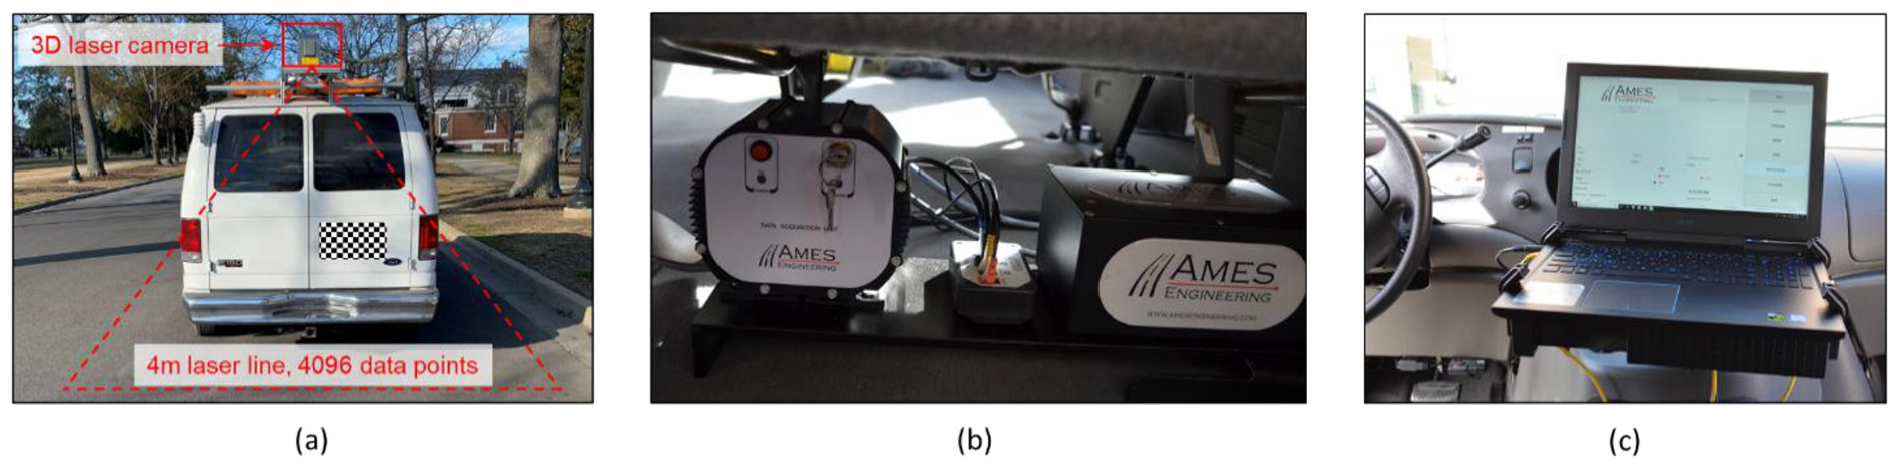
A laser imaging system to capture image range and intensity data: (a) vehicle-mounted 3D laser camera, (b) DAQ device, and (c) data processing laptop.
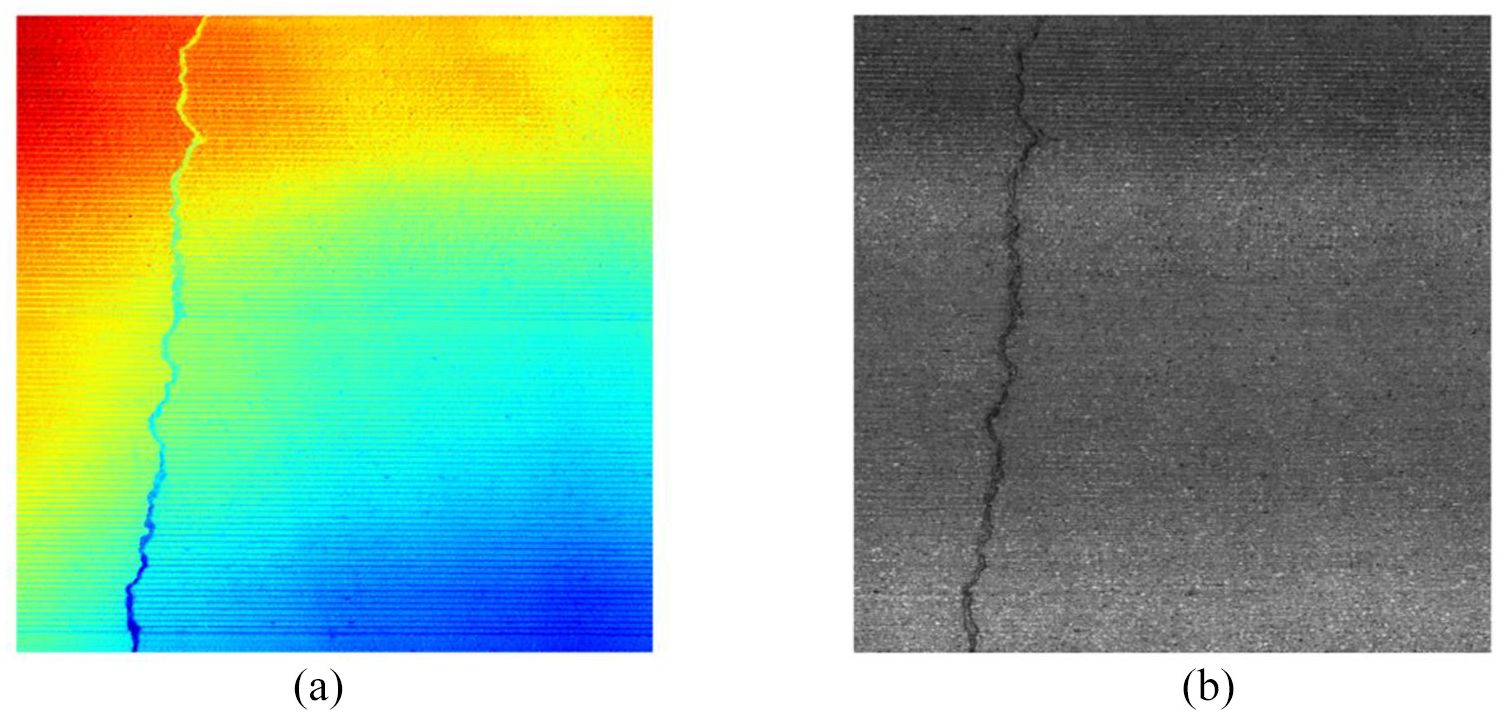
An example of the image range and intensity data captured by the laser imaging system: (a) range image and (b) intensity image.
Data generation
In this study, the raw image range and intensity data are collected by the laser imaging system over a one-year period on multiple concrete roadways. The acquired raw range images are further processed by trained personnel using the image pre-processing technique, 34 to generate filtered range images which are free from surface variations, scanning noises, and non-crack patterns. A sliding window technique, as used in Cha et al., 39 is applied to crop all the image data into many patches which have smaller sizes to reduce computational cost. Each image patch is categorized with a “crack” or “non-crack” label by trained personnel. Also, the fused raw image patches are created using the raw range and intensity image pairs by the procedure described in section “Proposed heterogeneous image fusion.” As a result, four types of image patches including raw range, raw intensity, filtered range, and fused raw images are prepared for analysis. The dimension of each image patch is 256 × 256 × 1 for the raw range, raw intensity, and filtered range images, but 256 × 256 × 2 for the fused raw image.
Meanwhile, to effectively increase the number of samples (i.e. image patches) in each type of image, data augmentation techniques including rotation (counterclockwise 90°, 180°, and 270°) and mirroring (left-right and up-down) are performed. Data augmentation is an effective approach to reduce overfitting and improve generalization by increasing the number of image data through label-preserving transformations.65,66 In total, 30,000 crack samples (including augmented samples) and 30,000 non-crack samples are generated for each type of image data; the amount of crack and non-crack samples is kept the same to avoid the issue of class imbalance. 67
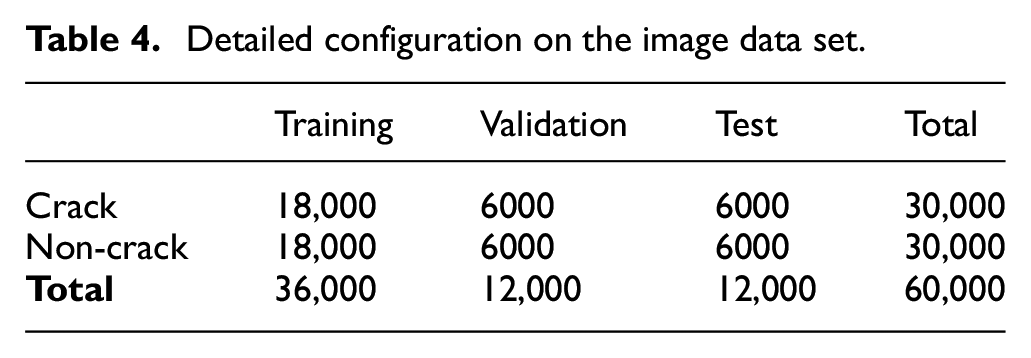
The image samples are further separated into three data sets including the training data set, validation data set, and test data set following a ratio of 60%:20%:20%. The training data set is used to fit the DCNN model. The validation data set is evaluated during training to provide a measure on the goodness of model fit and indicate if overfitting occurs. After training is completed, the network is tested on the test data set to evaluate the model ability to generalize and adapt to a new data set. Detailed configuration on the image data set for each type of image data is tabulated in Table 4.
Detailed configuration on the image data set.
The above data augmentation and data set generation processes are repeated for each type of image data. Thus, each type of image forms a set of training, validation, and test data sets.
Experimental setup and results
Two cases are performed in this section. Case I investigates the impacts on DCNN-based roadway crack classification by heterogeneous image data including raw range, raw intensity, filtered range, and fused raw image; and Case II further compares the performance of two architectures using the fused raw image data, upon which the one leading to better classification performance is determined.
Computing device
On performing all the experiments, the same computing device is used to isolate the influence from different devices. The specifications of the computer are as follows: CPU: Intel Xeon E5-2630 @2.20 GHz and GPU: Nvidia Quadro M4000 with 8 GB memory. MATLAB 68 and its deep learning tool box are utilized to implement the proposed DCNNs.
Parameter initialization
The weights in the convolutional layers and fully connected layers are initialized by the Glorot initializer 69 , which independently samples the weights from a Gaussian distribution with zero mean and a variance based on the dimension of the weights. The biases are initialized as 0. The scale and shift factor in each batch normalization layer are initialized as 1 and 0, respectively.
The mini-batch stochastic gradient-descent (SGD) with momentum 70 is adopted in this study as the optimization technique for training. The hyperparameters involved in this algorithm are specified as follows, which are determined under the successful experience from similar applications. The momentum is set as 0.9, same as that used by Cha et al., 39 Pauly et al., 71 and Fan et al. 72 The weight decay is set as 0.0003. 36 The dropout factor in each dropout layer is 0.5. 65 The leaky ReLU factor in each leaky ReLU layer is 0.01. 73 The other hyperparameters, such as the learning rate, are determined based upon successful applications72,74 and guidelines in Goodfellow et al. 61 The number of epochs is 10. One epoch is a full pass of the entire image data set through mini-batches. The mini-batch size is 60; that is, in each iteration, 60 images which have not yet participated in the training in the current epoch are randomly chosen for updating. According to the data generation process (see section “Data generation”), a total number of 36,000 image samples are prepared for training (see Table 4), resulting in 600 iterations in an epoch with each iteration containing 60 samples. Meanwhile, the validation data set is evaluated every half an epoch. The statistics evaluated on the validation data set at the end of training are used to interpret the goodness of model fit.
Performance metrics
Precision–Recall analysis 75 is adopted in this study to evaluate the performance of the proposed DCNN architectures on roadway crack classification. Four metrics including Accuracy, Precision, Recall, and F-measure (also known as F1 score) are calculated as the quantitative measures. As expressed in equation (1a), Accuracy is defined as the percentage of correctly predicted samples with respect to the total samples; Precision is the percentage of correctly predicted crack samples with respect to the samples that are predicted as cracks; Recall is the percentage of correctly predicted crack samples with respect to all the true crack samples; F-measure is the weighted average of Precision and Recall.
A high Accuracy value indicates a high positive detection rate; but, only relying on this measure to interpret the model performance is not enough, due to the issue of imbalanced class distribution 67 which often exists in real-world situations. Thus, additional performance metrics are usually needed to provide a comprehensive evaluation. High Precision and Recall values indicate low false-positive rate and low false-negative rate, respectively. Meanwhile, F-measure, as the harmonic mean of Precision and Recall, provides an overall measure on the model performance which is a better metric than Accuracy if class imbalance exists




where
Case I: comparison on network performance by heterogeneous image data
Net-A (see section “Net-A: a DCNN architecture for single-channel image input”), which is designed for single-channel image input, is trained and tested on three types of image data including the raw range, raw intensity, and filtered range image data sets. Furthermore, the fused raw image data are utilized by Net-B (see section “Net-B and Net-C: DCNN architectures for dual-channel image input”), which has the similar layout as Net-A except it takes dual-channel image input. Comparison on the performance metrics demonstrates the optimal form of image data to achieve the best classification performance.
A DCNN architecture 39 is employed as a benchmark architecture to further evaluate the effects of heterogeneous image data. This benchmark architecture is also utilized in some other applications, such as Cha et al. 41 and Liu et al., 76 for comparison. It is noteworthy that the benchmark architecture originally utilizes raw intensity images for classification; in this study, it is trained and tested not only on raw intensity images but also on raw range and filtered range images for analysis.
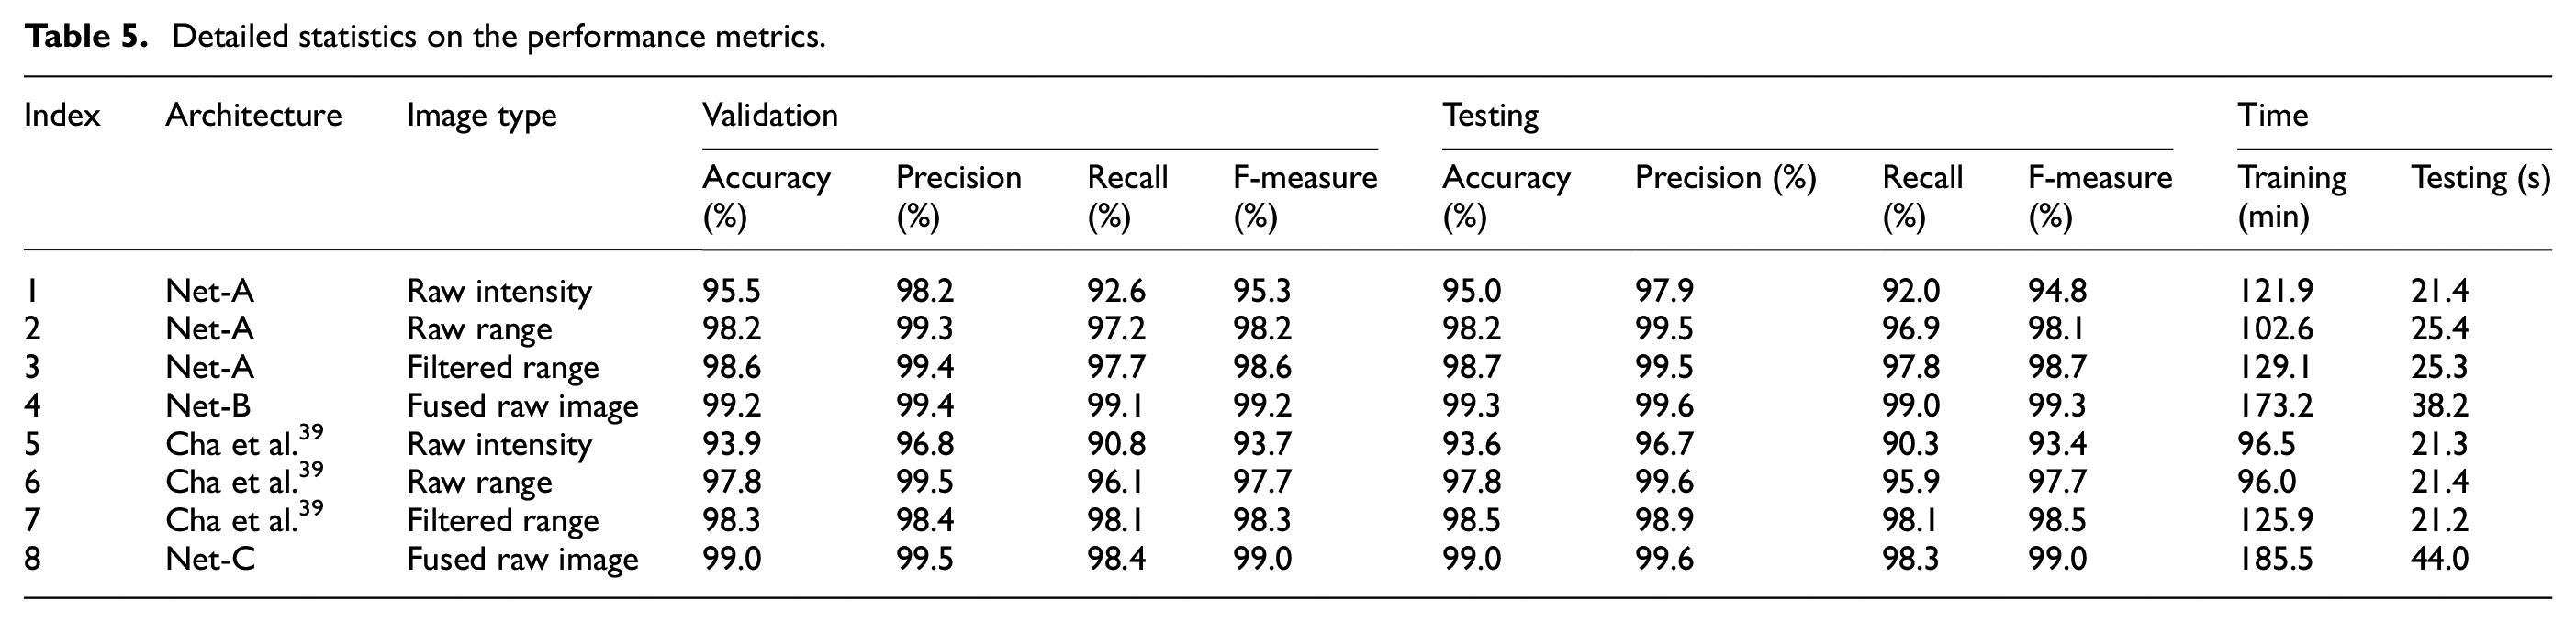
The performance metrics including Accuracy, Precision, Recall, and F-measure on the test data set are illustrated in Figure 10(a) to (d), respectively. Meanwhile, the detailed statistics on the performance metrics are tabulated in Table 5. Case I consists of seven subcases (Nos. 1–7 in Table 5). In the subcases Nos. 1, 2, and 3 in Table 5, Net-A is trained and tested on the raw intensity, raw range, and filtered range image data sets, respectively; subcase No. 4 corresponds to Net-B trained and tested on the fused raw image data set; the subcases Nos. 5, 6, and 7 utilize the benchmark architecture for training and testing on the raw intensity, raw range, and filtered range image data sets, respectively. In all four plots of Figure 10, the horizontal axis refers to the subcase indexes as defined in Table 5, which are further grouped by the image types, including raw intensity, raw range, filtered range, and fused raw image. Several observations on this figure are summarized below:
It is evident that using intensity image data for training and testing results in the lowest values on all four metrics shown in Figure 10. The Recall values for the subcases using intensity images (Nos. 1 and 5 in Figure 10(c)) are especially lower than others, indicating a much higher false-negative rate. As will be demonstrated later in Figure 12, these false negatives are induced by the issue from low contrasts between cracks and non-crack regions in the intensity images, which is the main reason leading to the worst performance;
Based on the comparisons on the following subcases “No. 1 versus No. 2” and “No. 5 versus No. 6,” it is demonstrated that using raw range image instead of intensity image can effectively improve the classification performance. Given the same architecture used, the F-measure values on the test data set are improved by 3% (Net-A in Nos. 1 and 2) and 4% (the benchmark in Nos. 5 and 6), respectively, due to the use of raw range images instead of raw intensity images. Similar level of improvement on the other metrics is also observed. Therefore, based on the data acquired in this study, it can be concluded that using raw range images is much better than using raw intensity images on DCNN-based roadway crack classification;
To evaluate the effect of image pre-processing, comparisons between the subcases “No. 2 versus No. 3” and “No. 6 versus No. 7” are performed. It can be observed that in these two comparisons, utilizing filtered range images instead of raw images results in 0.5% and 0.7% improvements on the F-measure values on the test data set, respectively. It is demonstrated that image pre-processing can improve the network performance on DCNN-based roadway crack classification by a noticeable margin. Nevertheless, considering such an improvement is achieved through an additional image pre-processing procedure which may require a certain level of expertise, it is still preferable to directly use the raw range image for real-world applications;
It is clearly demonstrated in Figure 10 that using fused raw image data yields the highest values in all four metrics. For example, by comparing the subcases between No. 2 (using raw range image) and No. 4 (using fused raw image), around 1.2% improvement on the F-measure value on the test data set are observed. Meanwhile, it can be concluded that using fused raw image leads to a more significant improvement on the classification performance than using filtered range images, where the F-measure value on the test data set in No. 4 (using fused raw image) is 0.7% higher than that in No. 3 (using filtered range images). Unlike the image pre-processing procedure, the heterogeneous image fusion process is a more intuitive and straightforward approach to process the original raw image data, which only requires acquisition of image range and intensity data. Therefore, heterogeneous image fusion can be a more practical approach to improve the performance of a DCNN model under real-world scenarios;
The proposed DCNN architecture yields similar or better performance in all the metrics comparing to the benchmark. Furthermore, the above observations on the effects of utilizing the raw intensity, raw range, and filtered range image data are mostly consistent between the proposed and benchmark DCNNs. It is noted that the benchmark DCNN shows a lower Precision value when using the filtered range image than the raw range image (see Figure 10(b)), which is different than the proposed DCNN.
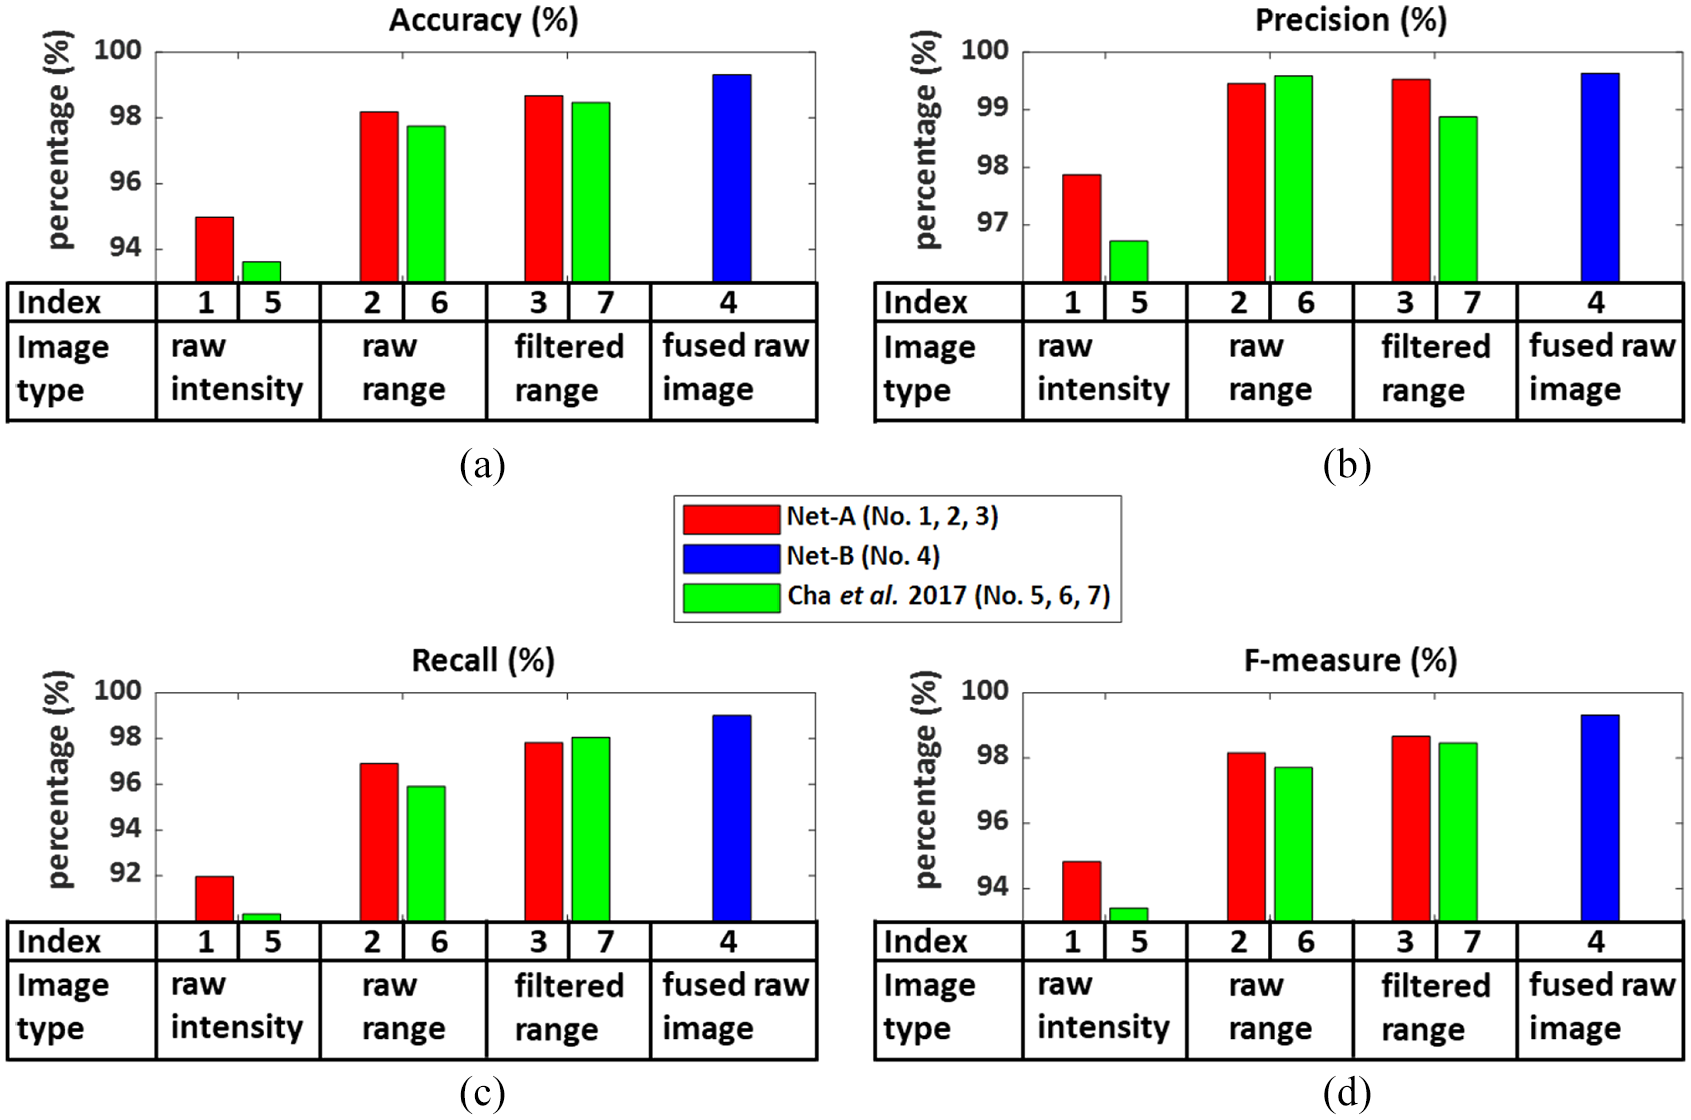
Case I—performance metrics on the test data set: (a) Accuracy, (b) Precision, (c) Recall, and (d) F-measure.
Detailed statistics on the performance metrics.
Regarding the efficiency, Figure 11 illustrates the training time and testing time for the subcases in Case I. The horizontal axis in this figure is the same as specified in Figure 10; the vertical axis refers to the training time and testing time for Figure 11(a) and (b), respectively. It can be observed that, for the proposed DCNNs, using raw intensity, raw range, and filtered range images results in a very similar time consumption, but they are all more efficient than the subcases with fused raw images. The benchmark DCNN requires similar amount of time as the proposed one. In comparison, the training time and testing time are increased by around 30% and 50% from Net-A (Nos. 1–3) to Net-B (No. 4). This phenomenon may be caused by the increase in the volume of the input image data due to heterogeneous image fusion.
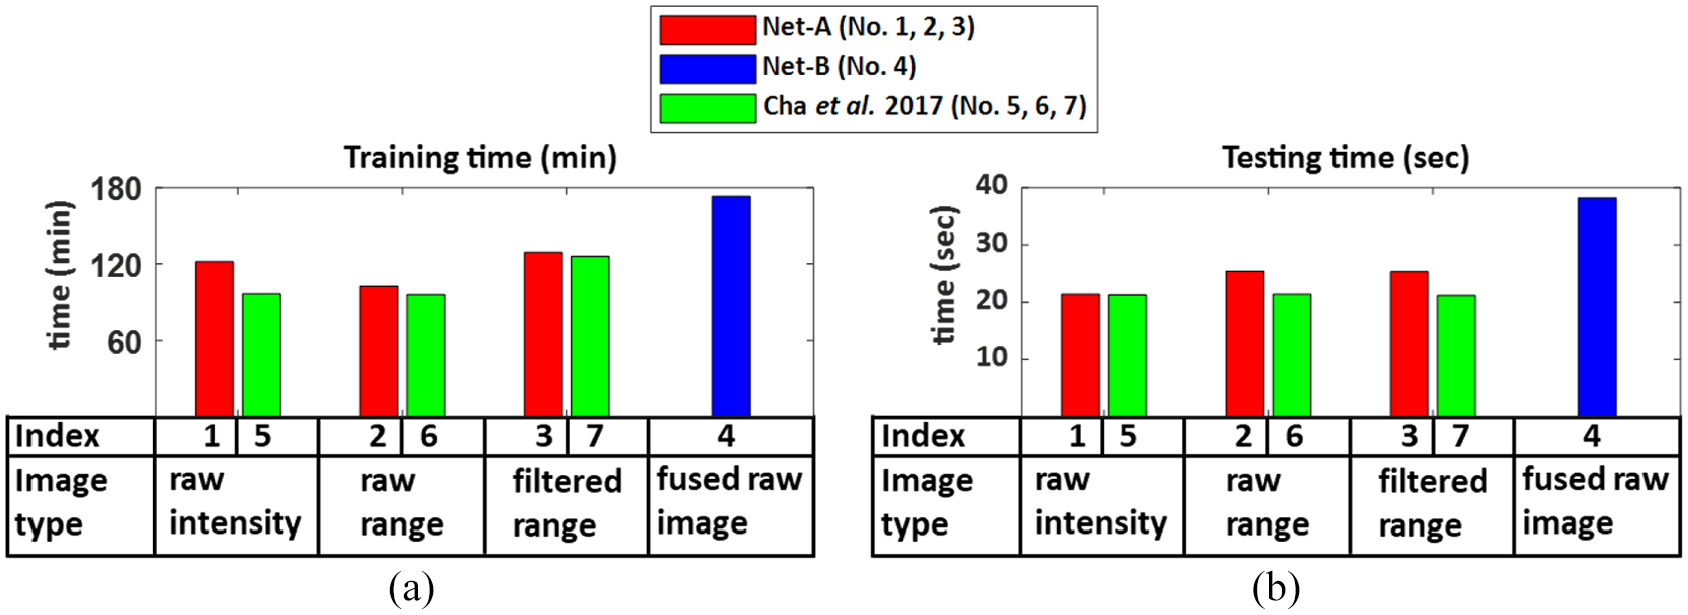
Case I—performance metrics: (a) training time and (b) testing time.
To further demonstrate the impact from different image data sets on the network performance, some prediction results are illustrated in Figures 12 and 13, respectively. Figure 12 demonstrates some false-negative samples predicted by Net-A which is trained and tested on the raw intensity image data set (No. 1 in Table 5). The false negatives shown in Figure 12 suffer from low contrasts between cracks and non-crack regions and contaminations such as lane markings. On the contrary, the cracks are very distinguishable in the corresponding range images because of the elevation change. By utilizing the range image data set, the same DCNN architecture (No. 2) can correctly detect and classify these image samples previously misidentified when using intensity images (No. 1).
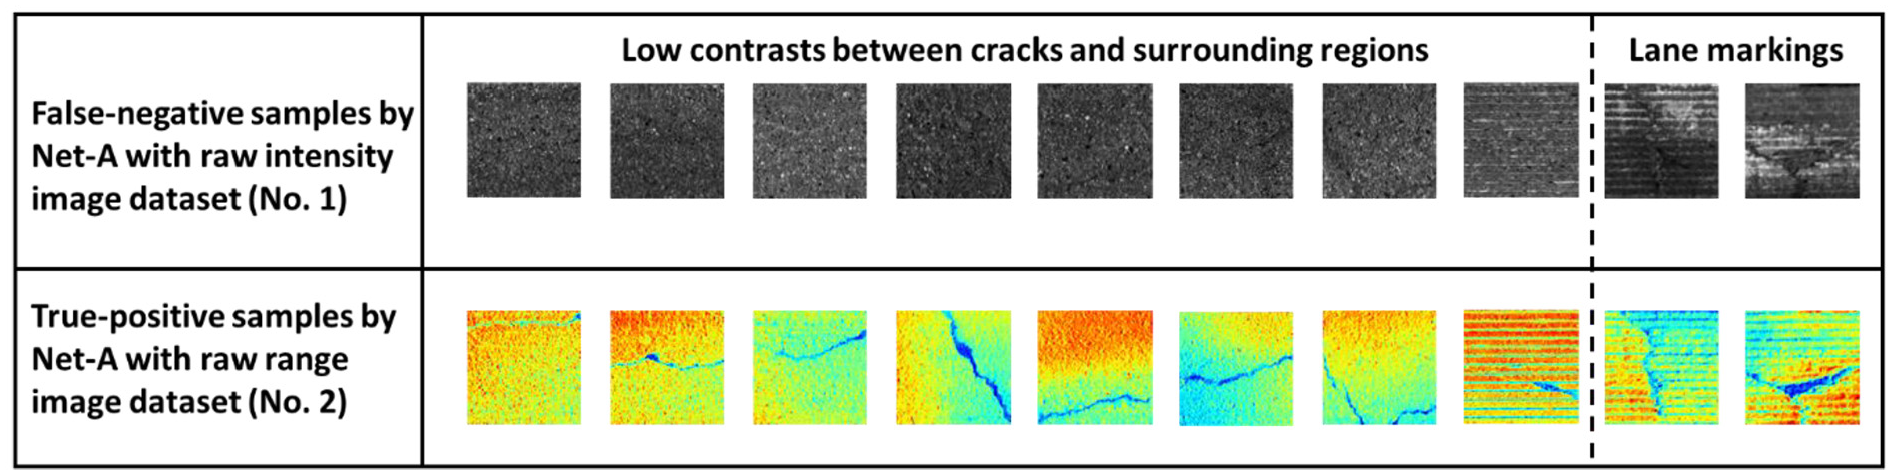
Case I: crack samples misidentified by Net-A with raw intensity image data set (No. 1) but correctly identified by Net-A with raw range image data set (No. 2).
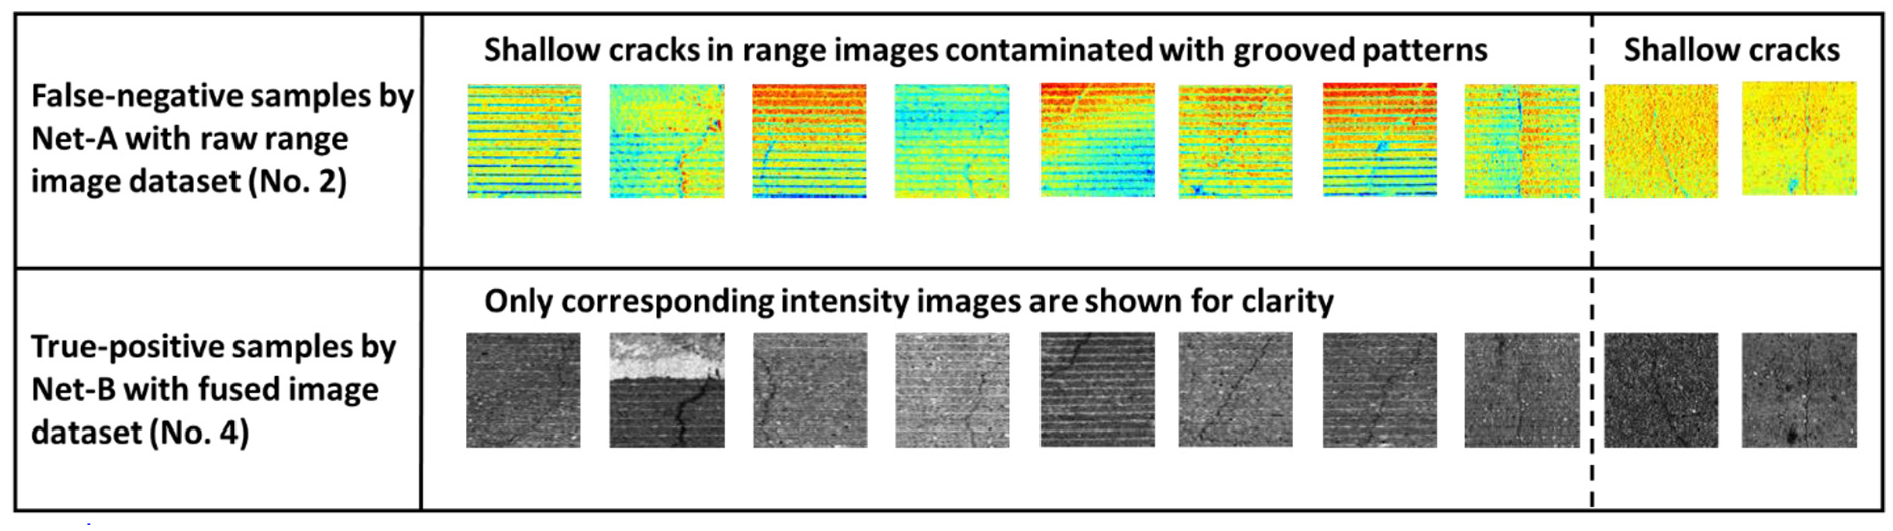
Case I: crack samples misidentified by Net-A with raw range image data set (No. 2) but correctly identified by Net-B with fused raw image data set (No. 4).
Meanwhile, some false-negative samples predicted by Net-A with the raw range image data set (No. 2) are illustrated in Figure 13. As can be observed from this figure, most false-negative samples contain shallow cracks which are further contaminated with grooved patterns. Such shallow cracks, however, are correctly identified by Net-B with the fused raw image data set (No. 4) by integrating the information from the corresponding intensity images. It is thus demonstrated that by exploiting the spatial co-location feature of cracks offered by heterogeneous data fusion of range and intensity images, the classification performance can be effectively improved.
Furthermore, in Case I, an example of crack detection on a concrete roadway image (denoted as “Surface 1”) is illustrated in Figure 14 to demonstrate the effects of different types of image data on DCNN performance. In Figure 14(a) to (c), the raw intensity, raw range, and filtered range images of Surface 1 are displayed; the fused raw image data are generated by combining Figure 14(a) and (b) and is not shown here. Surface 1 contains two major cracks propagating along the transverse direction of the roadway and many non-crack patterns (surface variations and grooves). As can be observed in Figure 14(a), some cracked regions in the raw intensity image have the issue of low intensity contrast between the cracks and surroundings; similarly, in Figure 14(b), shallow cracks exist in a few regions in the raw range image.
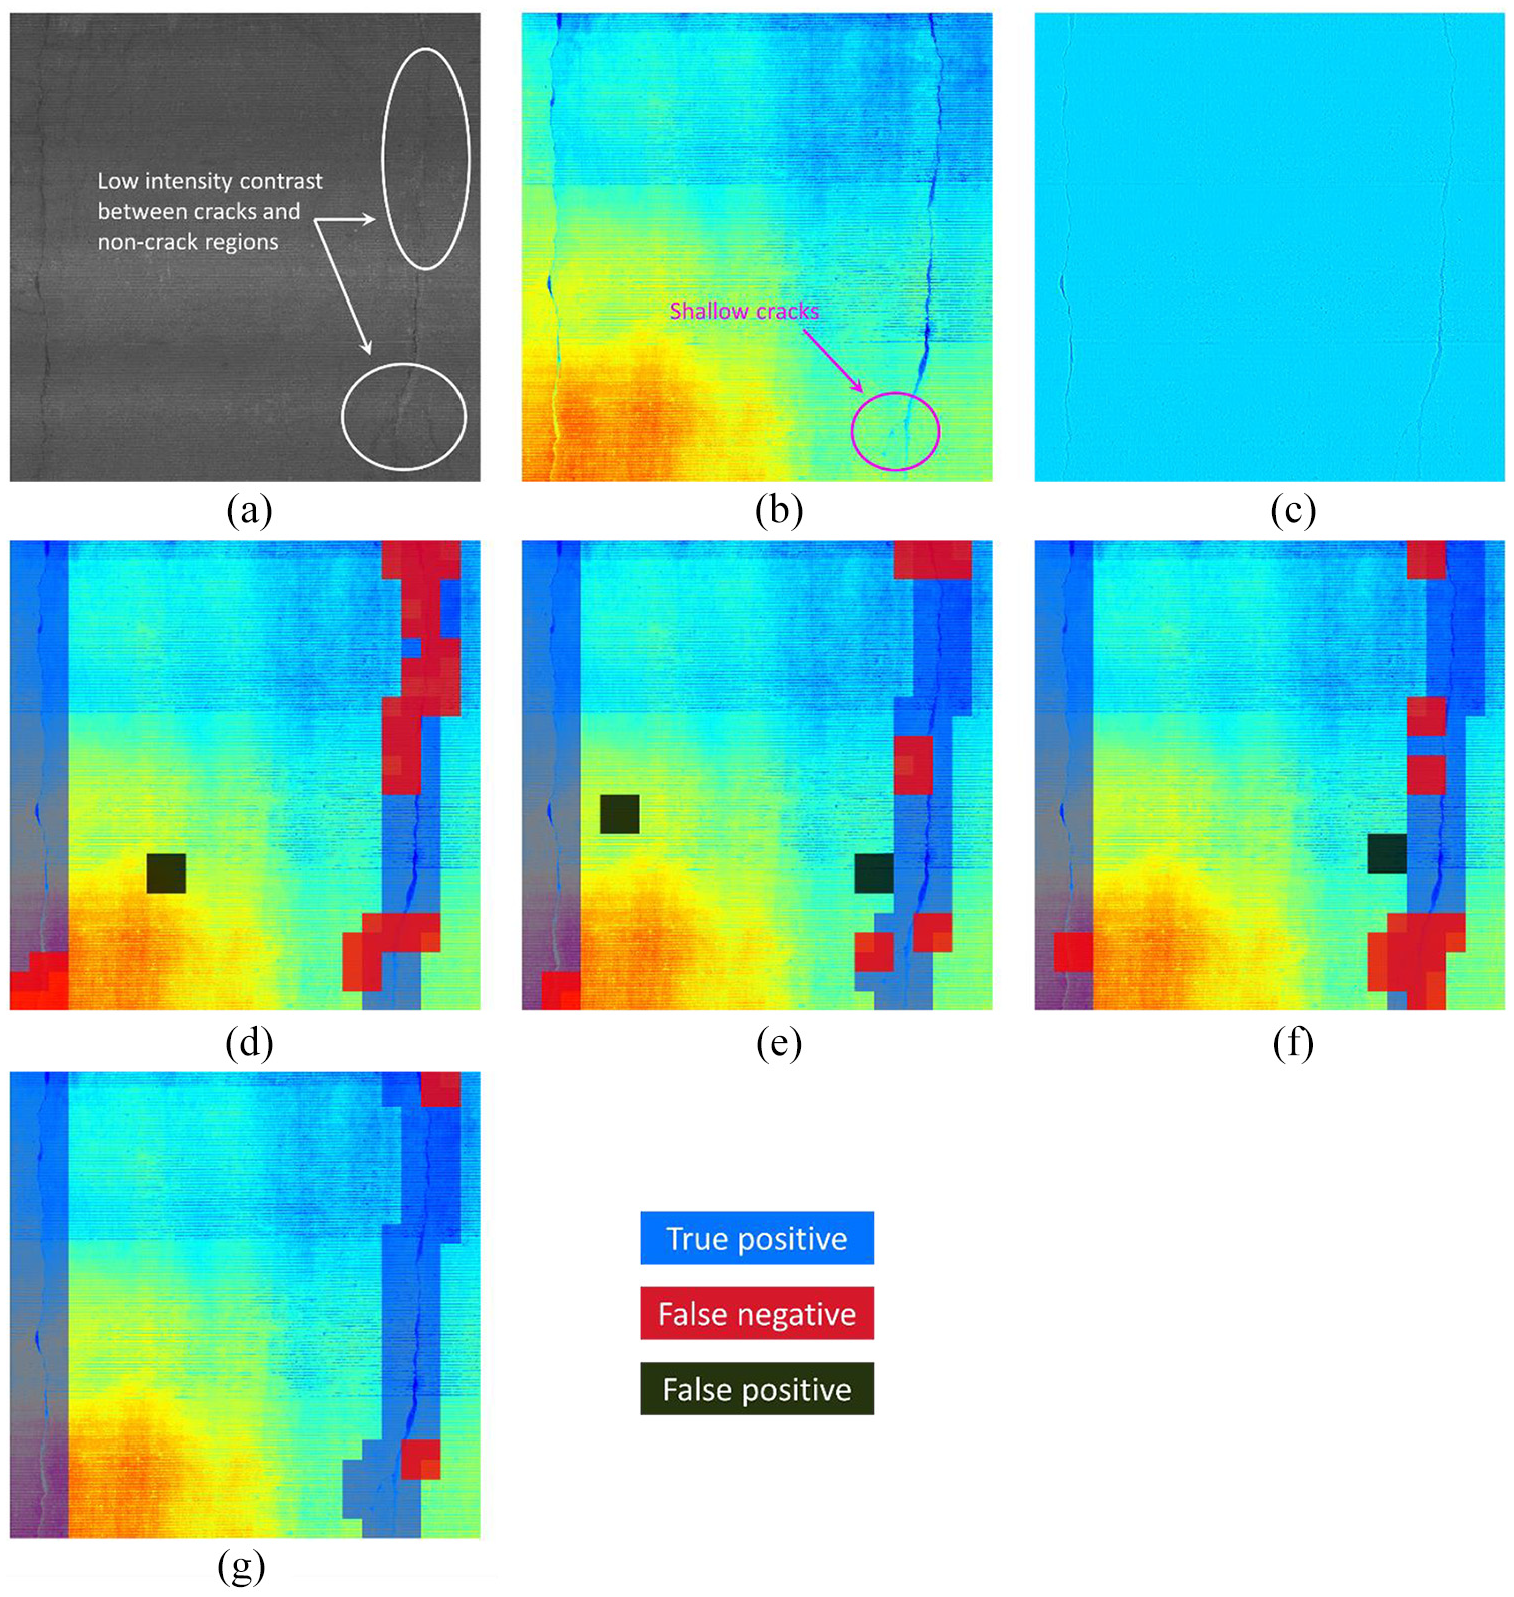
Case I—crack detection on Surface 1: (a) raw intensity image, (b) raw range image, (c) filtered range image, (d) crack map detected from raw intensity image, (e) crack map detected from raw range image, (f) crack map detected from filtered range image, and (g) crack map detected from fused raw image.
The crack maps based on the raw intensity, raw range, and filtered range images are generated by the trained Net-A (Nos. 1, 2, and 3 in Table 5, respectively), and the crack map based on the fused raw image is generated by the trained Net-B (No. 4 in Table 5). Net-A and Net-B are quite similar in terms of their layouts, only except that their input layer and the first convolutional layer are different. Thus, the major impact factor on the detection performance is the different types of image data used for DCNN analysis. Figure 14(d) to (g) illustrates the crack maps detected from the raw intensity, raw range, filtered range, and fused raw image data, respectively, where the blue, red, and black patches indicate true-positive, false-negative, and false-positive detections, respectively. It is noted that the crack maps are all overlaid with the same raw range image for cross comparison. The detailed Precision–Recall statistics are tabulated in Table 6, where numbers in bold indicate the highest values.
Precision–Recall statistics of crack detection on Surface 1.
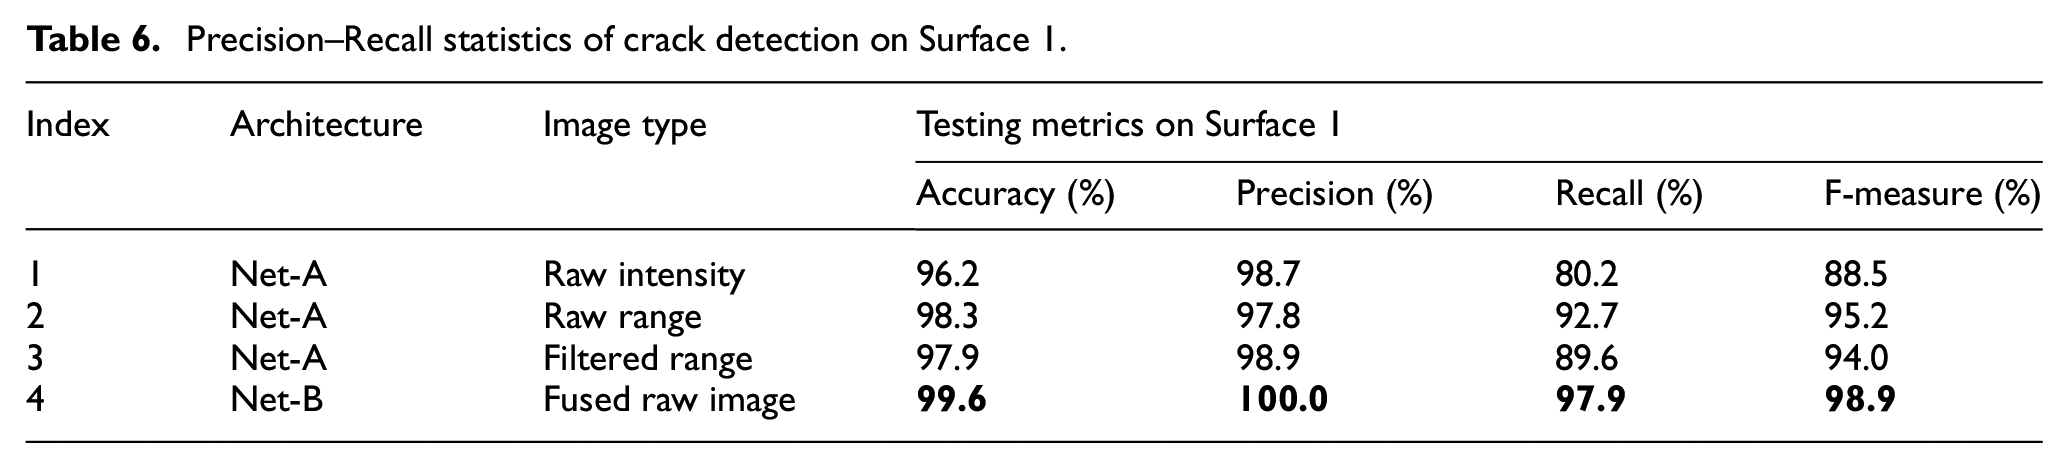
It can be seen from Figure 14(d) to (g) and Table 6 that the crack detection result based on the raw intensity image yields the worst performance (e.g. F-measure = 88.5%), including many false-negative detections due to the low-contrast issue. Using raw range or filtered range image, the corresponding F-measure values are increased to 95.2% and 94.0%, respectively. Meanwhile, comparison between the detection results using raw range image versus filtered range image suggests that applying image pre-processing on the raw range image of Surface 1 does not yield higher classification performance in this example. Instead, using the strategy proposed in this study to fuse the raw intensity and raw range image, the F-measure values on Surface 1 are effectively increased by 10.4% (using raw intensity vs fused raw image) and 3.7% (using raw range vs fused raw image). As can be observed by comparing the differences between Figure 14(g) and Figure 14(d) to (f), the use of fused raw image data for analysis helps to eliminate many false-negative and false-positive detections by cross-domain feature correlation and thus leads to the highest classification performance (bold values in Table 6). Through this example, it is again demonstrated that the proposed data fusion strategy can effectively improve the DCNN performance on roadway crack detection.
Case II: comparison on network performance by different architectures with data fusion
Through Case I, it is evident that using fused raw image data can achieve the highest classification performance. Subsequently, Case II is performed to investigate the better DCNN configuration to exploit the fused raw image data. As described in section “Net-B and Net-C: DCNN architectures for dual-channel image input,” two architectures, Net-B and Net-C, are designed to take fused raw image data for training and testing. The major difference is that Net-B represents a “fuse-extract” pattern, while Net-C represents a “extract-fuse” pattern. Case II consists of two subcases (Nos. 4 and 8 in Table 5). The subcases Nos. 4 and 8 correspond to Net-B and Net-C trained and tested on the fused raw image data, respectively.
The corresponding performance metrics on the test data set are illustrated in Figure 15. Four metrics including Accuracy, Precision, Recall, and F-measure are plotted in Figure 15(a). In this plot, the horizontal axis refers to the subcase indexes, which are further grouped according to the performance metrics. It can be seen from Figure 15(a) that Net-B results in higher values in all four metrics by an average margin of around 0.5%; especially, the Recall of Net-B is 0.7% higher than that of Net-C, indicating a lower false-negative rate.
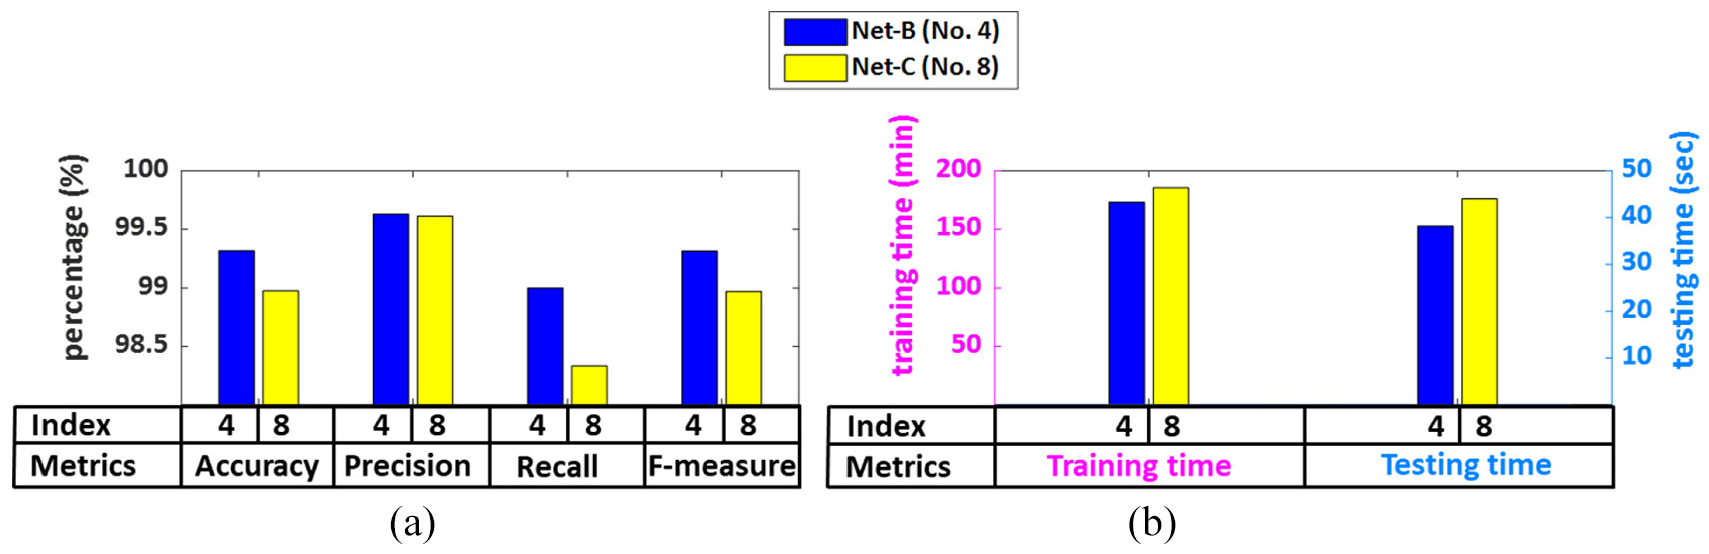
Case II—performance metrics: (a) classification metrics on the test data set and (b) training and testing efficiency.
Regarding the network efficiency, Figure 15(b) shows the corresponding training time and testing time for both subcases. The horizontal axis of Figure 15(b) is the subcase indexes grouped by the training time and testing time. Net-B demonstrates a higher efficiency than Net-C in training and testing by effectively reducing the time consumption by 7% and 14%, respectively.
Through the above comparison, it can be concluded that Net-B is more accurate and efficient than Net-C on roadway crack classification with data fusion. The “fuse-extract” scheme adopted by Net-B is superior to the “extract-fuse” scheme in Net-C in the sense that it leads to more improvements on the network performance.
Conclusion
This study proposes novel DCNN-based roadway crack classification methods and investigates their performance from the perspective of heterogeneous image data. It is focused on three objectives: (1) demonstrating the impacts of image pre-processing, and offering suggestions regarding the use of image pre-processing in practical situations; (2) proposing a heterogeneous image fusion approach based on hyperspectral imaging to integrate the information in the raw intensity and range image data and investigating the effects of heterogeneous image data by considering four types of image data: the raw intensity, raw range, filtered range, and fused raw image data; and (3) proposing DCNN architectures, which represent different means to exploit the fused image data, and determining the layout to yield better classification performance with data fusion.
In this study, an experimental study is carried out to train and test the proposed roadway crack classification DCNNs. The experimental study consists of two cases as follows:
Case I investigates the effect of heterogeneous image data on DCNN performance. A deep architecture which takes single-channel input, denoted as Net-A, is designed to process the raw intensity, raw range, and filtered range data; Net-B is modified from Net-A to process the fused raw image data. Besides, a benchmark architecture is evaluated using the same image data for comparison purposes. In total, seven subcases are performed in Case I. Performance metrics including Accuracy, Precision, Recall, and F-measure are calculated to measure the classification performance. It is clearly observed that architectures trained and tested on raw intensity image result in the worst classification performance due to low-contrast issue, and using raw range image instead of intensity image yields a significant amount of improvement on the overall classification performance; Through the comparison between the subcases using raw range image versus filtered range image, it is shown that image pre-processing on the range image improves the performance by a noticeable margin; but considering the trade-off from the additional pre-processing procedure, it is still preferable to directly use the raw range image for analysis, especially under real-world scenarios; The use of fused raw image data yields the highest classification performance because this approach takes advantage of the spatial co-location feature generated from the fusion process.
It can be concluded from Case I that heterogeneous image fusion is a better alternative to image pre-processing, as an effective strategy to address the issues in range images or intensity images by cross-domain feature extraction. Through Case I, the first two objectives of this study are fulfilled.
2. Case II further discusses the better configuration to exploit the fused raw image data. Another deep architecture that also takes dual-channel image input is proposed in this study, denoted as Net-C. The major difference between Net-B and Net-C is that the former employs a “fuse-extract” pattern to directly extract the information from the fused raw image input, while the latter represents a “extract-fuse” pattern to first extract information from separate channels and then combine the high-level information. Performance metrics demonstrate that the “fuse-extract” scheme is more effective and efficient. Through Case II, the third objective of this study is fulfilled.
Despite the high classification performance of the proposed methodology based on heterogeneous image fusion, a few limitations are yet to be addressed. First, this study does not cover damage/health rating applications using the information obtained from crack detection, because such applications depend on the specific guidelines and agencies’ requirements which are beyond the scope of this study. The proposed methodology may have difficulties detecting cracks on surface regions which suffer from both low intensity contrast in the intensity image and shallow depth in the range image, as shown in Figure 14(g). The proposed DCNN methodology is a patch-based approach; that is, the DCNN classifier detects cracks by image patches rather than by pixels, which limits the detection resolution. Future research effort needs to be devoted to pixel-level crack classification with heterogeneous image fusion. In addition, the detection of pavement joint and its distinction from cracks are not discussed in this study, which will also be addressed in the future work.
Footnotes
Declaration of conflicting interests
The author(s) declared no potential conflicts of interest with respect to the research, authorship, and/or publication of this article.
Funding
This research was supported by the Alabama Department of Transportation (Project Number 930-930, Grant Number: 25663) and Alabama Transportation Institute (Grant Number: 14560).
