
Abstract
We present a novel approach to evaluating mechanical features of structures using correlation coefficients and fast Fourier transform analysis. Although correlation coefficient is always a sensitive parameter to changes of mechanical properties of real structures, it is rarely used due to high complication in data collection. To overcome this drawback, we propose fast Fourier transform analysis to increase the sensitivity of correlation coefficient, simplify calculation, and retain information from the original signal. Numerical results show that the present method not only detects relation between changes in structure with progression of defects but also locates their position. An fast Fourier transform–based correlation coefficient approach provides evaluations in both real bridge structures and experimental models. This study can serve as reference for analyzing, evaluating, and identifying working status of real structures.
Keywords
Introduction
At present, there are many parameters in assessing operation of a structure via real vibration. The most important and common is natural frequency value and relevant properties such as natural shape, vector, function, and vibration mode. In some typical researches,1–5 the authors often adopted modeling on beam structure. To degrade bearing capacity, damages on beams were made with cracks.6–10 The results deprived from those researches have brought forward answers to how to detect and forecast damages. Most of those researches modeled bearing capacity using analytic formula and thereby assessed relation between changes in the structure’s bearing capacity with the damage growth.11–15 However, the above researches have had no specific application in the reality; or in other words, they are absolutely impractical. Some researches by Liu and Nguyen16–21 also revealed that value of the natural frequency is barely sensitive to changes in the structure. Nevertheless, lack of new parameters in assessment caused these researches to be in a rut and impractical. Thus, the aforementioned parameters failed to fully address issues in detection. A new idea is to evaluate the decrease of a structure’s hardness via fatigue which is the main cause of changes in the material’s mechanical properties. These properties are all modeled by fatigue. There have been many outstanding researches,22–29 in which those of Bhatti and Wahab30,31 always changed parameters in assessing deterioration of fatigue bearing structures. These researches exploited different properties of structures under impact of (cyclic or non-cyclic) forces to determine the relation between assessment parameters with deterioration. Studies were conducted in various forms of structures such as beam, plate, frame, composite material, and few-layer materials. Despite some excellent success, these researches are not quite applicable in reality,32–35 which is similar to those conducted on beam’s damages. Main reason could be this phenomenon in reality is much more complicated than what happens in the experiment or computer simulation. Thus, application from current researches in assessing and forecasting damages to structures still exposes lots of limitations.
A number of new parameters have been introduced to supplement missing information for better detection. Among those, correlation coefficient is considered to be significantly effective. The outstanding research on this parameter was conducted by Koh and Dyke, 36 who studied damage detection methods on long-span, cable-stayed bridges using correlation and cross-correlation coefficients. The method was based on combination between correlation coefficient and estimation of damage-sensitive structural parameters. Thereby, this research observed that the relation between variations in the measured and analytically synthesized natural frequencies enables damage localization. From that, the sensitivity matrix using finite element method contained crucial information in multiple damage detection. At the same time, the above research could also locate the damages in the structure. The results show that using correlation analysis not only detects damages but also locates them in long span or cable-stayed bridges. However, there are still many limitations in the results such as failure to determine damage level in the structure as well as assess interaction between damage locations. In addition, the majority of the research was based on finite element method using digital simulation. Concurrently, the values of correlation and cross-correlation coefficients were determined via Fourier analysis, which meant a large amount of information was lost via intermediate analysis.
With similar arguments, according to Yang et al., 37 damages to the structure were detected by the cross-correlation function amplitude vector (CorV). This research shows that under pressure of a random force, CorV only depends on the matrix function satisfying structural frequency. The authors also assumed that the standardized CorV had a specific shape and remained stable throughout the study period. Thus, damages could be detected and located by correlation analysis. In addition, relative changes between CorVs of intact and damaged structures were compared. The research team also used the cross-correlation function amplitude vector assurance criterion (CVAC) to quantify changes of CorVs relating to severity of damages. However, the main shortcoming of this research is that it was only conducted on simulated models without application in actual structures. Given recent development of computer technology, the research team, according to Farid, 38 proposed the method for updating finite element model to detect damages in physical pattern of the structure using frequency correlation conversion. Damage cumulative function was formed by the remaining of correlation function’s gradient in frequency domain. Some optimization techniques39–41 were useful to solve relevant issues such as improvement of correlation function, that is., addressing interference, enriching information, and eliminating deviating elements. Results of simulated experiment demonstrated effectiveness when they applied optimization algorithm to correlation function. Mathematical analyses and algorithms have highlighted specifics and parameters deprived from correlation function. Therefore, this method can be applied to detect structural damages in finite element model. The model also allowed monitoring health of giant mechanical structures. However, this research is only a proposal which has not been applied in any practical model. To summarize, the above research highlights certain weaknesses—such as how the sensitivity of correlation coefficients (in cross-correlation as well as correlation functions) is not significant enough for evaluating and predicting the existence of defects in structures. Most of the aforementioned researches are only able to evaluate changes in the mechanical properties of the structure after it has reached a certain stage; however, such defects could be alarmingly dangerous during operation. This limits the application of said researches—as they do not move on from simulation to real-life structures, they are unable to evaluate and identify changes in mechanical properties effectively. Furthermore, auxiliary algorithms from previous research, such as Fourier analysis, cumulative function, or autocorrelation functions, are not objective due to noise and error. Some data that could have been essential to evaluate changes in the structure are also missing.
Our research also relies on correlation analysis and cross-correlation in order to provide information about the mechanical properties of the structure. However, the research aims to approach the evaluative problem in a different manner from previous studies,’ improving earlier shortcomings by increasing the sensitivity of the correlation coefficient and by applying it to real structural models. To meet this objective, this article proposes an evaluative model for changes in the structure’s mechanical properties with correlation coefficients, combined with fast Fourier transform (FFT) analysis. From the original signal of vibration state in the structure, the correlation coefficient determined through FFT analysis provides more benefits compared to what found by other analytical methods: the coefficient’s sensitivity in this research is greatly heightened and able to locate existence of small defects from early stages. Furthermore, the results from this research show that the correlation coefficient can determine the location of defects in the structure. The data from this research were obtained from the experimental model on beam structures at Applied Mechanics Laboratory, the Ho Chi Minh University of Technology. 42 The observations proposed by this research have been also applied in actual testings on many different bridges.
Theoretical rationale
In this research, we established a relation between mathematical correlation coefficient and structural changes. Assessment parameters were derived from vibration signals of both experimental beam in the lab and different bridges in reality. At the same time, we have proposed a combination between FFT analysis with the application of correlation coefficient as a new parameter in assessing structural deterioration along time. This is the core basis for conducting studies on different structures in reality.
A new experimental model using correlation coefficient and FFT
A study was conducted at a random stopping state at n different positions. To simplify the model, we put these n positions at the same distance. The main concept used in this research is that of similarity between two signals varying with time t, xk(t) and xl(t). This degree of similarity is evaluated using the correlation coefficient:

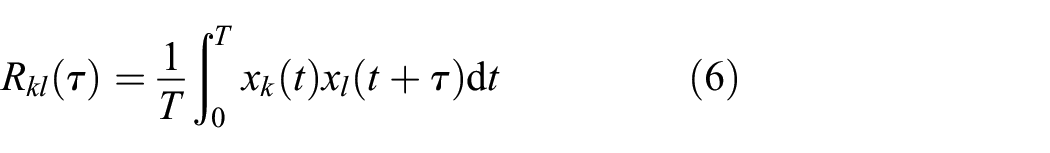
Expanding on (1), the time between evaluating xk and xl can be offset by some value τ. Given a limited interval of surveying T, we have

From (2), we can note that Rkl generally varies with τ; meaning Rkl = Rkl(τ). This is referred to as the correlation function. The absolute maximum value of Rkl in the surveying duration T is then referred to as the correlation coefficient, denoted rkl:

This research studies the variation of the correlation coefficient at different k and l positions.
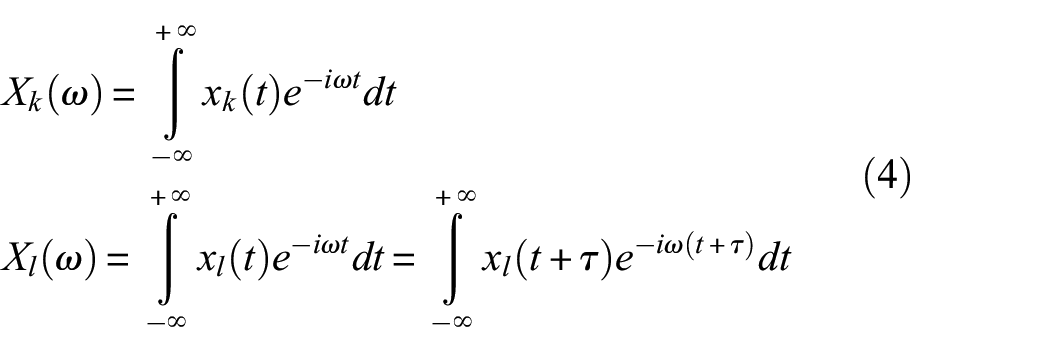
In reality, it is difficult to study the correlative value of original signal at two different positions. Not only should the sampling frequency at these positions be the same, but the number of samples/files and time of sampling also must be the same. In other words, the sensor at measuring position should be adjusted to receive signals concurrently. To overcome the aforementioned complications, a new method is proposed - the FFT of the signal x(t) is applied instead to calculate the correlation coefficient. The FFT of xk(t) and xl(t+T) are evaluated as per equation (4):
On the contrary, xk(t) and xl(t) can be determined via opposite FFT variation
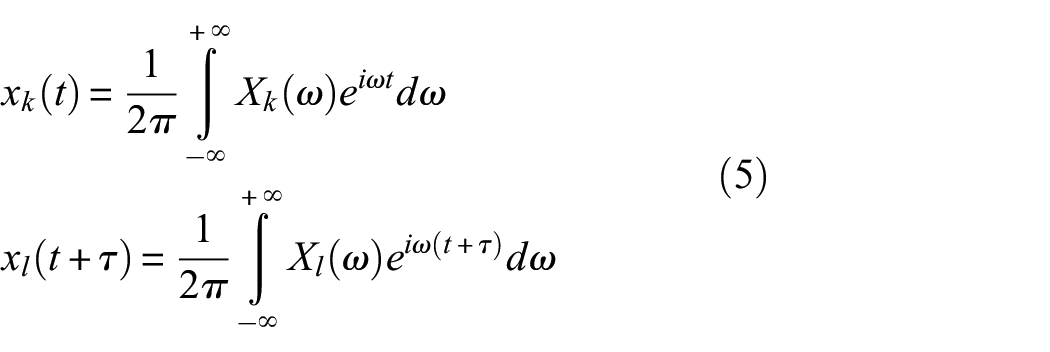
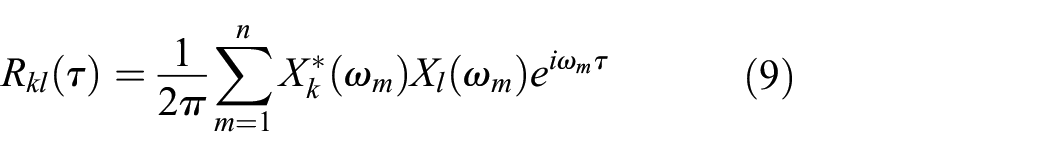
Instead of calculating Rkl(τ) from the source signals (signals obtained directly from measurement), the FFTs can be used to derive the former as follows: Applying (5) to (2) gives

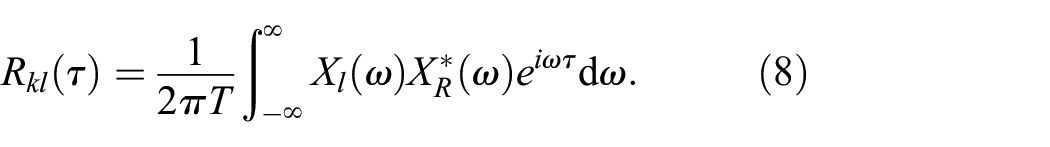
Equation (8) allows Rkl(τ) to be calculated from the FFT spectra of the signals obtained from positions k and l. When the signal is obtained as discrete numerical data, the FFT also returns discrete X(ω m ), where m=1: n. Then Rkl(τ) is calculated via (9):
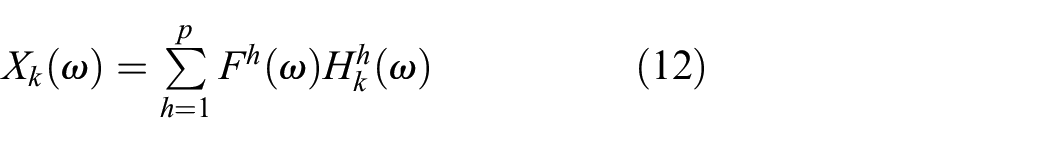
If the stimulus force function f(t) and its frequency response function Hk(ω) at each k are known, then Xk(ω) can be calculated by Equation (10):

where F(ω) is the FFT of f(t).
Accordingly, the conjugate function of

In case of multiple stimuli fh(t), h = 1: p, the superposition principle normally can be applied:
Note from Equation (3) that the correlation coefficient rkl would always be calculated only after the function Rkl(τ) (or its graph) is obtained.
The collection of values rkl for each stimulus condition demonstrates the correlation between vibration signals at the two positions k and l. Figures 17–21 show the variation of rkl between a predetermined position k and the remaining position l. For example, in Figure 17, the skyblue data points correspond to the coefficients r11, r12, r13, r14.
Damage detection based on correlation coefficient
Damage detection method in this research is to use correlation coefficients among different positions where measurement is made. Data at those positions are received continuously at the same measuring time and with the same number of samples. Signals are screened using FFT analysis to detect existence of unusual waves against others at the measuring positions. This method is summarized as follows
The principle to determine positions subject to incidents in a structure using correlation coefficient relies on difference among transmitted waves. In particular, the research assesses transmitted wave shape before and after damage, and at different positions at the same time under the same conditions.
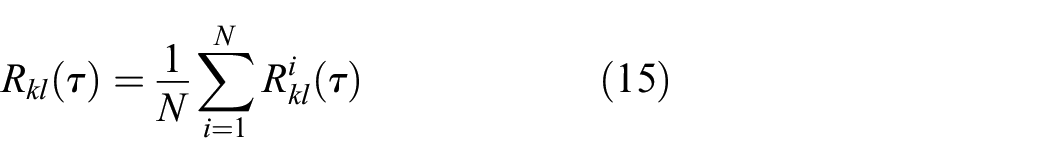
For each position k, the i-th collected signal at time t is denoted as xki(t). Similar to Equation (2), we then have
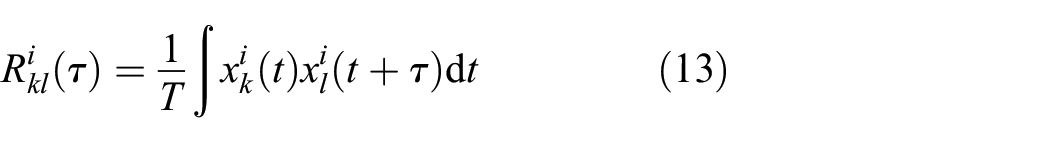
In addition to Equation (13),
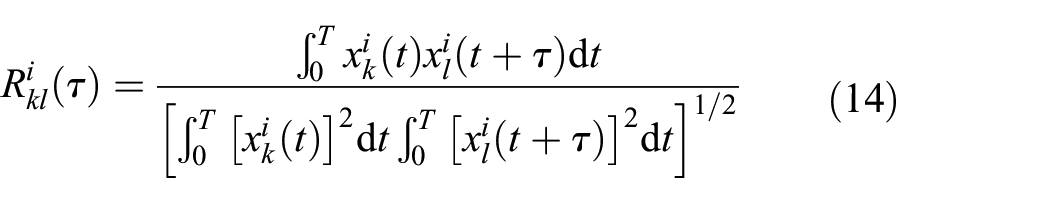
The correlation function is then the average value
The method proposed in this research detects the position and growth of damage by comparing the correlation coefficients rkl, as well as the graphs of said values at different positions l = 1, 2… under different damage conditions. The existence or growth of damage will lead to changes in the signal x(t), and therefore changes in the correlation coefficient. Differences in the correlation coefficient between pairs of positions (k, l), or at different times, can be used to notify the location and growth of damage.
Study distribution values by interquartile range
To assess distribution characteristics of correlation coefficient values, the next proposal uses interquartile range to describe distribution and dispersion of data folder. Interquartile range has three values namely first quartile, second quartile, and third quartile. These three values divide a data folder (in ascending order) into four parts which have even numbers of observations as shown in Figure 1. The combination between interquartile range with probability density function is demonstrated as in Figure 2. These values are presented as follows:
Q1(X) = (n + 1)th observation value/4
Q2(X) = (n + 1)th observation value/2 = median(X)
Q3(X) = 3(n + 1)th observation value/4
Interquartile range: IQR = Q3 – Q1
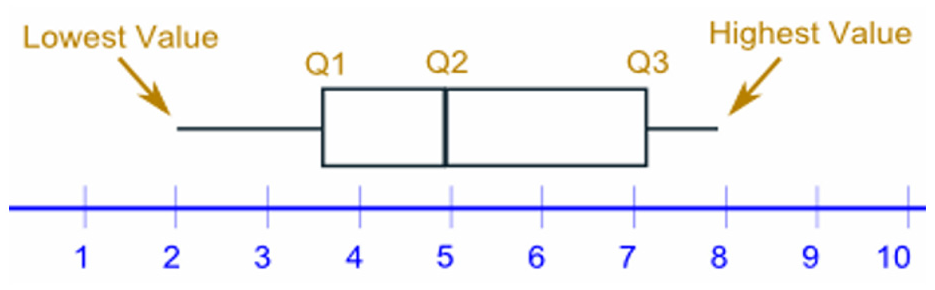
Interquartile range (IQR).
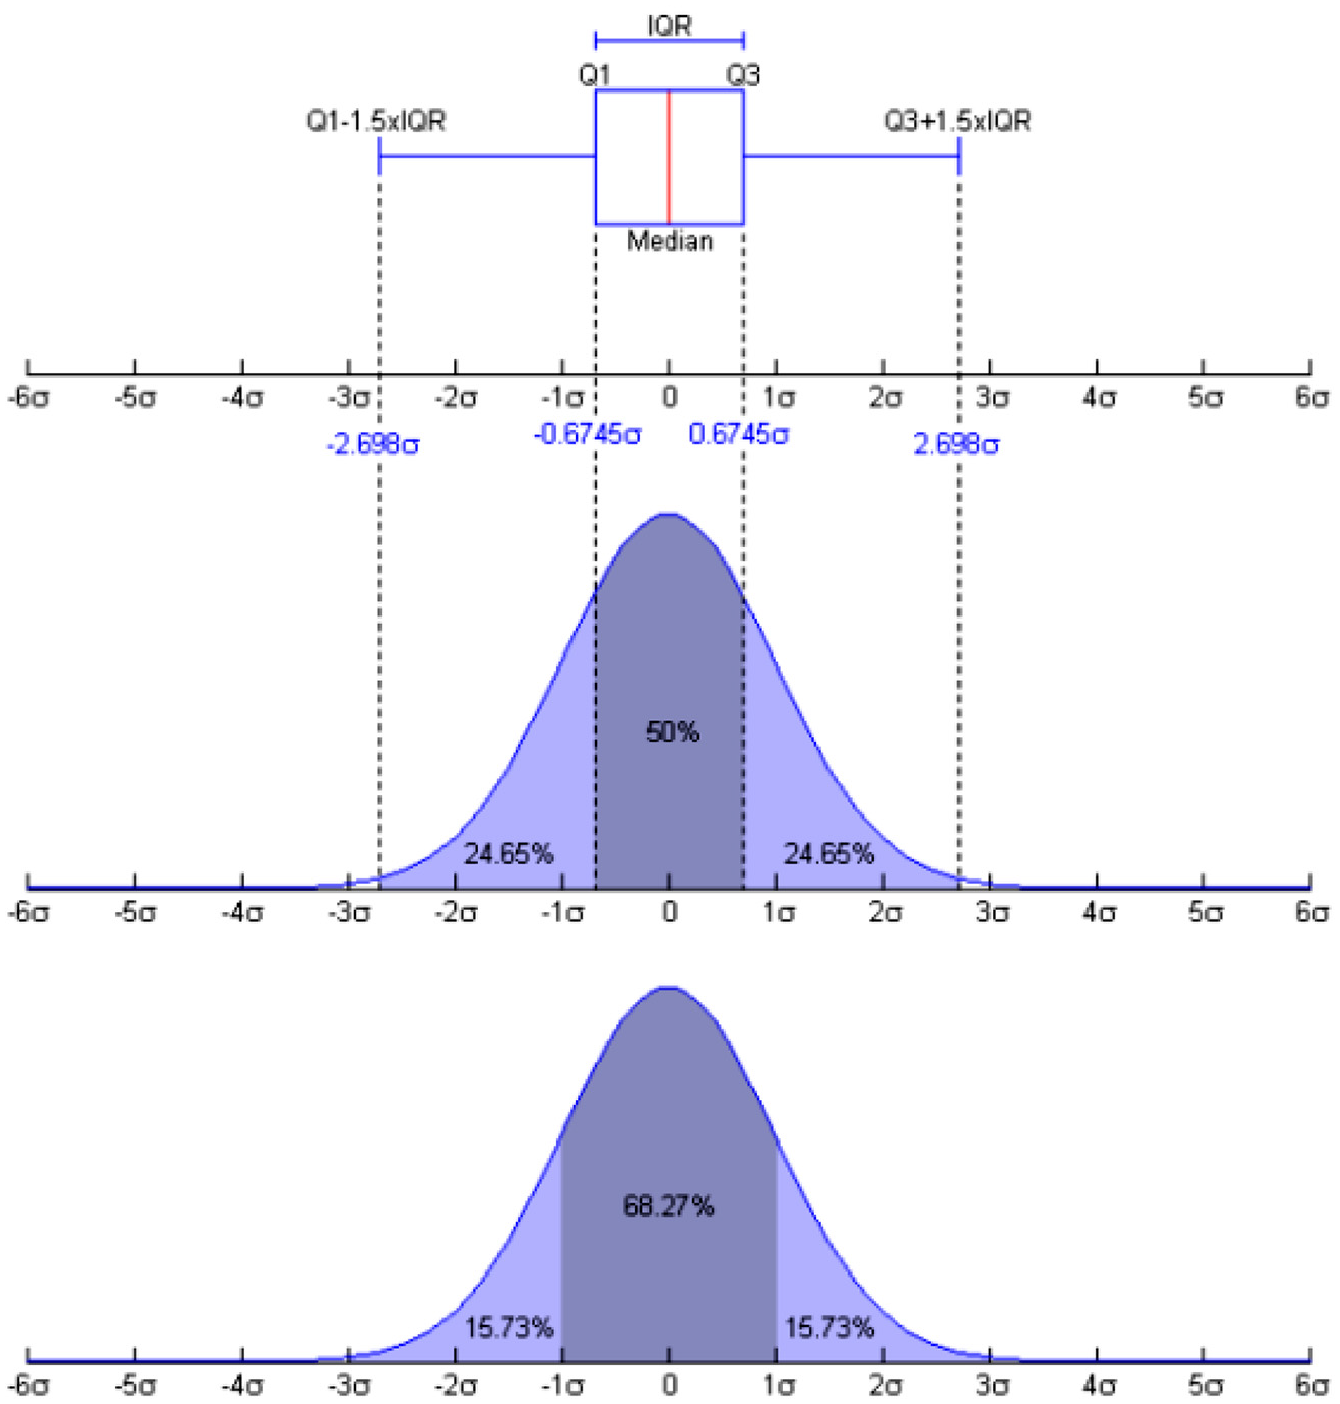
Probability density and boxplot graphic of Gaussian distribution.
When a distribution is nearly similar to normal distribution (or so-called Gaussian distribution), the following statistical method is proposed to study actual measured data:
Determine quartiles: LQ, Q1, Q2 (median(f)), Q3, HQ
IQR = Q3 − Q1
LQ = Q1 − 1,5. IQR
HQ = Q3 + 1,5. IQR
Draw boxplot graphic corresponding to studied data set to comment on distribution and dispersion (see Figure 3). We then calculate the mean value
Calculate deviation Δm between mean(f) and median(f)

Calculate the probability function
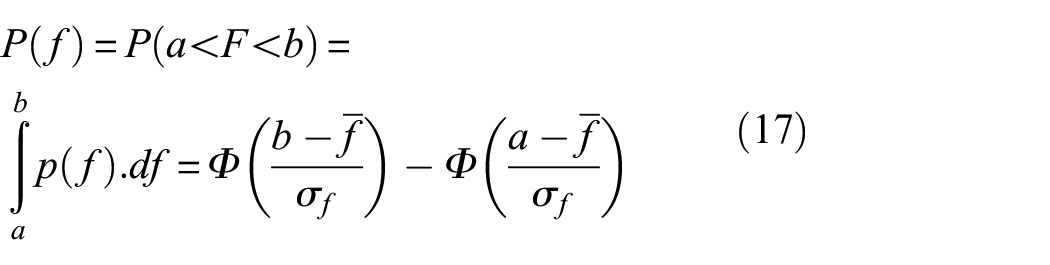
Check the value P(f) with significance α = 0.05. Repeat the above steps to deprive optimal results (normally 0.95 ≤ P(f) < 0.96). In the event where result is not satisfactory (P(f) < 0.95), go back to raw data screening step with more reasonable selection of Rf. Statistic process can be summarized in Figure 3.
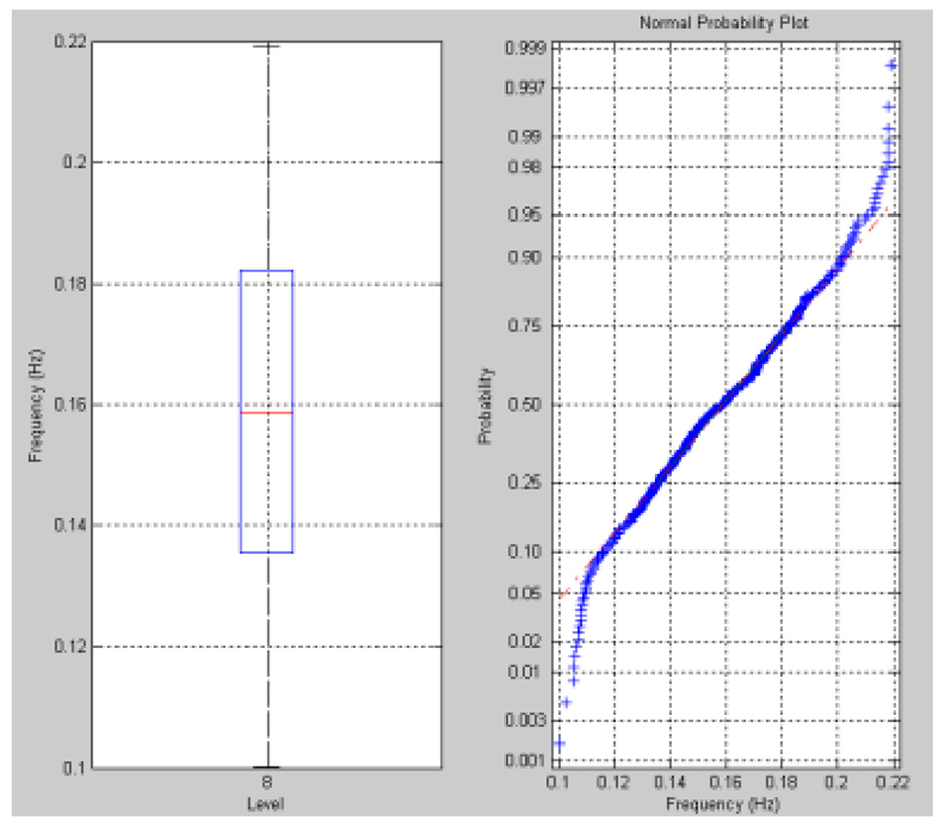
Statistical results showing distribution and dispersion of data.
Testing model
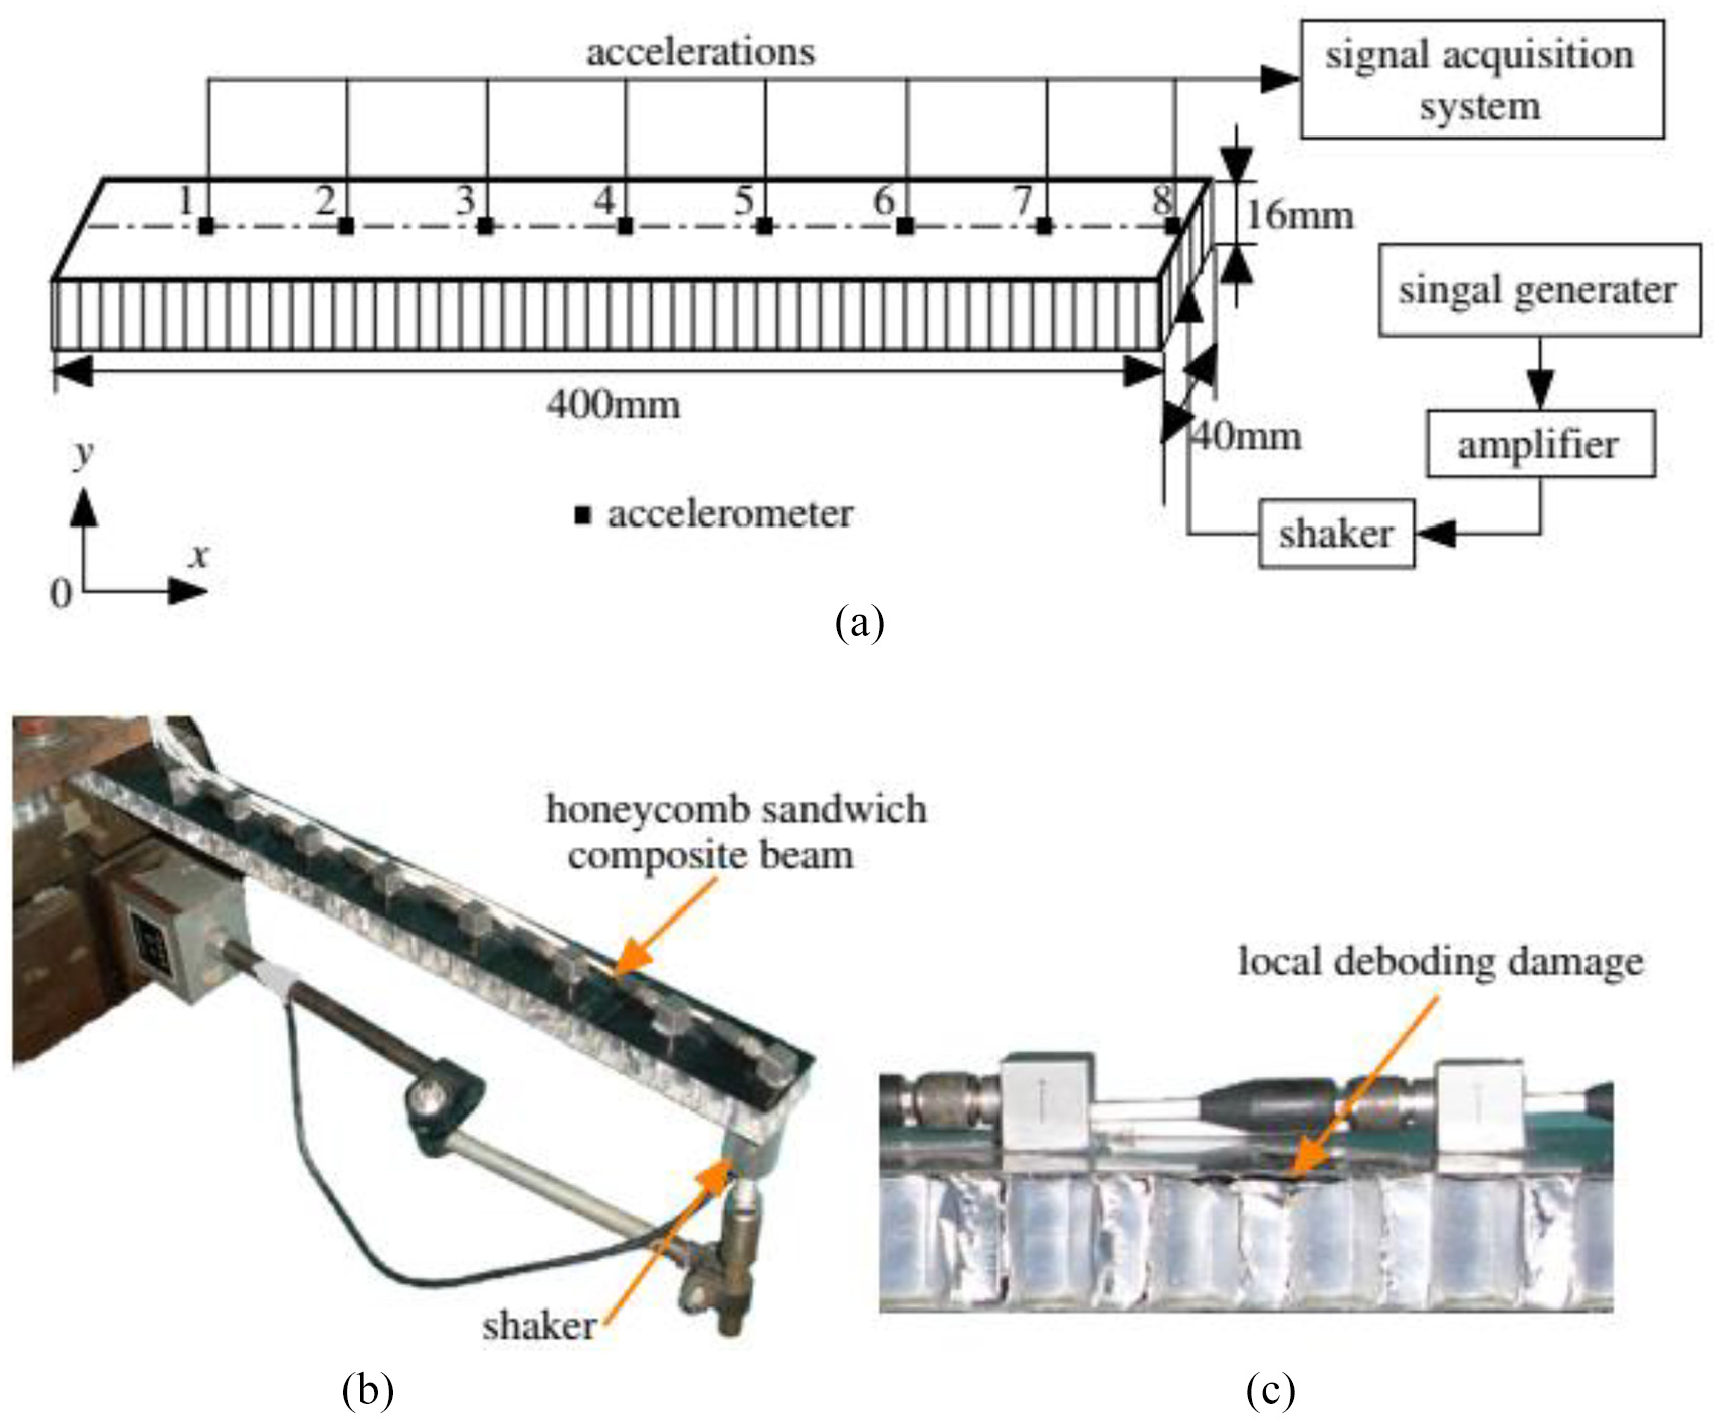
Experimental model
A new feature of the experimental model to assess structural changes is to use four channels to continuously study different beam damages via vibration signal. Via this experiment, correlation coefficient and correlation matrix are developed to assess change state as well as locate structural damages. For the experiment in this study, vibration was measured using KYOWA (Japan) acceleration sensor. The system integrated sensors, recorder box, and normalization coefficient for simultaneous measuring. Sensors operated at the same fixed time with the same frequency of sampling and number of samples among different measuring time. Output indicators revealed by the manufacturer are shown in Table 1.
Indicators of vibration measuring system using KYOWA accelerometer.
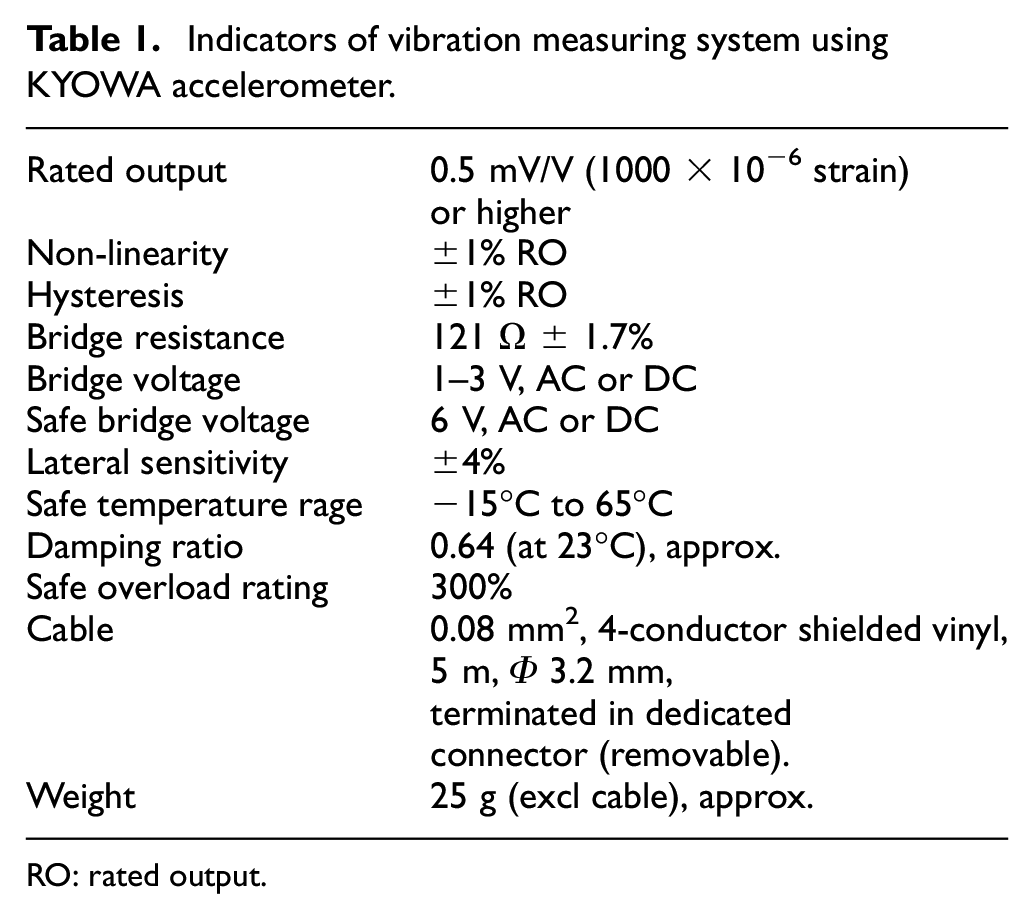
RO: rated output.
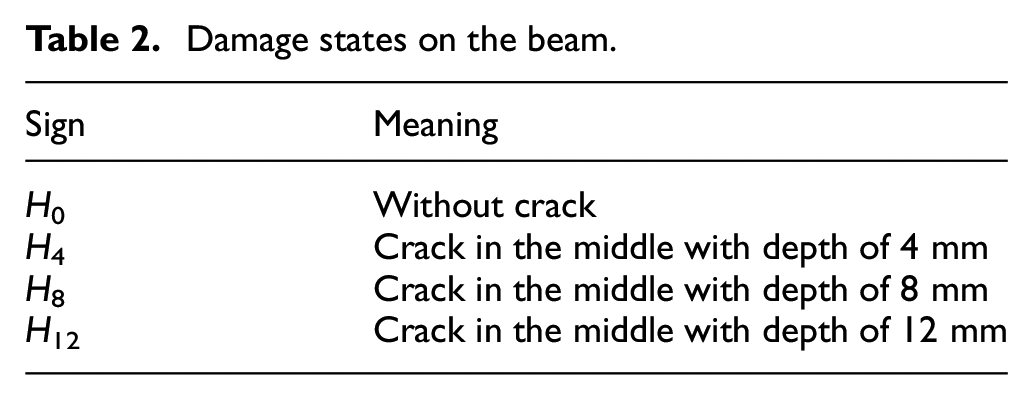
The structure in the experiment was usually in the form of beam. Beams were studied in different vibration modes corresponding to different types of damages (see Table 2) (damages were described by cracks with different section profiles). According to Figure 4(a), crack section profile is expanded following depth of beam. Figure 4(b) shows the crack expanded to two wings of the beam. To make it convenient to assess and determine relation between hardness possibility and growth rate of damage, we used accurate CNC cutting method to create all cracks. The overall model of experiment is depicted in Figure 5. The speed of model run on beam is presented in Table 3.
Damage states on the beam.
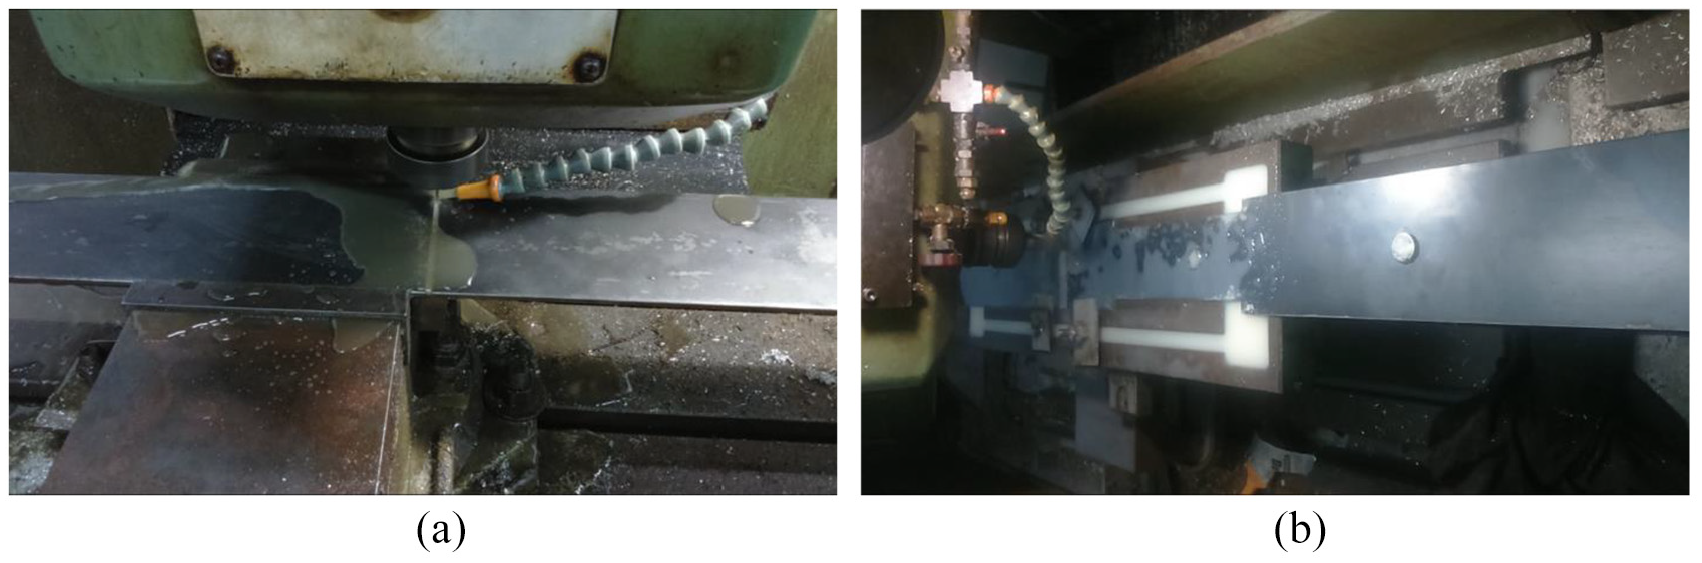
(a) Damages created on the beam by small cut (b) Damages created on the beam by big cut.
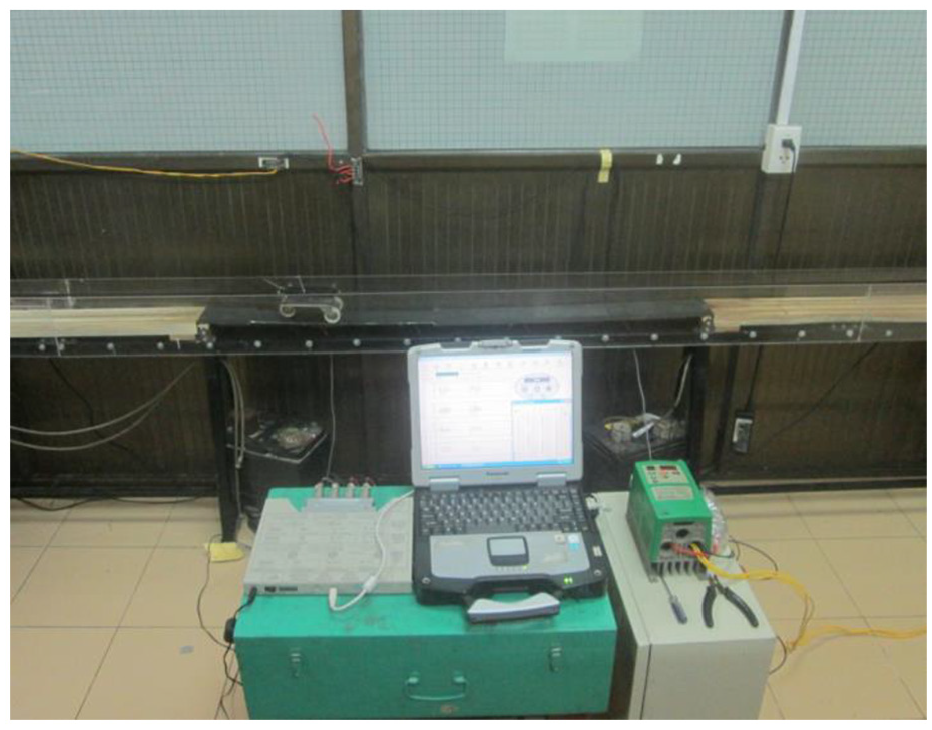
Measuring vibration on the beam.
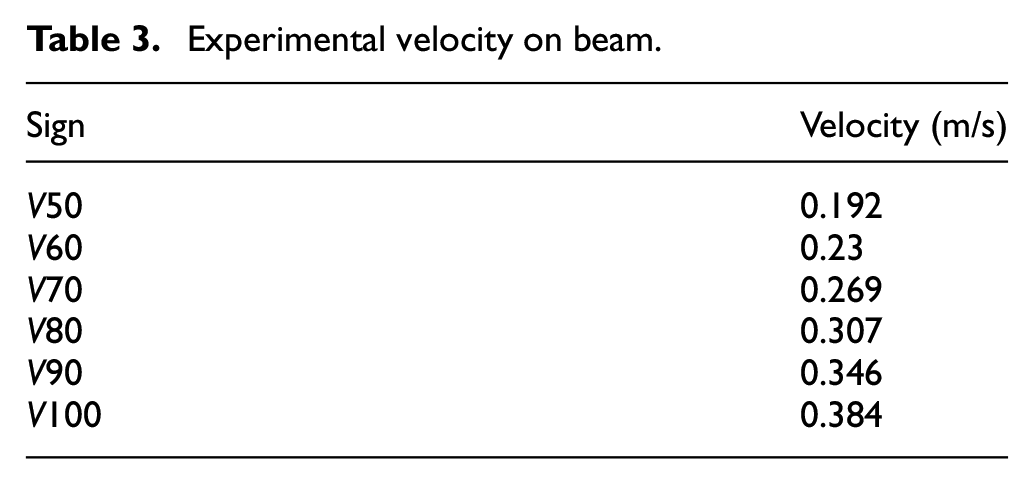
Experimental velocity on beam.
Actual testing model
The field testing was conducted following the previous project of measuring vibration 42 on some big bridges in Ho Chi Minh City, which was implemented from October 2011 to 2019 by Laboratory of Applied Mechanics (LAM). Test measuring was conducted on 38 bridges which have different structures and construction time. Vibration measuring method was the same for all bridges, in which Saigon Bridge as shown in Figure 6(a) is a typical example as it was constructed with 32 spans. The special feature of Saigon Bridge is its single span, which is favorable for assessment as the actual form of the bridge is similar to the experimental model.
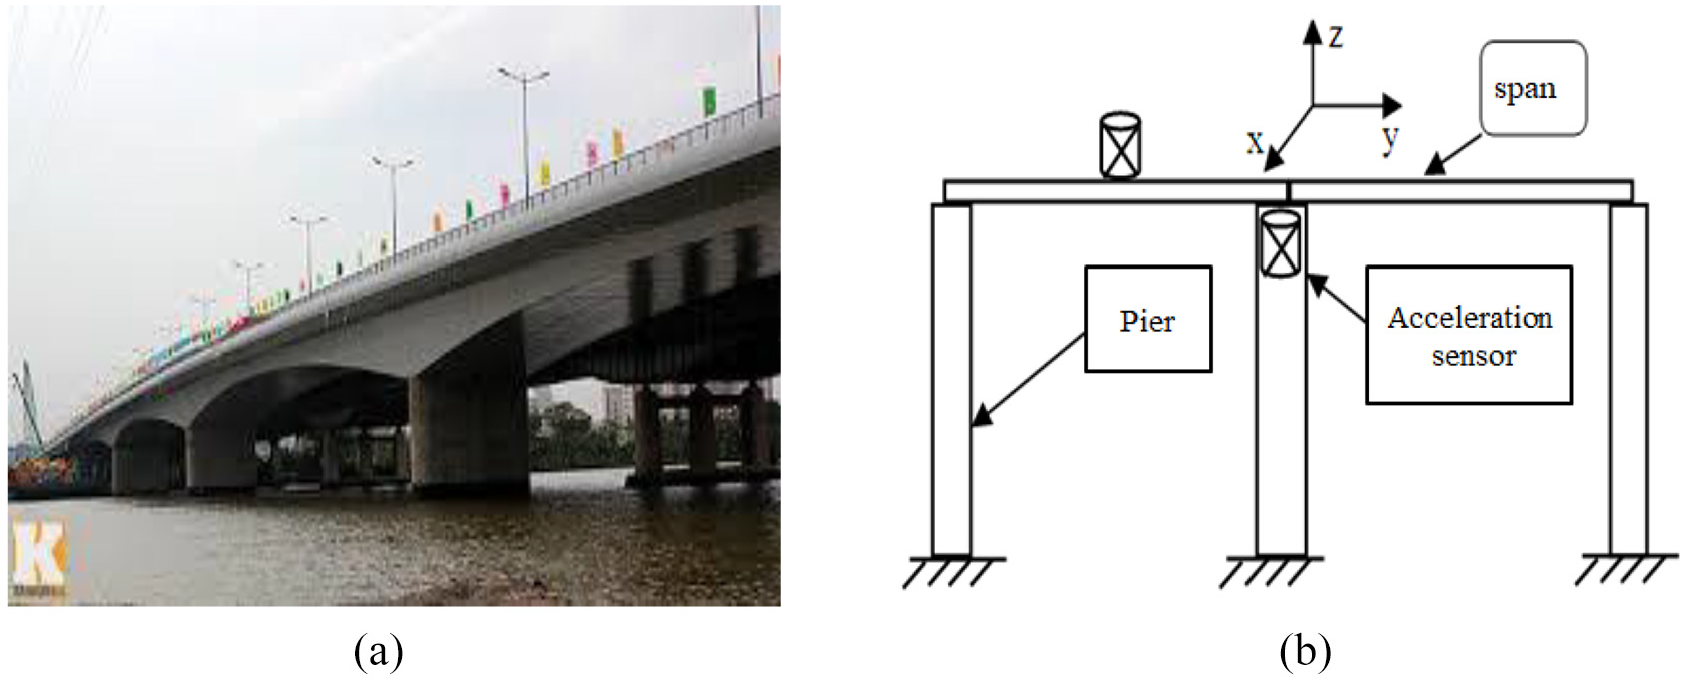
(a) Saigon Bridge in reality. (b) Cross-section of Saigon Bridge.
Procedures to measure vibration in reality was similar to that performed in the Laboratory. Accordingly, vibration was measured at different positions on spans and each position was measured along three axes Ox, Oy, Oz as shown in Figure 6(b) and the layout of these positions as set up in Figure 7.
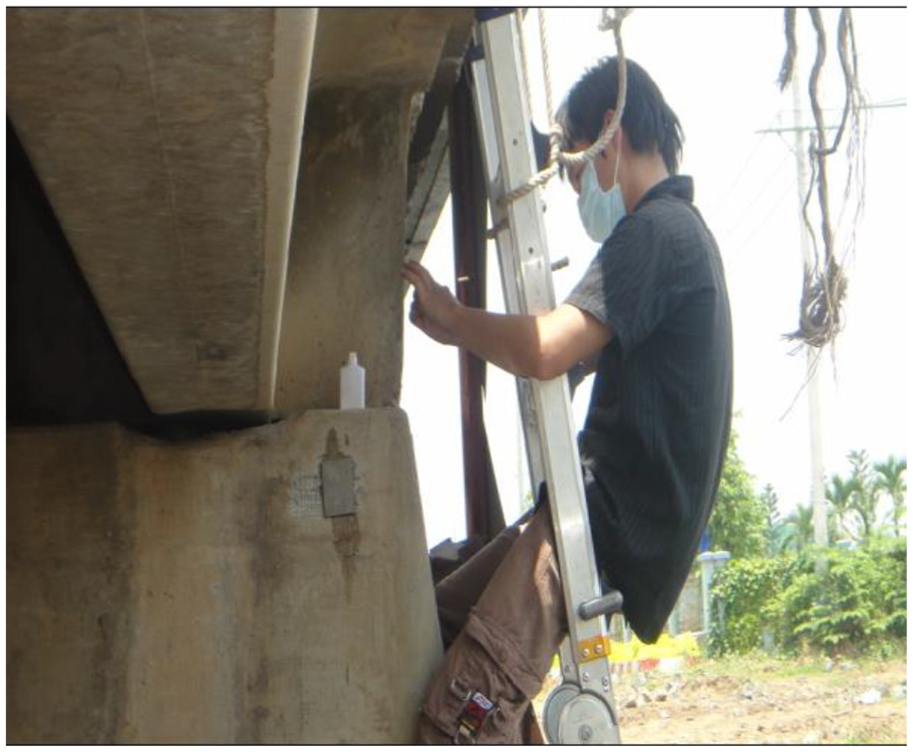
Measure vibration on Saigon Bridge.
Results and discussions
Determining correlation coefficient via original signal requires two data sets to have the same number of samples/files and same measuring time at the same state. Thus, measuring channels must be adjusted concurrently and consistently (number of samples, sampling time, sampling frequency) during the course of testing. This is such a challenge for actual testing to calculate correlation coefficient. Therefore, there have been very few researches on this parameter and its application in reality. To address these, the research used correlation coefficient of the spectrum by FFT and FT analysis to assess and detect structural damages.
Study distribution of correlation coefficient in reality
To assess changes in an actual bridge on its span via different measuring times, the study was conducted on correlation coefficient values including correlation values of spectrum via FFT analysis, FT analysis, and correlation value of original data. Figure 8(a) shows specifics of this value in three different cases and Figure 8(b) illustrates correlation coefficients value at eight different times in three cases (FFT, FT, and original):
Obviously, correlation coefficient of the structure measured by original signal was significantly more dispersed than that calculated using FFT and FT analysis. Among those, the mean value calculated using original signal was 50% higher than that using two analyses. The reason is that correlation value by original signal always contains interferences and errors of meters. Its instability is also on account of traffic. Given deviation of correlation value in this case, original signal cannot be used to assess changes in the structure’s mechanical properties.
On the contrary, this value was stable and subject to much lower deviation when FFT or FT analysis was used. Particularly, FFT analysis had 10% lower of deviation than FT analysis (according to Figure 1). However, the biggest difference between these two analyses was the big number of calculations in FT analysis. Thus, there are still a number of deviations in FT analysis. If the number of discrete values in analyzed data is N, to calculate formulas of FT analysis, there will be N2 multiplications and N2 additions of complex number, which make up total of 2 N2 arithmetic operations. If N is large (and high accuracy is required), data processing will face big challenges in calculation. To simplify FT analysis calculation, we used special algorithms which reduce the number of necessary operations from 2 N2 to N as initially. These algorithms are called FFT spectrum while correlation coefficient values from FFT analysis can possibly assess structural changes.
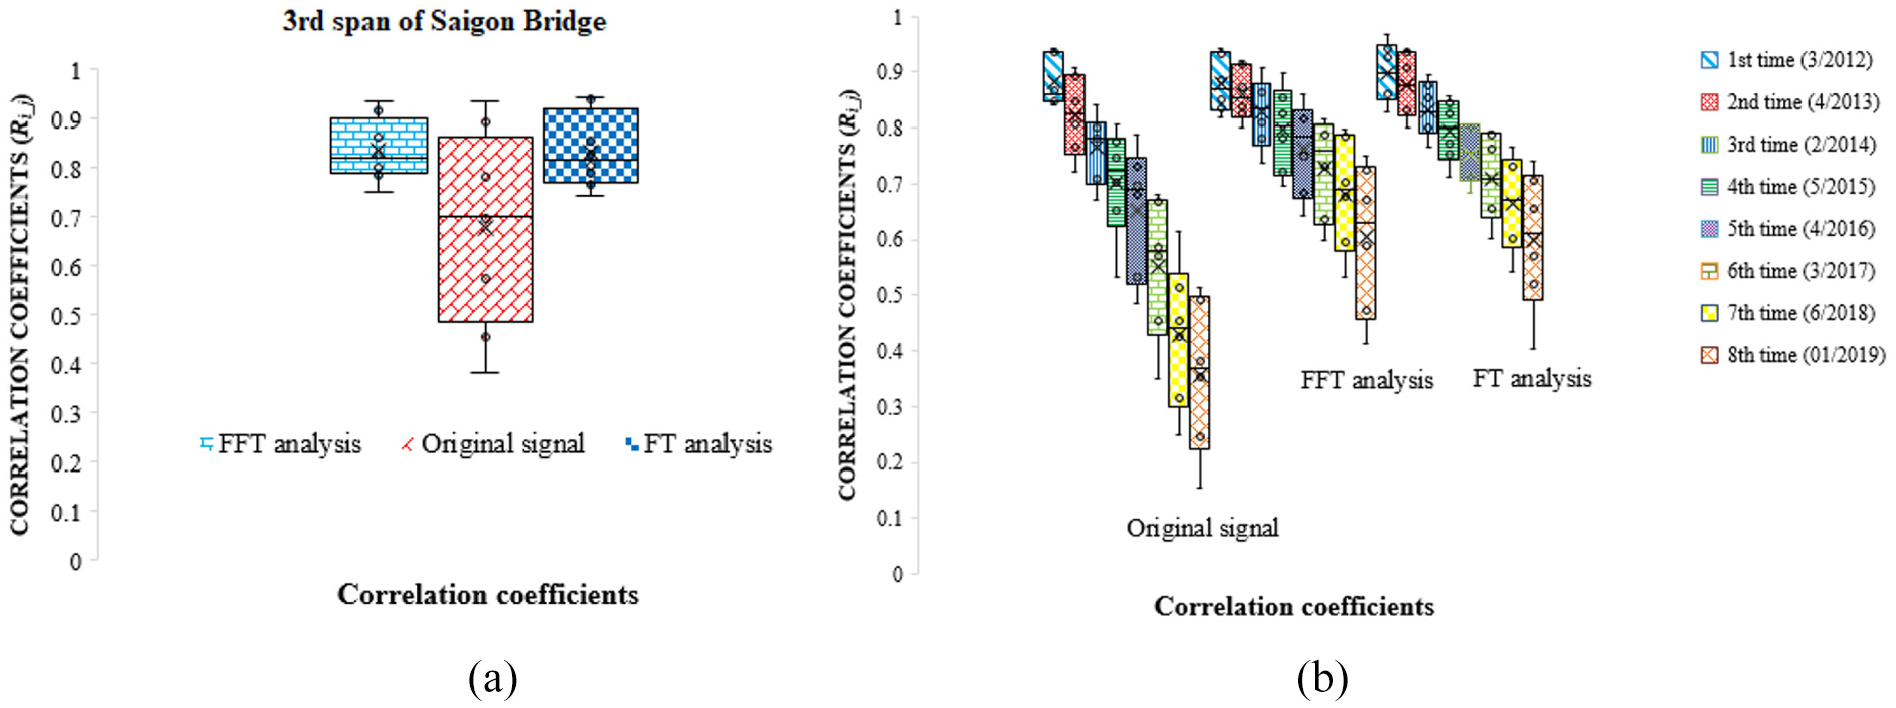
(a) Distribution of correlation coefficients in three cases (FFT, FT, and original). (b) Distribution of correlation coefficients at eight different times in three cases (FFT, FT, and original).
To create some damages on beam, the experiment in this research adjusted input speed. Via experiment, we assessed changes to this coefficient using FFT, FT analysis, and original signal. The correlation coefficient values are presented as shown in Figures 9–13:
The testing results showed that there were shortcomings in calculating correlation coefficient value using original signal. The dispersion of this value was big and grew along with speed increase. This is a difficulty if we want to apply this coefficient in reality using original signal only. The present result is consistent with that of previous researches. To address these shortcomings, original signal was interpreted using FFT and FT transformation when we calculated correlation coefficient. Obviously, the difference between these two transformations was not significant, being only about 17%–20% for speed ranges of small experiments (V60 and V70), less than 10% for V80 and V90, and less than 5% for V100. It showed that they were quite similar when we compared actual results from bridge spans (see Figure 8(a) and (b)).
Despite deviation in accuracy of assessing correlation coefficient, the value deprived from FFT analysis was pre-eminent compared to FT given its required number of samples. Simplification of operations in FFT and calculation results from FFT are still guaranteed (higher accuracy), which means it is easier to apply in reality. For systems monitoring operation of a structure in a long time, the number of collected samples is too large. FT analysis or others encounter difficulties in calculation. Furthermore, such calculations are subject to more deviations and interference than FFT.
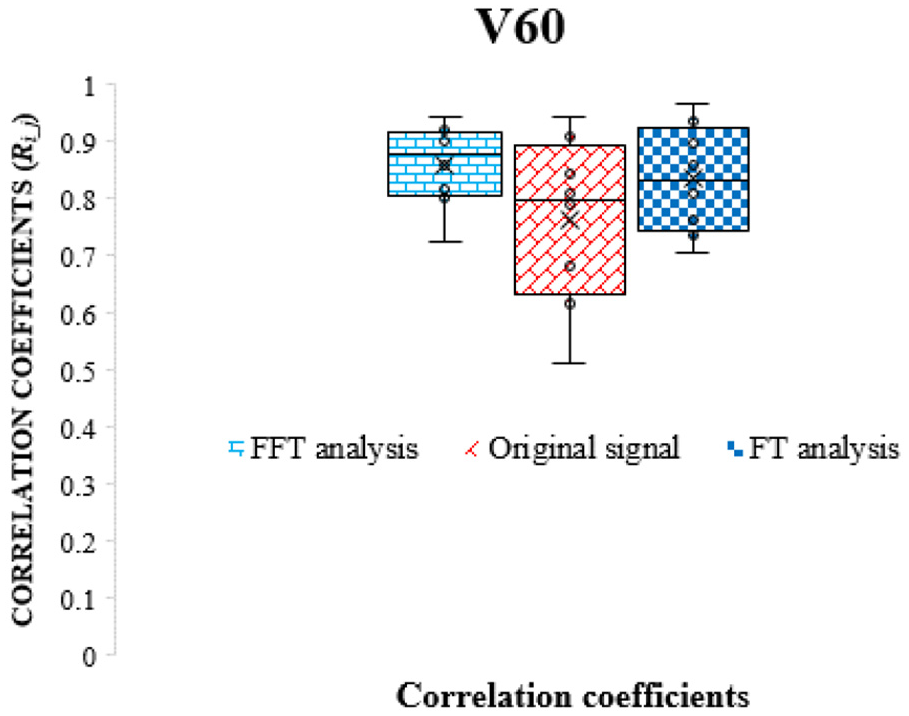
Distribution of correlation coefficients at V60.
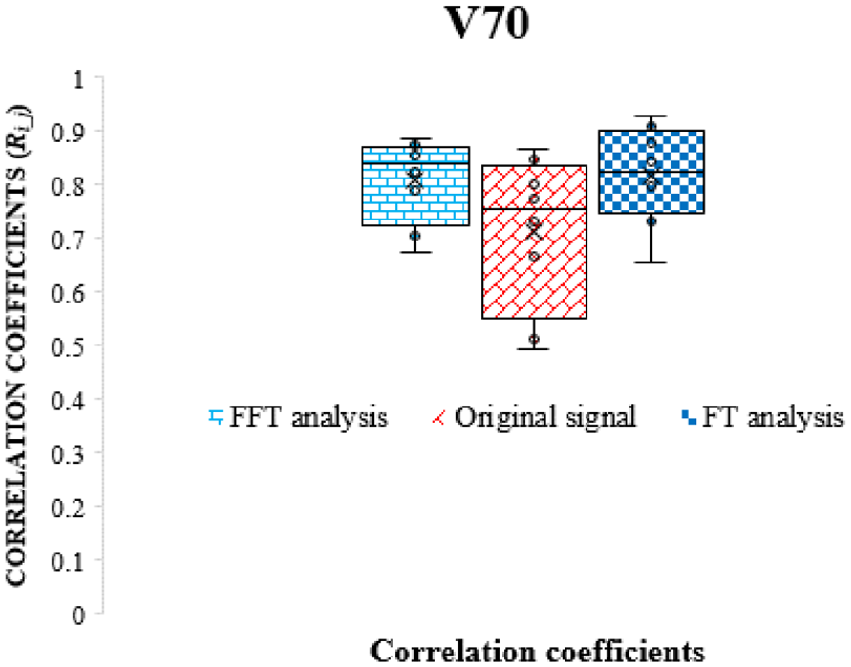
Distribution of correlation coefficients at V70.
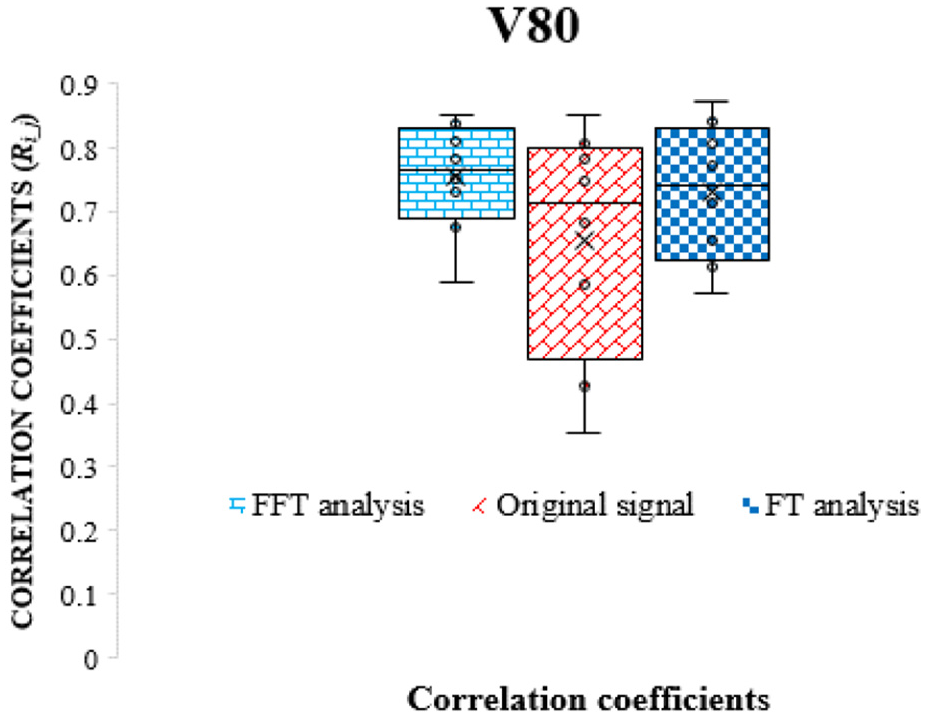
Distribution of correlation coefficients at V80.
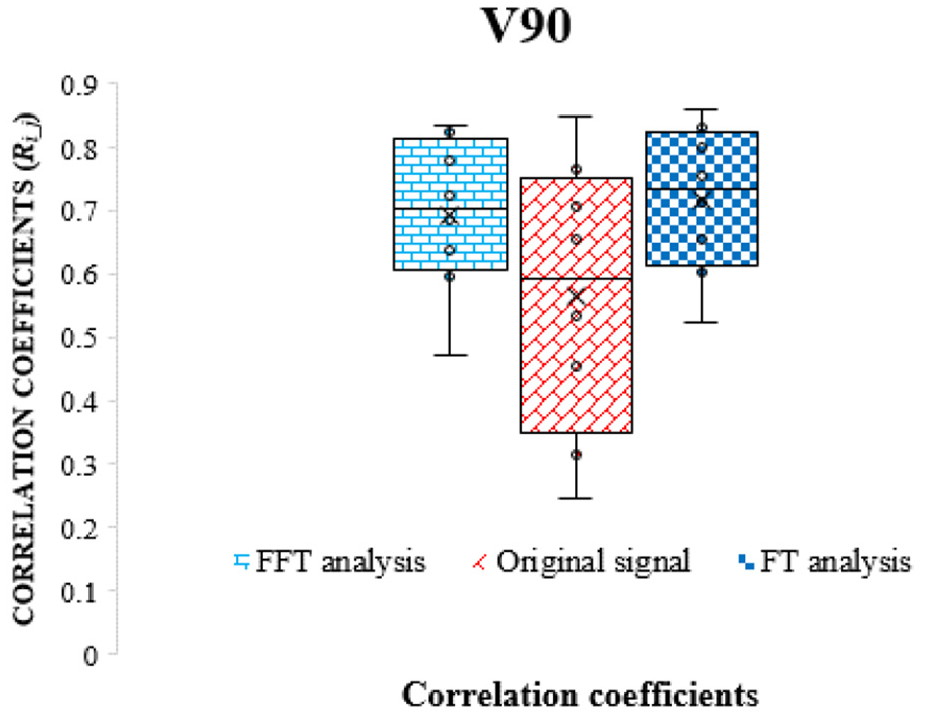
Distribution of correlation coefficients at V90.
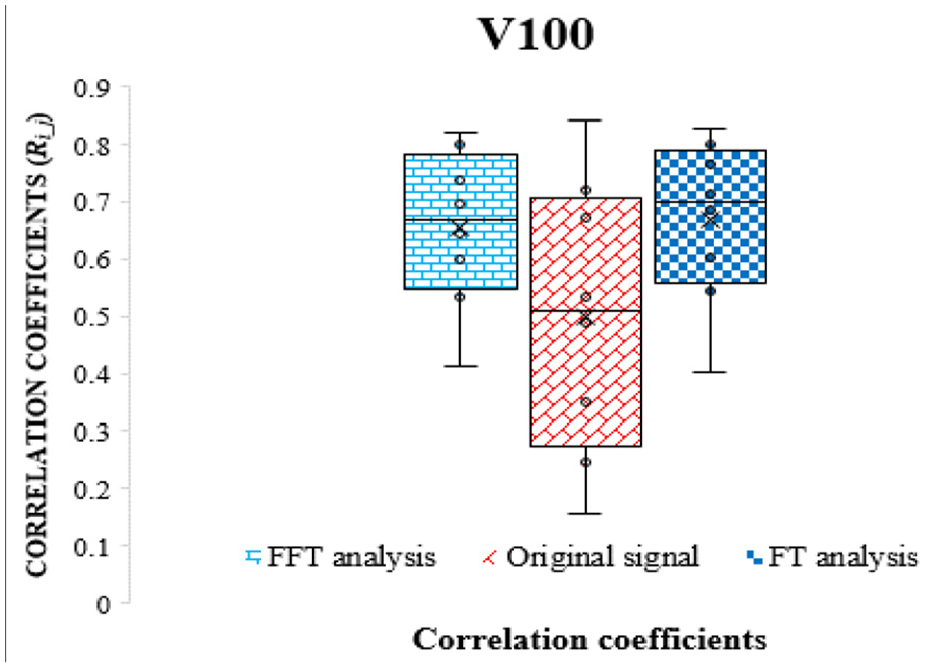
Distribution of correlation coefficients at V100.
Develop correlation matrix using FFT analysis for experimental beam
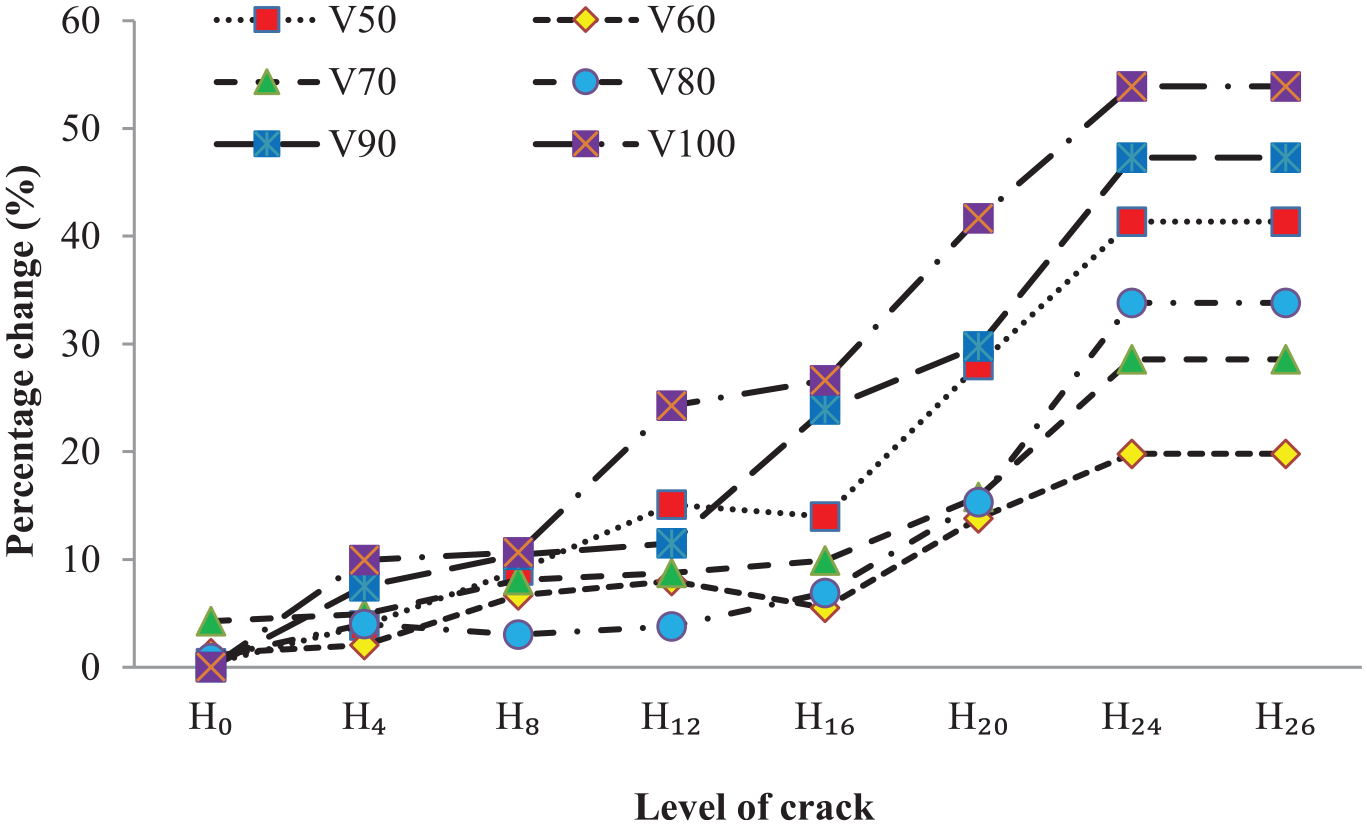
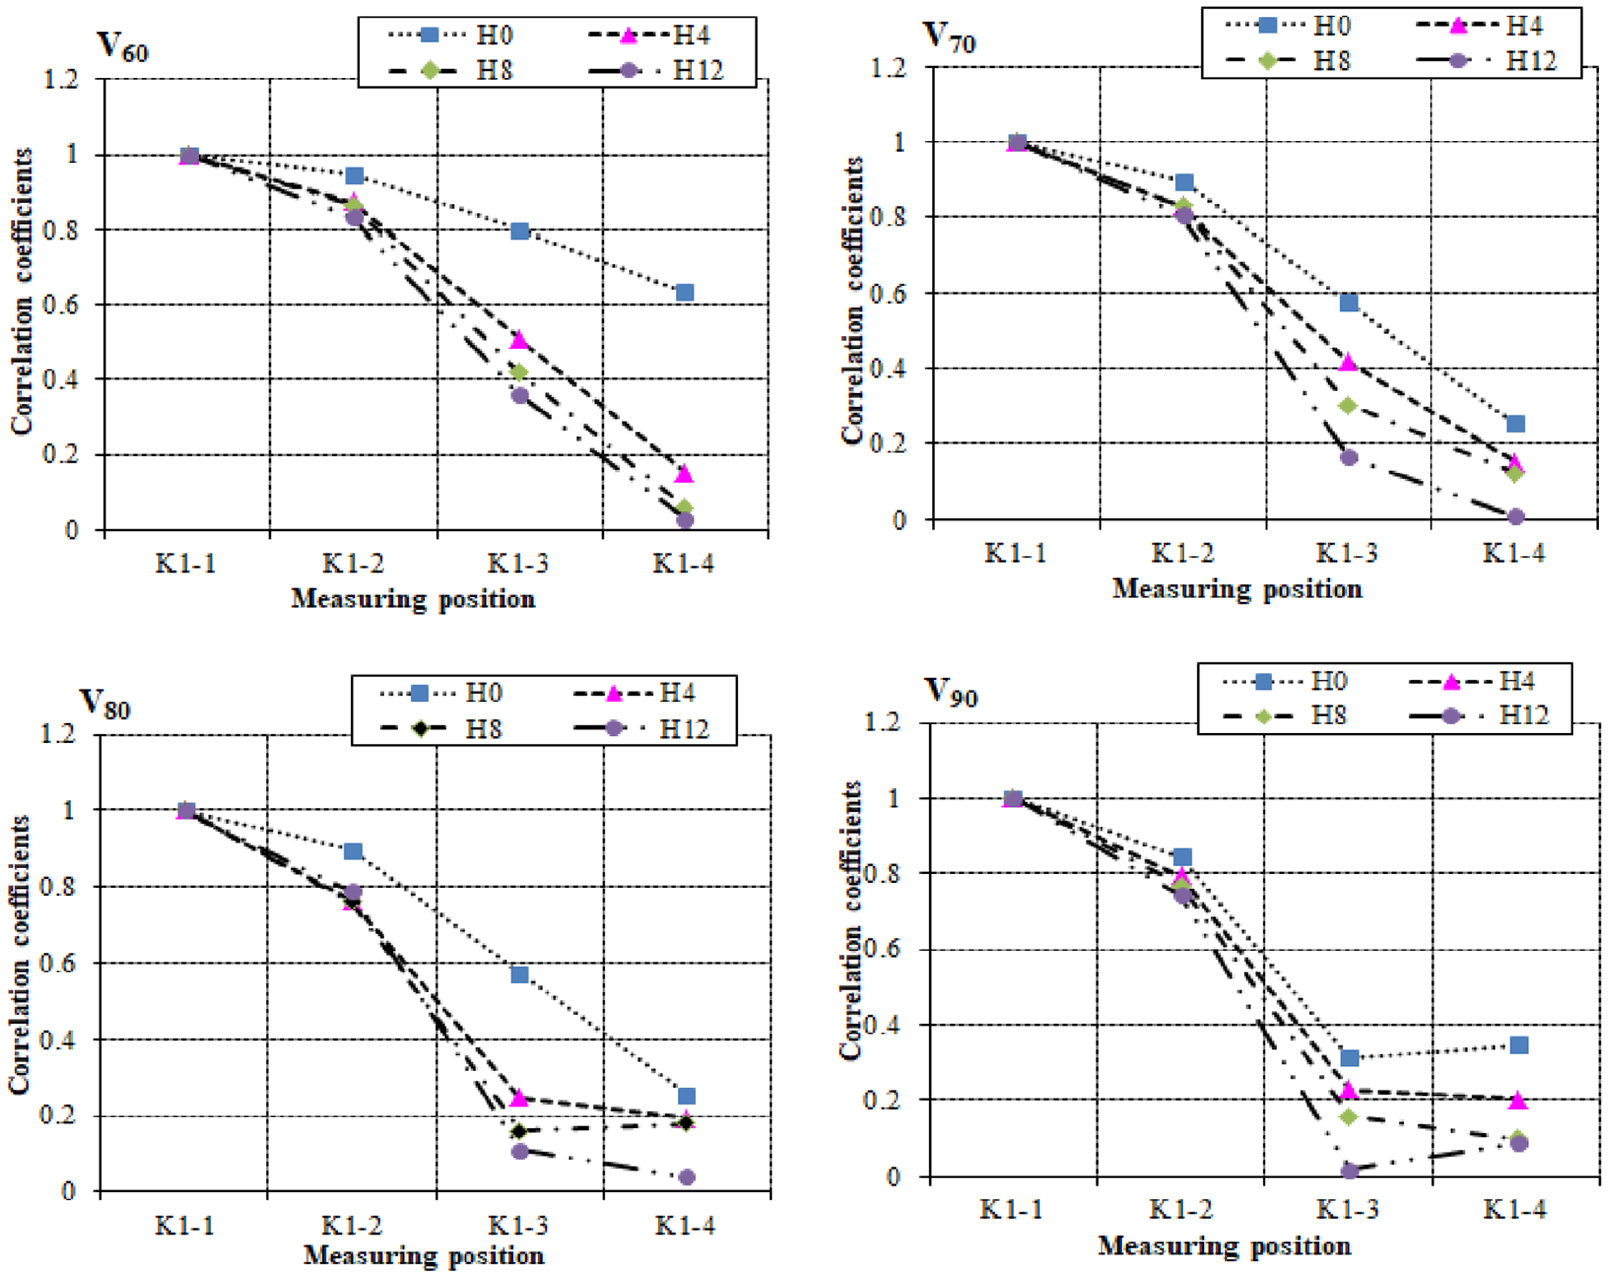
Correlation coefficient values of vibration signal were studied via FFT analysis at positions of K1, K2, K3, and K4 sensors. It meant correlation coefficient was formed in pair of different data of the beam corresponding to different speeds (from V50 to V100). Figure 14 demonstrates change of correlation coefficient value between K1 and K4—(R1–4 correlation), which are two positions with largest distance on the beam.
Cross-correlation between two sets of vibration signals at two positions K1 and K4.
From Figure 14, it can be seen that the percentage of correlation coefficient value R1–4 is constantly changing from corresponding to crack depth. It means when the depth of crack on beam increases (from H0 to H26), the percentage of correlation coefficient value will increase from 0% (without cuts) to 60% (H26) at V100. Experiment results showed that when the crack was big enough, that is, the depth is H24 = 24 mm and H26 = 26 mm, this value nearly increased by almost 60%, and thus, the experiment stopped at H26 without increasing the depth of crack. At this time, responses at two measuring positions of beam were nearly independent vibrations and the structure’s connections at those positions were free of vibration. Study on speeds of V50, V60, V70, V80, V90, and V100 had similar results. Thereby it can be seen that correlation coefficient is quite sensitive to expansion of crack on the beam. To locate positions of crack on the beam, this research developed a matrix of correlation coefficient values for each speed and each damage state.
With the experimental model which was similar to the one in this work as shown in Figure 15, the research group of Wang et al. 43 also investigated the changes of correlation coefficient values through the damage index (DIPV) in different measuring points. However, this study did not refer to any algorithms in order to identify the correlation coefficient. In order to improve the sensitivity of the mathematical model, the approach given in Wang et al. 43 was combined with the inner product vector (IPV), which is called the confidence interval factor with its values ranging from 1.5 to 1.8. All the results have revealed that the values of correlation coefficients obtained from the experiment 43 and from the current study tended to constantly decrease with respect to the length of structures. However, this phenomenon was not totally apparent. In comparison with the results obtained from this study, the changes of correlation coefficient values through the analysis FFT showed more advantages as shown in Figure 16.
Honeycomb sandwich composite beams and test setup: (a) sketch of test setup, (b) test setup, and (c) deboding damage. 43
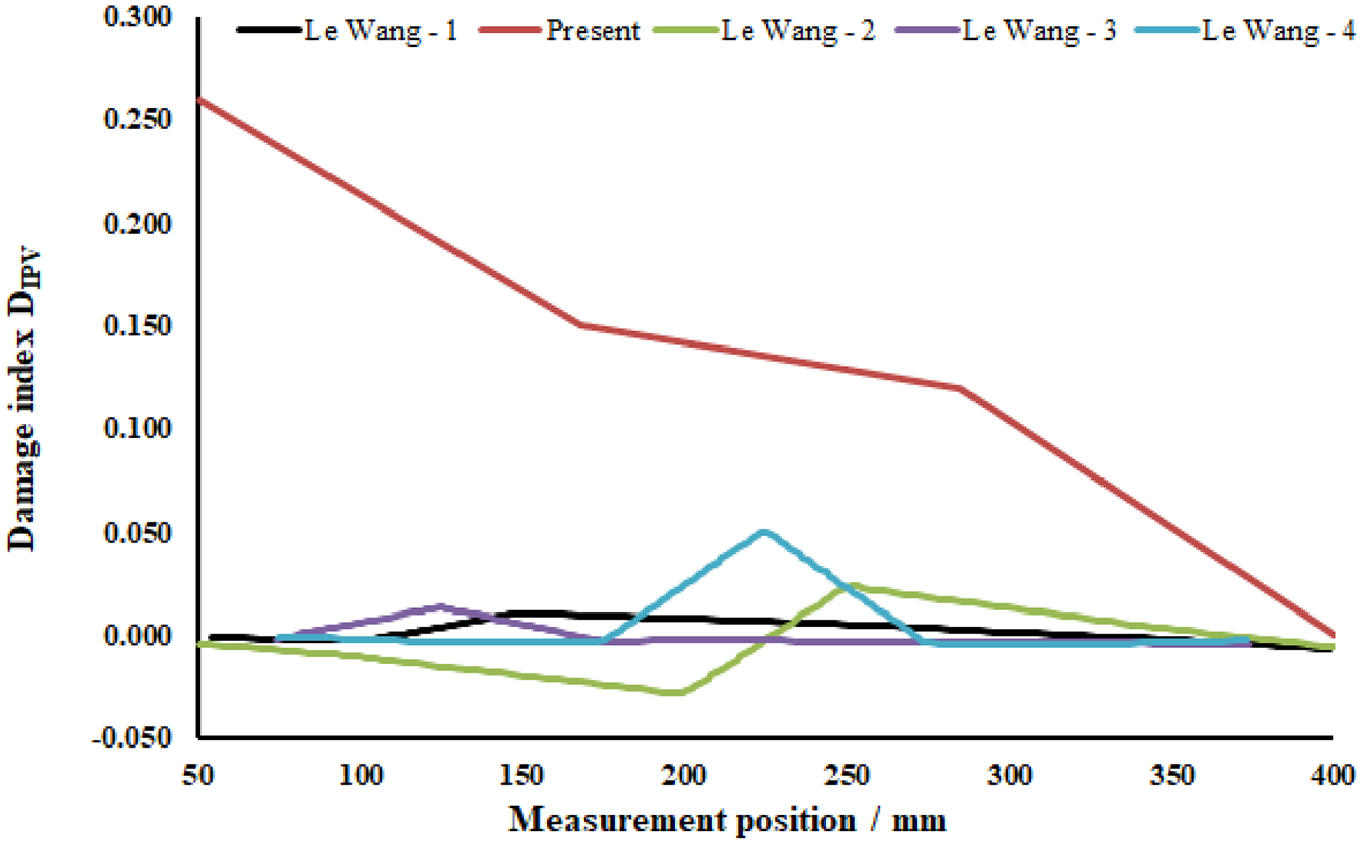
Comparison of the sensitivity between results given in Wang et al. 43 and the current study.
From Figures 17 to 20, it can be seen that the cross-correlation model gives us an overview about relations among sets of measured signals corresponding to damages to beams. For intact beam, the graphic is nearly symmetrical. And this symmetry no longer exists when cracks appear. From the graphic we can see there are obvious changes in relation between measured signals on K1 and K2. Thereby, correlation of signals of K1 with other channels is shown in Figure 21.
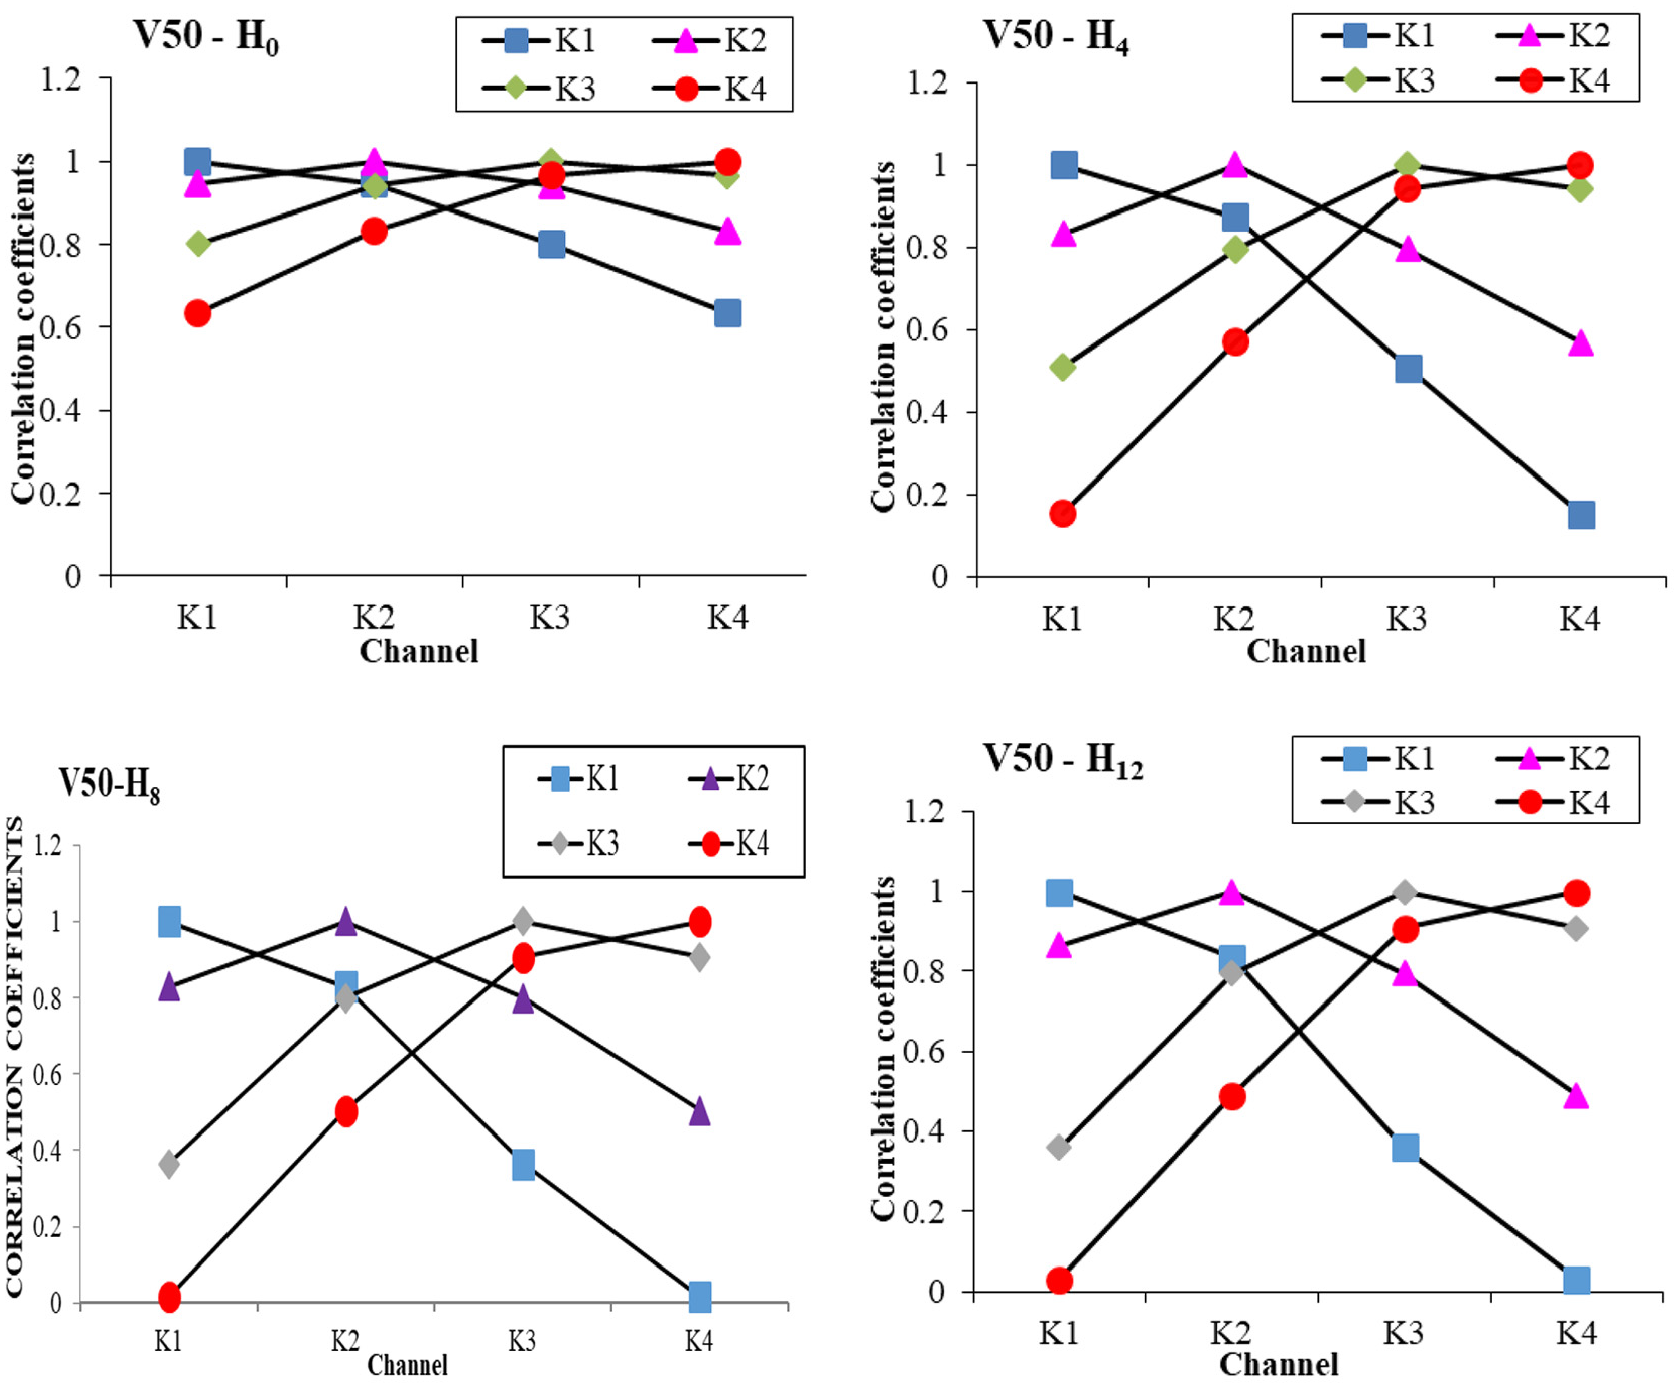
Matrix of cross-correlation coefficients at four measuring positions corresponding to damage state from H0 to H12 at speed of V50.
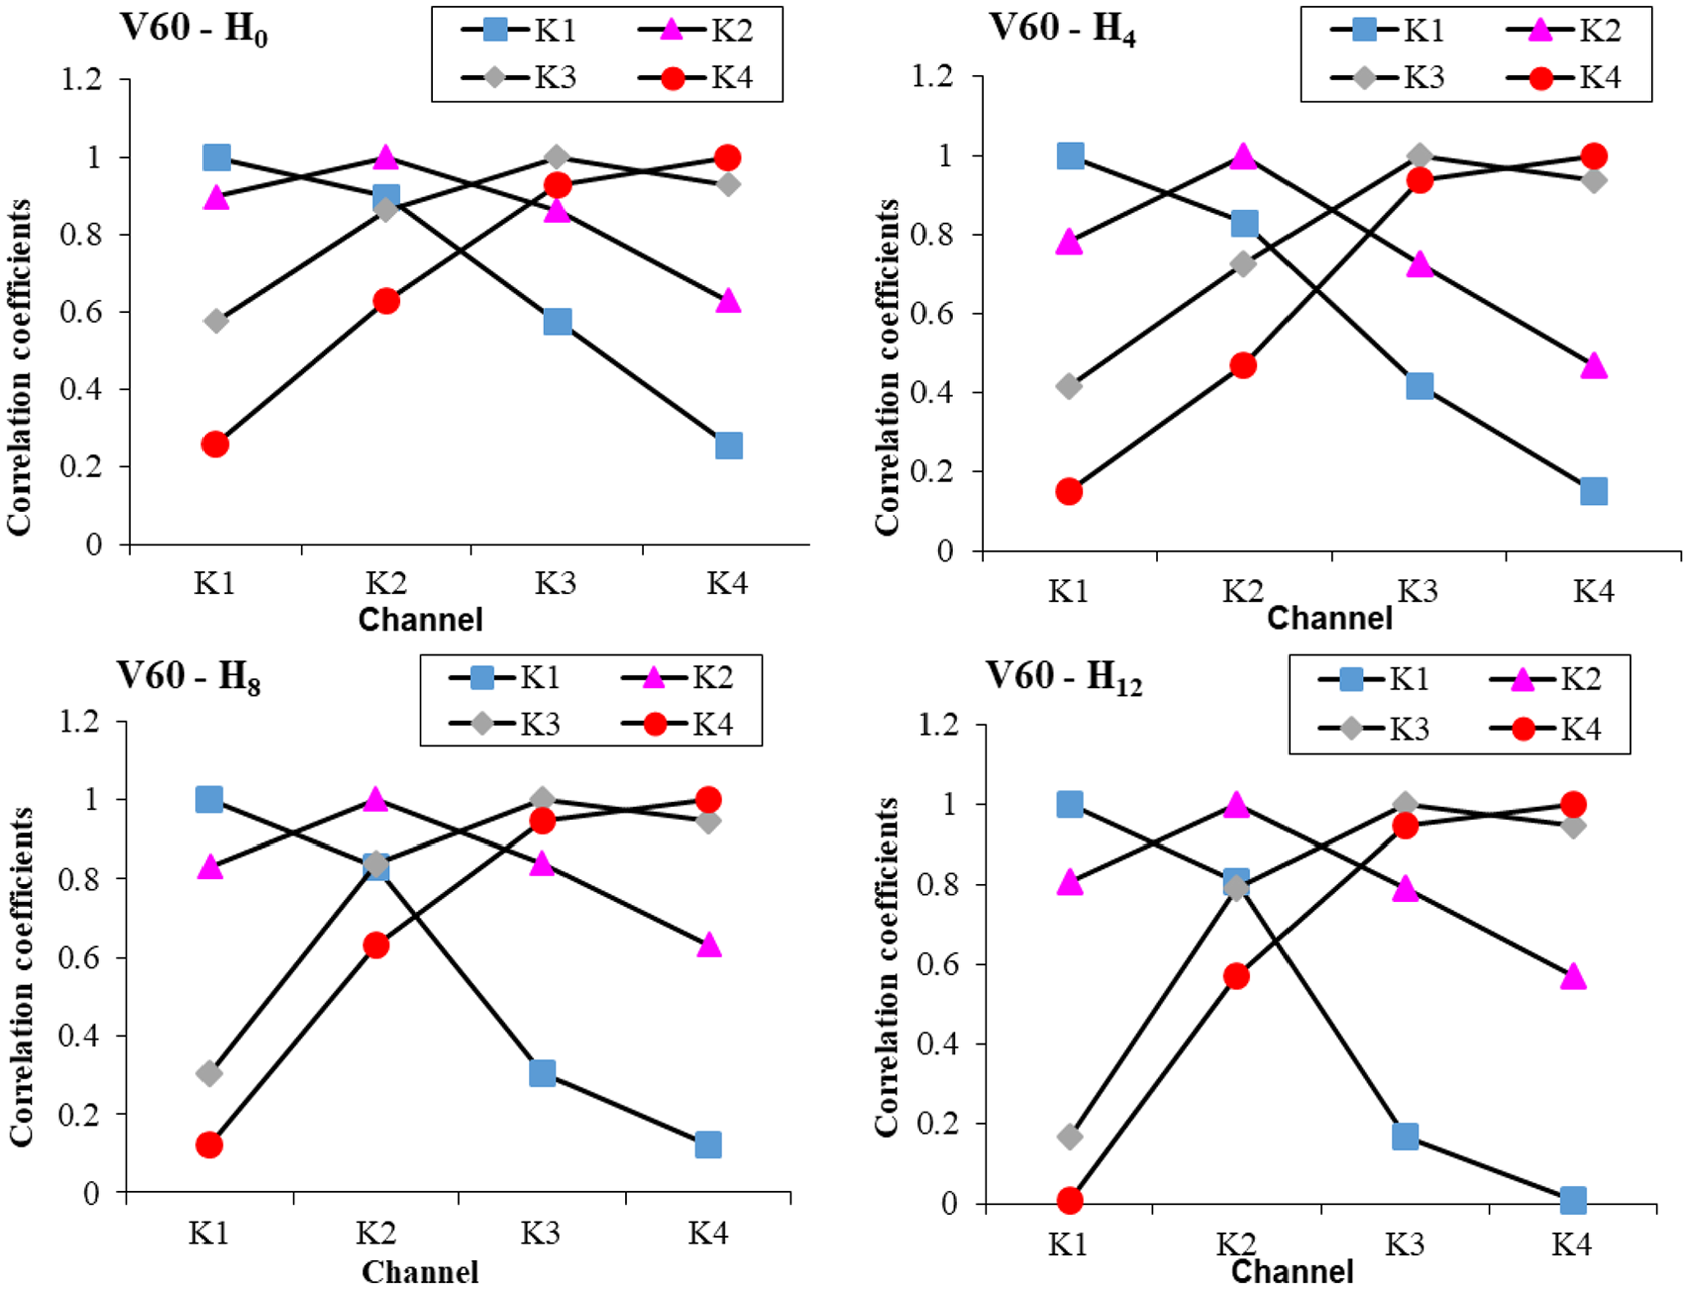
Matrix of cross-correlation coefficients at four measuring positions corresponding to damage state from H0 to H12 at speed of V60.
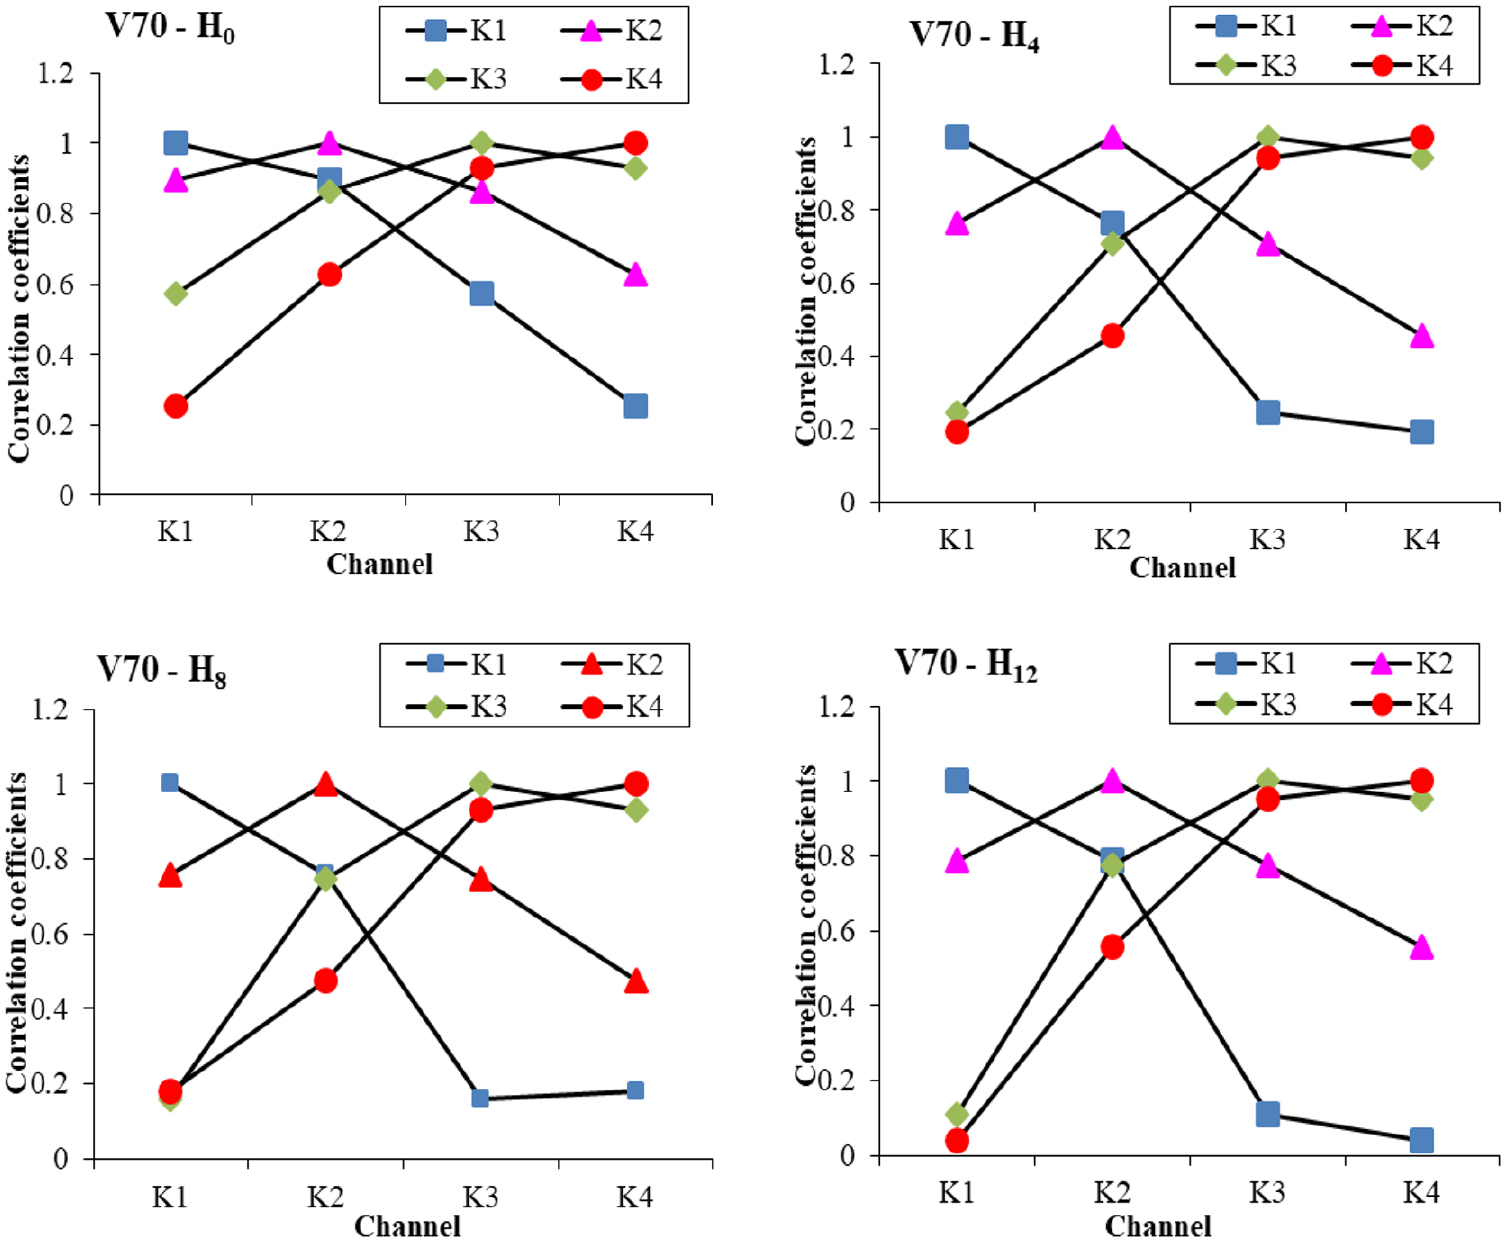
Matrix of cross-correlation coefficients at four measuring positions corresponding to damage state from H0 to H12 at speed of V70.
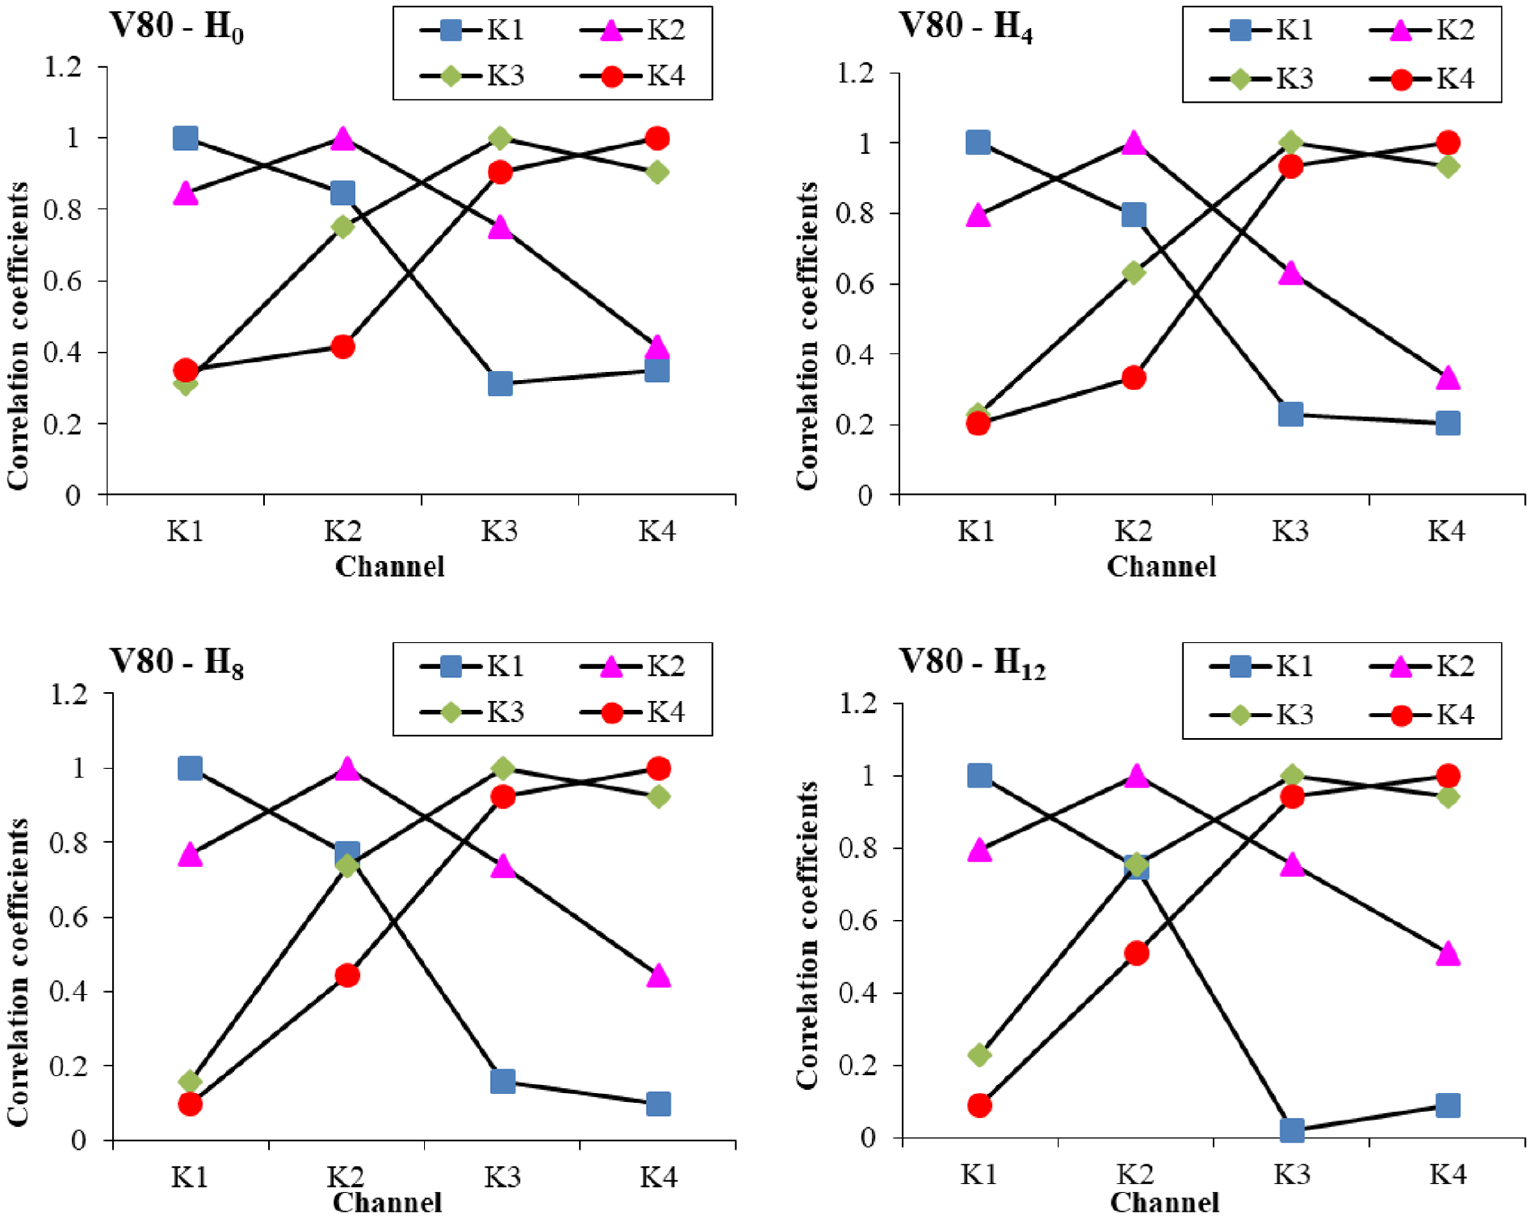
Matrix of cross-correlation coefficients at four measuring positions corresponding to damage state from H0 to H12 at speed of V80.
Correlation of vibration signal at measuring position 1 against other measuring positions.
Figures 17–21 demonstrate correlation coefficient values among measuring channels with different damages on the beam:
In general, the correlation coefficient value always tends to significantly decrease against an increase of beam crack and against distance between measuring positions. Figure 21 shows that the correlation value changes depending on distance and damages between two measuring positions. However, the existence of damage on the structure always makes correlation coefficient change more than the distance between the two measuring positions. This is shown by gradient of measuring channels such as Figure 21 between damaged and intact structures.
The correlation coefficient between K1 and itself is 1 for all cracks. It means the correlation value among them is unchanged in all states of damages on the structure. This is the core basis to form original position to determine change of correlation coefficient corresponding to structure’s mechanical properties. For intact beam H0, correlation coefficient K1–2 has maximum value of 0.93. By that time, responses of beam among positions 1 and 2 closely relate to each other with the only difference originating from distance between two positions. This relation goes down when the expansion of crack on beam increases (H4–H12) but remains its nature and reaches lowest value at H12 with R = 0.7. However, this value declines along deterioration of damaged beam and measuring positions of two channels with damages. The correlation coefficients of positions with damages H4, H8, and H12 are 0.15, 0.09, and 0.01, respectively. This is the basis to detect position of damage on the beam.
Conclusion
This article presented the FFT-based correlation coefficient approach for evaluating damage responses of the structure. From the results obtained, we have come to the following conclusions:
The correlation coefficient is a sensitive parameter for evaluating structural changes. However, this research shows that using correlation coefficients of the source signal results in noise interfered data and measurement error. In addition, the transport on the bridge is another factor that destabilizes the source signal. So the correlation of the source signal is not sensitive enough to evaluate changes in the structure’s mechanical properties, especially more complex real-life structures. Therefore, findings from correlation values using source signals do not tend to be applicable.
Combining the analysis of the correlation coefficient with FT analysis reduces error and stabilizes values considerably compared with the use of the source signal. However, during FT analysis, the number of calculations increased immediately from N to 2 N2, which still leads to errors and filtered information. Hence, it is not easy to evaluate changes in more complex structures.
Subsequently, FFT analysis reduced error compared to FT analysis by approximately 25%, but the greatest difference came from the number of calculations. FFT used fewer calculation steps than FT analysis, so the overall error from FFT was consistently lower than FT’s. Furthermore, with the simplification of FFT calculations, a greater proportion of information that encodes the mechanical changes in structures is retained. Obtained results show that correlation coefficients derived from FFT analysis capture well changes in the structure with high sensitivity and optimized calculation.
Based on FFT, the correlation coefficients are not only able to identify changes in the structure but also locate structural decline through cross-correlation matrices. This finding is a new contribution in the identification of damage using correlation coefficients in real-life structures.
Footnotes
Authors’ contribution
N.K.N. contributed to conceptualization, methodology, and supervision. T.Q.N. contributed to data analysis, software, validation, formal analysis, writing, original draft, visualization, and investigation. T.V.V. contributed to software and validation. H.N.-X. wrote, reviewed and edited, and supervised.
Declaration of conflicting interests
The author(s) declared the following potential conflicts of interest with respect to the research, authorship, and/or publication of this article: This is to certify that to the best of authors’ knowledge, the content of this manuscript is original. The paper has not been submitted elsewhere nor has been published anywhere. Authors confirm that the intellectual content of this paper is the original product of our work and all the assistance or funds from other sources have been acknowledged.
Funding
The author(s) disclosed receipt of the following financial support for the research, authorship, and/or publication of this article: This research is funded by Ho Chi Minh City University of Technology–VNU-HCM, under grant number TKHUD-2019-17.
Data availability statement
All data generated or analyzed during this study are included in this submitted manuscript.