
Abstract
Dealing with the problem of large volumes of high-dimensional features and detecting damage under ambient vibration are critical to structural health monitoring. To address these challenges, this article proposes a novel data-driven method for early damage detection of civil engineering structures by robust multidimensional scaling. The proposed method consists of some simple but effective computational parts including a segmentation process, a pairwise distance calculation, an iterative algorithm regarding robust multidimensional scaling, a matrix vectorization procedure, and a Euclidean norm computation. AutoRegressive Moving Average models are fitted to vibration time-domain responses caused by ambient excitations to extract the model residuals as high-dimensional features. In order to increase the reliability of damage detection and avoid any false alarm, the extreme value theory is considered to determine a reliable threshold limit. However, the selection of an appropriate extreme value distribution is crucial and troublesome. To cope with this limitation, this article introduces the generalized extreme value distribution and its shape parameter for choosing the best extreme value model among Gumbel, Fréchet, and Weibull distributions. The main contributions of this article include developing a novel data-driven strategy for early damage detection and addressing the limitation of using high-dimensional features. Experimental data sets of two well-known civil structures are utilized to validate the proposed method along with some comparative studies. Results demonstrate that the proposed data-driven method in conjunction with the extreme value theory is highly able to detect damage under ambient vibration and high-dimensional features.
Keywords
Introduction
Early damage detection is a necessity for many civil structures that play crucial roles in social life, transportation networks, and economics. In order to guarantee the safety and serviceability of important civil structures and avoid high costs of maintenance, rehabilitation, and reconstruction, it is essential to focus on structural health monitoring (SHM). Data-driven methods present practical approaches to SHM based on the statistical pattern recognition paradigm. 1 In comparison to the model-driven techniques, which generally require constructing an elaborate finite element model of the real structure and model updating,2,3 the data-driven methods only consider raw measured data without any model construction or updating.
Due to directly applying measured data, feature extraction and feature classification are two key parts of any data-driven method. The process of feature extraction discovers meaningful information (features) from raw vibration measurements. 1 For the SHM applications, such features should be sensitive to damage; hence, those are usually known as damage-sensitive features (DSFs). Depending upon the nature and type of vibration data, advanced signal processing techniques provide powerful and effective approaches to extract diverse DSFs from vibration signals. 4 Time series analysis by time-invariant linear representations is one of the robust feature extraction methods. 5 Several research studies have utilized various time-invariant linear models for feature extraction such as AutoRegressive (AR),6–8 AutoRegressive with eXogeneous input (ARX), 9 AutoRegressive Moving Average (ARMA),10,11 AutoRegressive-AutoRegressive with eXogeneous (AR-ARX), 12 and AutoRegressive Moving Average with eXogenous input (ARMAX). 13 Using these models, it is possible to use the AR coefficients and the model residuals as the main DSFs.6,14 However, the extraction of features sensitive to damage from measured vibration responses under unpredictable and unknown ambient excitations may be problematic.
The process of feature classification utilizes the DSFs extracted from the normal (known) and current (unknown) states of the structure so as to evaluate the global structural condition and detect any potential damage.1,15 Hence, this process compares two different states of a structure in order to recognize the status of the current state, which can be either undamaged or damaged. Some effective and well-known feature classification methods include Mahalanobis distance (MD),16–19 artificial neural networks,20,21 and clustering.23–26 One of the major challenging issues in feature classification is concerned with the emergence of high-dimensional DSFs or Big Data. The main limitation is that the implementation of early damage detection by such features may be troublesome and time-consuming. On the contrary, when the high-dimensional DSFs are obtained from unmeasurable and unknown ambient excitations, those may cause unreliable results of damage detection.
The initial solution is to reduce the size of data or DSFs by various dimensionality reduction techniques such as principal component analysis (PCA),27,28 random projection, 29 deep autoencoders,30,31 and so on to convert such features into low-dimensional spaces. However, the loss of important information is the main concern about dimensionality reduction techniques. 32 Mujica et al. 33 compared four techniques including PCA, partial least square (PLS), and some extensions called multiway PCA and multiway PLS to reduce the dimension of data for damage identification. They concluded that the multiway approaches are very useful in systems that involve several sensors since those decrease the computation cost drastically. The other comparative study on the problem of dimensionality reduction in the context of SHM can be found in the article of Rebillat and Mechbal, 34 who applied several methods including simple direct regression, PCA, PLS, canonical correlation analysis, and autoencoders. They concluded that among the mentioned techniques, PCA, PLS, and canonical correlation analysis are all able to discover a low-dimensional space in their problem.
The other challenging issue in feature classification for any data-driven SHM method is to determine a reliable threshold limit that should be able to distinguish the damaged state from the normal condition. The threshold limit determination is a crucial process because an inaccurate choice increases false alarm (false positive) and false detection (false negative) errors that cause confusing results. 35 In reality, the information of the current state of the structure is usually unknown. Therefore, in most cases of SHM applications, the threshold limit determination is carried out by considering the probabilistic properties of samples or outputs (e.g. damage indices) associated with the normal or undamaged condition. For this purpose, it is necessary to assume a probability distribution model for such samples or outputs and calculate a statistical quantity (i.e. a percentile of the distribution of interest), which is incorporated as a threshold value. 16 The simplest way is to consider the Gaussian or normal distribution and estimate a threshold limit based on a standard confidence interval (CI). Despite the simplicity and computational efficiency of this approach, Sarmadi and Karamodin 16 demonstrated that it is not able to provide a correct and reliable threshold when the samples or outputs regarding the undamaged state are non-Gaussian or heavy-tailed. To address this problem, one can utilize extreme value (EV) statistics and obtain a threshold value by fitting a proper EV distribution.36–38 However, the selection of an appropriate EV distribution among three potential models (i.e. Gumbel, Fréchet, and Gumbel) is not trivial.
This article proposes a novel data-driven method for early damage detection under high-dimensional features and ambient vibration by robust multidimensional scaling (RMDS). The RMDS is an improvement on the traditional multidimensional scaling (MDS). Both techniques aim to create low-dimensional projections by retaining pairwise distances between data samples as much as possible. The major disadvantage of the MDS is that it may suffer from outliers and uncertainties. 39 In most real cases of SHM, the outliers and uncertainties may be noise in measurements, unknown ambient excitations, environmental variability, and so on that may seriously affect the performance of any feature classification method. On this basis, the RMDS is proposed to develop a novel data-driven SHM method. This method consists of some simple but effective computational steps including the segmentation of high-dimensional DSFs, the pairwise distance computation by the Euclidean-squared distance (ESD), the implementation of the RMDS iterative algorithm, the matrix vectorization process, and the Euclidean norm calculation. The process of feature extraction under ambient vibration is performed by fitting ARMA models to measured vibration responses and extracting their residuals as randomly high-dimensional DSFs. The major contribution of this article is to develop a novel data-driven strategy for detecting damage based on the output of the RMDS as a new method for dimensionality reduction. Dealing with the problem of using large volumes of high-dimensional DSFs for early damage detection is the main advantage of the proposed method. Concerning the challenge of the threshold limit determination based on the EV theory, this article introduces the generalized EV (GEV) distribution and its shape parameter to select the most appropriate EV model. The effectiveness and performance of the proposed RMDS-based method are validated by experimental data sets of two well-known benchmark models, the International Association for Structural Control–American Society of Civil Engineers (IASC-ASCE) structure 40 and the Tianjin-Yonghe Bridge in China. 41 Comparative studies are also conducted to demonstrate the superiority of the proposed RMDS-based method along with the EV-based threshold determination over some existing techniques. Results demonstrate that the proposed RMDS-based method in conjunction with the EV statistics provides an influential and reliable tool for detecting damage under ambient vibration and high-dimensional DSFs.
Feature extraction by ARMA model
Time series analysis is a powerful statistical method for modeling vibration time-domain signals (e.g. acceleration time histories) and extracting meaningful information that can be interpreted as the DSFs. The type and nature of vibration signals are important factors for choosing an appropriate time series model. From a statistical viewpoint, time series is a sequence of values at a time interval that is observable as stationary or non-stationary, deterministic or random, linear or nonlinear, and so on. When time series data are linear and stationary, a suitable choice for time series modeling is to use time-invariant representations including AR, ARX, ARMA, AR-ARX and ARMAX. 42
Depending upon the source of excitation, the process of time series modeling is generally decomposed into input–output and output-only problems. For the input–output problem, it is necessary to have both the excitation (input) and response (output) signals and choose a time series model between ARX and ARMAX. When the input data are unknown such as the ambient excitations, the process of time series modeling is an output-only problem, in which case the only vibration responses of the structure are available. Under such circumstances, one can apply AR and ARMA for modeling the structural responses. An important note is that the vibration time-domain signals resulting from the ambient excitations conform to the ARMA model. 11 Therefore, it is important to use this representation for modeling the structural responses caused by ambient vibration. 43 Supposing that y(t) is a vibration signal (structural response) at time t, the ARMA model is expressed as
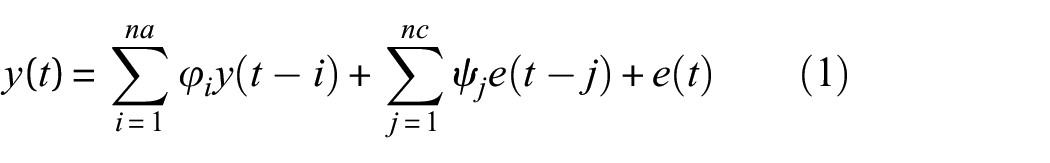
where na and nc denote the orders of the AR and MA terms of the ARMA model;
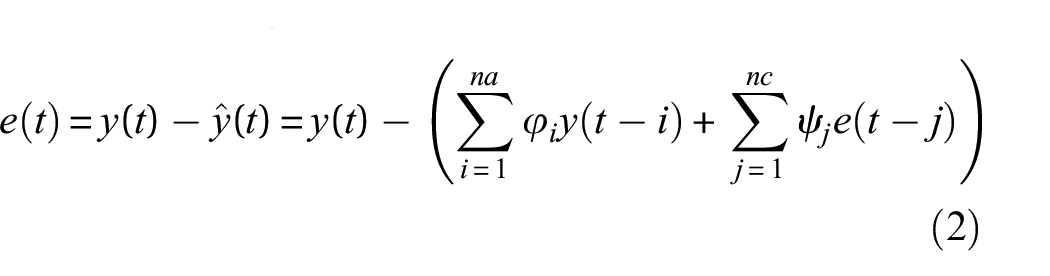
This value corresponds to the difference between the actual vibration signal y(t) and the predicted time series ŷ(t) obtained from the ARMA model. Determination of sufficient orders of time series representations is a crucial part of time series modeling. This is because a selection of appropriate orders guarantees the model accuracy and adequacy. In other words, a sufficient order is one that enables the time series model to generate uncorrelated residuals; otherwise, the order should be improved. 6 Considering the equality of AR and MA orders (na = nc), it is possible to determine them by checking the uncorrelatedness of the ARMA model residuals through the Ljung–Box test. This is a statistical hypothesis test that assesses the correlation between the residual sequences of a time series model. 42 Accordingly, if the p-value of the test is greater than a significance level, one can realize that the residual sequences are uncorrelated. As a result, the iterative order determination technique proposed by Entezami and Shariatmadar 6 is exploited to choose the sufficient orders of the ARMA model. Although this technique was proposed to determine the order of the AR model, its great merit is that one can utilize it for other kinds of time series models.
On the contrary, the process of feature extraction via time series modeling is decomposed into the coefficient-based and residual-based approaches. 6 For the ARMA model, the coefficient-based approach is intended to extract the AR coefficients, which are directly related to the structural properties. In this regard, it is necessary to determine the orders of the ARMA model from the vibration signals of the normal condition and then estimate the AR coefficients of the normal and damaged states by one of the computational techniques. For the use of the model residuals as the DSFs, one initially requires obtaining the orders and coefficients of the ARMA representation from the only normal condition and then extracting the model residuals. In the damaged state, the model information (the orders and coefficients) gained by the normal condition are utilized in an effort to extract the residuals of the ARMA model. The central idea behind the residual-based approach is that the model obtained from the normal state cannot give a reliable goodness-of-fit for time series modeling in the damaged state, which leads to increases in the model residuals. 6 Despite the high applicability of the coefficient-based and residual-based approaches to the feature extraction, the latter does not require any order determination and parameter estimation in the damaged state. Therefore, it seems that the use of the model residuals is more advantageous to the process of feature extraction.
RMDS
The RMDS is a technique for reducing the dimension of sampling data and analyzing the dissimilarity on a set of samples by considering outliers and uncertainties in data. In fact, this technique is an improvement of the MDS,
44
which is sensitive to outliers and uncertainties.
39
The RMDS aims to establish a dissimilarity model that explicitly accounts for outliers and find an embedding matrix by solving the proposed dissimilarity model in an iterative manner.
39
Consider a multivariate data set of n vectors of m-dimensional samples

where h,r = 1, 2, …, n. The dissimilarity should satisfy δh,r(

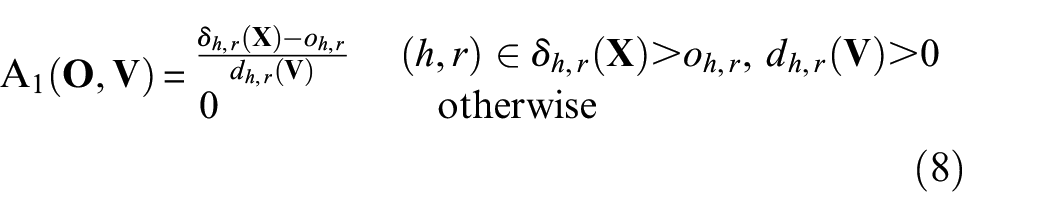
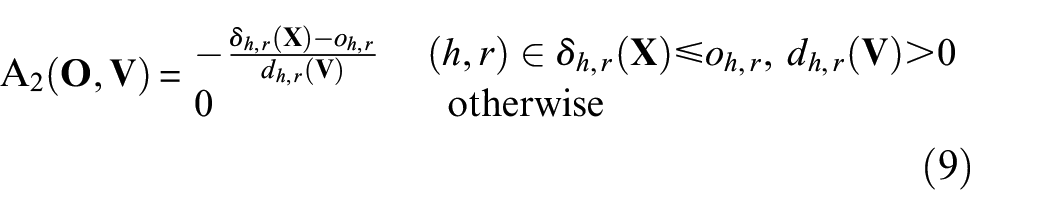
where oh,r denotes an outlier variable of δh,r(
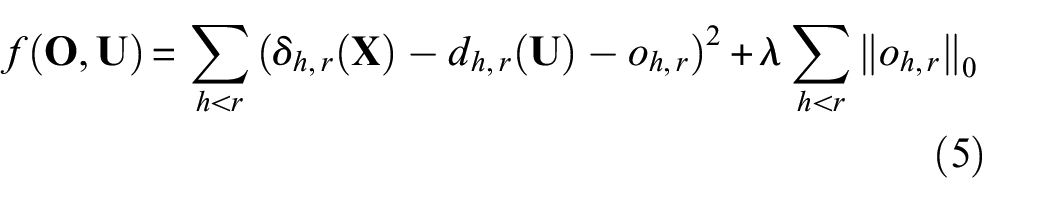
where λ > 0 is a regularization value that controls the sparsity of
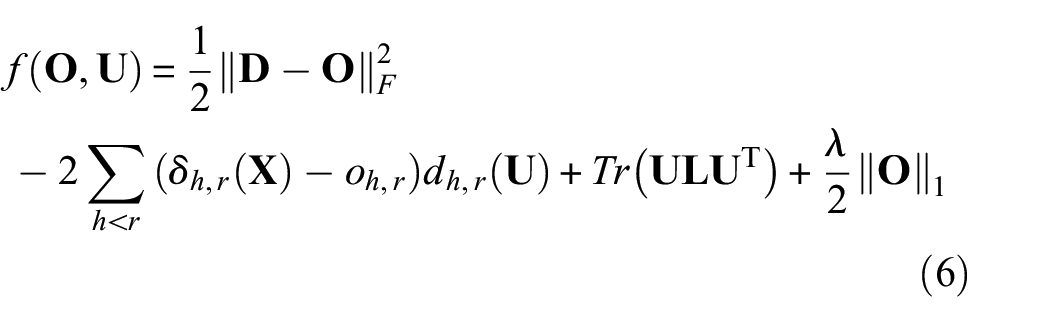
in which

In equation (6),
Accordingly, their Laplacian matrices are given by


where
For δ
h,r
(
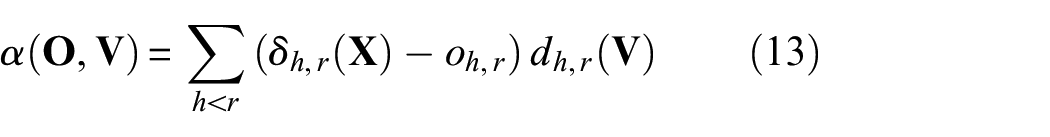
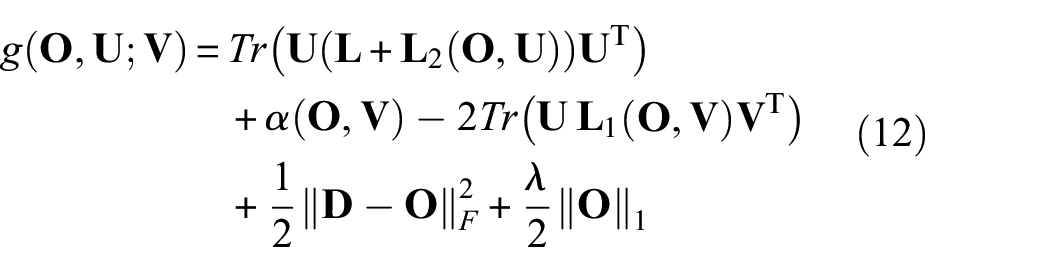
Therefore, the MM approach provides an iterative algorithm to minimize f(


For equation (14), each entry of
which is a scalar Lasso problem, whose solution is expressible by using the operator Sλ as follows

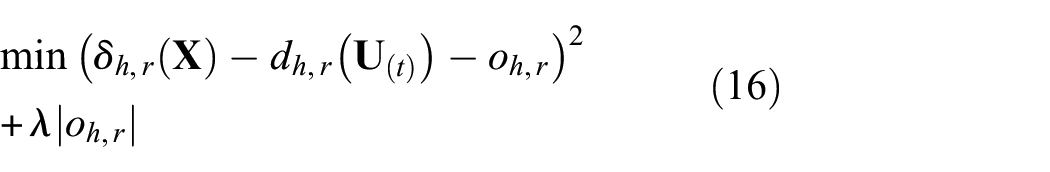
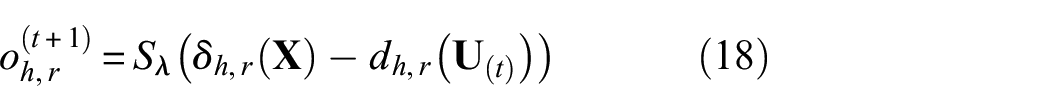
where “sgn” is the sign function and β(x) = max(0, |x|−λ/2). Using these expressions, the solution to equation (16) can be written as
Since the majorizer g is defined via the matrices

where “+” denotes the Moore–Penrose pseudo-inverse. It is worth remarking that the arbitrary matrix
Proposed data-driven method for SHM
Segmentation of high-dimensional DSFs
Assume that
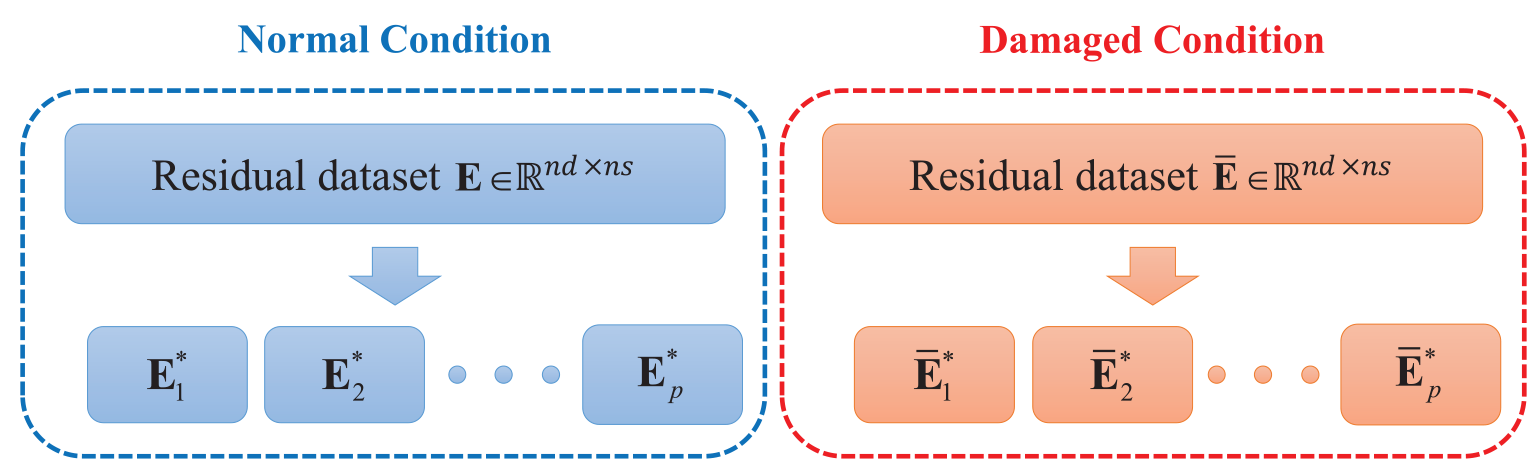
Graphical representation of the segmentation of the residual data sets of the normal and damaged states.
Determination of embedding norm values as damage indicators
After the segmentation of the residual data sets of the normal and damaged states, one initially needs to compute the distance matrices of
To obtain a damage indicator, an embedding norm value is defined by calculating the Euclidean norm of each embedding vector of the undamaged and damaged states. Taking the norm values of all segments (i.e. ||
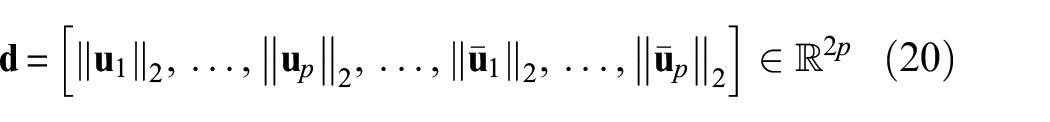
where the first p embedding norm values belong to the normal condition and the remaining quantities are associated with the damaged state. In some cases, the measurement of vibration data is repeated several times in order to increase the reliability of data acquisition. Under such circumstances, there are large volumes of vibration data sets leading to the massive DSFs. Assuming that nm refers to the number of test measurements, one can extract nm sets of the DSFs (i.e. the residual matrices

Flowchart of the proposed RMDS-based method for SHM.
Threshold limit determination
EV statistics
In statistics and probability, the EV theory is a branch of order statistics that focuses on modeling the tails of probability distributions.45,46 For independent and identically distributed data, the EV distributions can only take one of the three families including Gumbel (Type 1), Fréchet (Type 2), or Weibull (Type 3). Assume that H(x) is a non-degenerate limit function. On this basis, the Gumbel distribution model is expressed as
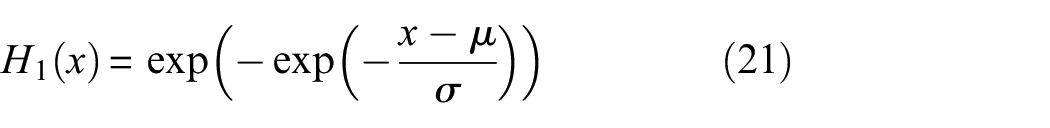
where −∞< x <∞ and σ > 0. Moreover, the Fréchet and Weibull distribution models are formulated in the following forms
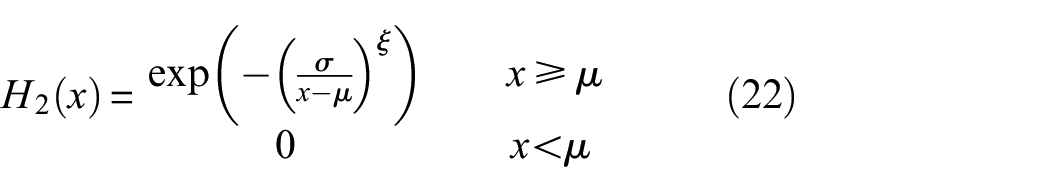
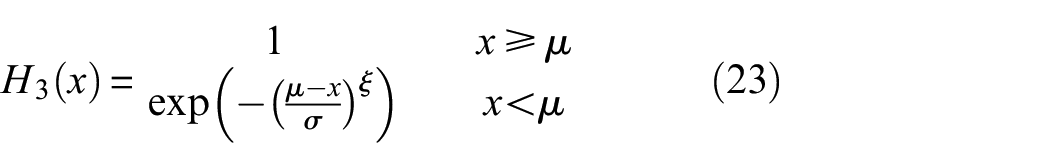
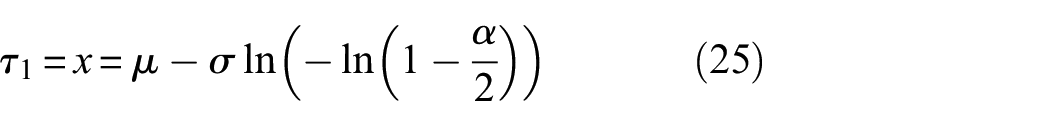
In equations (21) to (23), μ, σ, and ξ are the parameters of the EV distributions known as the location, scale, and shape (i.e. expect for the Gumbel distribution). 46 Given the maximum values of a data set, it is possible to select a proper limit distribution among H1(x), H2(x), and H3(x) and fit an EV distribution model to the maximum values. Once the type of EV distribution and its unknown parameters have been obtained, the threshold limit under a significance level (α) is computed by inverting the limit function of the selected EV distribution. In the Gumbel-type EV distribution, for example, one needs to invert the following equation
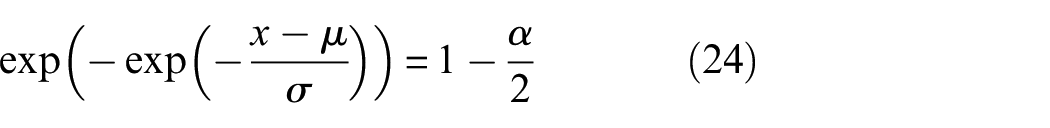
which leads to the upper-limit threshold value (τ1) as follows
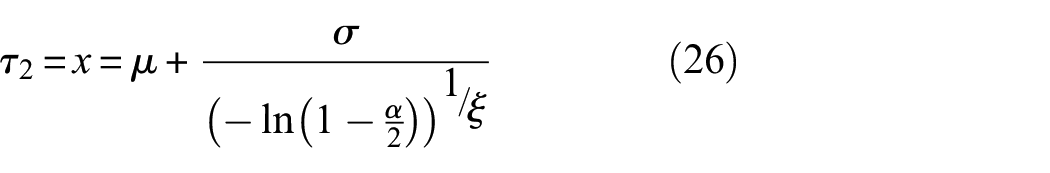
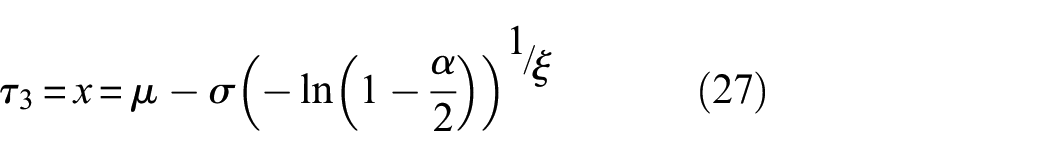
The same process can be implemented for the other EV distributions to define their threshold limits in the following forms
Selection of an appropriate EV distribution by GEV
The process of threshold limit determination by the EV statistics depends strongly on the choice of an appropriate EV distribution among Gumbel, Fréchet, and Weibull families. To deal with this limitation, this article utilizes an effective and simple approach based on the GEV. It is a family of continuous probability distributions developed within the EV theory. The main objective of GEV is to integrate the three EV distributions into a single family of distribution as follows
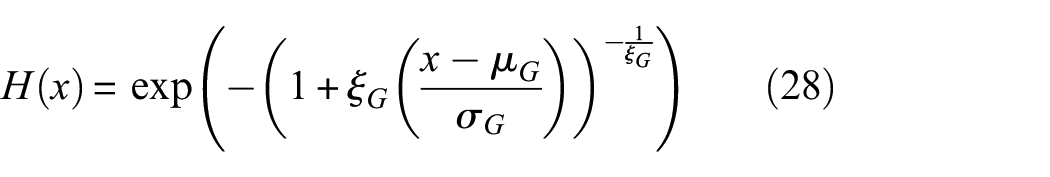
where μG, σG, and ξG represent the location, scale, and shape of the GEV distribution model. The key characteristic of the GEV distribution is the ability to recognize the type of EV distribution. When ξG < 0, the GEV is the Weibull-type EV distribution. In contrast, the GEV conforms to the Fréchet-type EV distribution for ξG > 0. Finally, if ξG is identical to zero, one can realize that the GEV is the Gumbel-type EV distribution. 45 Therefore, it is only necessary to estimate the shape parameter of the GEV and then choose an EV distribution for the threshold limit determination. It is important to mention that the maximum-likelihood estimation (MLE) is applied to estimate the unknown parameters of the EV and GEV distributions.
Applications
In this section, the experimental data sets of two well-known benchmark structures in SHM are used to validate the effectiveness and reliability of the proposed methods. The first one is a model-scale four-story steel structure related to the second phase of the IASC-ASCE SHM problem. 40 Another structure is a full-scale cable-stayed bridge, which belongs to Structural Monitoring and Control (SMC) at the Harbin Institute of Technology in China. 41 In both the structures, ambient vibrations are the main excitation sources.
The IASC-ASCE structure
The four-story structure of the IASC-ASCE problem consisted of two-bay-by-two-bay steel frames with 2.5×2.5 m in plan and 3.6 m in height as shown in Figure 3(a). The members were hot-rolled grade 300 W steel with the nominal yield stress of 300 MPa. The columns and floor beams were constructed by B100 × 9 and S75 × 11 sections, respectively. In each bay, the bracing system included two 12.7 mm diameter threaded steel rods placed in parallel along the diagonal. To make a reasonably realistic mass distribution, there was one-floor slab per bay per floor so that four 1000 kg slabs were placed at each of the first, second, and third levels and four 750 kg slabs on the fourth floor. On each floor, two of the masses were placed off-center to increase the degree of coupling between the translational motions of the structure. Figure 3(b) depicts the plan of the IASC-ASCE structure.
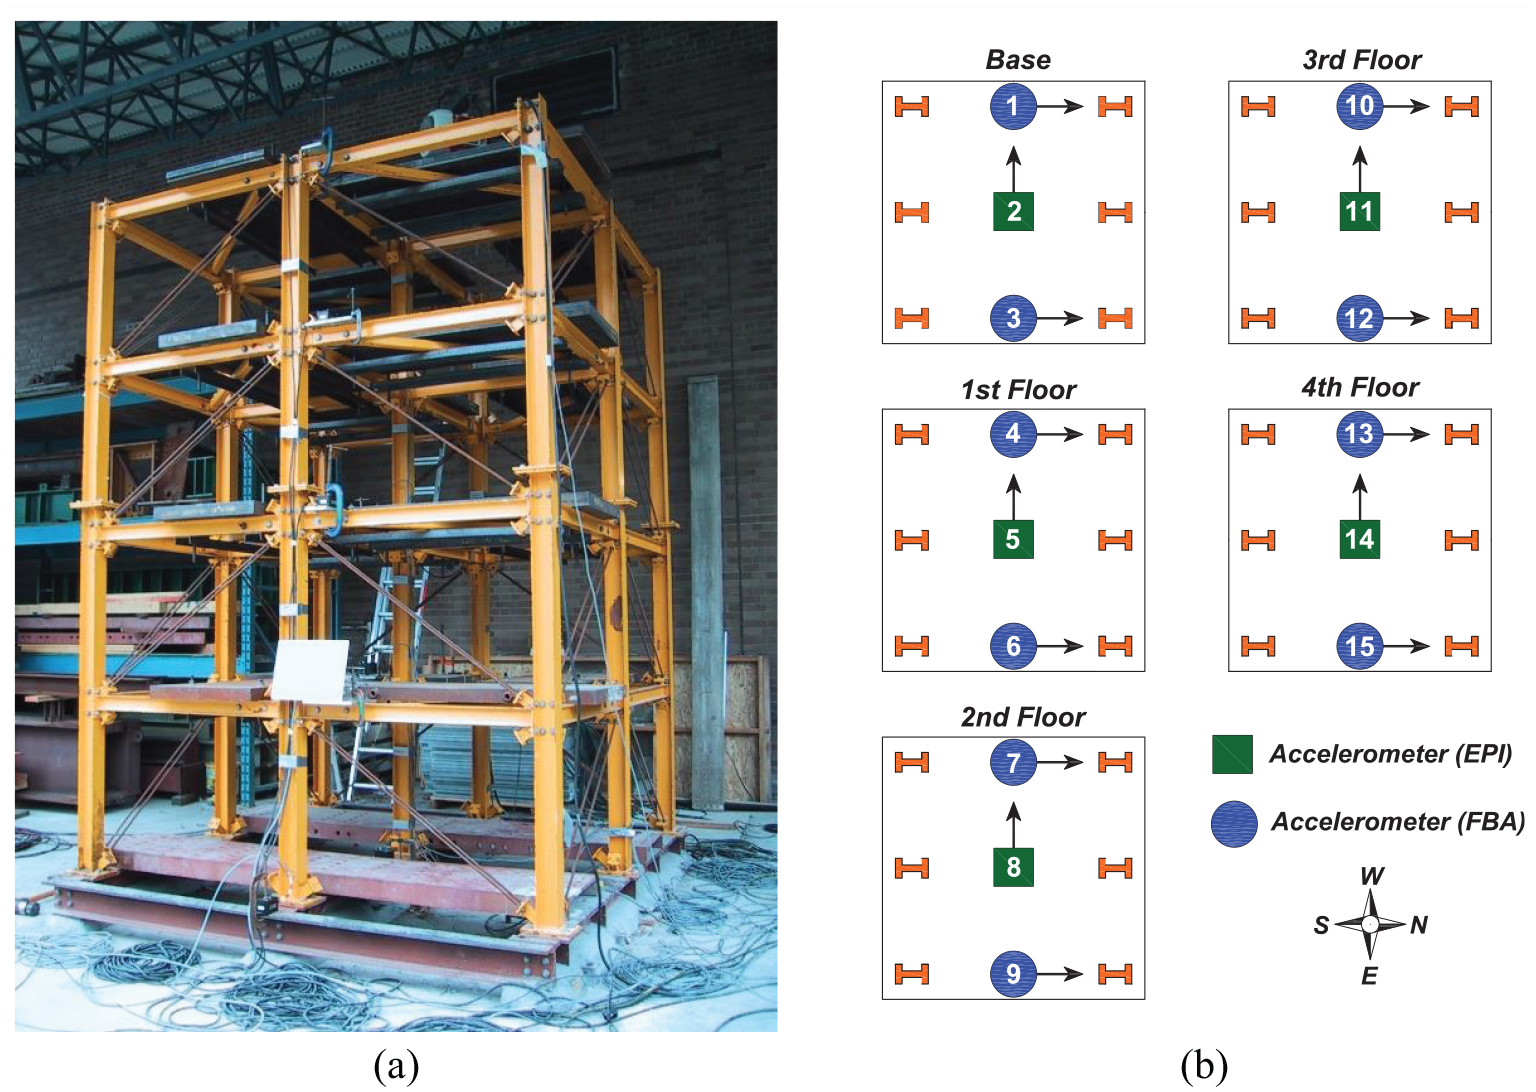
(a) The IASC-ASCE structure and (b) the sensor numbers and locations. 9
The structure was subjected to ambient vibrations including excitations present from the environment due to the wind, pedestrians, and traffic. The vibration signals were acquired by 15 accelerometers with 5 V/g sensitivity distributed on the four stories and the base of the structure as shown in Figure 3(b). The force balance accelerometers (FBA) were located on the east and west frames to measure the acceleration time histories in the north–south direction (along the strong axis). The EPI accelerometers were installed near the center column of the structure to measure acceleration responses in the east–west direction (along the weak axis). It needs to mention that the vibration responses of Sensors 1–3 mounted on the base do not provide relevant information about the dynamic behavior of the structure. For this reason, one can neglect to use them in the process of feature extraction. The damage scenarios of the IASC-ASCE structure were simulated by removing some braces from the east, south-east, and north sides (the first pattern) and loosening bolts at the beam–column connections (the second pattern). This article considers the first damage pattern to evaluate the performance of the proposed methods for early damage detection. Table 1 lists the five damaged cases resulting from the elimination of the bracing systems from the east and south-east sides.
The undamaged and damaged conditions of the IASC-ASCE structure.
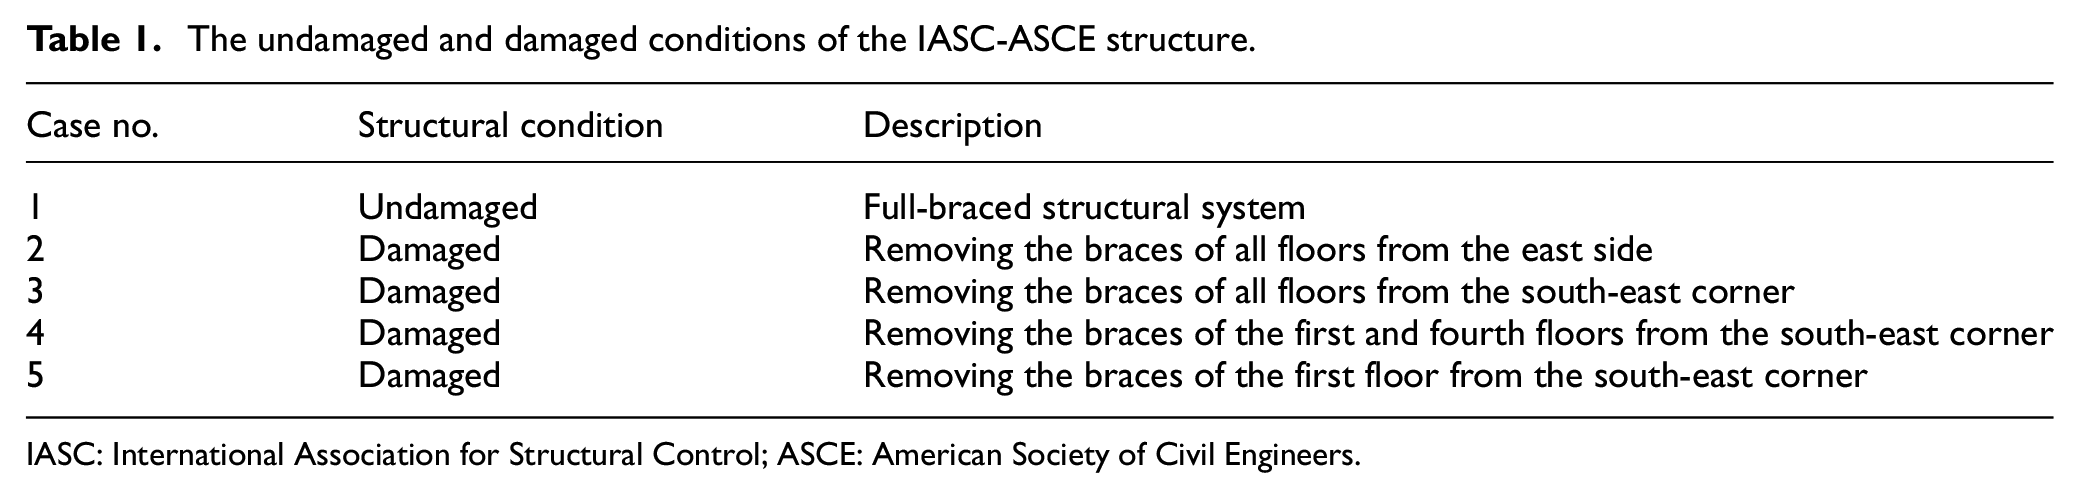
IASC: International Association for Structural Control; ASCE: American Society of Civil Engineers.
Before performing the process of feature extraction, it is necessary to implement some signal pre-processing techniques such as data detrending (i.e. removing linear trends from time series) and standardizing (i.e. normalizing time series by its mean and standard deviation). After that, the initial step of response modeling via the ARMA representation is to determine the model orders (na and nc). Using the iterative order determination technique proposed by Entezami and Shariatmadar 6 for the ARMA model, Table 2 presents the amounts of na and nc as well as the p-values of the Ljung-Box test under the 5% significance level. All p-values in Table 2 are larger than the amount of significant level (0.05), in which case one can infer that the residuals of ARMA models for the undamaged condition are uncorrelated. As a sample, Figure 4 indicates the evolution of the p-values associated with the residuals of Sensor 15. It is clear that the p-value at the 54th iteration is greater than 0.05; hence, the appropriate amount for na and nc is 54.
The orders of ARMA models and the p-values of the Ljung-Box test for the first case.
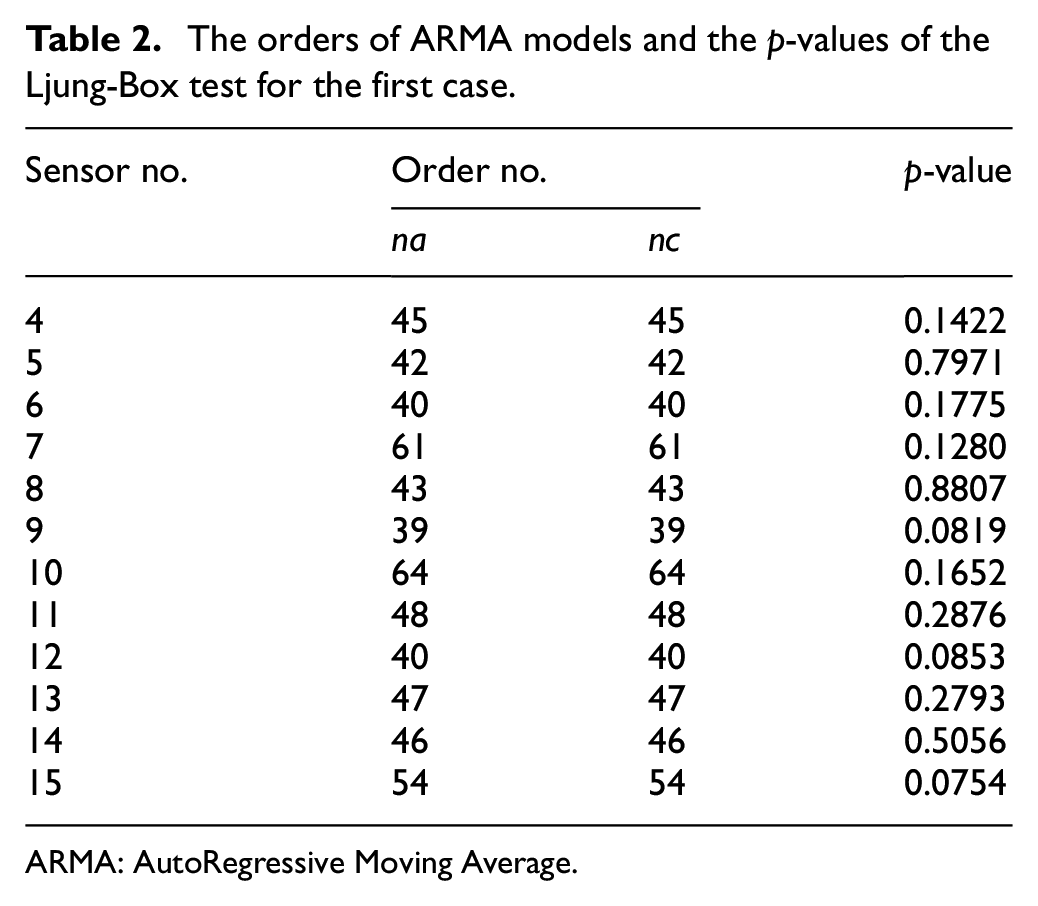
ARMA: AutoRegressive Moving Average.
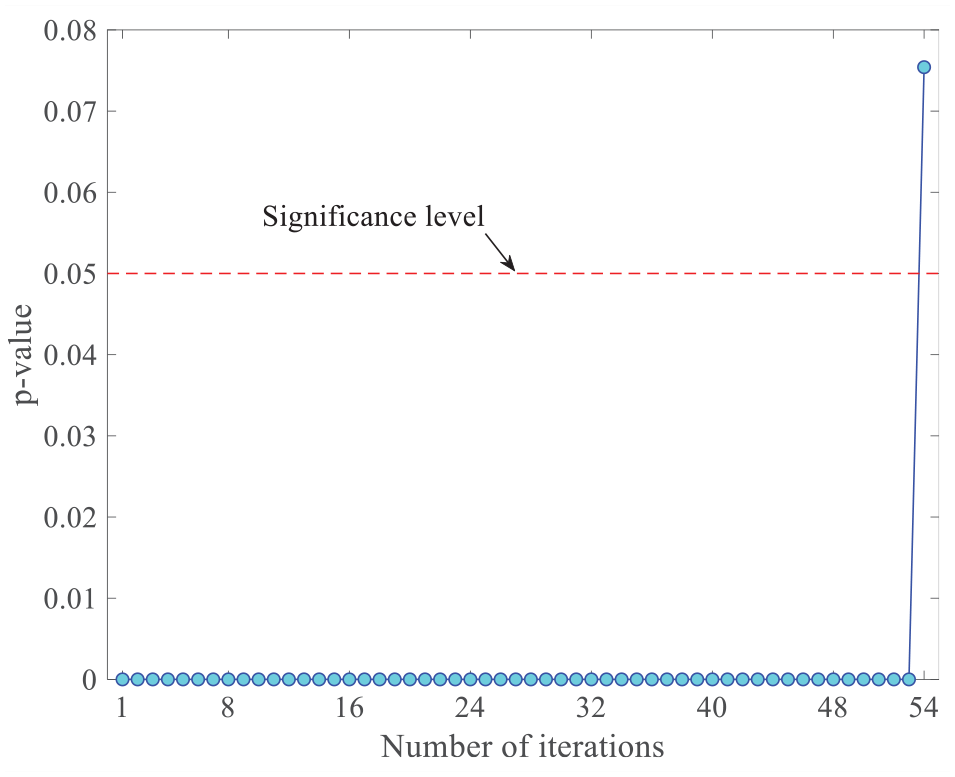
The evolution of p-values of the ARMA residuals at Sensor 15.
Using the orders gained by the iterative algorithm, the coefficients of ARMA models of the normal condition are estimated by the prediction-error technique.
42
In the following, the uncorrelated residuals at all sensors of the first case are extracted as the random DSFs, which make the residual data set (matrix) of the normal condition
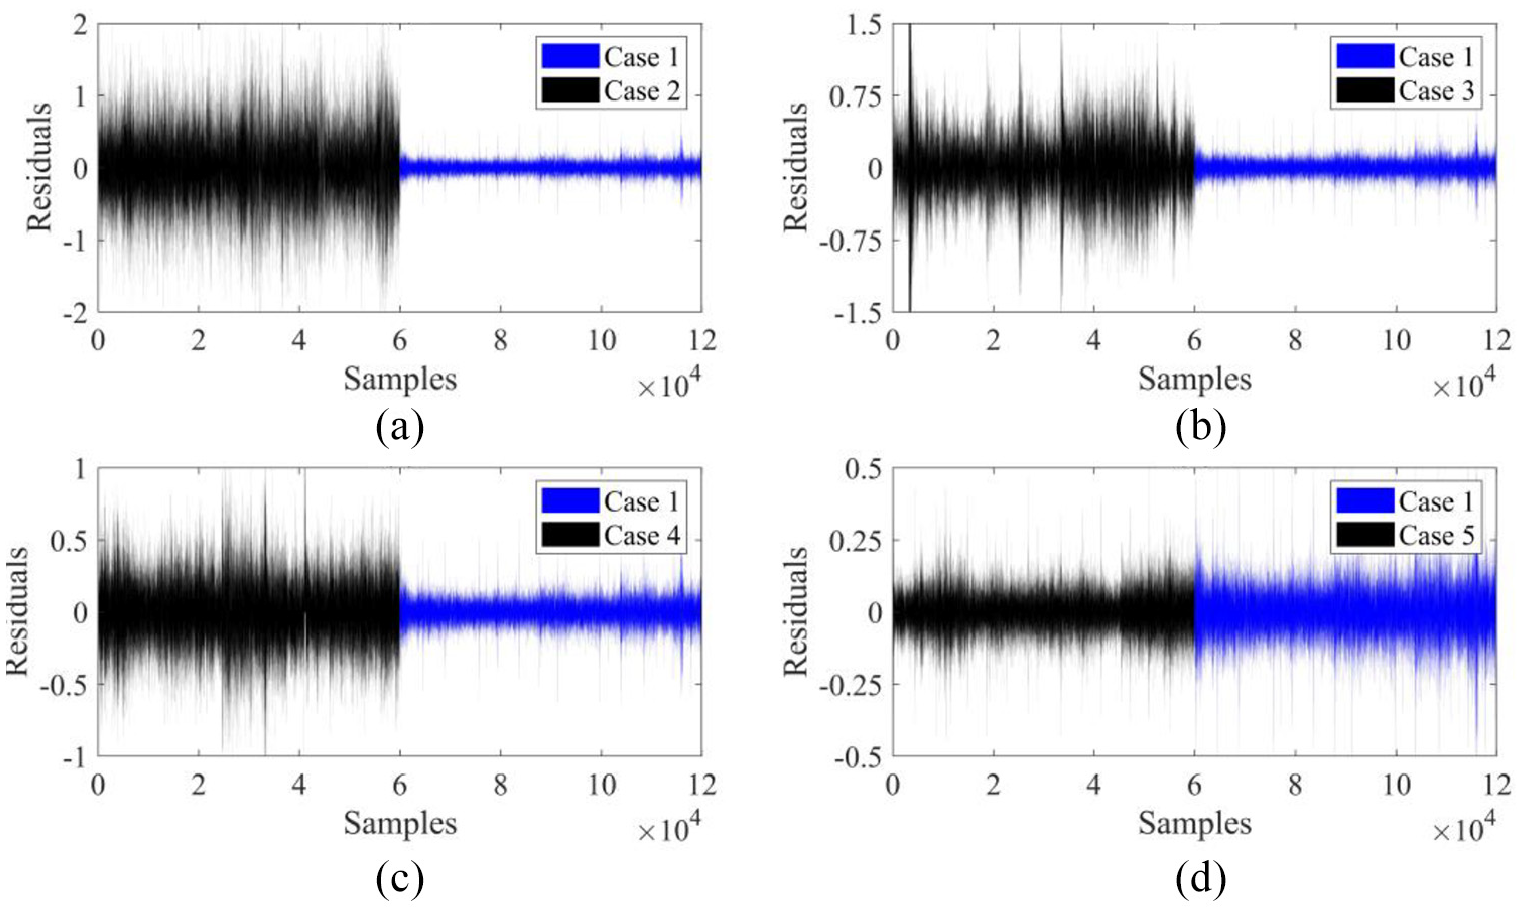
Comparison of the ARMA residuals between the normal and damaged cases at Sensor 15: (a) Case 1 versus Case 2, (b) Case 1 versus Case 3, (c) Case 1 versus Case 4, and (d) Case 1 versus Case 5.
Based on the proposed RMDS-based method, the first step is to divide the residual matrices
For early damage detection, one initially needs to define an accurate and appropriate threshold limit via the EV statistics and the first 60 embedding norm values of
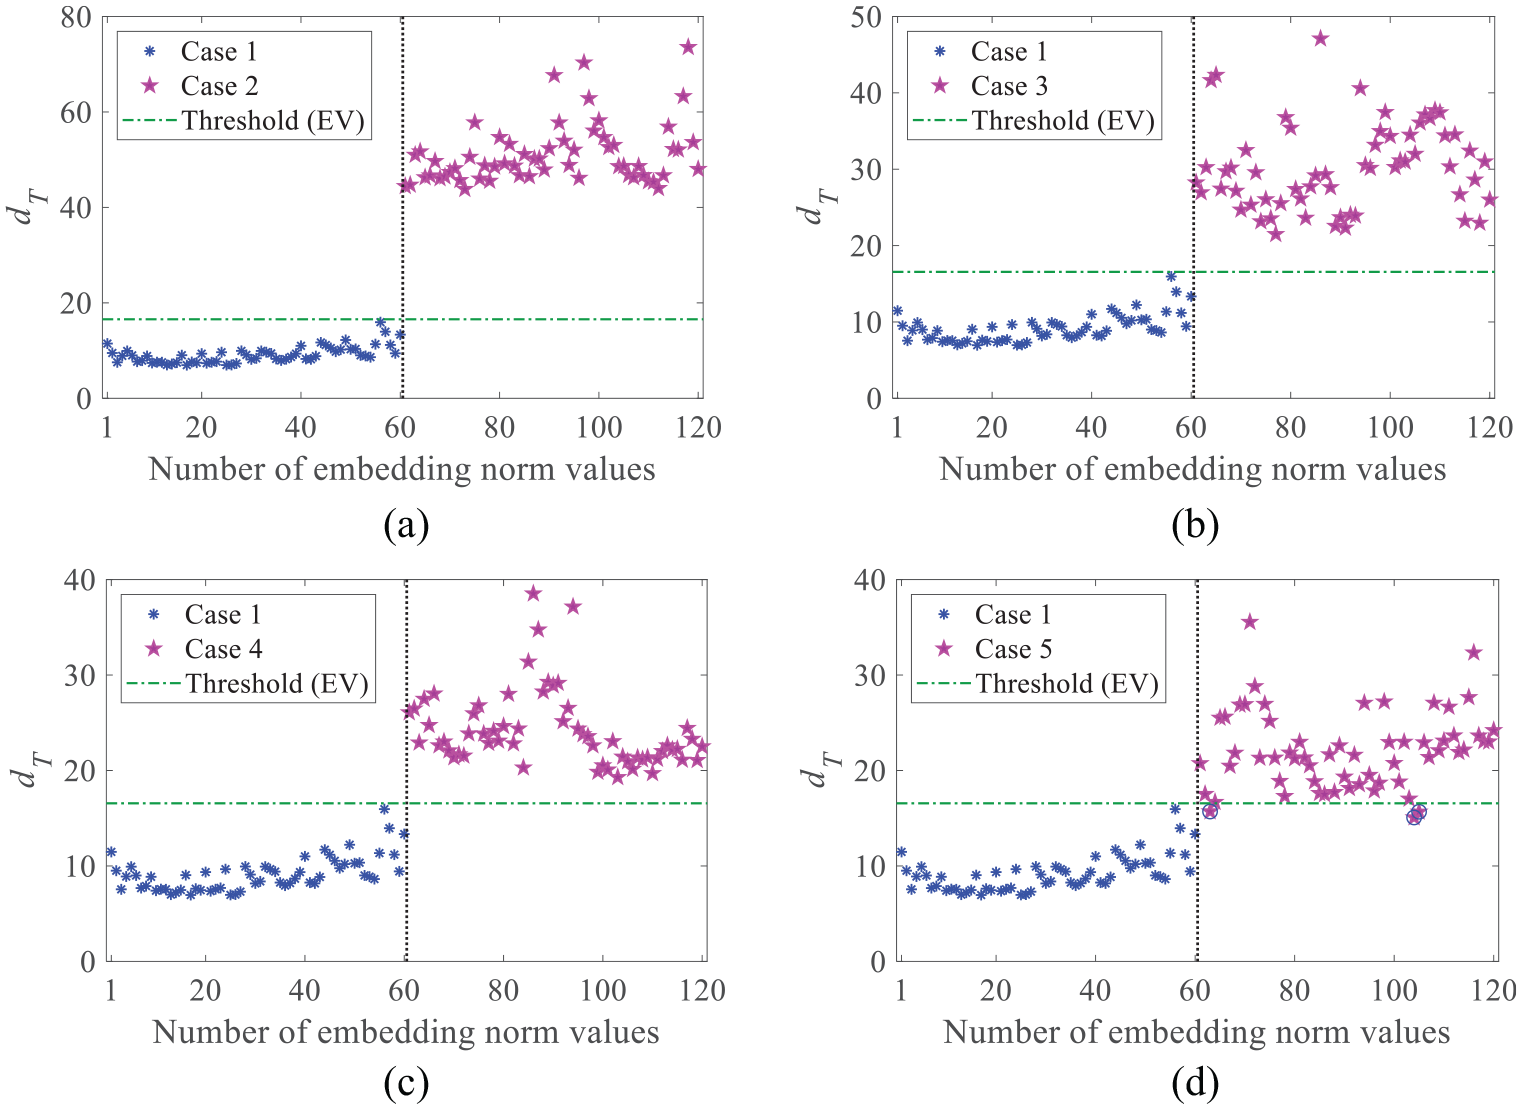
Early damage detection of the IASC-ASCE structure by the proposed RMDS-based method and the EV statistic (Frechet): (a) Case 2, (b) Case 3, (c) Case 4, and (d) Case 5.
To demonstrate the effect of the threshold limit on the early damage detection, a comparative study is conducted by using the standard CI under the normality assumption of the embedding norm values of the undamaged conditions. Using a 5% significance level leading to the 95% CI, the threshold amount is equal to 9.4983. Accordingly, the results of damage detection by the standard CI are illustrated in Figure 7. It is clear that all embedding norm values of Cases 2–5 exceed the threshold value without any Type II error. However, there are numerous false alarms in the embedding norm values of Case 1 (Type I = 35%). For more details, Figure 8 shows the normal probability plot of the first 60 embedding norm values as well as the comparison between the EV theory and standard CI in terms of the rate of false alarm. As Figure 8(a) indicates, there are clear deviations from the straight line in the sense that the probability distribution of the first 60 embedding norm values of
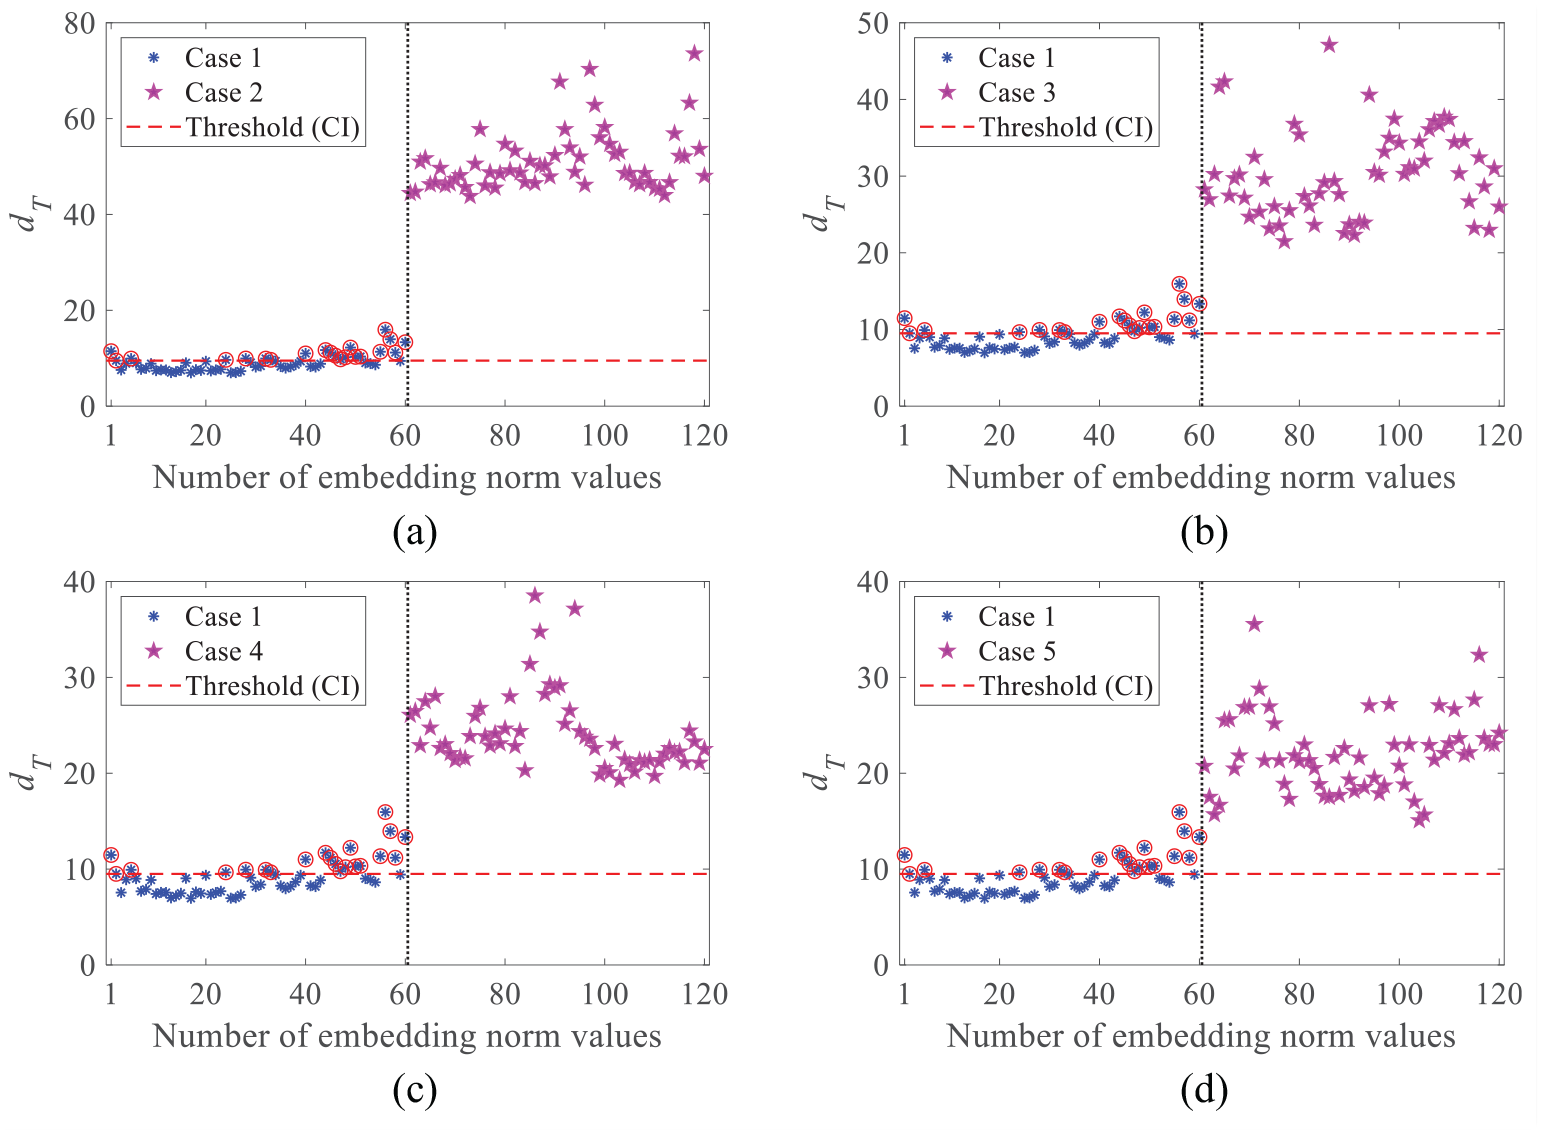
Early damage detection of the IASC-ASCE structure by the proposed RMDS-based method and the standard CI: (a) Case 2, (b) Case 3, (c) Case 4, and (d) Case 5.
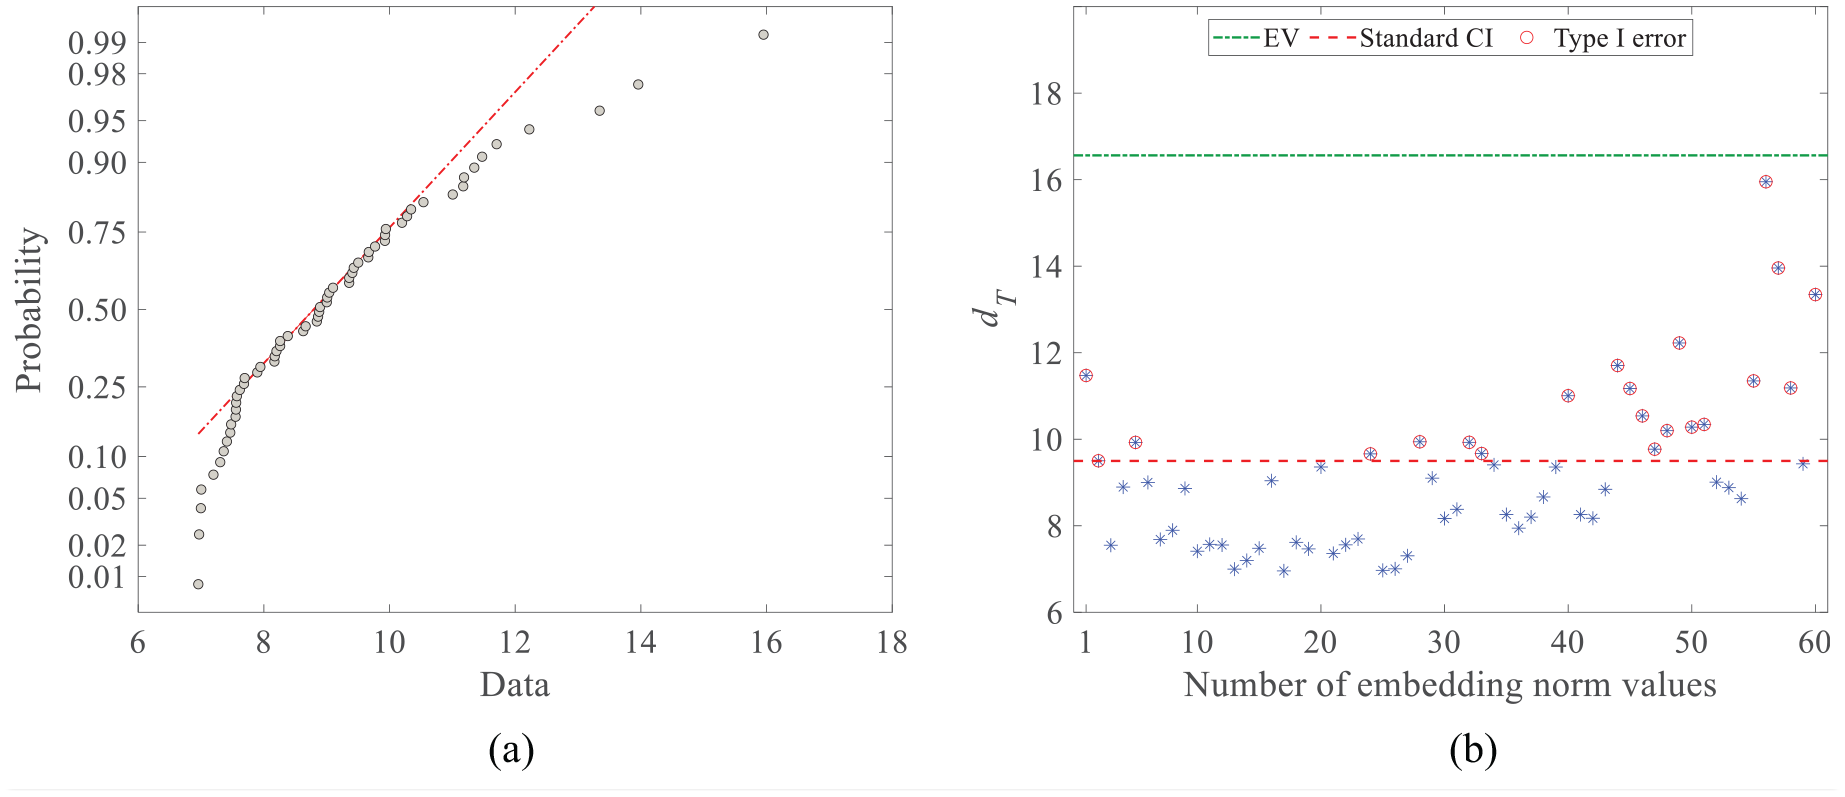
(a) The normal probability plot of the first 60 embedding norm values of the vector
As the other comparative study, it is attempted to compare the proposed RMDS-based method with the well-known MD technique, which is widely used in SHM applications. This statistical distance measures the dissimilarity between two multivariate data sets based on the correlation of data samples. For a reasonable comparison, the Euclidean norms of the residual matrices
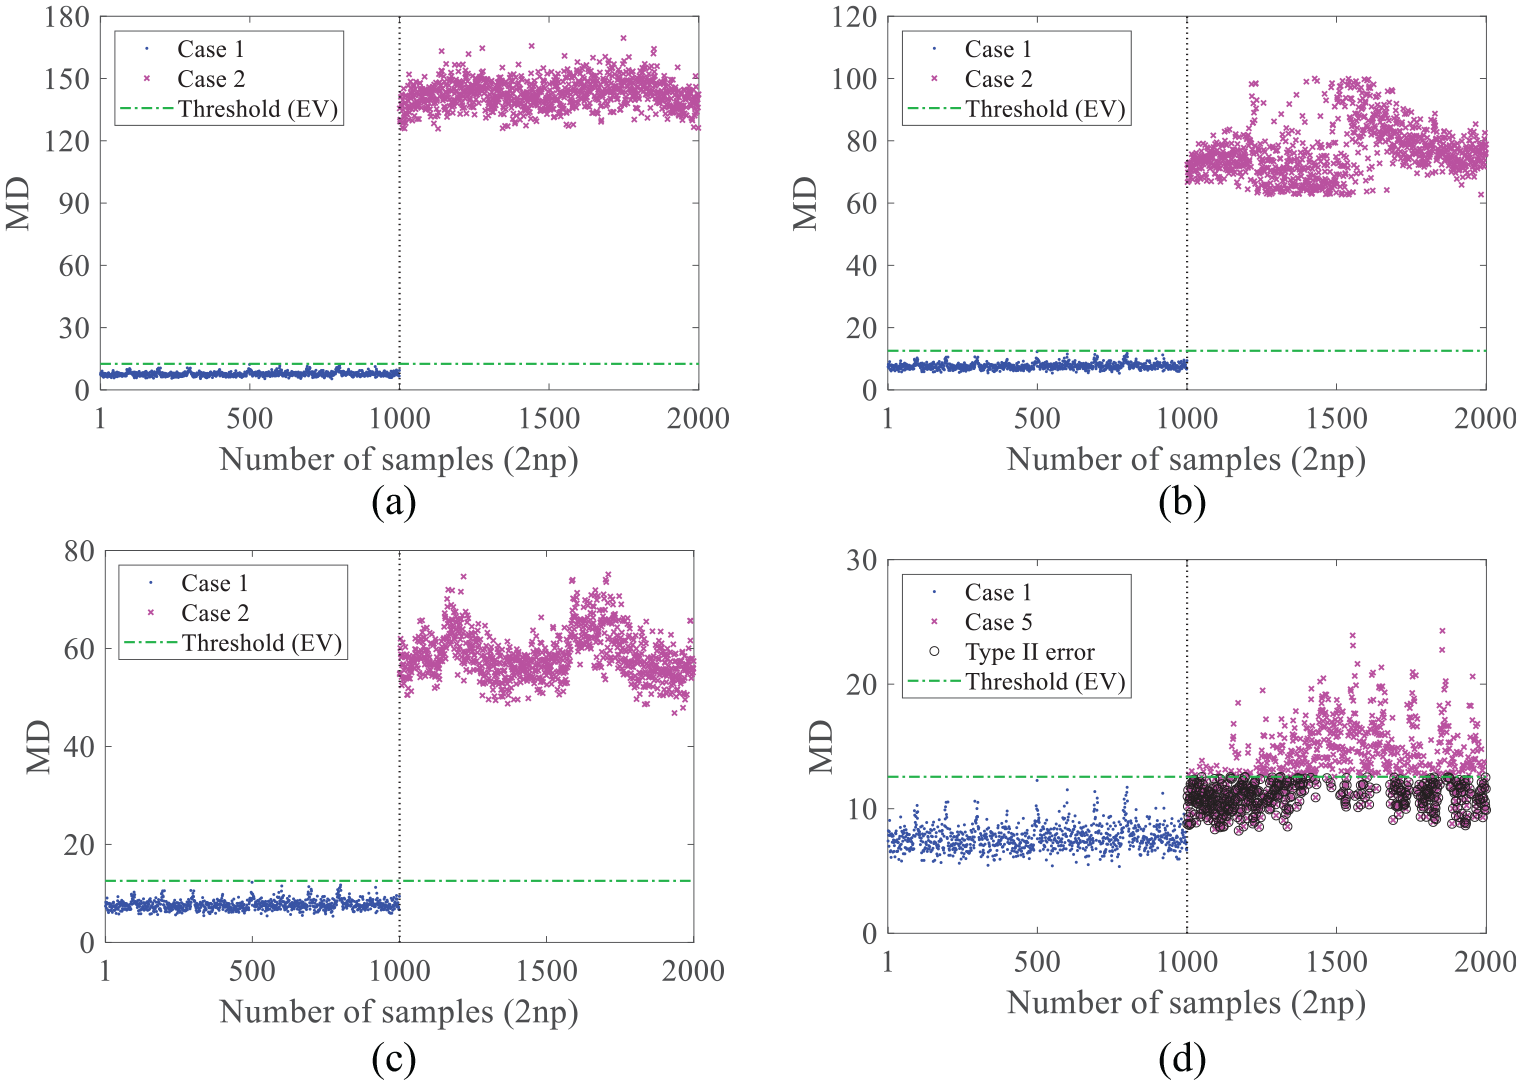
Early damage detection of the IASC-ASCE structure by the conventional MD method and the EV statistic (Weibull): (a) Case 2, (b) Case 3, (c) Case 4, and (d) Case 5.
Finally, Table 3 presents the numbers and percentages of Type I, Type II, and total errors in detecting early damage of the IASC-ASCE structure in all damaged cases by the proposed RMDS-based and the classical MD methods. In this comparison, the two threshold determination approaches (i.e. the EV statistics and the standard CI) are considered as well. As the data in Table 3 appear, the proposed RMDS-based method in conjunction with the EV statistic (Frechet) yields the best performance in terms of the smallest rates of the triple errors except for the Type II error in Case 5, where only 3 points from 60 norm values fall below the threshold as shown in Figure 6(d). The same conclusion can be reached for the MD technique. However, this feature classification approach suffers from an extremely large Type II error in Case 5 leading to a considerable total error as well. This conclusion proves the superiority of the proposed method over the classical MD technique. On the contrary, the numerical comparison between the EV statistics (i.e. Frechet and Weibull) and the standard CI reveals that the latter, despite its inconsiderable Type II errors, is not a reliable approach to estimating an accurate threshold for early damage detection owing to large Type I and total errors in both feature classification methods. It is worth remarking that the good performance of the EV statistics depends directly on the use of a robust feature classification technique (e.g. the proposed RMDS-based method) with high damage detectability.
Performance evaluation of the feature classification methods using the EV statistics and standard CI for the threshold limit determination.
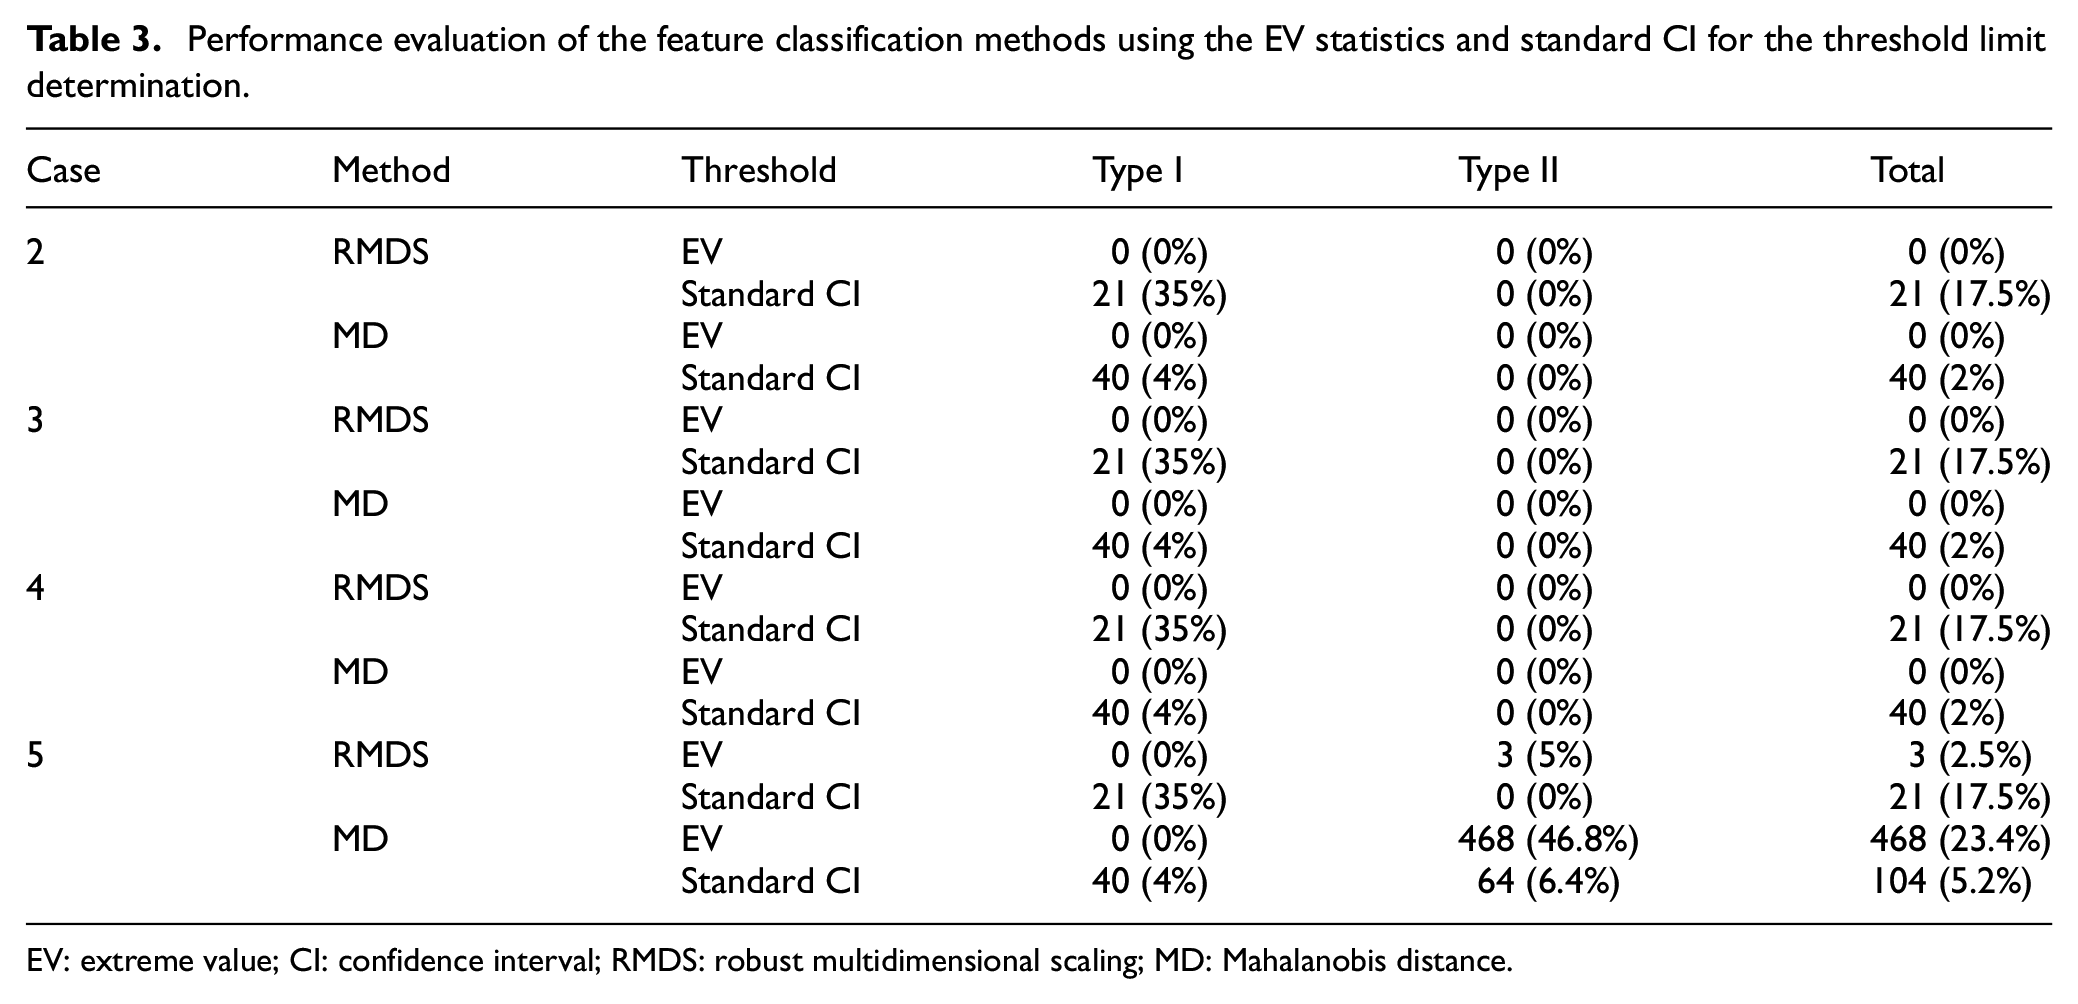
EV: extreme value; CI: confidence interval; RMDS: robust multidimensional scaling; MD: Mahalanobis distance.
The cable-stayed bridge
The Tianjin-Yonghe Bridge is one of the earliest cable-stayed bridges with continuous pre-stressed box-girder constructed in China, which was opened to traffic since December 1987. It consists of a total length of 514.4 m including the main span of 260 m and two side spans of 25.15 and 99.85 m as depicted in Figure 10. The bridge is 510 m long and 11 m wide including 9 m for vehicles and 2×1 m for pedestrians. The concrete towers, connected by two transverse beams, include the height of 60.5 m. More details of the bridge are available in the study by Li et al. 41 In 2005, after 19 years of operation, some serious cracks were found at the bottom of a girder segment over the mid-span. In addition, some cables near the anchors were severely corroded. After a major rehabilitation program for replacing the damaged girder segment and all the cables between 2005 and 2007, a sophisticated SHM system organized by the Center of SMC at the Harbin Institute of Technology in China was applied to monitor the bridge in 2007. During a routine inspection in August 2008, new damage patterns were found in the girders of the bridge. Due to the availability of acceleration time histories of the health status of the bridge on 17 January 2008 and the damage status on 31 July 2008, it was possible to evaluate the performance of the proposed methods for early damage detection. 41
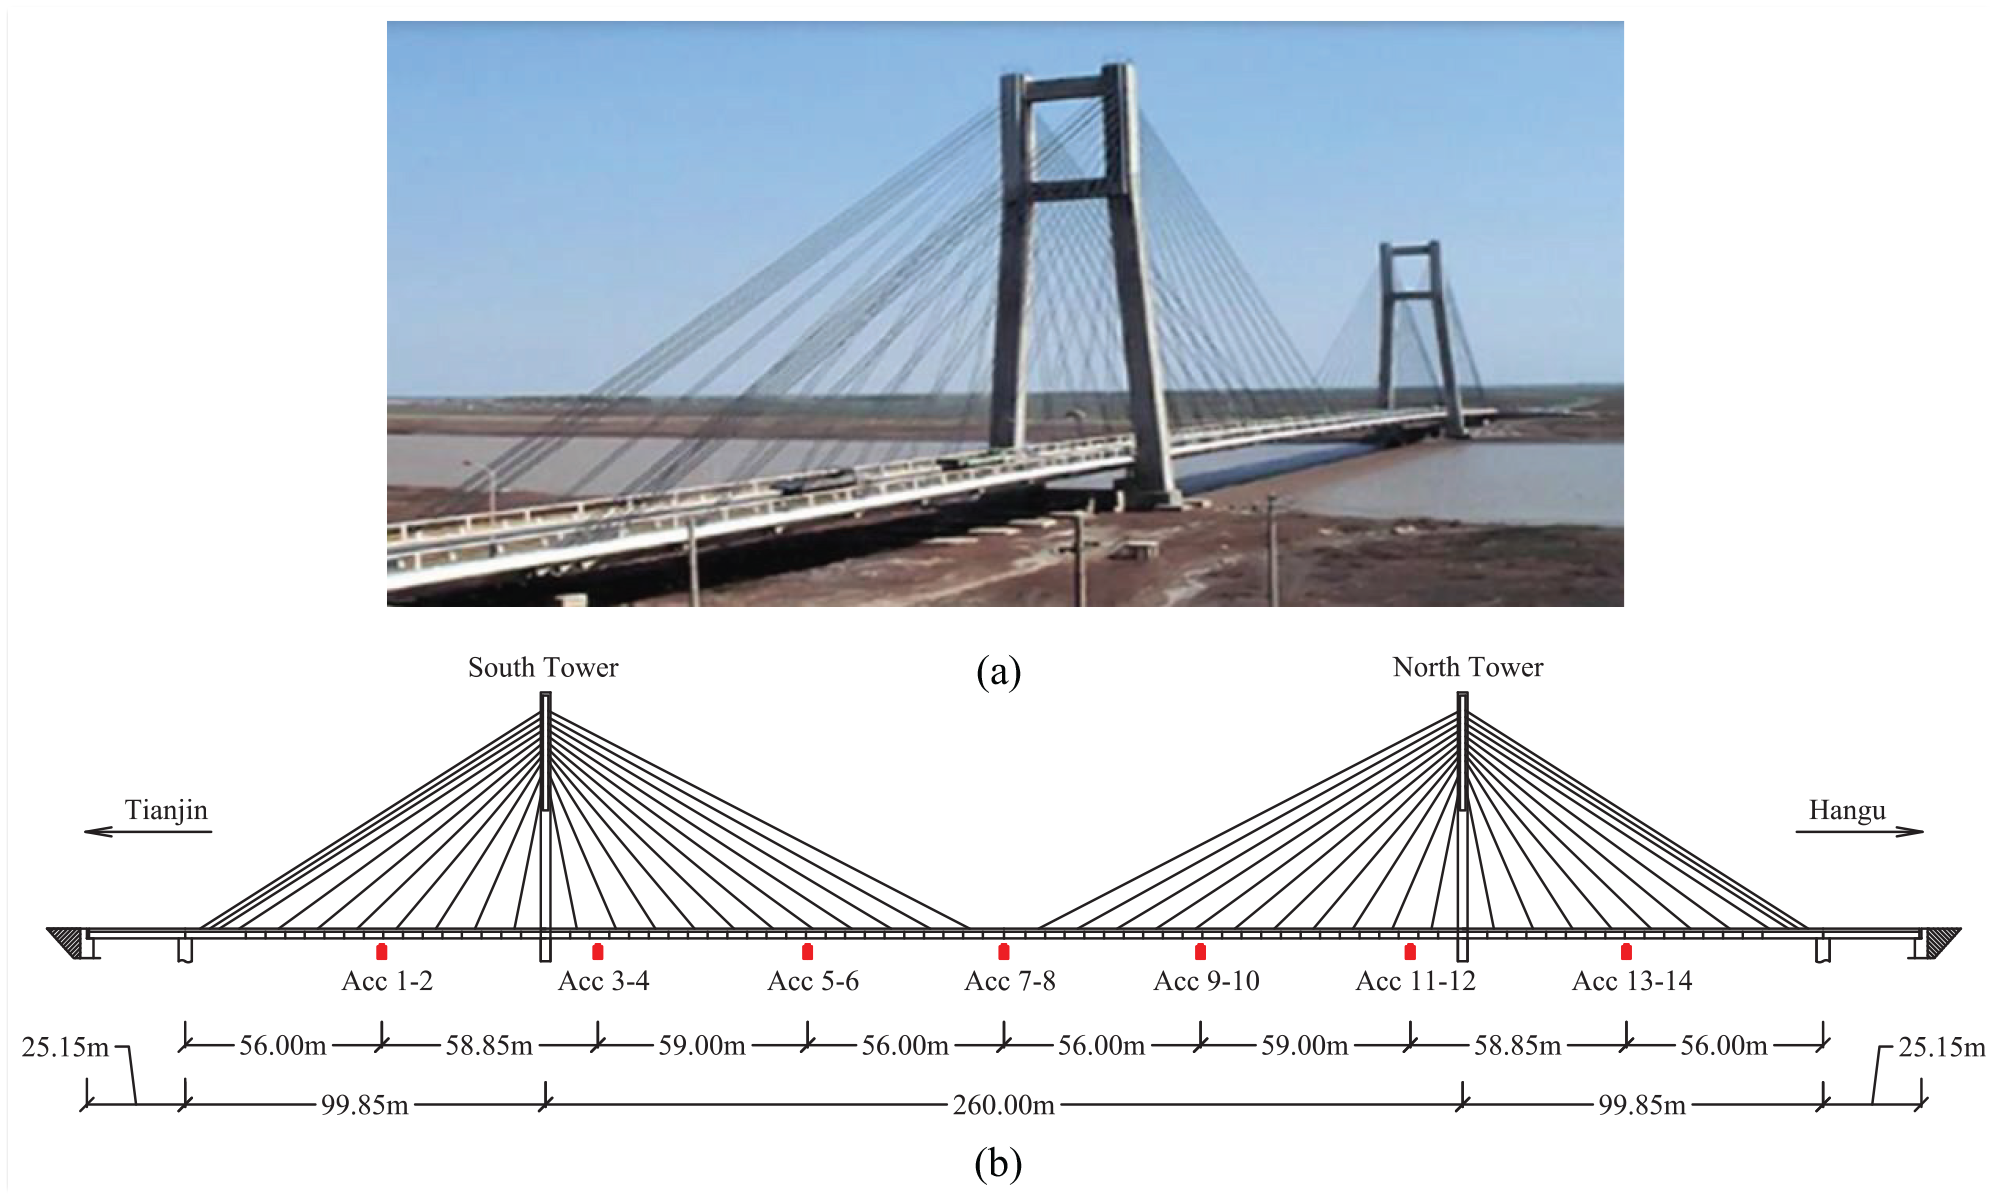
The Tianjin-Yonghe Bridge: 41 (a) general view and (b) the dimensions and sensors.
The acceleration time histories of the normal and damaged conditions were acquired from 14 single-axis accelerometers during 24 h (nm = 24) under the sampling frequency of 100 Hz and time interval of 0.01 s. On this basis, 360,000 samples (nd) were measured by each accelerometer at each hour. According to initial data analysis on the acceleration data sets, it is found that the data of the 10th accelerometer is out of order due to meaningless measurement samples. Hence, the acceleration time series of the 13 accelerometers (ns = 13) are used to fit ARMA models to the vibration responses and extract the model residuals of the normal and damaged states as the high-dimensional DSFs. Similar to the previous application case, the signal pre-processing techniques including data detrending and standardizing are carried out to prepare the time series data sets for ARMA modeling. Using the iterative order determination algorithm based on the Ljung-Box test under the 5% significance level, Table 4 lists the orders of ARMA models of the accelerometers 1–9 and 11–14 along with their p-values for the first test measurement on 17 January 2008 (the healthy state). As can be observed, all p-values are larger than 0.05, which means that the ARMA residuals of all accelerometers are uncorrelated. Furthermore, Figure 11 illustrates the evolution of the p-values regarding the ARMA residuals of the sixth accelerometer in 23 iterations.
The orders of ARMA models and the p-values of the Ljung-Box test in the first test measurement on 17 January 2008.
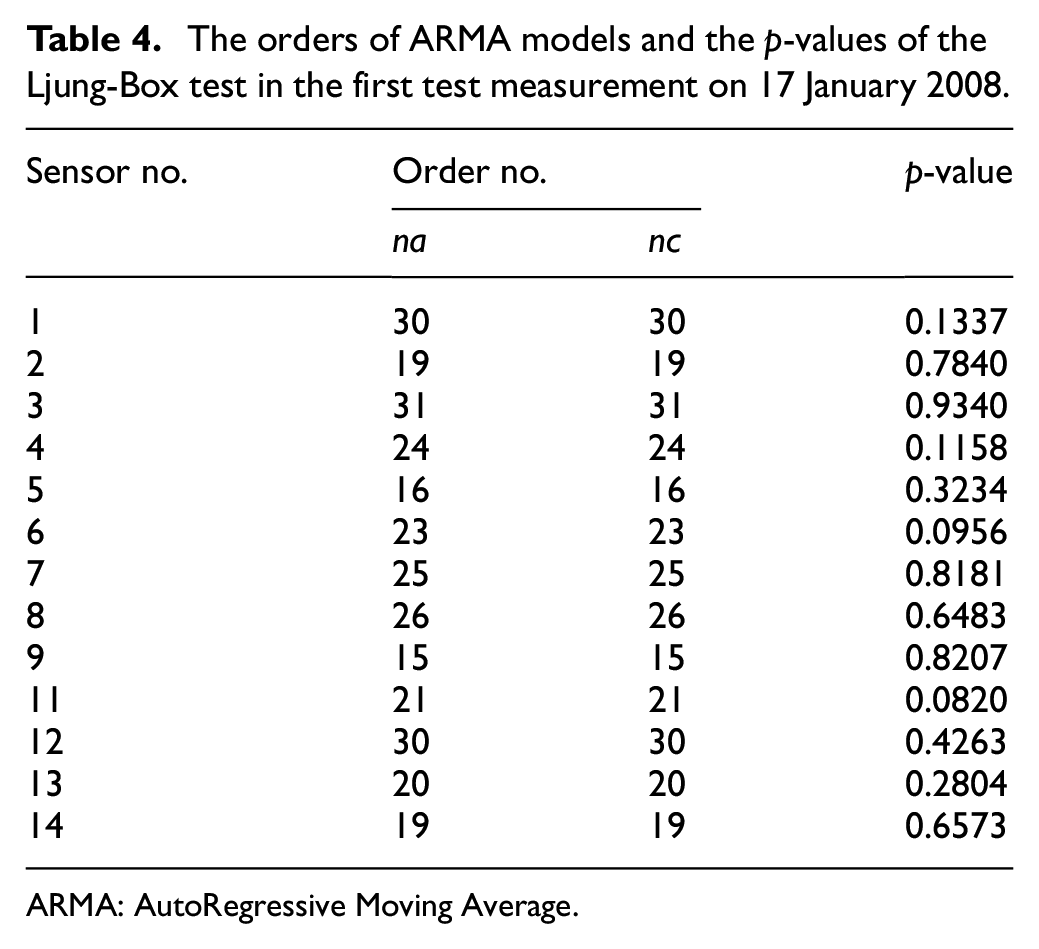
ARMA: AutoRegressive Moving Average.
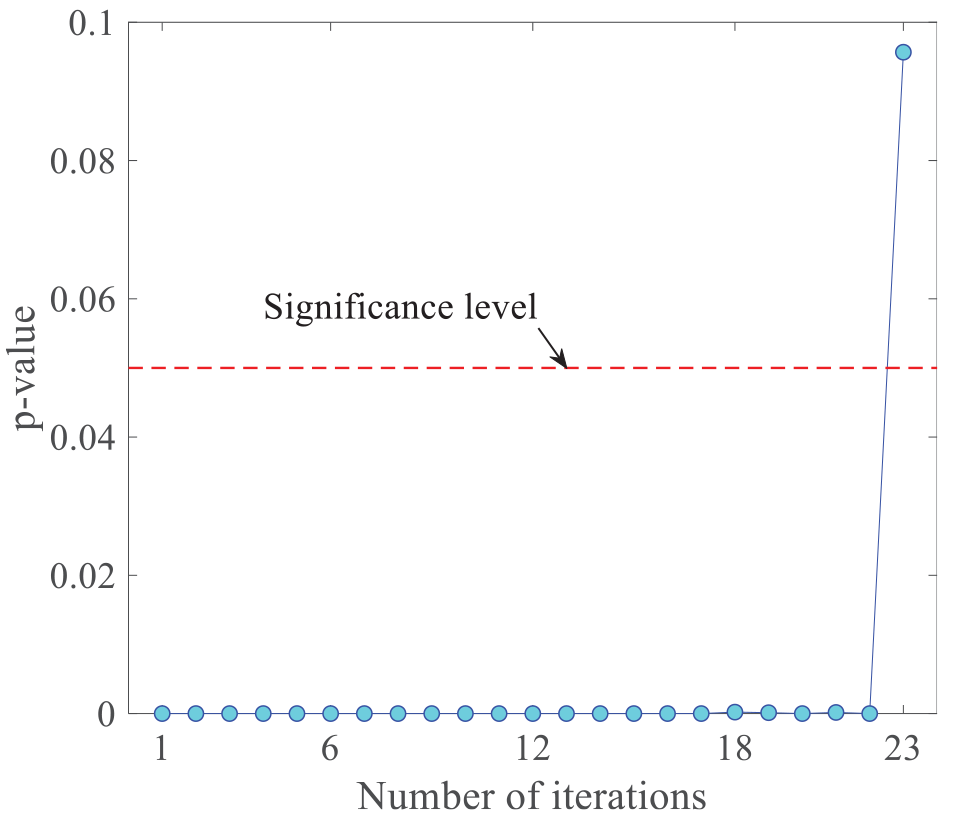
The evolution of the p-values of the ARMA residuals regarding the sixth accelerometer.
Having considered the ARMA orders, the model coefficients are estimated by the prediction-error technique. Subsequently, the uncorrelated residuals of the accelerometers 1–9 and 11–14 on 17 January 2008, are extracted as the DSFs of the normal condition leading to the residual matrix
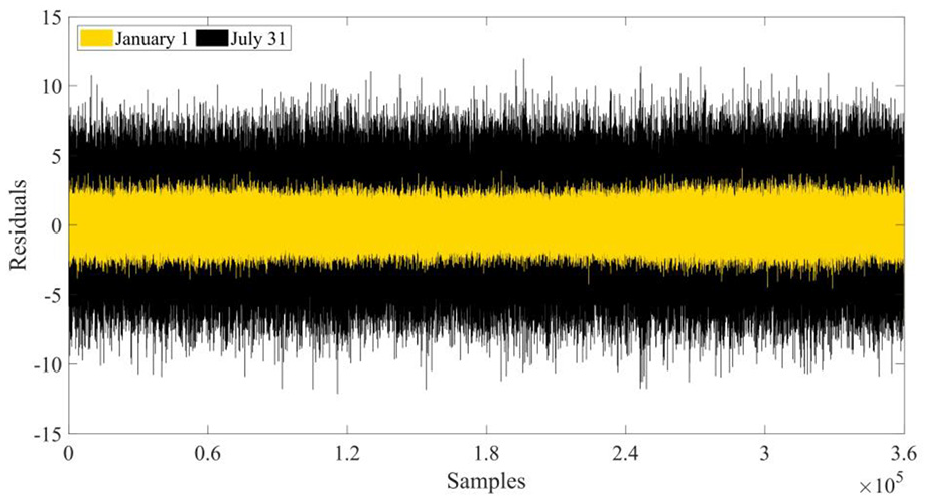
The residual samples of ARMA models at the ninth accelerometer regarding the normal and damaged states in the first test measurement.
The increases in the residuals of the ARMA model on 31 July 2008 demonstrate the occurrence of damage. The same conclusion is obtainable for the other accelerometers and other test measurements. However, the direct comparison of the high-dimensional residual samples at each sensor and each hour may cause a complex and time-consuming process. This limitation suggests the necessity of using a robust and efficient approach such as the proposed RMDS-based method for damage detection. Based on the first step of the proposed method, the residual matrices
The GEV distribution is initially fitted to the first 4800 embedding norm values of
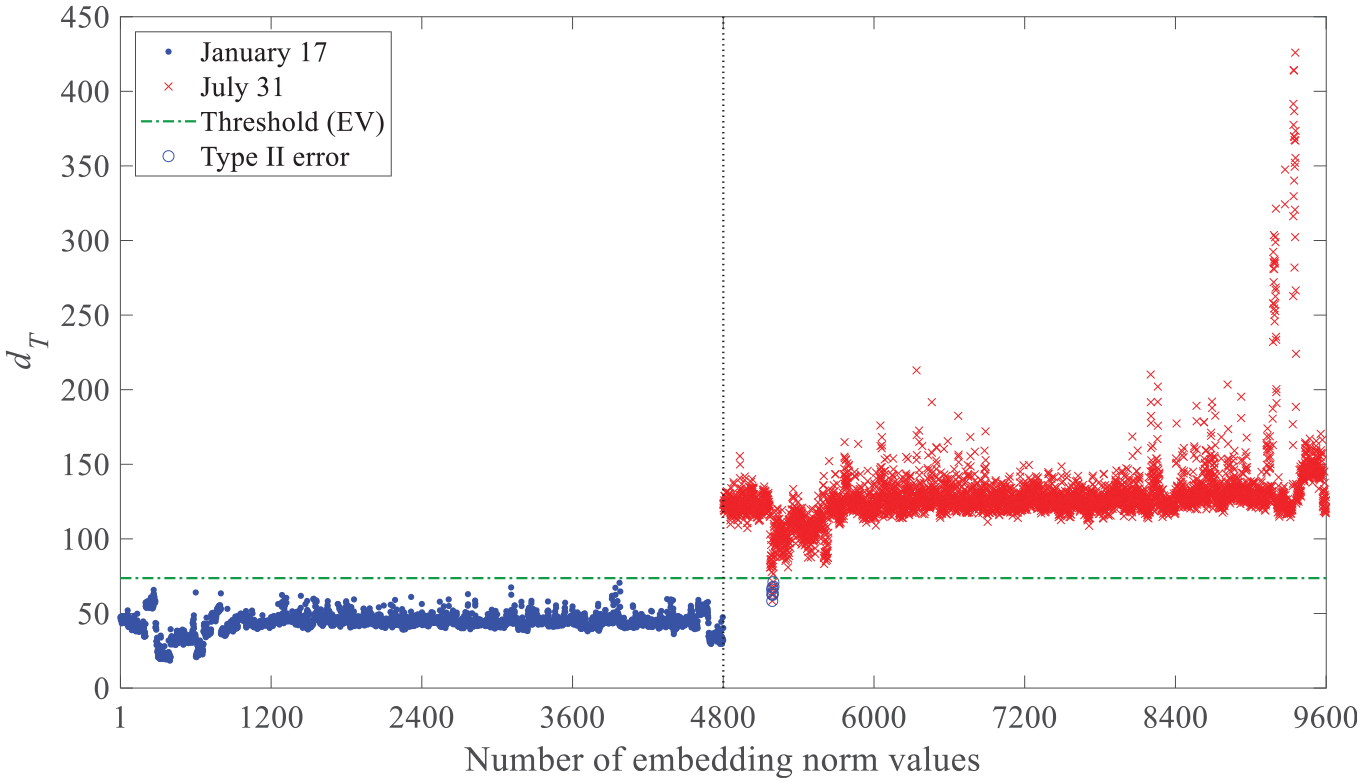
Early damage detection of the Tianjin-Yonghe Bridge by the proposed RMDS-based method and the EV statistic (Frechet).

Early damage detection of the Tianjin-Yonghe Bridge by the proposed RMDS-based method and the standard CI.
For more evaluation, Figure 15 indicates the normal probability of the embedding norm values 1–4800 along with the comparison between the EV theory and standard CI in terms of the rate of false alarm. It is apparent from Figure 15(a) that the probability distribution embedding norm quantities is non-normal resulting from large deviations from the straight line. Therefore, it can be expected that the standard CI based on the normality assumption is not able to estimate an accurate and reliable threshold limit. In this regard, one can observe in Figure 15(b) that the use of EV theory gives no false alarm, whereas the standard CI suffers from the high rate of Type I error.
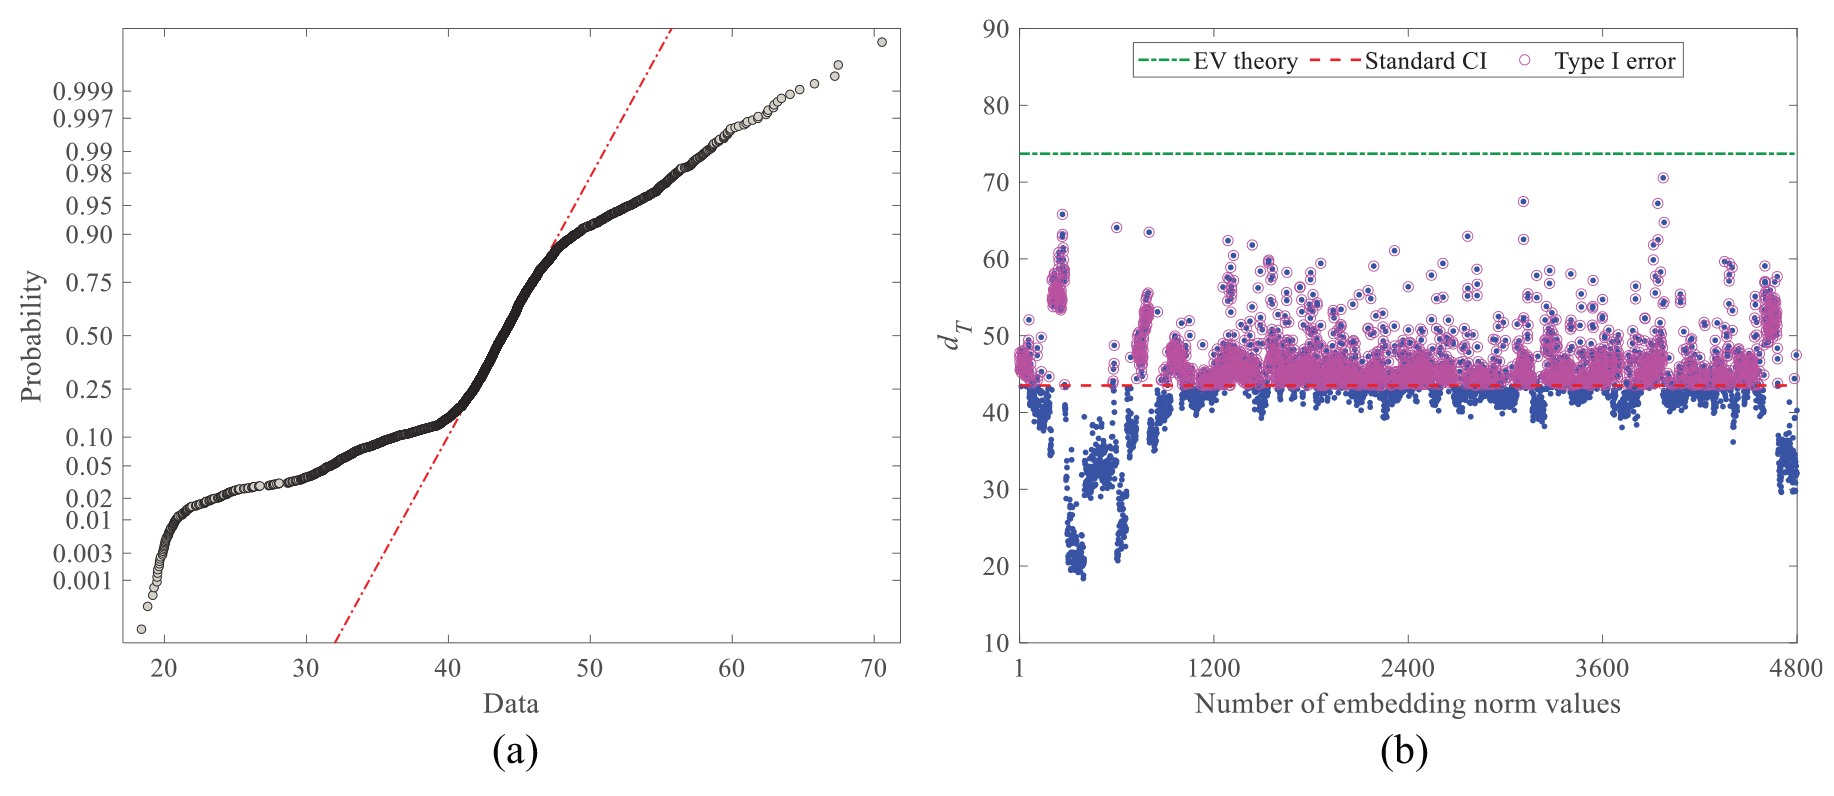
(a) The normal probability plot of the first 4800 embedding norm values of
Similar to the preceding application case, the performance of the proposed RMDS-based method is compared with the classical MD technique. For this purpose, the Euclidean norms of the residual matrices
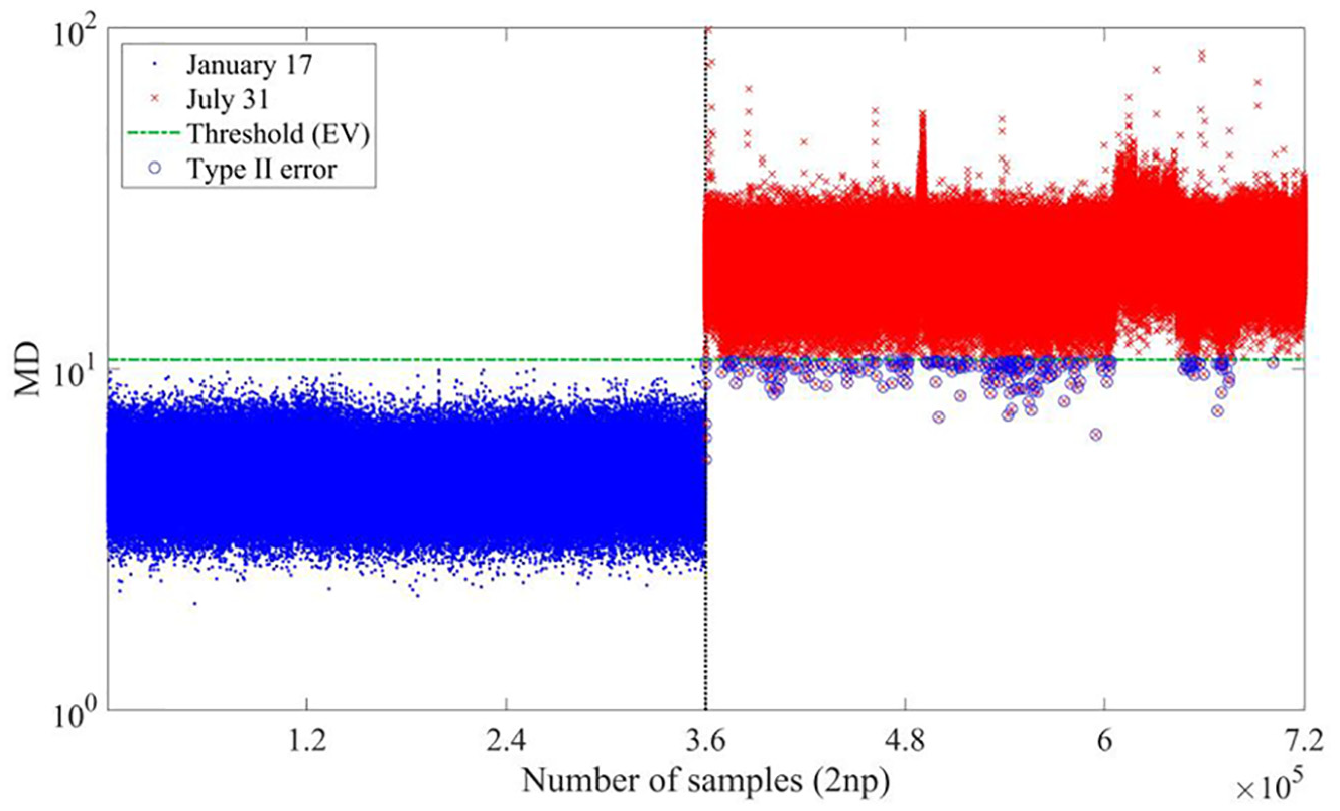
Early damage detection in the Tianjin-Yonghe Bridge by the classical MD technique and the EV statistic (Weibull).
Eventually, the final comparison is concerned with the numerical evaluations of the performances of the proposed RMDS-based and classical MD methods based on Type I, Type II, and total errors. Using the two threshold determination approaches, Table 5 gives the numbers and percentages of these errors. As can be perceived, the best performance in terms of the smallest rates of Type I and total errors belongs to the proposed RMDS-based method in conjunction with the EV statistic (Frechet). Furthermore, the EV theory is highly superior to the standard CI owing to smaller Type I and total errors. Although the standard CI provides smaller numbers and percentages of Type II error, the corresponding amounts concerning the proposed RMDS-based method are inconsiderable (i.e. only 8 points from 4800 norm values fall below the threshold limit gained by the EV statistic). However, this conclusion is not valid for the outputs of the MD metric based on the EV theory. In summary, the numerical evaluations in Table 5 confirm that the proposed RMDS-based method outperforms the classical MD technique and it is preferable to using the EV statistics for the threshold limit determination.
Performance evaluation of the feature classification methods using the EV statistics and standard CI for the threshold limit determination.
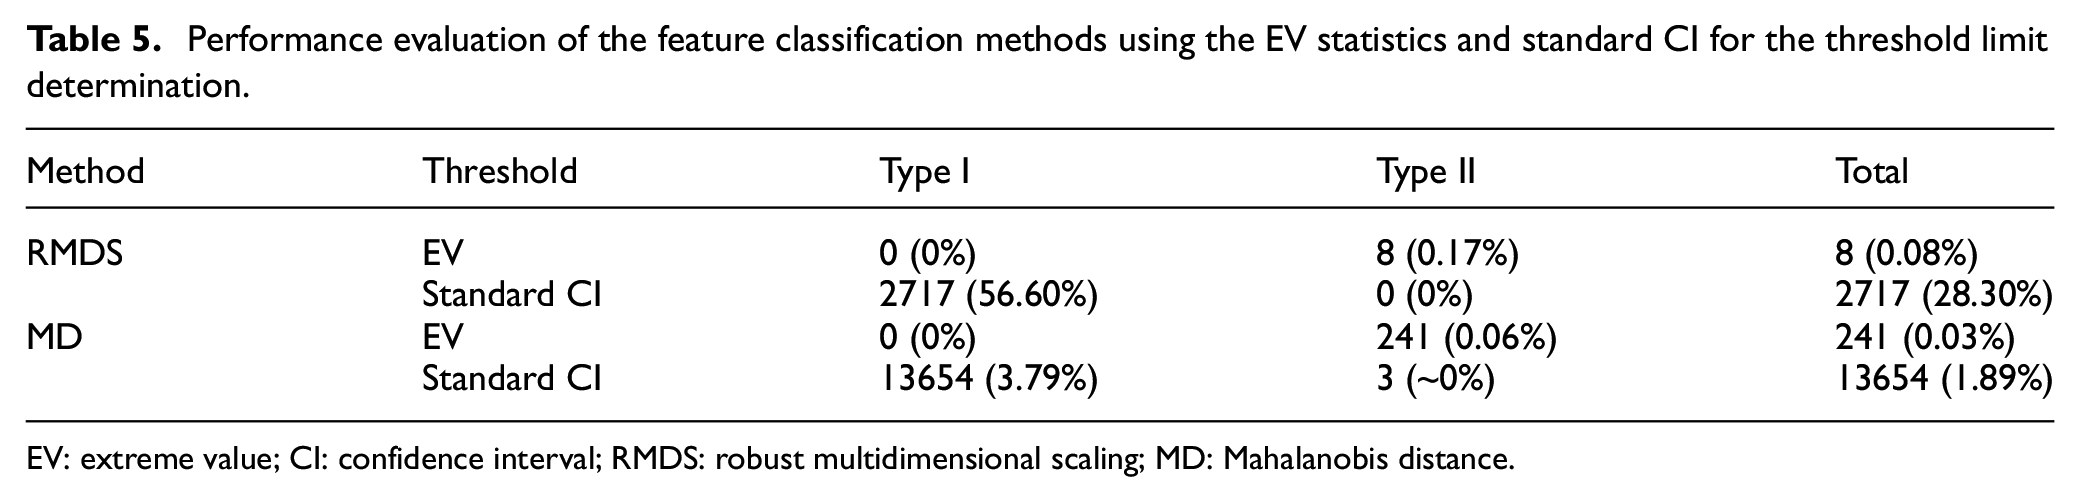
EV: extreme value; CI: confidence interval; RMDS: robust multidimensional scaling; MD: Mahalanobis distance.
Conclusion
This article has proposed a novel data-driven method for SHM under ambient vibration and high-dimensional features. The proposed method has been developed from the RMDS algorithm and some computational approaches to deal with the main limitation of using high-dimensional DSFs for early damage detection. The process of feature extraction has been performed by ARMA modeling and the model residuals of the normal and damaged conditions have been extracted as the main DSFs. For accurately detecting damage without any false alarm, the EV theory has been used to determine a reliable threshold value. The shape of GEV distribution has also been considered to choose an appropriate EV distribution for the threshold limit determination. Eventually, the experimental data sets of the IASC-ASCE benchmark problem and the Tianjin-Yonghe Bridge have been used to verify the accuracy and reliability of the proposed methods as well as some comparative studies.
The results have shown that the proposed RMDS-based method with the aid of the ARMA residuals and the EV theory is highly able to detect early damage without any false alarm error. It has been observed that the distribution of embedding norm values of the normal condition used in the threshold limit determination is not normal, in which case the standard CI based on the normality assumption suffers from numerous Type I errors. Therefore, it is recommended to utilize the EV statistics in the threshold limit determination when the outputs of the feature classification method regarding the undamaged condition are non-normal. The comparison between the proposed RMDS-based method and the well-known MD technique has demonstrated that the former is superior to the latter in detecting small damage. Furthermore, the proposed RMDS-based method is more efficient than the MD technique due to providing much fewer outputs for feature classification and decision-making.
Footnotes
Acknowledgements
The authors express their sincere gratitude to the IASC-ASCE Structural Health Monitoring Task Group and Structural Monitoring and Control at the Harbin Institute of Technology in China for accessing their experimental data sets.
Declaration of conflicting interests
The author(s) declared no potential conflicts of interest with respect to the research, authorship, and/or publication of this article.
Funding
The author(s) received no financial support for the research, authorship, and/or publication of this article.