
Abstract
With the development of deep learning, object detection algorithms based on horizontal box are widely used in the field of damage identification. However, damages can be in any direction and position, and they are not necessarily horizontal or vertical. This article proposes a bolt damage identification network, namely, orientation-aware center point estimation network, which models a damage as a center point of its rotated bounding box. The proposed orientation-aware center point estimation network uses deep layer aggregation network to search center points and regress to all other damage properties, such as size and angle. A loss function is designed to improve the optimization efficiency of network. Orientation-aware center point estimation network is applied to bolt damage detection, and comparison with the well-known Faster Region-Convolutional Neural Network (a benchmark using horizontal bounding box) demonstrates the accuracy of the proposed method. Finally, videos were utilized to verify the capability of the proposed orientation-aware center point estimation network in real-time detection of bolt damages.
Introduction
As important connecting components, bolts are widely used in various types of composite structures. Compared with other methods such as welding, bolt has the advantages of easy installation and high flexibility. However, composite structures are affected by loading, environment, and other factors, resulting in bolt damage, and even serious disasters. For example, more than 1800 safety incidents were caused by loose bolts with official records in the United Kingdom. Within 2 years, 25% of the bolts on the rail network need to be re-tightened to avoid bolt failure. 1 Therefore, it is necessary to monitor the condition of bolts. Structural health monitoring mainly relies on advanced sensor technology to identify various types of damages. These sensors provide technical support for structural health monitoring and examples include accelerometers, acoustic emission, ultrasound, and so on. They can collect the dynamic response from structures, identify the physical parameters of the structure, and finally achieve the purpose of damage detection. Many researchers have developed various types of smart sensors to detect damages.2–6 Huo et al. 7 proposed an electrical mechanical impedance method to investigate the preload condition of bolted connections. The experimental results showed that as the bolt preload decreased, the resonant frequency of the bolted connection decreased due to the influence on the impedance of the piezoelectric ceramic switch. Oregui et al. 8 proposed a bolt looseness monitoring method using axle box acceleration measurements. Vehicle-borne monitoring systems may be used to automatically detect and assess the tightness condition of bolts at rail joints. Jiang et al. 9 developed a stress wave–based active sensing method, which uses piezoelectric ceramic transducer to detect the damages caused by loose bolts in steel truss arch structure. When initial looseness damages occurred, the overall structural stiffness did not decrease significantly. However, the wavelet packet energy changed significantly, indicating that the method was superior to the stiffness-based method. Wang et al. 10 developed a new entropy-based damage index using the multi-scale permutation entropy algorithm, which eliminates the saturation phenomenon of the current damage index and enhances the performance of bolt early looseness monitoring. Du et al. 11 proposed a guided wave method based on virtual time reversal and tightness index for bolt preload monitoring. The experimental results showed that the tightness index increased almost linearly as the bolt preload decreased. Tola et al. 12 proposed a bolt looseness damage detection method based on the ultrasonic wavefield energy in Lamb wave. Ho et al. 13 used fiber Bragg grating sensors to monitor rock bolt loads. However, not all structures are equipped with sensor systems. Taking bridge as an example, most of the small- and medium-sized bridges are not installed with structural health monitoring systems. As a result, current structural safety inspections rely heavily on manual inspections, which require experience and is inefficient and costly.
Manual inspection relies mainly on percussion and observation to detect and record the condition of bolts in critical areas. For percussion, it mainly relies on the auditory sense to determine bolt damage states. The data set was constructed by capturing audio signals from different bolt damage states, and bolt damages were classified and identified using algorithms such as support-vector machines and neural networks.14–17 For observation, the damage state of bolts was detected by vision. Bolts tend to be found in large-scale concentrations in structures. In order to improve the efficiency and accuracy of manual inspection, it is a feasible solution to use machine vision instead of human eyes for damage detection.18–23 Therefore, machine vision–based structural damage detection methods have received substantial attention. Cha et al. proposed a bolt looseness damage detection method. Sliding windows and support-vector machines have been used to detect bolt large looseness damage.24,25 Park et al. 26 extracted the edge information of the bolt using the Hough transform. According to the change of edge information, the looseness angle within 60° could be recognized. The difficulty with traditional machine vision methods is that it is necessary to choose the important features in each given image. As the number of classes to classify increases, feature extraction becomes more and more cumbersome. 27
With the rapid development of deep learning, convolutional neural networks (CNNs) have achieved remarkable results in the field of image processing. CNNs autonomously learn the feature information of targets in images through multiple convolutional layers, and realize the task of target recognition. Deep CNNs have substantially reduced the difficulty of machine vision task and improved the accuracy of target recognition. Therefore, deep CNNs have been widely used in many fields.28–33 Zhang et al. 34 proposed a bolt looseness damage detection method based on the Faster Region-Convolutional Neural Network (Faster R-CNN), which can automatically identify bolt damage states. Wang et al. 35 used Faster R-CNN and You Only Look Once (YOLO) to detect bolt. Considering the purpose of the abnormal detection of bolts is to confirm whether the bolts are lost. Zhao et al. 36 proposed a bolt looseness angle detection method based on single shot multi-box detector (SSD), which can identify two classes. According to the localization information, the looseness angle within 180° could be recognized. Huynh et al. 37 used deep learning to identify the bolts in images, and then extracted the bolt edges using tilt correction and Hough transform. The bolt looseness angle detection could be achieved according to the change of edge information. Xie and Sun 38 used CNNs to locate the target regions. Three-dimensional (3D) reconstruction was performed to detect bolt loosening faults. The measurement repeatability and precision are less than 0.03 and 0.09 mm, respectively. Pham et al. 39 used 3D simulation software to create images of bolts, and trained the rendered images to generate a bolt detection model. Sun et al. 40 used CNNs to segment sub-pixel edges of bolt cap and local area of mounting surface, respectively. The 3D data of these edges were obtained by stereo matching and binocular vision model, and the distance between bolt cap and mounting surface was calculated. All the aforementioned identified bounding box–based bolt looseness recognition methods use horizontal detection algorithms for damage detection. However, the bolts may be in any position in the structure as a connecting member. Therefore, the assumption of horizontal or vertical bolts does not always hold in practice. The looseness bolts always have large aspect ratios; the horizontal bounding box usually contains more background and is not conducive to quantifying the bolt looseness damages.
In order to detect and locate multiple bolt damages, this article proposes a bolt damage identification method with consideration of arbitrary orientation of the bolts. Although the semantic segmentation algorithm can identify bolts at the pixel level, the training cost of semantic segmentation is high and the detection speed is slow. Identification of bounding box which is vigorously promoted by the industry is the most popular damage detection method. However, most target detection algorithms use horizontal bounding box for damage location. 41 For large aspect ratio and densely distributed damages, positioning based on horizontal bounding box is not reliable. Therefore, this article proposes a bolt damage identification network, namely, orientation-aware center point estimation network (OA-CenterNet), which is used to detect arbitrarily oriented bolt damages. The proposed OA-CenterNet uses damage feature which is extracted and fused by a deep layer aggregation (DLA) structure to find center points and regress to all other damage properties, such as size and angle. A loss function is designed to improve the optimization efficiency of network. Section “Overall bolt damage identification network architecture” describes the overall procedure of the proposed bolt damage identification network. Section “Bolt damage detection model” shows the training and evaluation results of the model. Section “Bolt damage detection” presents the verification and results of the real-time detection system. Section “Discussion and conclusion” discusses and concludes the article.
Overall bolt damage identification network architecture
Machine vision–based approach can be used to locate and identify bolt damages quickly and accurately. Some large-scale structures have many bolts with wide distribution in various positions. When camera or unmanned aerial vehicle (UAV) is used to collect images of bolts, there may be multiple orientations of bolts in an image. Object recognition can be divided into horizontal bounding box detection and rotated bounding box detection, as shown in Figure 1. In horizontal bounding box detection, the bounding box is always horizontal with the X-axis of an image. It can be seen from this figure that the rotated bounding box can be more accurately fitted to the bolt region. Meanwhile, the height of the rotated bounding box can reflect the looseness degree of bolts.
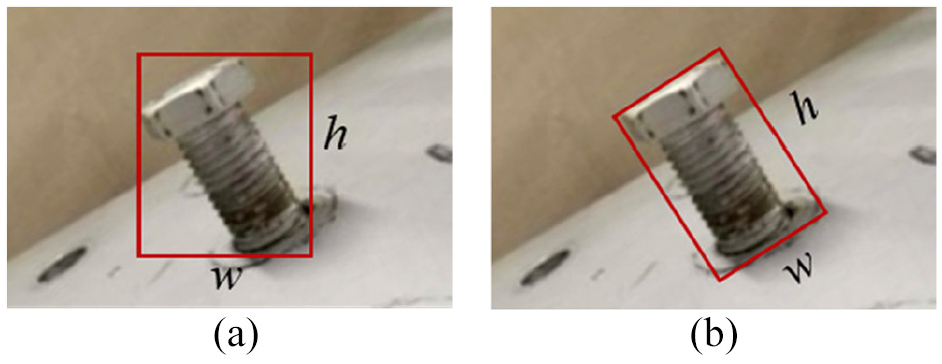
Identified bounding box: (a) horizontal bounding box and (b) rotated bounding box.
In order to identify and locate bolt damages more accurately, this article proposes a bolt damage identification network using OA-CenterNet, which is used to identify and locate the three states (loose, tight, and fell off) of bolts. The proposed OA-CenterNet models a damage as a center point of its rotated bounding box. It uses deep CNNs to search the center points and regress to all other damage properties, such as size and angle. According to the damage information, the damages can be accurately identified and located by the rotated bounding box. The framework of the proposed method is shown in Figure 2. First, a bolt damage data set is created. Then, the rotation detection algorithm is used to train a detection model. The damage images are fed into the detection model, which can estimate the center point, height, width, and angle of each damage in an image. In addition, the aspect ratio (v) of the rotated bounding box can be used as a damage parameter to quantify the bolt looseness damage. The quantification of bolt looseness damages serves as an indicator for rapid inspection and safety assessment
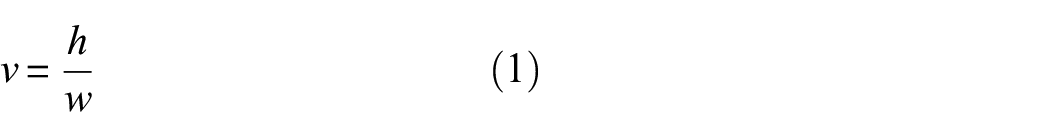
where h is the height of rotated bounding box, and w is the width of rotated bounding box.
The framework of the proposed method.
The proposed OA-CenterNet mainly includes two modules: feature extraction and fusion and the generation of rotated bounding box. Feature map is the basis of classification network. In this article, a DLA structure is used to extract and fuse features of damages. Then, the final fusion features are fed into four convolution layers to obtain the center point, size, and angle of the damage, respectively. According to the damage information, its rotated bounding box can be drawn in an image. Moreover, OA-CenterNet is an anchor-free algorithm, which represents the target by its center point and then regresses the height, width, and other information about the target. It transforms the target detection problem into a central point estimation problem; its overall idea is very concise. In addition, a specific loss function is designed to improve the training efficiency of the model. The details of the OA-CenterNet are given below.
Feature extraction and fusion
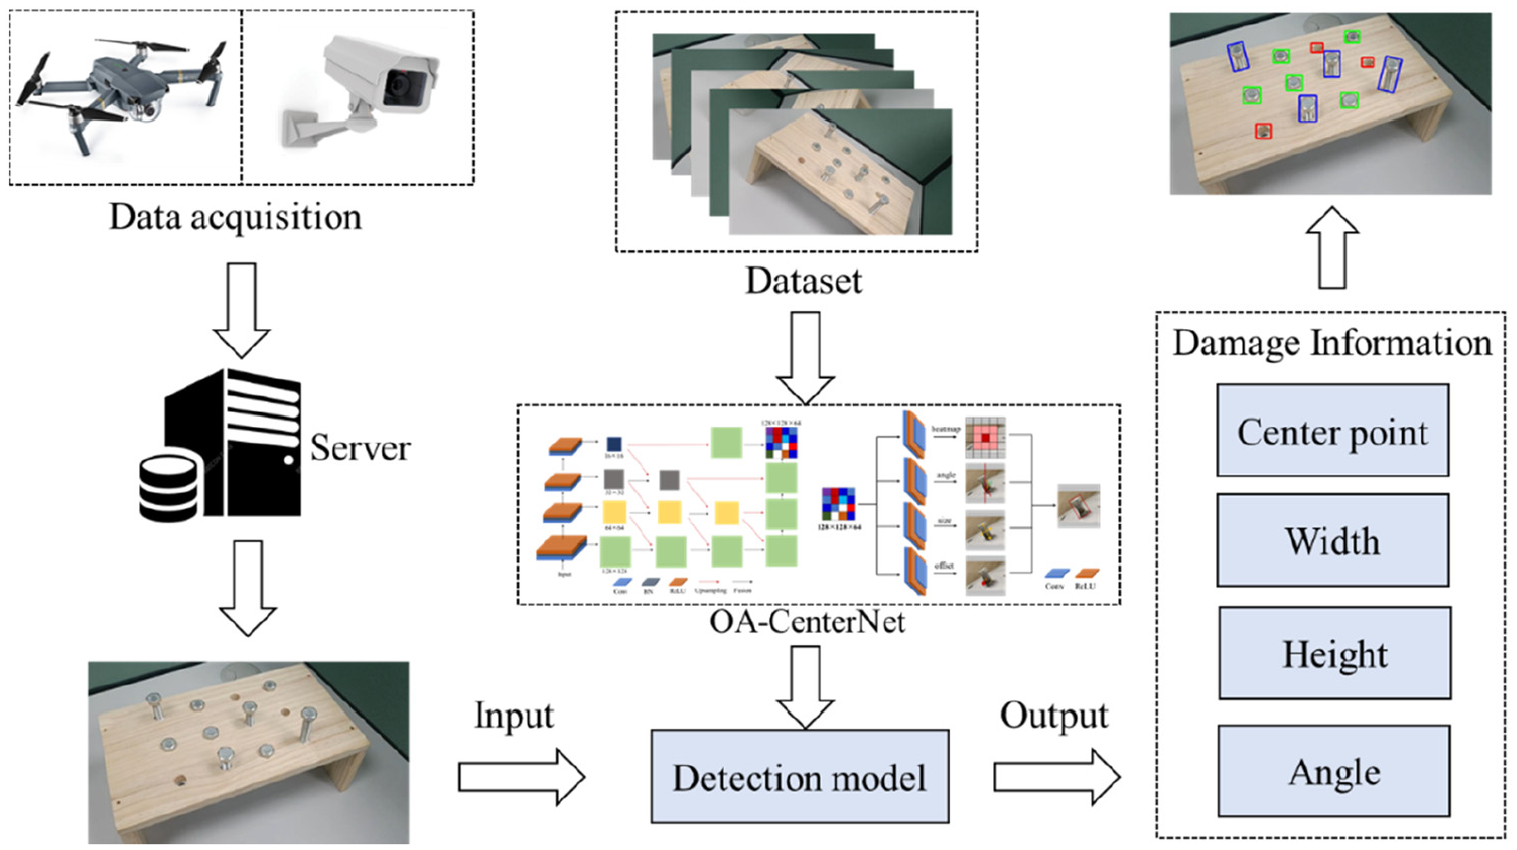
Object detection can simultaneously complete the recognition and location of objects in an image. Therefore, it is necessary to extract both the feature and location information of the object. CNN can extract features of images autonomously. With the increase in the network layers, the higher-level features are extracted more abundantly. However, with the increase in network layers, the spatial information of the object is extremely compressed, resulting in poorer target localization. To resolve this problem, many pyramidal and deep aggregation networks have been proposed.42–45 For example, skip connections can combine different scales and resolution information from shallow to deep, but these connections are linear and shallow. In this article, a DLA structure is used to iteratively fuse deeper, larger-scale information, as shown in Figure 3.
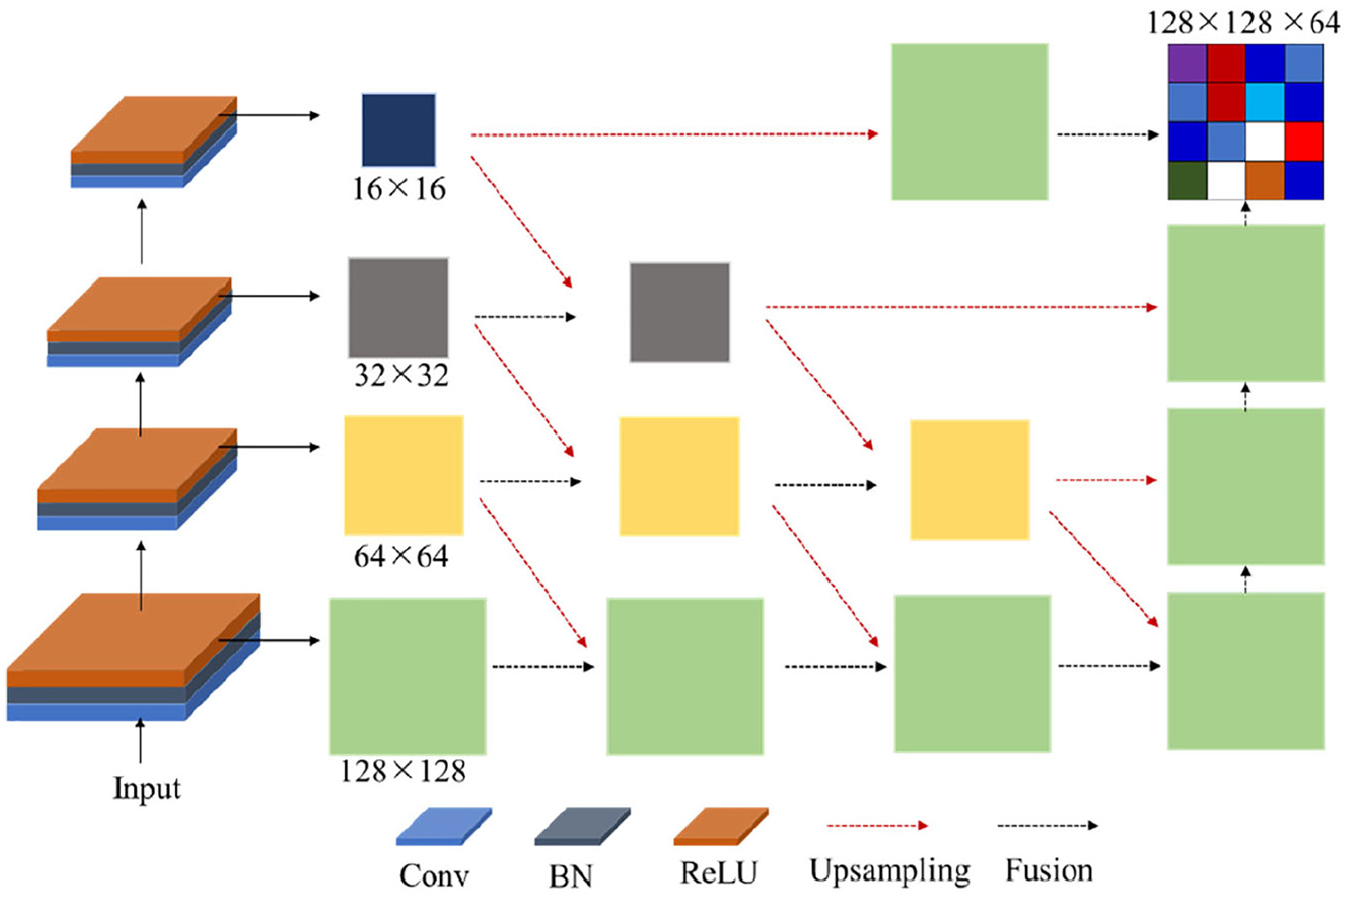
Deep layer aggregation structure.
The images are resized from 960 × 544 × 3 to 512 × 512 × 3, and then images are fed into the DLA structure. The backbone network of this structure contains four convolutional groups. Each convolutional group includes a convolutional (Conv) layer, a batch normalization (BN) layer, and an activation layer (ReLU). Each convolutional group can generate a feature map, and their dimensions are 128 × 128, 64 × 64, 32 × 32, 16 × 16, respectively. As shown in Figure 3, the four feature maps are iteratively fused. The final output of DLA is a feature map with the downsampling coefficient of 4. The solid lines in the figure represent the downsampling layers, the black dashed lines in the figure represent the fusion layers, and the red dashed lines in the figure represent the upsampling layers. The parameters in the downsampling layer are initialized using the parameters from the ImageNet-based pre-training model, while the parameters in the upsampling layer are randomly initialized.
Rotated bounding box
Images are processed by the DLA structure to obtain a feature map of size 128 × 128 × 64, which is fed into four output modules, namely, heatmap, offset, size, and angle. The output modules are shown in Figure 4. Each module contains two convolutional groups. The first convolutional group includes a convolutional (Conv) layer and an activation layer (ReLU). The second convolutional group includes only a convolutional (Conv) layer.
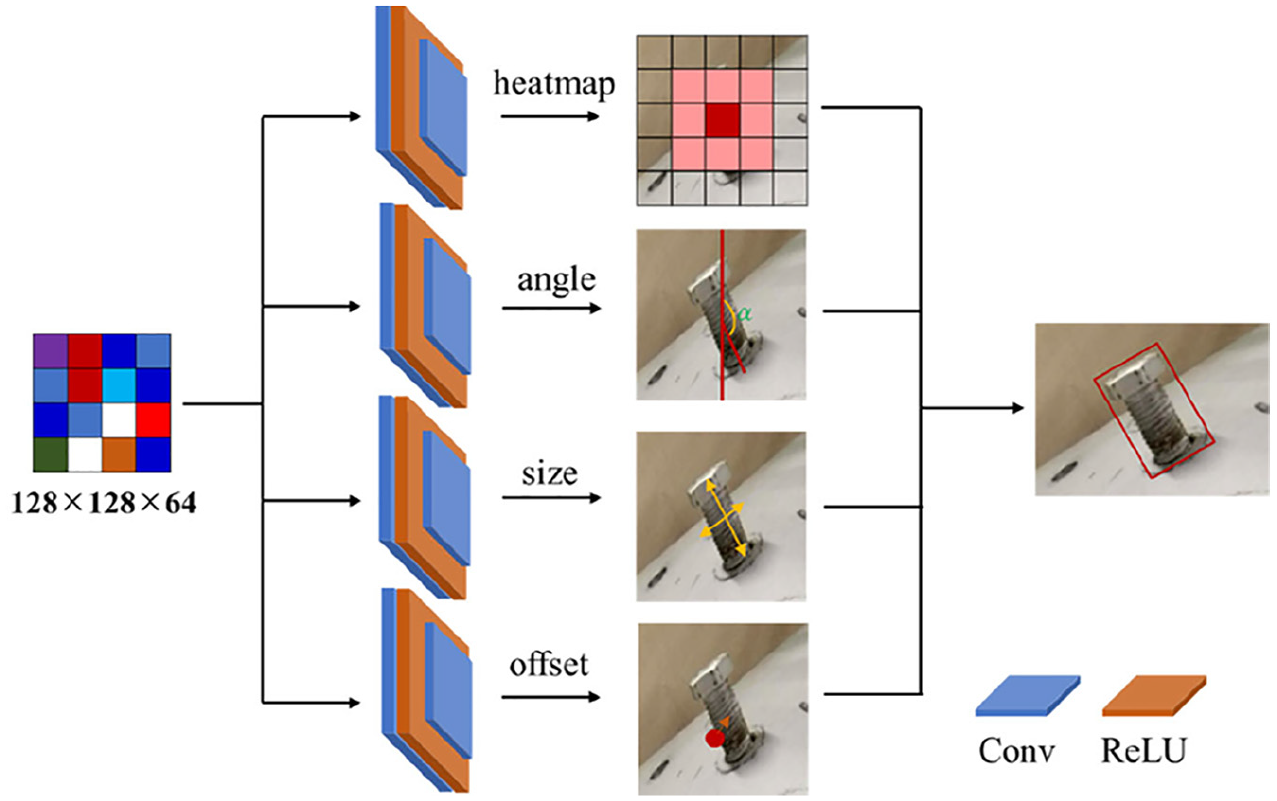
Output modules.
For each module, the feature map is processed with two convolutional layers. Finally, the heatmap module outputs a feature map of size 128 × 128 × 3, where 3 represents the number of classes. The offset module outputs a feature map of size 128 × 128 × 2, where 2 represents the bias in both directions. The size module outputs a feature map of size 128 × 128 × 2, where 2 represents the width and height of an object. The angle module outputs a feature map of size 128 × 128 × 1, where 1 represents the rotated angle of a horizontal box.
The network can estimate the center point coordinates, width, height, and rotated angle of damages in an image. According to these four parameters, the rotated bounding box of each category can be drawn in an image. An example of the drawing process is schematically shown in Figure 5.
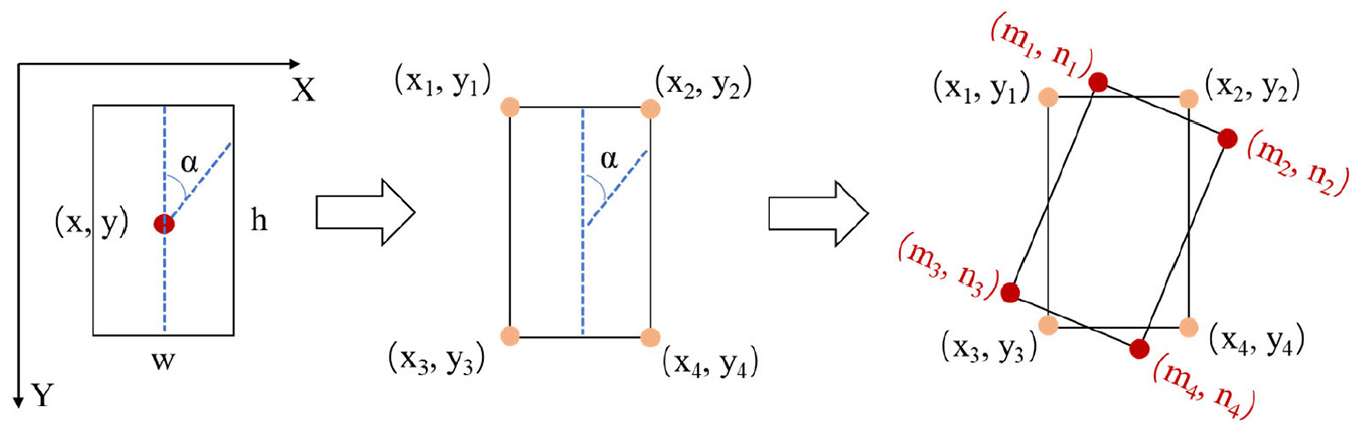
Drawing process of rotated bounding box.
In Figure 5, the X-axis is horizontal to the right and the Y-axis is to the vertical to the bottom. (x, y) is the center point of the horizontal box, w is the width of the horizontal box, h is the height of horizontal box, and α is the rotated angle of the horizontal box. According to the four parameters, the four corner coordinates of the horizontal box can be calculated, and they are given as follows
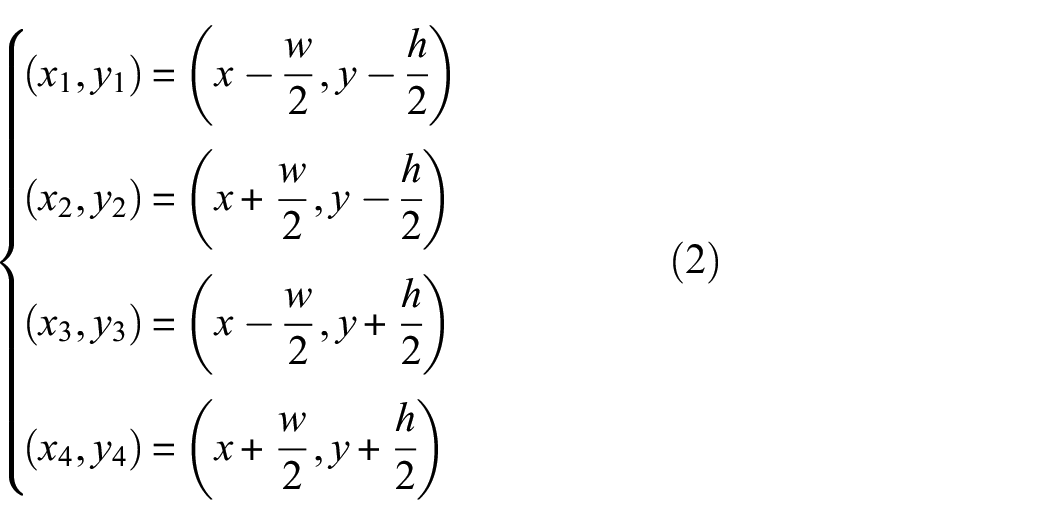
where (x1, y1) are the upper-left corner coordinates of the horizontal box, (x2, y2) are the upper-right corner coordinates of the horizontal box, (x3, y3) are the lower-left corner coordinates of the horizontal box, and (x4, y4) are the lower-right corner coordinates of the horizontal box.
The horizontal box rotated α clockwise around the center point is the final identified bounding box. When the rotated angle (α) is greater than 180°, α should be subtracted by 180°. It is because a rectangle box rotated 180° around the center point is itself. This method can also reduce the amount of network computing. Finally, the four corner coordinates of the rotated box can be readily obtained
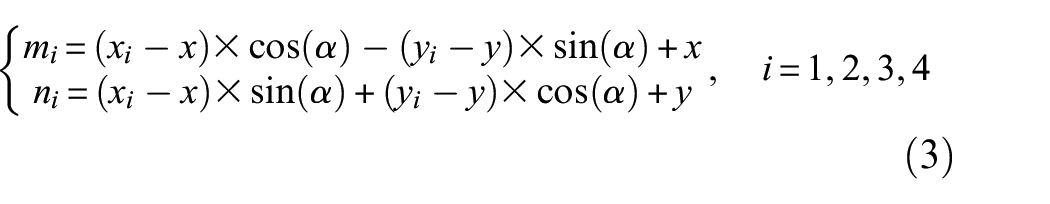
where (xi, yi), i = 1, 2, 3, and 4, are the four corner points of the horizontal box, and (mi, ni), i = 1, 2, 3, and 4, are the four corner points of the rotated box.
Loss function
The loss function is used to describe the difference between the predicted value of a model and the actual value. It also affects the update of the network parameters. Therefore, the loss function is an important component of deep learning. The OA-CenterNet has four output modules, namely, heatmap, size, offset, and angle. The heatmap reflects the position and number of keypoints in an image. The size includes the width and height of a target. The offset includes the bias of the predicted center point in the width and height directions. The angle is the rotated angle of the horizontal box. Each module has its own loss function, which will be given as follows.
The heatmap module produces a keypoint heatmap Y′∈ [0,1]128 × 128 × c, where 128 × 128 is the size of the heatmap, and c is the number of keypoint types. Keypoint types include loose, tight, and fell off. During the training process, all the ground truth keypoints are filtered by a Gaussian filter to obtain the ground truth heatmap. The training is realized through penalty-reduced pixelwise logistic regression with loss function similar as focal loss
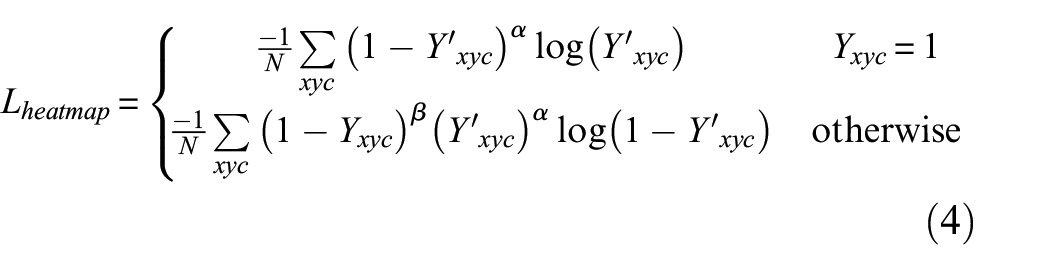
where N is the number of keypoints in an image, Yxyc is the ground truth heatmap, and
The spatial resolution of the final feature map is one-fourth of the input image, that is, one pixel in the feature map corresponds to 16 pixels in the original image; this will lead to target positioning deviation. Therefore, the bias value is introduced into the network. During training process, the bias value is trained using the mean absolute error, and the bias loss is
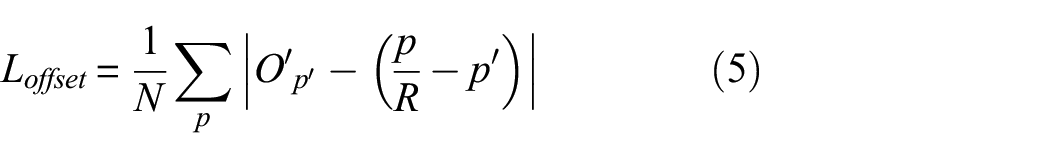
where N is the number of keypoints in an image, p represents the ground truth keypoint, R represents the downsampling coefficient, and p′ is the equivalent point of ground truth keypoint at low resolution. (p/R − p′) is the actual bias value, and
The rectangle box is used to label the objects in an image. For an object of category k, the two corner points of rectangle box are (x1, y1) and (x2, y2), respectively. The width–height information of the object is denoted by sk=(x2 − x1, y2 − y1). The OA-CenterNet is used to estimate the center point of all objects. The width–height information is trained using the mean absolute error, and the size loss function is
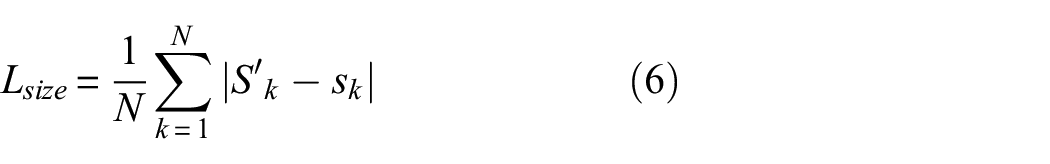
where N is the number of keypoints in an image, sk is the actual width–height of an object,
In the rotation detection, the angle of the target box is already included in the labeling information. This is also the main difference between OA-CenterNet and CenterNet. The absolute error is used for angle regression, and the loss function of angle is given by
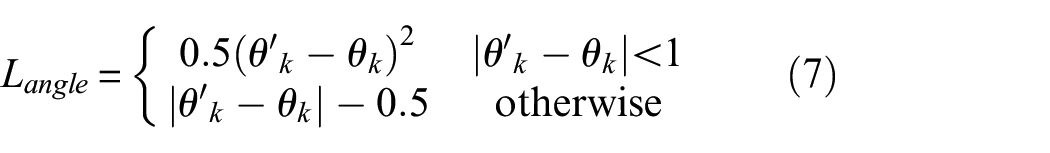
where the estimated angle of the network is
The total loss function is the sum of the above four loss functions, and different weights are assigned. Compared with CenterNet, the total loss function of OA-CenterNet has an additional angle loss value. The total loss function is
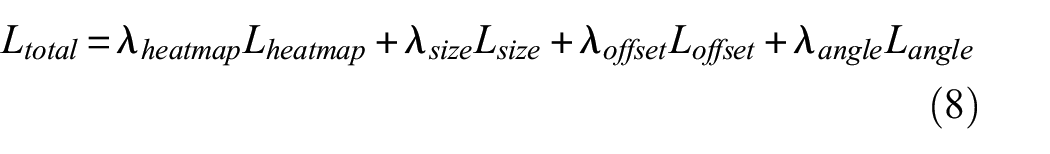
where λheatmap is the weight of heatmap loss, λsize is the weight of size loss, λoffset is the weight of offset loss, and λangle is the weight of angle loss. It is found that the orders of magnitude of their initial value (Lheatmap, Lsize, Loffset, and Langle) are 100, 100, 10−1, and 101, respectively. To ensure that these four modules are trained evenly, the weightings are selected to be inversely proportional to their orders: λheatmap and λsize are set to 1, λoffset is set to 10, and λangle is set to 0.1.
Evaluation indicators
For the object detection task, the mAP, F1-score, and mean intersection over union (mIoU) are widely used to evaluate the performance of a method. mAP is the mean average precision of all categories
where AP i is the average precision of class i, and K is the number of classes.
F1-score, also known as balanced score, is used to measure the accuracy of classification model. It considers the precision and recall of classification model simultaneously
where precision quantifies the number of positive class predictions that actually belong to the positive class, and recall quantifies the number of positive class predictions made out of all positive examples in the data set.
The network relies on the identified bounding box to locate the target. The smaller the difference between the identified bounding box and the actual box, the better the localization performance of model. Therefore, IoU which is the ratio of intersection to union is an important evaluation indicator
where intersection is the area of overlap of the identified bounding box and the actual box, and union is the area of union of the identified bounding box and the actual box, as shown in Figure 6. Furthermore, mIoU is the mean IoU of all categories.
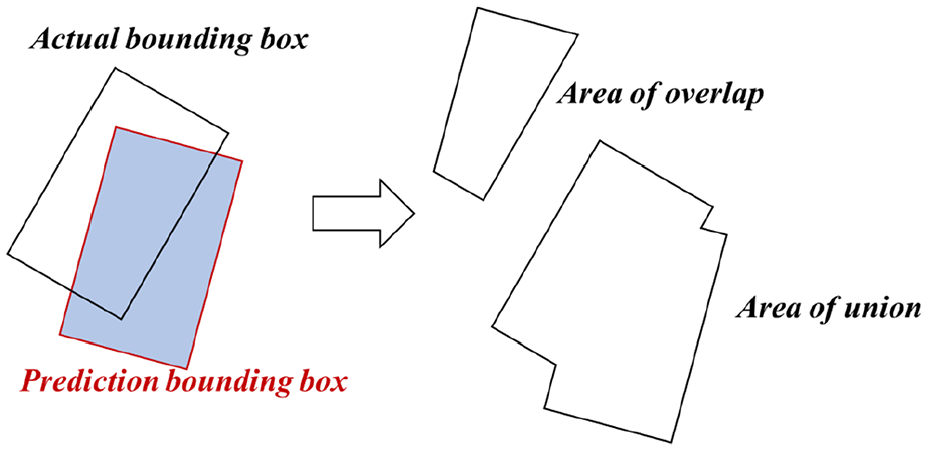
IoU diagram of the rotated bounding box.
Bolt damage detection model
Data set
The images used in this article were collected from a laboratory structure. The structure is a wooden structure with 12 bolt holes. Nine of the holes were randomly selected to install M18 bolts. The nine bolts were randomly set to “loose” and “tight.” The other three holes represented “fell off.” A total of 330 images with the size of 960 × 544 pixels were collected by smartphone. A labeling tool, roLabelImg (https://github.com/cgvict/roLabelImg), was used to label the three types of bolt states in images. We use this tool to draw bounding boxes in an image; these bounding boxes can be adjusted in angle and size in order to accurately locate the damages. This tool generates label data based on artificially drawn bounding boxes and categories. As a supervised learning method, the labeling process of data all needs to be carried out manually. When the data are wrongly marked, the learning effect of the network will be affected and the final recognition accuracy will be reduced. These images and annotations construct a bolt damage data set, which includes three categories: loose, tight, and fell off. The labeling process of data is shown in Figure 7. In horizontal target detection, the label data for the identified bounding box are the coordinates of the two corner points (upper-left and lower-right). In the case of rotation detection, the label data for the identified bounding box are midpoint coordinates, width, height, rotated angle, and category. 300 images from the data set were randomly selected as the training set and validation set, and 30 images as the testing set.
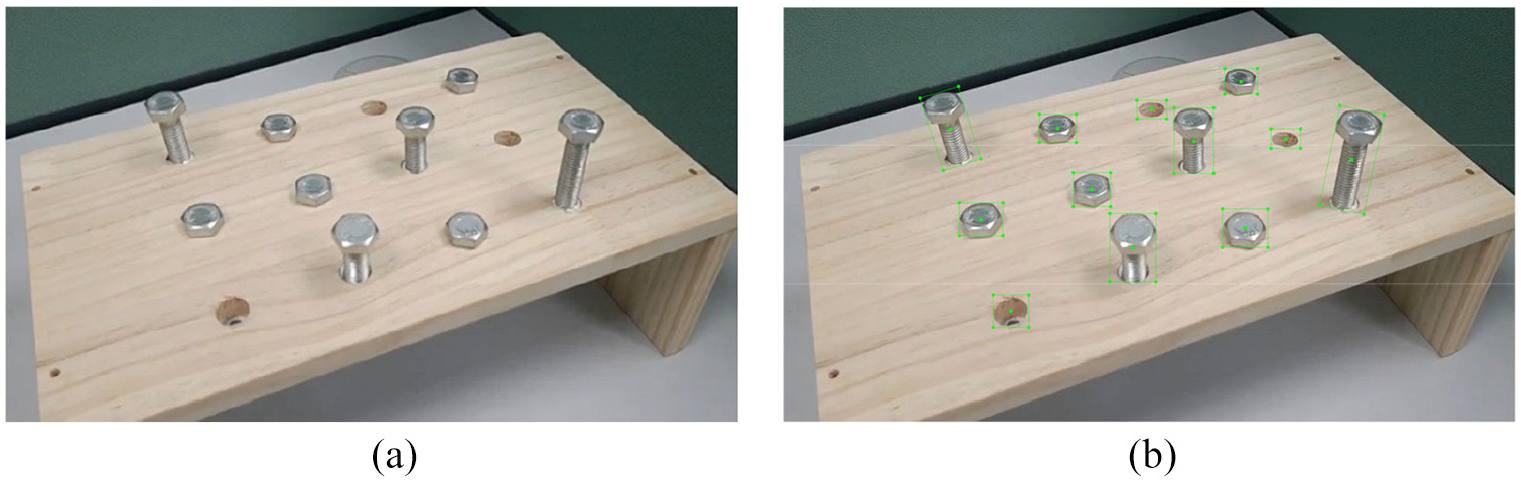
Labeling process: (a) original image and (b) label rotated box.
Model training and evaluation
The proposed OA-CenterNet is used to train the data set. The main parameters are as follows: the learning rate is 0.001, the weight decrease is 1e−4, the batch size is 3, and the number of epochs is 100. The training loss and the validation loss are shown in Figure 8. As can be seen from Figure 8(a), the training loss of total, heatmap, size, offset, and angle gradually decreases and tends to be stable. It is noteworthy that the angle loss value is much larger than other loss values. This is because smooth absolute error is used for angle regression, while mean absolute error is used for heatmap, size, and offset regression. Angle regression is challenging and smooth absolute error can ensure the stability of angle regression. As can be seen from Figure 8(b), the validation loss of total, size, offset, and angle gradually decreases and tends to be stable. It is remarkable that the heatmap loss value first decreased, then increased, and finally reached a stable state. This phenomenon also appears in the training process based on CenterNet. However, the loss does not correspond to the final evaluation metric (mAP). The last model gives better mAP than the lowest-loss model. No overfitting was observed on the data set. Thus, the last model was chosen as the detection model, which was evaluated through three indicators. The evaluation result of the detection model is shown in Table 1. It can be seen from the table that the three indicators are very high, indicating that the model has a high capability for bolt damage detection.
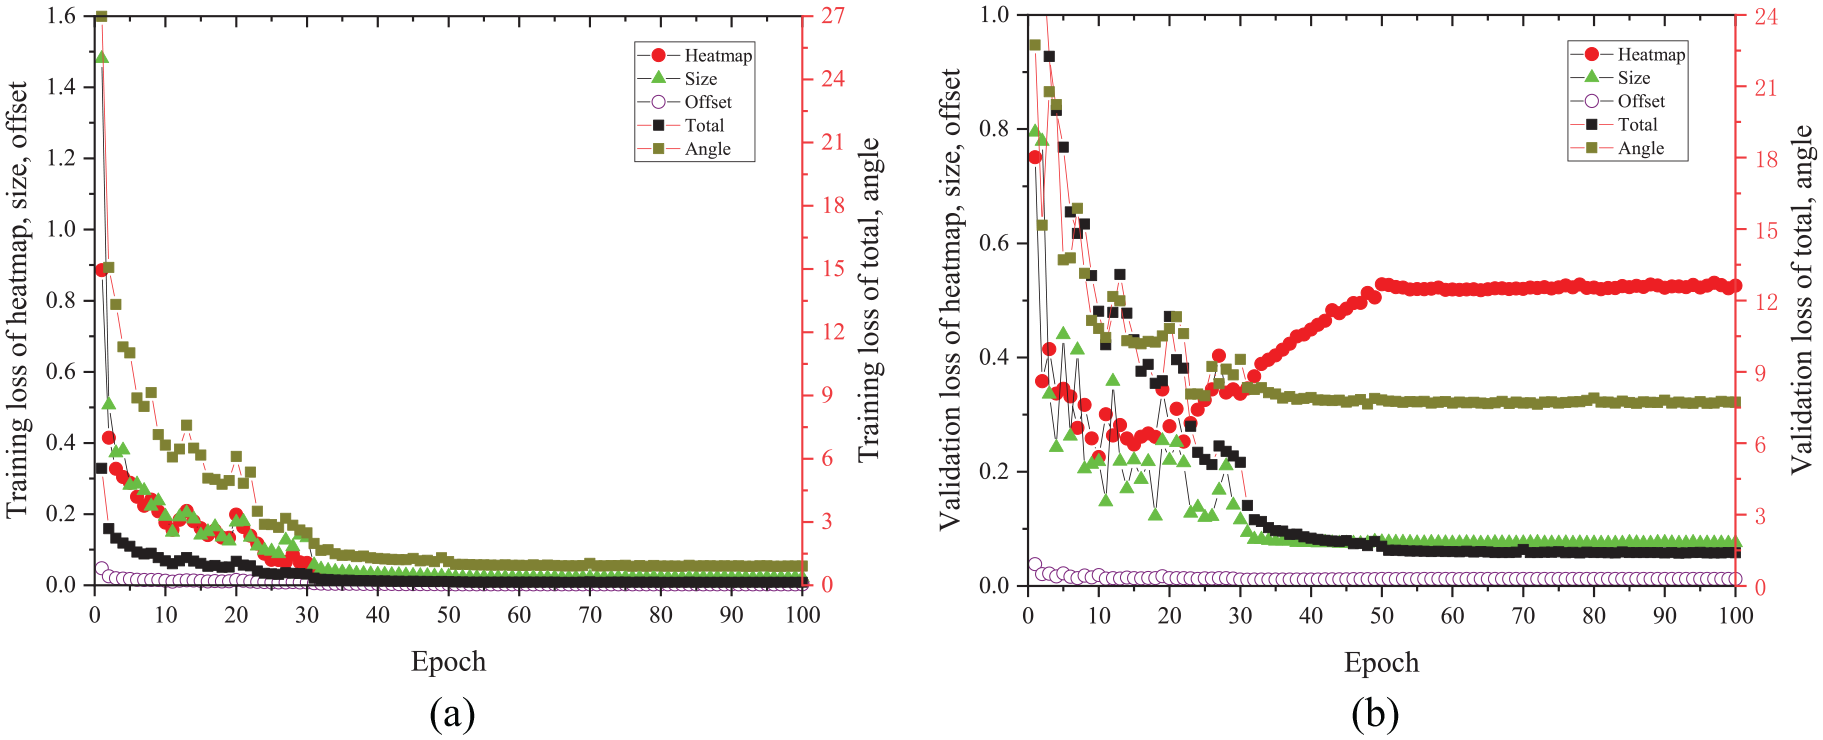
Loss curves: (a) training loss and (b) validation loss.
Model evaluation result.
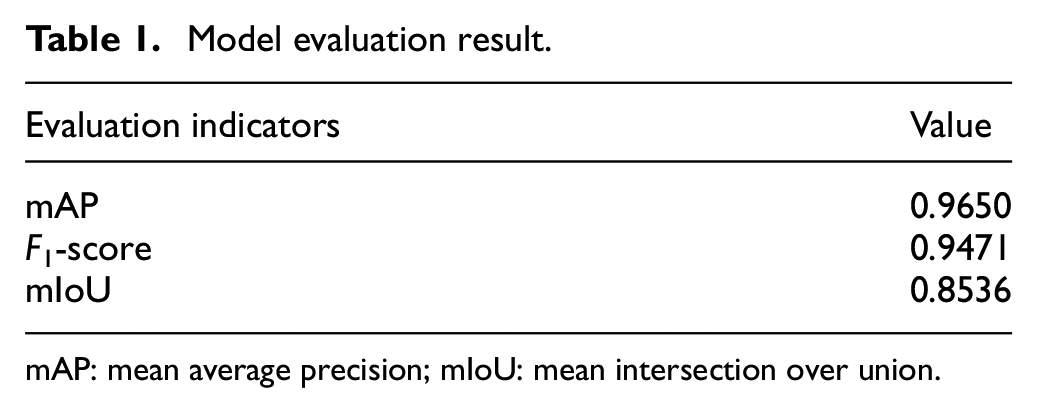
mAP: mean average precision; mIoU: mean intersection over union.
According to the drawing method of rotated box, the identified bounding boxes of the model are drawn on the image. The identified bounding boxes for the three categories (loose, tight, and fell off) are set to blue, green, and red, respectively. The identification results of some samples are shown in Figure 9. The rotated bounding boxes in Figure 9(a) to (d) are the detection results of the proposed OA-CenterNet, and the horizontal bounding boxes in Figure 9(e) to (h) are the detection results of Faster R-CNN. The Faster R-CNN was trained with an initial learning rate of 0.0001, momentum of 0.9, batch size of 1, and iterations of 5000. The average precision of Faster R-CNN is 0.9315, which is slightly lower than OA-CenterNet’s average precision of 0.9650. Therefore, the identification accuracy of OA-CenterNet can meet the requirements of bolt damage detection. Compared with horizontal bounding box, rotated bounding box can be more accurately fitted to the target area. It can be seen from the figure that the proposed OA-CenterNet can accurately identify and locate three types of bolt states. For the loose bolts, no matter which orientation they are in, the rotated box generated by the model can accurately locate them. In the field of machine vision, occlusion is always a difficult problem to solve. The influence of occlusion can be minimized by multi-direction detection.
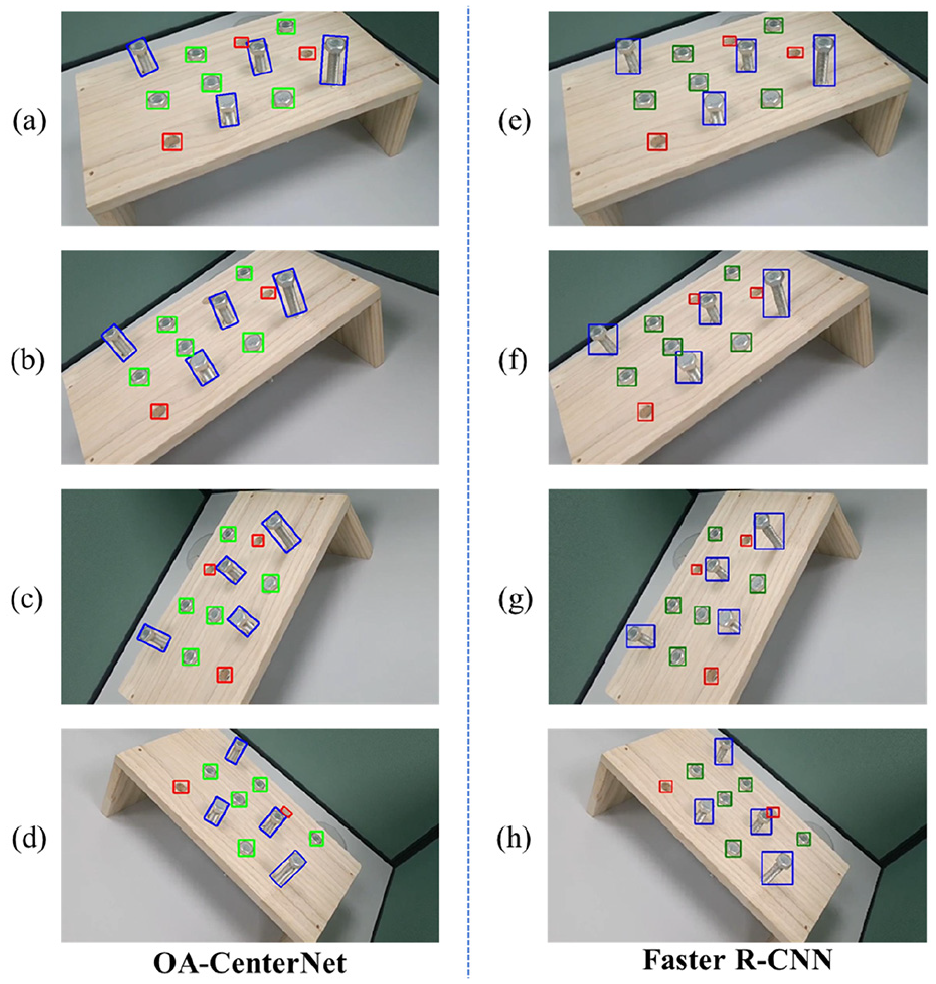
Identification results of some samples.
Bolt damage detection
Influence of different illuminations
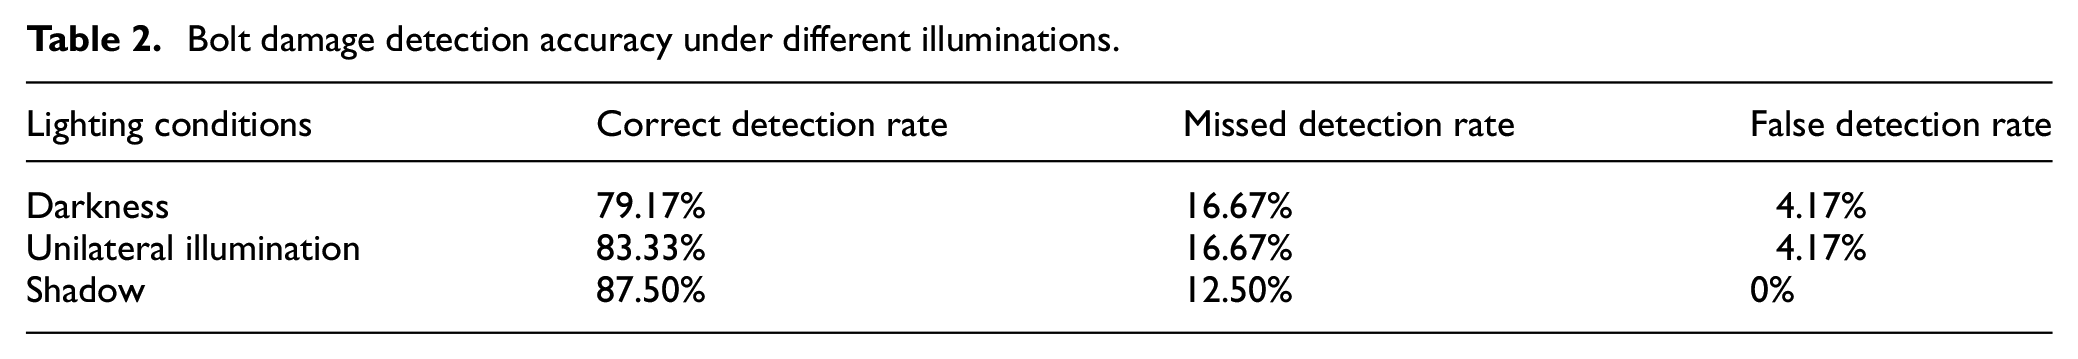
Bolts, as joints of the composite structure, can be installed in various positions of a structure. The lighting conditions in different positions are also different. In the field of machine vision, illumination variation which may affect the performance of deep learning model is a very important factor. In order to verify the stability of deep learning model, the images of bolts under darkness, unilateral illumination, and shadow were collected. The identification results of these images are shown in Figure 10. As can be seen from Figure 10(a), the targets in the back row were more ambiguous in darkness, and the individual bolt damage was poorly identified. However, most of the damage can still be identified and located with high precision. Figure 10(b) shows the identification results of bolt damages under unilateral illumination. The results showed that the two “tight” and one “fell off” were not identified, and the shadow of a bolt was misidentified as “fell off.” Under unilateral illumination, the shadow of the bolt complicates the background, and thus affects the recognition ability of the deep learning model. Figure 10(c) shows the identification results of bolt damages under shadow. The results showed that three “tight” were not identified, and no target was misidentified. In order to quantify the influence of different illuminations on bolt damage identification, the correct detection rate, the missed detection rate, and the false detection rate of bolt damage under three types of lighting conditions are calculated, respectively. The correct detection rate of bolt damage under normal lighting conditions is 100%. As can be seen from Table 2, lighting conditions can reduce the recognition accuracy of deep learning model. However, some bolt damages were miss detected mainly because of occlusion. In the field of machine vision, occlusion still has a significant impact on target identification. Hence, multiple cameras can be used to reduce the chance of objects being occluded.
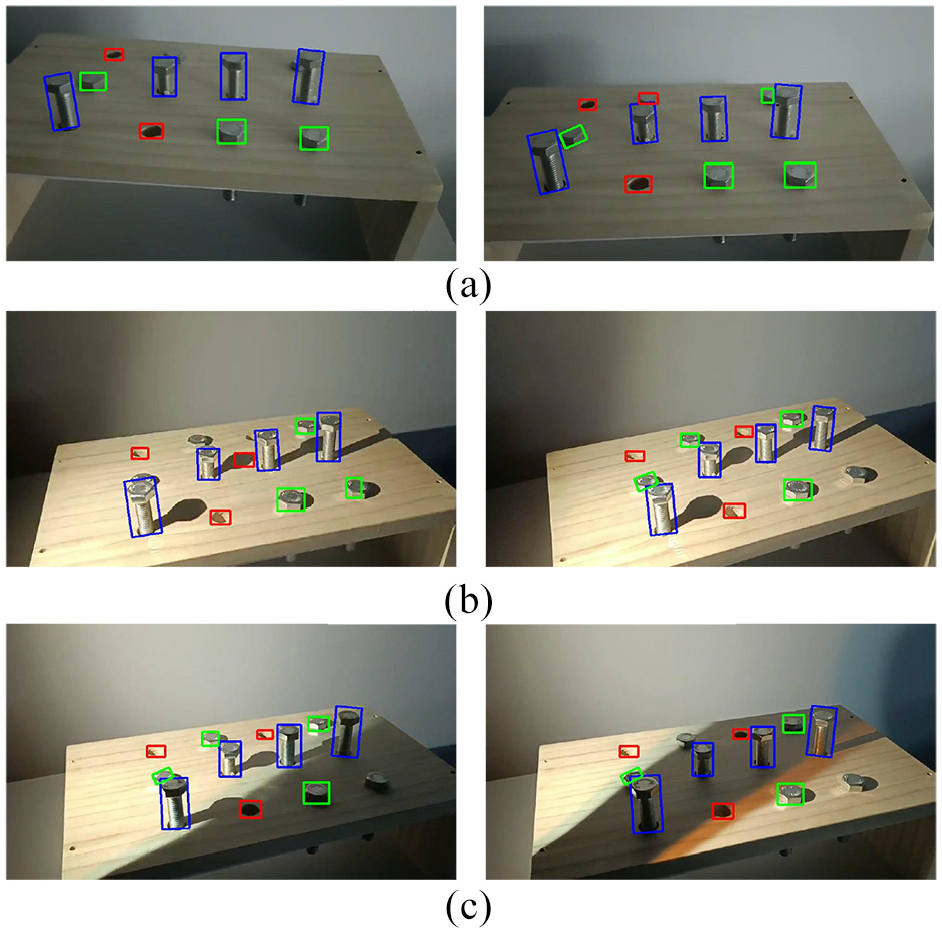
Identification results of bolts under different illuminations: (a) darkness, (b) unilateral illumination, and (c) shadow.
Bolt damage detection accuracy under different illuminations.
Quantification of looseness damage
The evaluation results showed that the model can accurately identify and locate the “loose,”“tight,” and “fell off.” In this article, the extension of screw is regarded as a type of bolt damage. However, the different extension lengths of screw represent different degrees of looseness damage. Therefore, in order to further quantify the degree of bolt looseness damage, a damage parameter is proposed. As the distance between the camera and the bolt changes, so does the size of the bolt in the image. Thus, the size of bolts should not be selected as the damage parameter. It is appropriate to use the aspect ratio of the identified bounding box as the damage parameter.
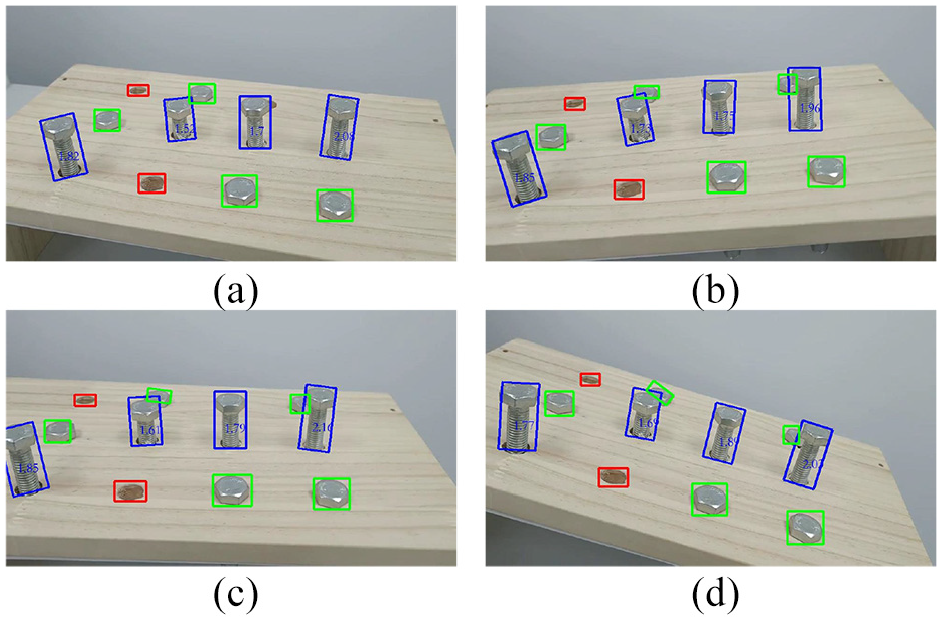
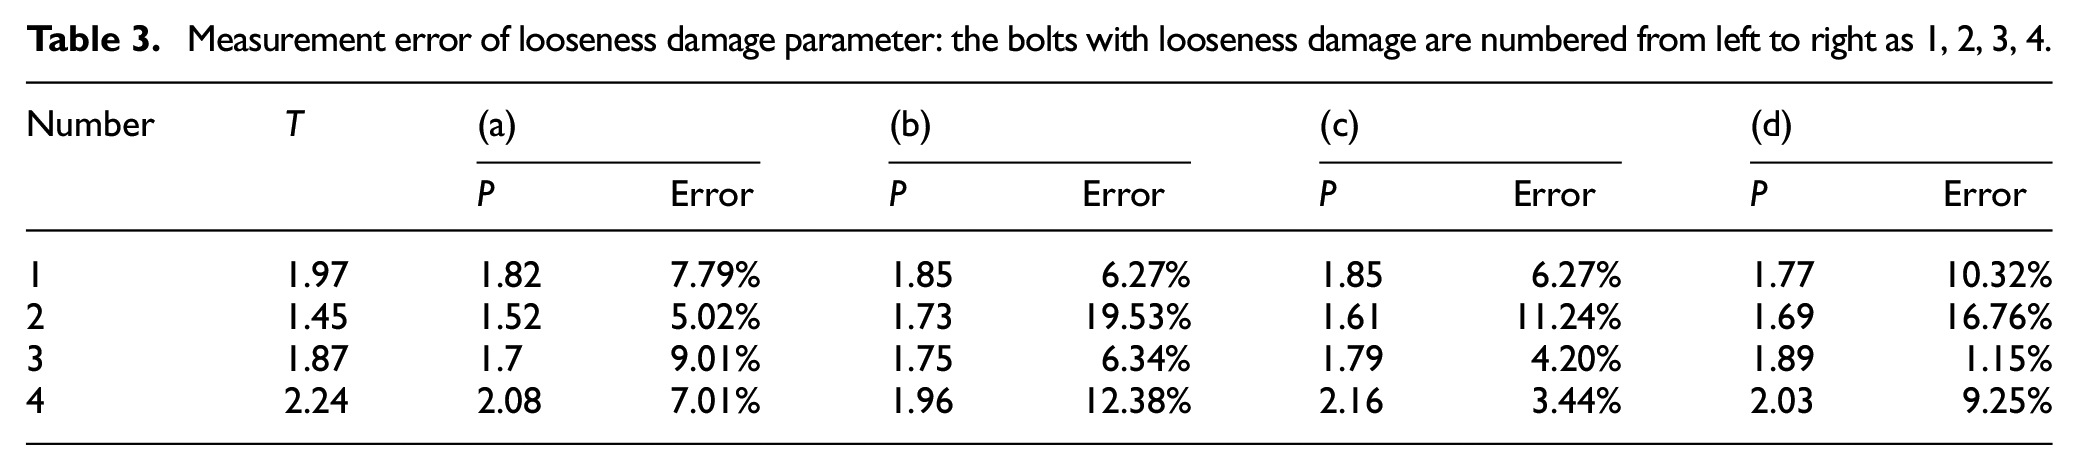
The aspect ratio of the identified bounding box is shown directly on the image for easy viewing by the inspector. The detection accuracy of the damage parameter is further illustrated by the validation experiment. First, four bolts with different looseness degrees were selected randomly, and their aspect ratios were manually measured using a ruler. Then, multiple images were taken from different orientations using a smartphone, and the identification results are shown in Figure 11. It can be seen from the figure that the model can complete the bolt damage identification with high precision, and output the damage parameters of bolt looseness damages in real time. Table 3 shows the damage parameters of bolt looseness damages in the four images. T is the actual value; P is the estimated value. As a vision-based approach, the proposed method will be affected by the sharp camera angles, whereas the identification results of bolts, especially those with small aspect ratio, are sensitive to low vertical angles. Thus, the error of No. 2 bolt damage parameter is larger than others. This is also the limitation of the proposed method. The average identification error of the other three bolt damage parameters is less than 10%. The bolt damage identified in this article is large looseness damage. The aim is to complete rapid macroscopic damage location and identification instead of manual inspection. The damage parameters of bolt looseness damages will be affected by the elevation angle, which will reduce the detection accuracy of damage parameters. For macroscopic damage, it is sufficient to determine whether it belongs to damage. This article attempts to further quantify the characterization of looseness damage, in order to provide reference for infrastructure management and maintenance.
Quantitative results of looseness damage.
Measurement error of looseness damage parameter: the bolts with looseness damage are numbered from left to right as 1, 2, 3, 4.
Real-time damage monitoring
When vision-based damage detection method is used instead of manual inspection, the detection accuracy and the speed are important factors to be considered. A real-time bolt damage detection system is established in this article. The system transmits the video captured by the camera into the deep learning model, which can accurately identify damages in real time. The detection results are saved in the form of images. Figure 12 shows the bolt damage identification results of 10 consecutive frames. The results showed that the model still has high identification accuracy when the video frames are processed continuously. In the process of real-time detection, detection time is an important performance parameter. Generally, frames per second (FPS) is used to measure the real-time performance of the model. On an Nvidia Quadro P4000 GPU with CUDA® Deep Neural Network library (cuDNN) acceleration, this model runs at 66.67 ms per frame, or 15 FPS. Thus, the deep learning–based damage identification method can meet the needs of real-time detection.
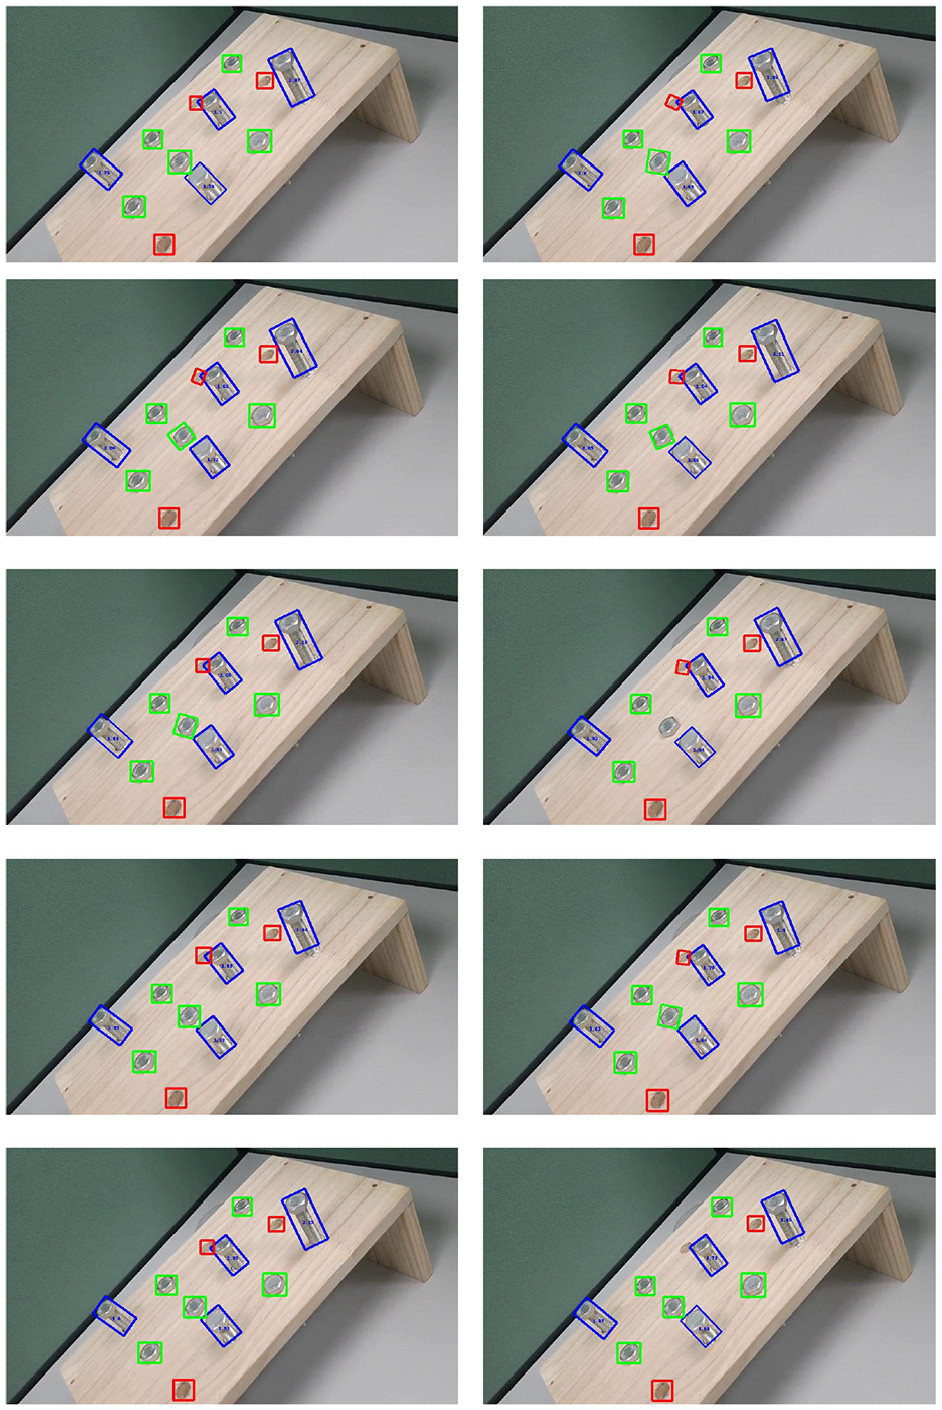
Identification results of 10 consecutive frames.
Discussion and conclusion
In this article, a bolt damage identification using OA-CenterNet is proposed. This method overcomes the problem of inaccurate positioning of non-vertical bolts in horizontal box detection. Although the semantic segmentation algorithm can identify targets at the pixel level, semantic segmentation data sets are extremely insufficient and the models are difficult to train. Therefore, rotated bounding box not only can locate the target more accurately but also does not substantially increase the labeling cost of data set. The proposed method uses machine vision to complete the real-time monitoring of bolt damages. However, it also has some limitations and disadvantages. First, when the aspect ratio of bolts may be only minor variation or even unvaried, the bolts in images are almost unchanged. As a vision-based approach, the proposed method can only identify bolt damages through the changes of bolts in images. Therefore, the proposed method cannot detect the micro looseness damage of bolts. Second, vision-based approach will be affected by the sharp camera angles. Thus, a varying horizontal angle was considered to overcome this issue. Third, occlusion is the basic element that limits the information in an image. Objects that are heavily occluded are more difficult for a classification algorithm than unobstructed objects. In the field of machine vision, occlusion still has a significant impact on target identification. Hence, multiple cameras can be used to reduce the chance of objects being occluded.
The accuracy of the proposed method was validated by a bolt damage data set collected in the laboratory. The experimental results showed that it can accurately identify and locate three types of bolt states—mAP is 0.9650, F1-score is 0.9471, and mIoU is 0.8536. The stability of the model was verified under different lighting conditions. However, deep learning can improve detection performance by learning a large number of sample data. When the diversity of samples in the data set increases, the identification and generalization ability of deep learning model will be further improved. To refine the detection results, the aspect ratio of the rotated bounding box is used as the damage parameter of the bolt looseness damage. Finally, the videos recorded by the camera were fed into the detection model to complete the real-time bolt damage detection. The proposed method has the potential to replace manual inspection and quickly count the number and status of bolts in a structure, thus providing data support for subsequent structural maintenance.
Footnotes
Declaration of conflicting interests
The author(s) declared no potential conflicts of interest with respect to the research, authorship, and/or publication of this article.
Funding
The author(s) disclosed receipt of the following financial support for the research, authorship, and/or publication of this article: This research was supported by the Science and Technology Development Fund of the Macau SAR under research grant SKL-IOTSC-2018-2020.