
Abstract
Multifractal detrended fluctuation analysis (MFDFA) is proved to be a powerful tool for fault diagnosis of rotating machinery due to its ability to reveal multifractal structures hidden in nonstationary and nonlinear vibration signals. To overcome the discontinuity of the fitting scale-dependent trend and the poor adaptability of this algorithm, Empirical Mode Decomposition-Multifractal Detrended Fluctuation Analysis (EMD-MFDFA) is introduced. However, EMD-MFDFA runs into difficulties in reverse segmentation and the selection of the expected Intrinsic Mode Functions (IMFs). Aiming at solving these deficiencies, a Modified EMD-MFDFA (MEMD-MFDFA) approach with IMF selection strategy and Step-Moving Window (SMW) segmentation method is proposed in this paper. In MEMD-MFDFA, a metric for distinguishing deterministic and random components is established to select expected IMF components by scaling exponent. Meanwhile, SMW segmentation method is exploited to reduce the estimated errors caused by reverse segmentation. The robustness of the proposed method is investigated through comparing MEMD-MFDFA, MFDFA, and EMD-MFDFA by multifractality of simulated signals with different Signal-to-Noise Ratio (SNR). Furthermore, the proposed approach is applied to three bearing run-to-failure datasets containing three types of faults, and the results show that the multifeatures of the multifractal spectrum obtained by MEMD-MFDFA have the ability to simultaneously identify early fault and assess performance degradation of bearings.
Keywords
Introduction
As one of the decisive parts responsible for the transmission of rotating machinery, the rolling bearing is more prone to failure under extreme working conditions or long operation time. Its abnormal operation or even failure is often the reason for the unplanned shutdown of rotating machinery. 1,2 Consequently, the development of a bearing health monitoring system is not only conducive to the early detection of the abnormal state of bearing in the operation process, but also provides valuable advice for predictive maintenance by assessing the severity of defect evolution. 3,4 With the purpose of monitoring health condition of bearings, it is necessary to extract effective information related to faults and construct degradation assessment indicators being capable of tracking dynamical behavior of the rolling bearing without prior knowledge of the kinematics. 5
In practice, the establishment of health indicators mainly focuses on the extraction of statistical parameters in time domain and characteristics in frequency domain based on vibration signals. 6 Sparsity measures including negative entropy, smoothness index, pq-mean, the ratio of Lp to Lq norm, kurtosis, and Gini index were reformulated with the ratio of different quasi-arithmetic means to monitor the health condition of bearings by Hou et al. 7 Soualhi et al. 8 extracted defective frequencies of different fault types from Hilbert marginal spectrum as health indicators to track the fault evolution of rolling bearings. Meng et al. 9 constructed a health indicator on the basis of multifeatures of envelope spectrum to reflect the severity of bearings in real-time condition monitoring.
Since the fault information that is not obvious in time domain are able to be reflected in the frequency domain analysis, and vice versa, some scholars concentrated on the indicator construction based on features in time-frequency domain. The time-frequency analysis method is appropriate for revealing the time-varying features of frequency components from nonlinear and nonstationary vibration signals, which presents the partial characteristics in both time and frequency domains simultaneously. 10 Although the high time-frequency resolution can be obtained using Wigner-Ville Distribution (WVD), 11 Short-Time Fourier Transform (STFT), 12 and Wavelet Transform (WT), 13 the sufficient prior knowledge of the analyzed signal is required in advance. Empirical Mode Decomposition (EMD), 14 as a parameter-free time-frequency method, can adaptively decompose a multi-component signal into multiple Intrinsic Mode Functions (IMFs) with fixed instantaneous frequencies and a residue, which indicates that EMD is a valid tool to deal with nonlinear and nonstationary signals.
As another feature extraction method for revealing the hidden fractal structures of vibration signals, Detrended Fluctuation Analysis (DFA) is also widely used in the processing of nonlinear signals. 15 Because the inherent fractal structures of the bearing vibration signals under different health conditions are also different to some extent, it makes possible to reflect the performance degradation condition of bearings by measuring the fractal structures. However, since nonstationary and nonlinear vibration signals usually exhibit multifractal characteristics, only a mono-fractal characteristic obtained from DFA method would fail to adequately expose the nature of their dynamical mechanism. 16 Although the crossover property of the scaling-law curve in DFA method can be used to demonstrate the multi-scale behaviors of complex signals and detect rotary machinery faults, 16,17 the DFA method only can reveal the total fractal characteristics of them, and lacks the depiction of their local fractal characteristics. 18
In order to measure the multifractal characteristics of nonstationary time series from different local scales, the multifractal DFA (MFDFA) was proposed by Kantelhardt et al. 19 Recently, MFDFA has gradually developed into a popular multifractal analysis method that can effectively uncover the multifractality of nonlinear vibration signals due to its simple execution. In view of the conspicuous difference in multifractality characteristics of vibration signals under different bearing health conditions due to different dynamic mechanisms, the extraction method based on multifractal features is applied to fault diagnosis and detection in practical application. 20,21 Furthermore, some studies focused on the application of adaptive signal decomposition methods to MFDFA, such as Local Characteristic-scale Decomposition (LCD), 22 Intrinsic Time-scale Decomposition (ITD), 23 EMD, 18 and Variational Mode Decomposition (VMD), 24 which are employed to decompose a signal into a series of sub-signals with different local scales, and improve the accuracy of fault diagnosis by extracting the inherent fractal features of this sub-signals. Although the effective behavior of multifractal characteristics in recognition of rotating machinery including diverse fault types and severity under different running conditions was verified by experimental results in the above researches, they cannot still fully explain the effectiveness of multifractal features for monitoring the health condition of the complex system in real time. Accordingly, Hu et al. 25 calculated multifractal characteristic parameters from vibration signals to identify the initial fault stage of the test bearing and further track its performance degradation trend during subsequent operation. Considering that vibration signals of running bearings are vulnerable to background noise in the incipient fault stage, Chen et al. 26 used the improved VMD algorithm to denoise the raw signal and carried out multifractal analysis on the preprocessed signal to obtain the improved multifractal features, and the results show that the extracted features are more sensitive to the incipient fault of rolling bearings. Even so, there are still some problems to be solved for the application of MFDFA in condition monitoring of bearings. 27–30 Firstly, the appropriate polynomial order needs to be chosen for the local scale-dependent trend. Secondly, scales are set empirically. Thirdly, new pseudo-fluctuation errors are produced on account of the discontinuity at the corresponding polynomial fitting trend of two adjacent segmentations. Fourthly, the order of the original time series is disrupted by reverse segmentation, which will lead to estimation errors of multifractal features.
In order to solve these problems of MFDFA, Ihlen 27 proposed Empirical Mode Decomposition-Multifractal Detrend Fluctuation Analysis (EMD-MFDFA), which exploited EMD to obtain smooth fitting scale-dependent trends defined by a group of IMFs with mono-component and specific time scale from a nonstationary and nonlinear signal for MFDFA. Unfortunately, the last problem of MFDFA mentioned above has not been solved. In addition, there may be pseudo-components in the IMF components acquired from EMD, 31 which will have a negative impact on the derived multi-scale trends. Hence, Du et al. 28 developed a criterion to pick out the true components for fault diagnosis based on the correlation analysis between the profile of the original signal and IMF components derived by EMD in frequency domain. The results can be seen from the study of Du et al. 28 that the extracted multifractal features are suitable for identifying the abnormal state of the running bearing, but they cannot be used to track the fault evolution trend in the performance degradation stage. For a health indicator utilized to monitor bearing health condition, it needs to identify the early fault and simultaneously assess performance degradation of bearings. The poor performance of multifractal features based on this feature extraction method in bearing performance condition monitoring can be attributed to two reasons. On the one hand, the criterion used to distinguish the true components from IMFs is not established based on the impulse response characteristics of the fault bearing, and it is difficult to accurately distinguish the useful IMF components by the correlation criterion when the original signal is seriously contaminated by noise. On the other hand, the estimation errors of multifractal features caused by the reverse segmentation of MFDFA are overlooked.
With the purpose of addressing these two problems and extracting more sufficient information related to multifractal characteristics hidden in vibration signals for incipient fault identification and performance degradation assessment, a Modified EMD-MFDFA (MEMD-MFDFA) method is proposed based on the IMF selection strategy and Step-Moving Window (SMW) segmentation method. To begin with, a metric for selecting the expected IMF components to reconstruct signal is established in this paper by applying the scaling exponent, which is an effective tool in DFA method to measure the determinism and randomness without relying on comparison and reference to the original noisy signal. Furthermore, the SMW algorithm is introduced to substitute for the original piecewise method to avoid unnecessary errors caused by the order disruption of vibration signals. Additionally, the feasibility of MEMD-MFDFA method is verified numerically and experimentally through comparing with other multifractal analysis methods.
The remainder of this paper is organized as follows. In section “Theoretical background,” the theoretical background with respect to DFA and EMD is described concisely. In section “Modified EMD-based MFDFA algorithm,” a metric for distinguishing deterministic and random IMF components is developed based on the scaling exponent. Meanwhile, MEMD-MFDFA on the basis of IMF selection strategy and SMW segmentation method is introduced. In section “Analysis of simulated multifractal signal” and section “Application of proposed method in run-to-failure lifetime testing,” the developed MEMD-MFDFA method is exploited to analyze the simulated multifractal signal and experimental bearing vibration signals in the run-to-failure experiment, respectively. Finally, some further discussions and conclusions are given in section “Discussion” and section “Conclusion.”
Theoretical background
Detrended fluctuation analysis method
As a property hidden in the time series, long-range correlation is used to reflect the dependence strength between the time series and its time-shifted version. Compared with the Hurst exponent, 32 the scaling exponent based on DFA is more appropriate for detecting and correctly quantifying the long-range correlation of nonstationary time series. 33
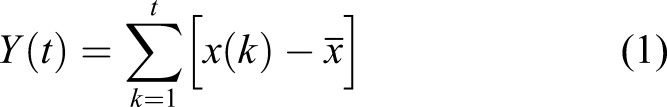
Considering a given time-series signal x(t)
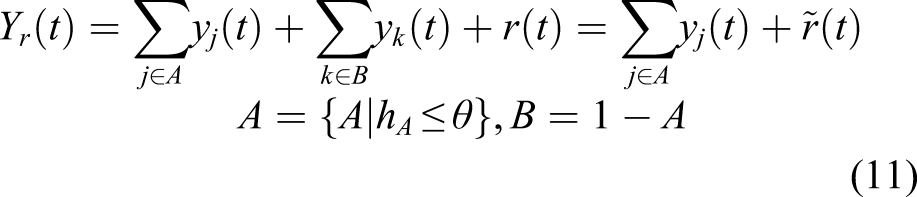
The relationship between As reported in the study of Dong et al.,
35
the correlation of the analytic time series x(t) is closely related to the relationship between


Empirical mode decomposition algorithm
EMD is a data-driven adaptive multi-component signal decomposition tool introduced by Huang et al.,
14
which is capable of decomposing nonlinear and nonstationary signals into IMFs and a residue so that their sum is equal to the original signal. In EMD, IMFs need to satisfy two conditions:
36
First of all, the number of local extreme points and over-zero points of the whole data are required to be equal to or at most one difference from each other. The second is that the average of the two envelopes estimated by the local maxima and minima is supposed to be zero. After the sifting process,
31
the all obtained IMFs
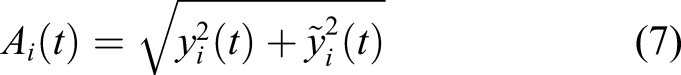
The Hilbert transform is performed on each IMF to obtain the instantaneous amplitude and instantaneous frequency. In the Hilbert transform theory,
37
a complex-valued analytic signal can be constructed from a real signal by an exponential term and its real envelope. Therefore, a complex-valued analytic signal

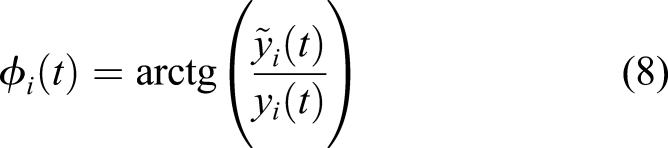
The instantaneous frequency corresponding to each IMF is defined by equation (9)
Modified empirical mode decomposition-multifractal detrended fluctuation analysis algorithm
Overlap segmentation based on step-moving window
In the studies of temperature series, 38 it is considered that points on a temperature series usually have a better correlation with points close to them. Likewise, the relationship would hold for points in the time series. Therefore, in time series data processing, the dependence of data at different time points is very important. 39
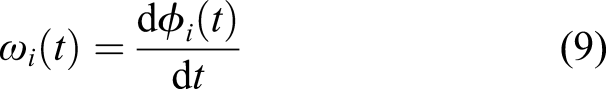
As depicted in Figure 1(a), Schematics of different segmentation methods. (a) Non-overlapping division in opposite order, (b) Overlap division with SMW.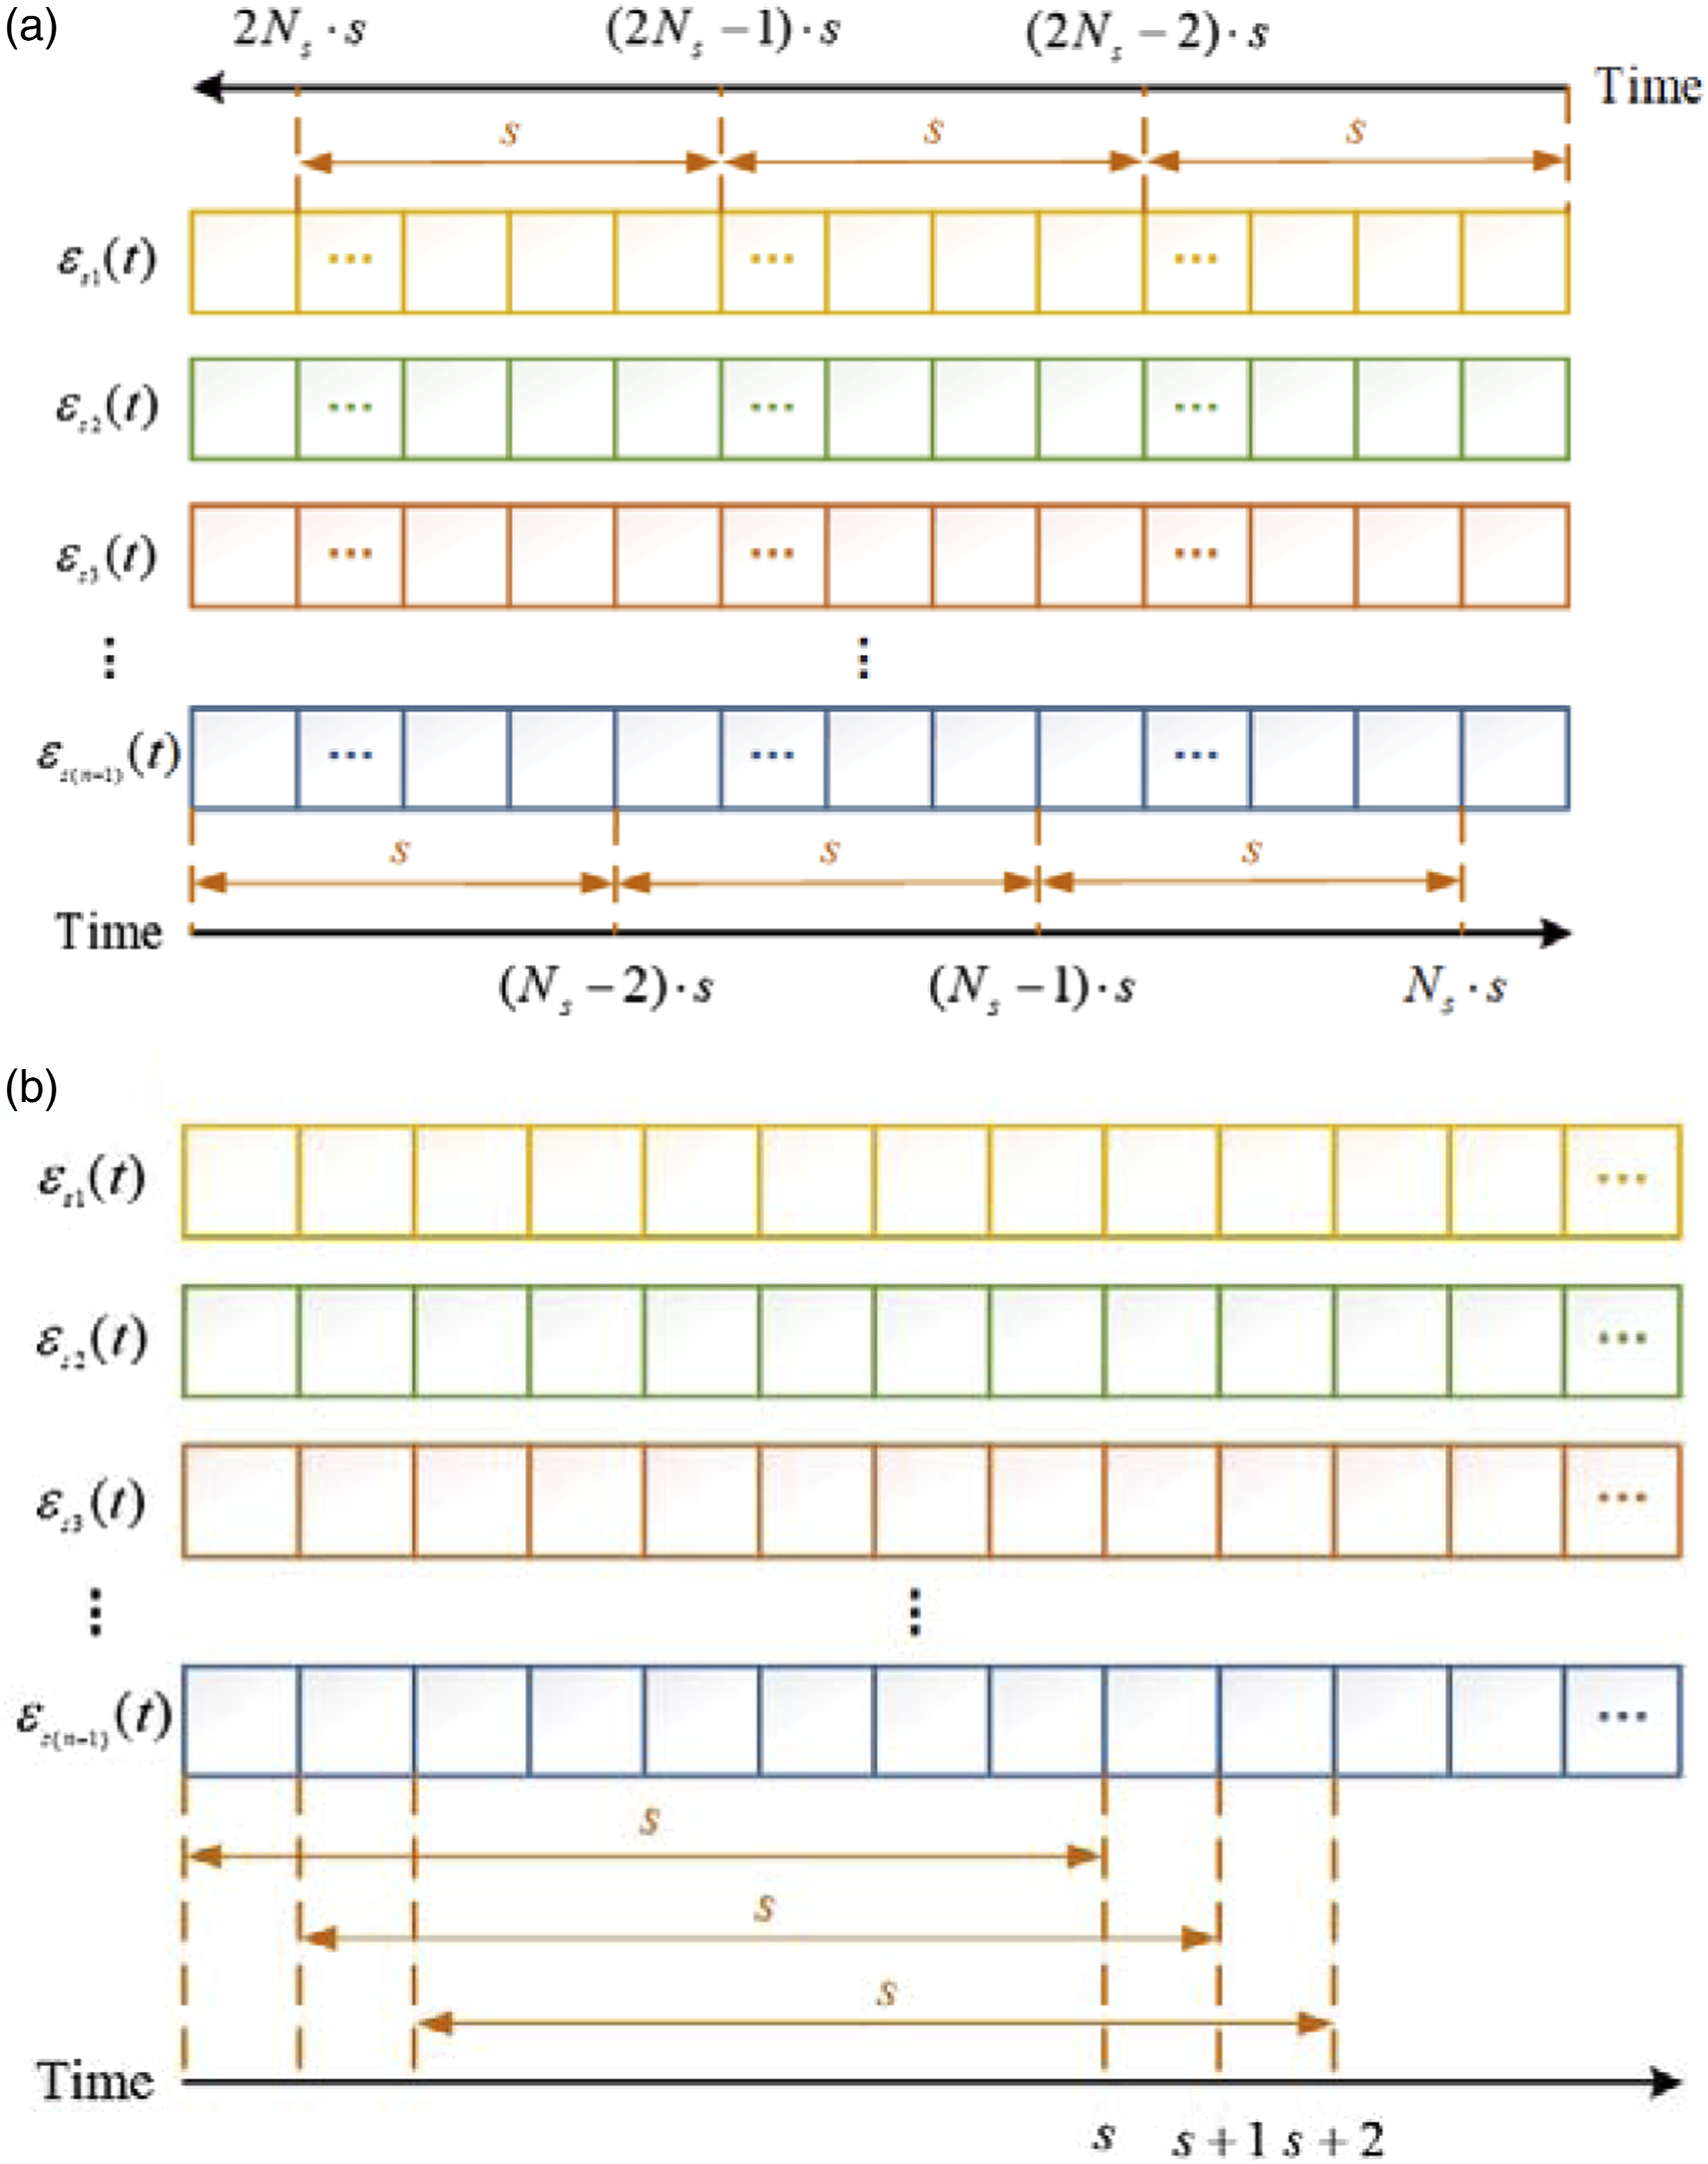
The correlation is enhanced by placing the adjacent points on the same segment of time series, which helps to obtain a reliable local fluctuation of time series and extract a more accurate trend. The segmenting method based on the SMW algorithm avoids the divisibility between the length N of time series and the time scale s, so it makes full use of the information provided by the time series. Additionally, there is not order disruption of the original time series caused by reverse segmentation.
Evaluation indicator for intrinsic mode function selection
The scaling exponent h of multifractal simulation signal under different SNR that arises from the p-model algorithm in the study of Meneveau et al.
40
is calculated as shown in Figure 2. It can be concluded from the constant scaling exponent that the influence of the small amount of noise on the long-range correlation of the original signal is very small when the SNR is large. However, with the continuous reduction of the SNR, the scaling exponent h decreases continuously due to the destruction of the long-range correlation of the signal caused by the gradually strong noise. Scaling exponent h of multifractal simulation signal with different SNR.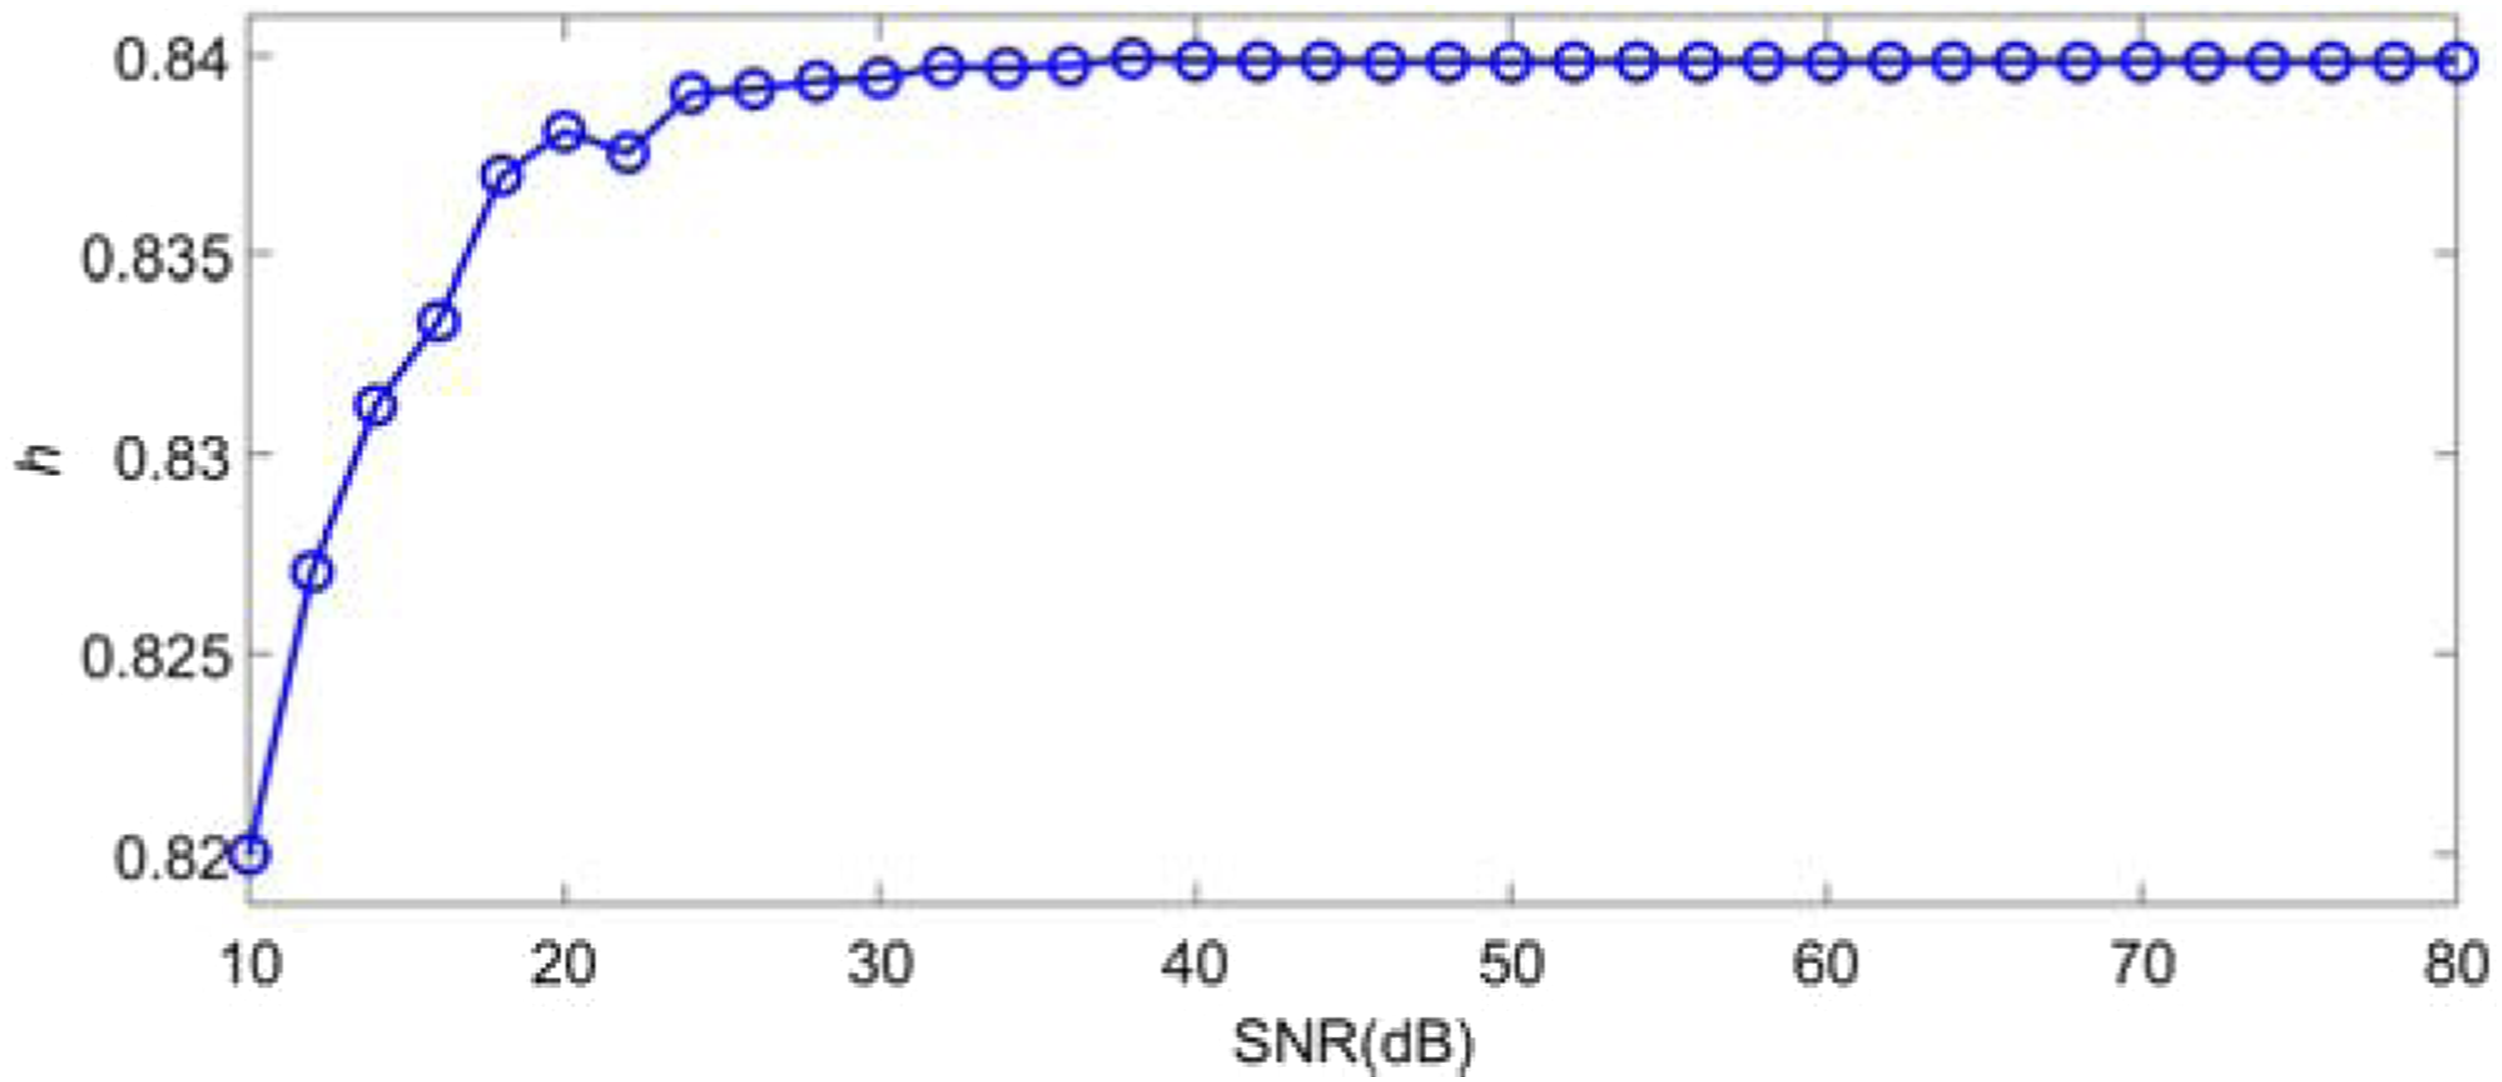
With the assistance of EMD, signals with SNR of 60–80 dB and 10–30 dB are decomposed into multiple IMF components with specific time scales, of which scaling exponent h are computed as depicted in Figure 3. From Figure 3, it can be observed that the trends of the scaling exponent h at both ends are steady, which implies that the IMF components in these two regions have a good correlation, respectively. Meanwhile, each of the IMF components located in the ascending tendency of the scaling exponent h shows varying degrees of correlation with other components. By comparing Figures 3(a) and (b), it is obvious that the similar IMF components with smaller scaling exponent h are more sensitive to background noise and exhibit much difference in long-range correlation with the variance of noise intensity. On the contrary, in the case of different SNR, the similar IMF components with larger scaling exponent h still maintain basically unchanged long-range correlation, which means that the information on the deterministic original signal is retained in the IMF components with larger scaling exponent. Furthermore, it can be reasonably inferred that the random noise is more concentrated in the IMF components with smaller scaling exponent h. As a result, the deterministic and random components could be effectively distinguished by means of the scaling exponent h. Scaling exponent h of IMF components from multifractal simulation signal with different SNR in the area of: (a) 60–80 dB, (b) 10–30 dB.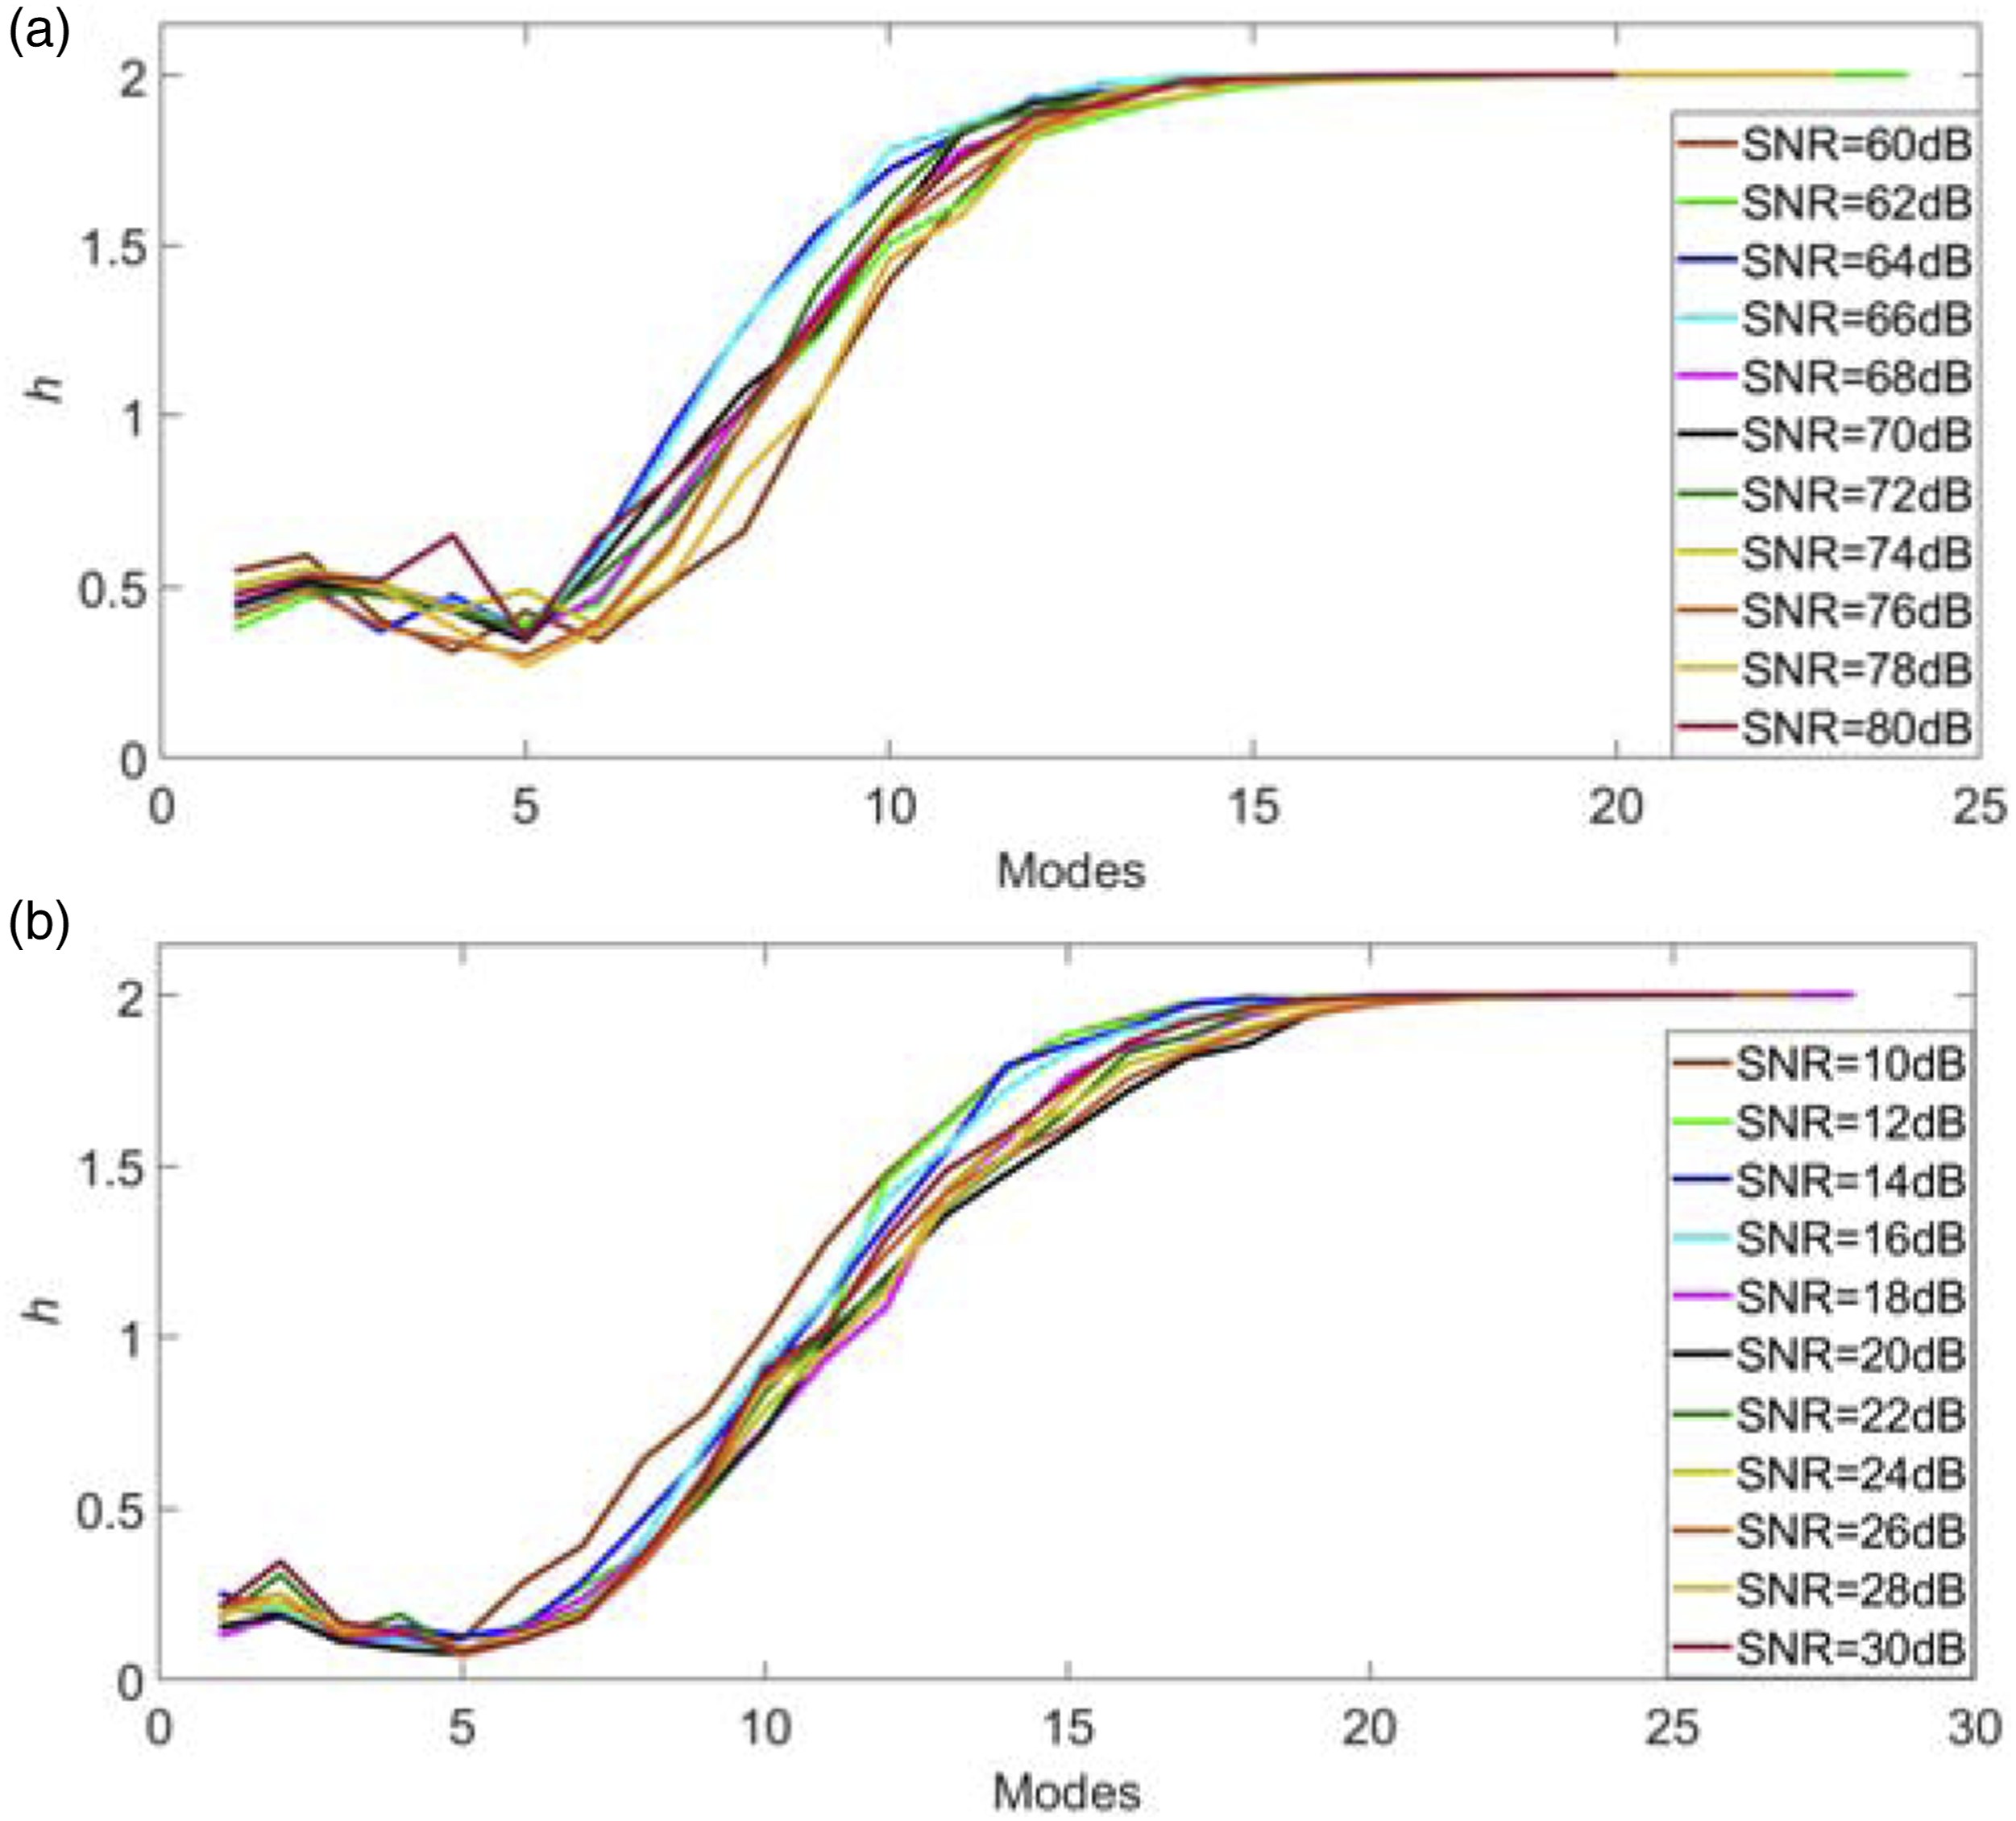
In the signal processing for recovering the diagnostic information, the components with different properties in the vibration signal of the bearing are supposed to be separated in time. A more universal splitting at present is between deterministic and random components. 41 The repeated shocks caused by a local defect in rolling bearings do not exactly possess periodicity. The reason is that the rolling elements are not quite uniformly placed in the clearance of the cage and the rotating speed of the cage may be unstable due to slipping in the process of operation. Therefore, it is of great significance for fault diagnosis to separate the bearing signals with random impact characteristics from the deterministic signals produced by other components. 42
For the randomly oscillating IMFs in the vibration signals, they will be regarded as useful components in the multifractal analysis of bearing vibration signals on the basis of MEMD-MFDFA. At the same time, the deterministic IMF components with weak oscillation are discarded as noise to enhance fault signals in terms of multifractal characteristics.
In the denoising method, based on the adaptive decomposition of signals, the most critical step is to provide an appropriate threshold for the selected indicator to recover the contaminated signals. According to the above analysis, the maximum scaling exponent corresponding to the obtained IMF components is almost not affected by noise, and can be used as a reference value to judge the effectiveness of the IMF component. Thus, the threshold

The larger the ratio factor
Modified empirical mode decomposition-multifractal detrended fluctuation analysis algorithm
The proposed MEMD-MFDFA consists of five stages as follows.
Stage 1 Adaptive decomposition based on EMD
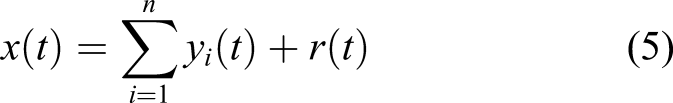
Suppose that x(t)
EMD is employed to decompose the cumulative series Y(t) into several IMFs
Then, the scaling exponent h corresponding to each IMF component is compared with the threshold
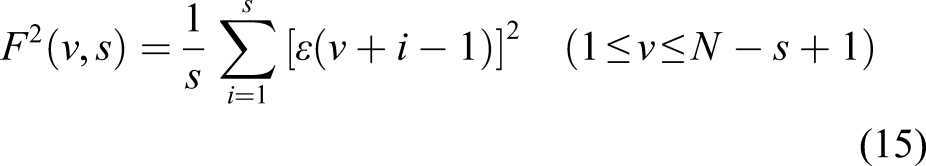
Stage 2 Extraction of scale-dependent fluctuation
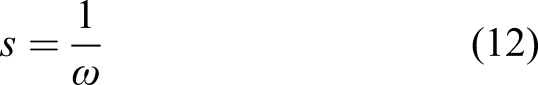
Since the time-series signal is decomposed in terms of the local characteristic time scale through EMD, a group of IMFs with mono-component and specific time scale are acquired. It should be noted that the time scale s of each IMF component can reflect its own oscillation pattern, which has a reciprocal relationship with the mean of instantaneous frequency
In order to discriminate
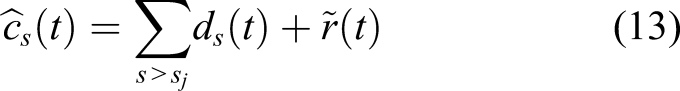
Subsequently, the scale-dependence fluctuation

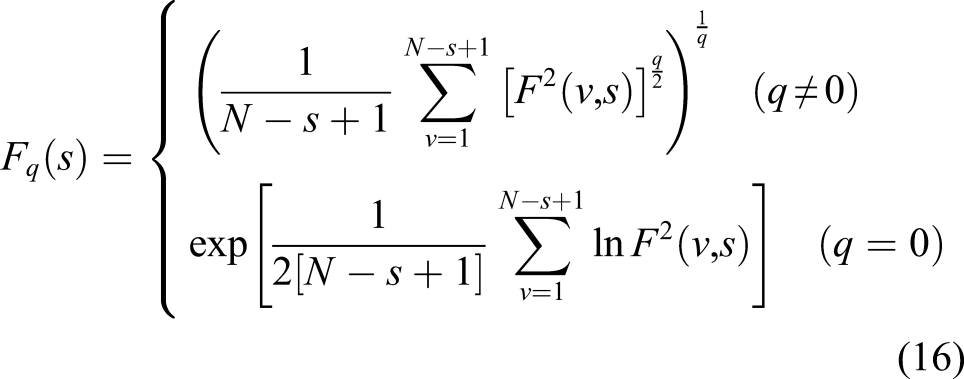
Stage 3 Construction of detrended fluctuation function
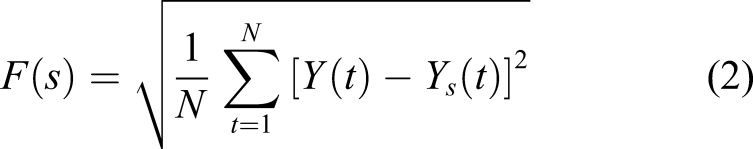
The scale-dependence fluctuation
The fluctuation function
Stage 4 Calculation of multifractal spectrum
The logarithmic relationships between

Here the least square method is applied on the log-log graphs


In the fault diagnosis of rolling bearings based on multifractal characteristics, the complex fractals of the bearing vibration signal can be divided into small regions with different degrees of singularity by multifractal method, and the fault states of the bearing can be found by analyzing their long-range correlation. Singularity exponent
Analysis of simulated multifractal signal
Aiming at demonstrating the effectiveness of the proposed method for multifractal characteristic analysis, the simulated noisy multifractal signal generated through the p-model in the study of Meneveau et al.
40
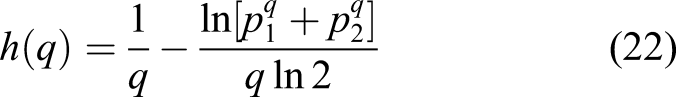
is analyzed by the proposed method in this section. The multifractal signal can be constructed by means of the equal division of unit interval based on this multifractal model. The obtained two sections with the same length will be given different weights, that is, p
1 and p
2. Then the same step above is repeated for each of the sections. Finally, when the number k of repetition is equal to m, the generated multifractal time series

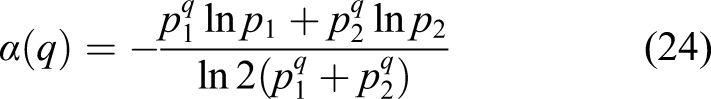
Herein, we use
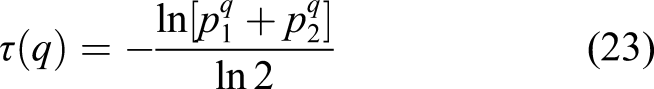
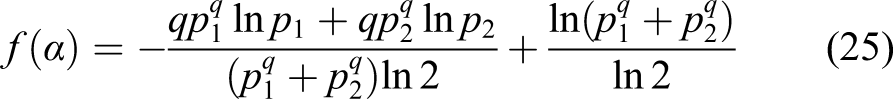
Similarly, the singularity exponent
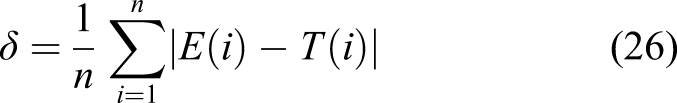
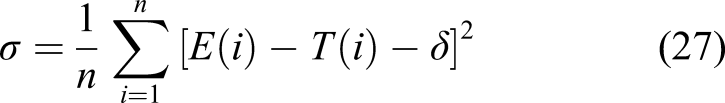
The theoretical values of four multifractal characteristic parameters could be utilized to compare the results of several MFDFA-based employed in multifractal simulation signals. Meanwhile, two evaluation indicators are employed to appraise the performance of these methods, which is beneficial to avoid the subjective judgment in the comparison of analysis results. The average absolute error
In addition, the variance
Considering that the IMFs in the ascending stage of the scaling exponent h may contain a large number of deterministic and/or random components, it is necessary to obtain more sufficient and effective multifractal characteristics through qualitative evaluation and separation of them. As these IMFs with uncertain components are continuously mixed with the random components in the increasing order of scaling exponent, the average absolute errors between the estimated and theoretical Relationship of average absolute error 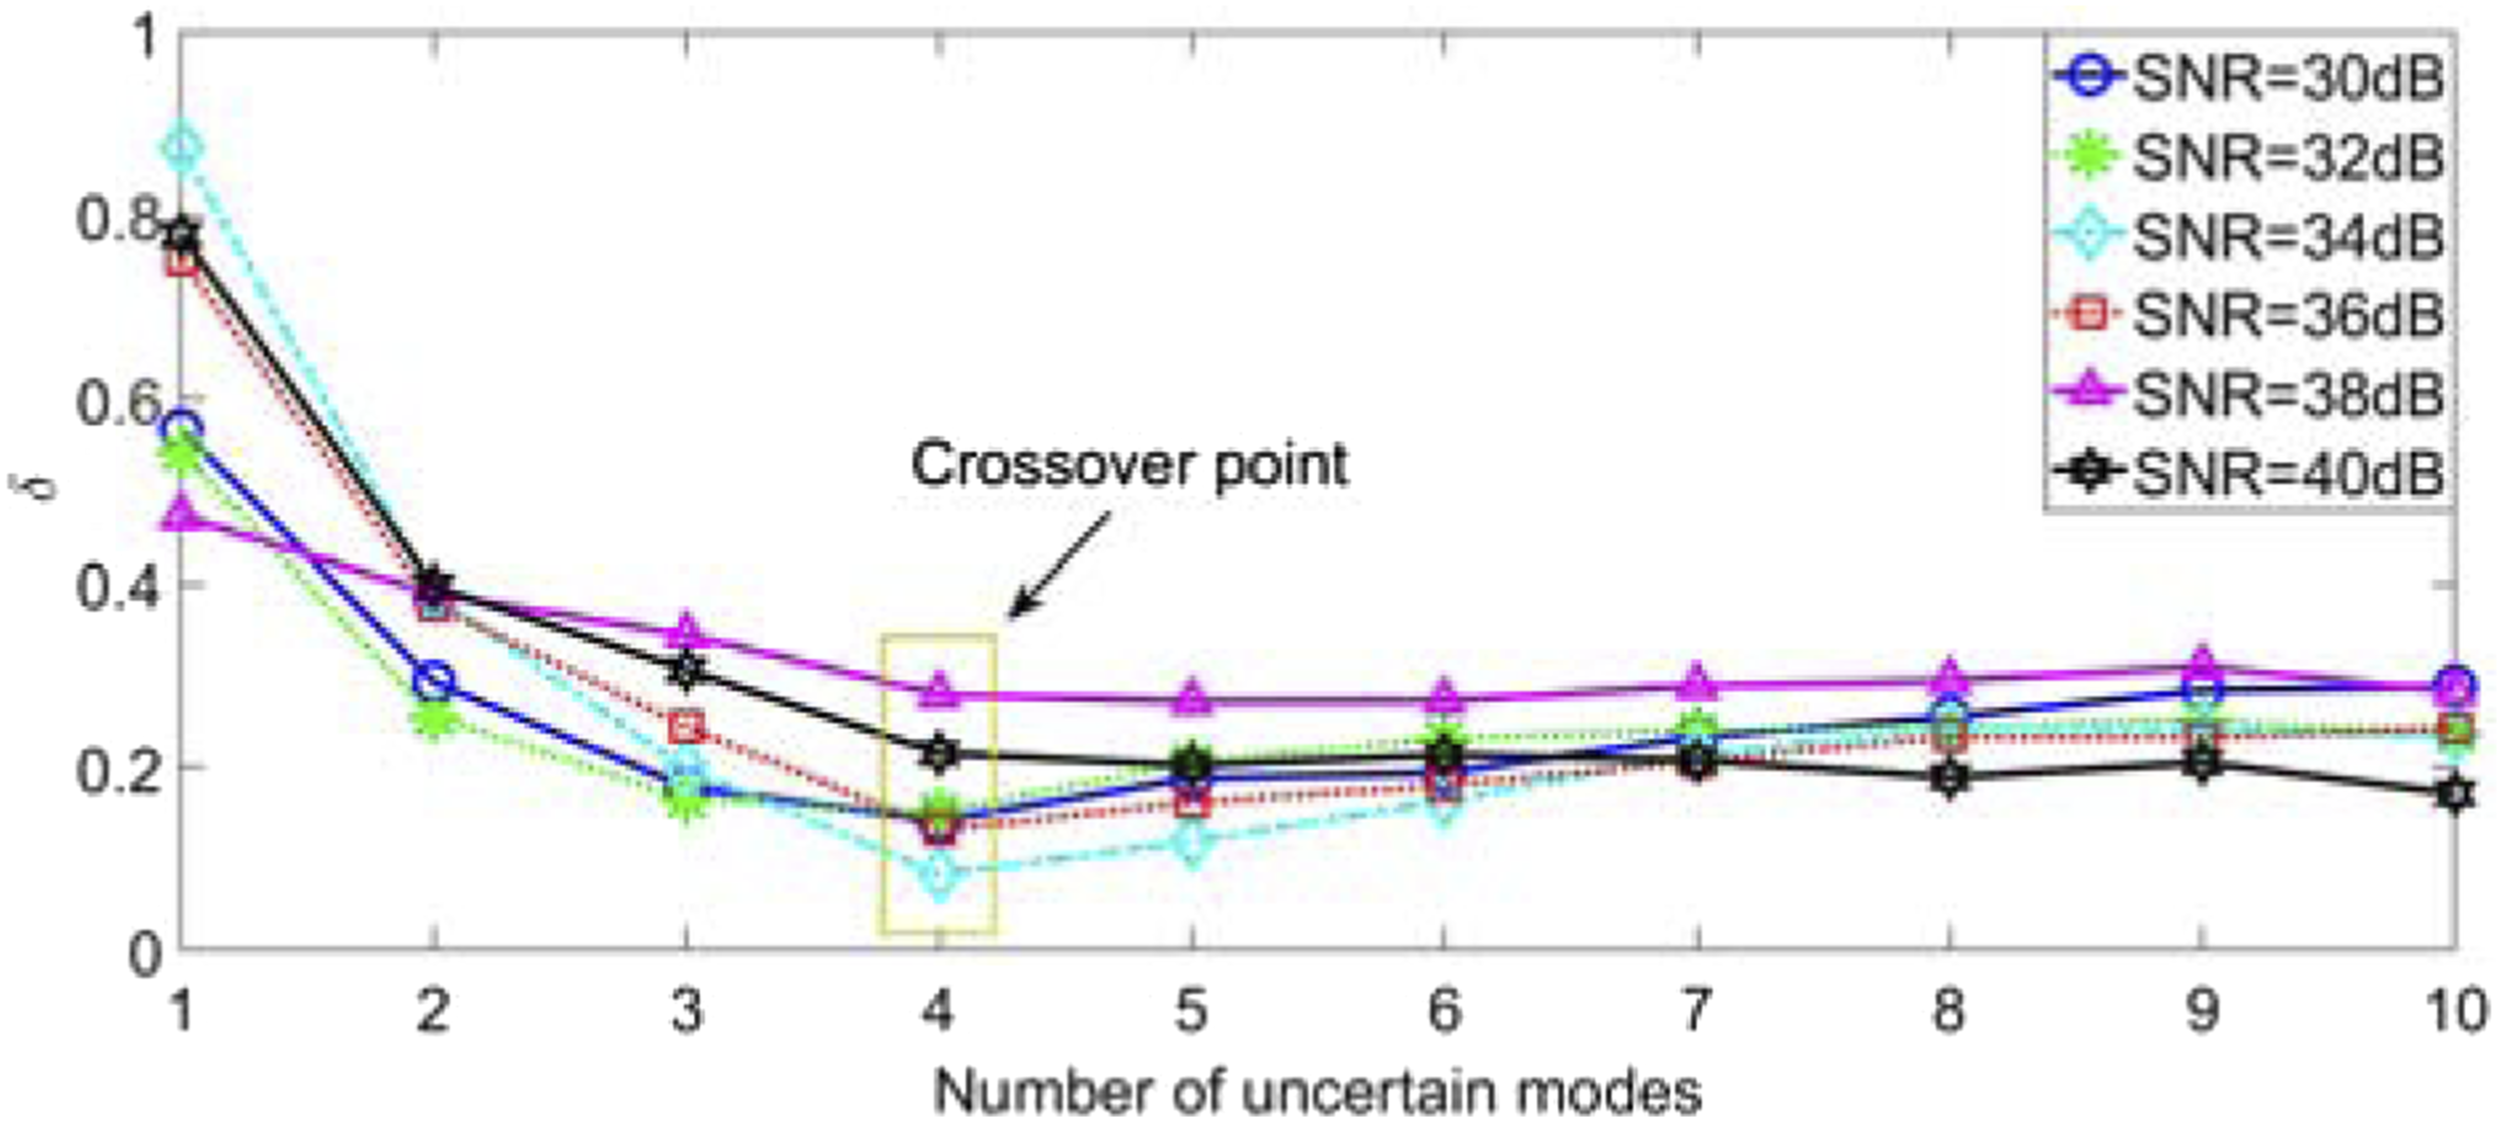
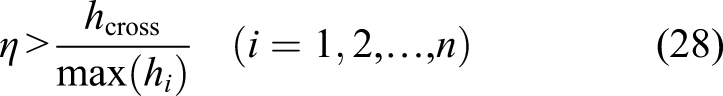
The ratio between Ratio between 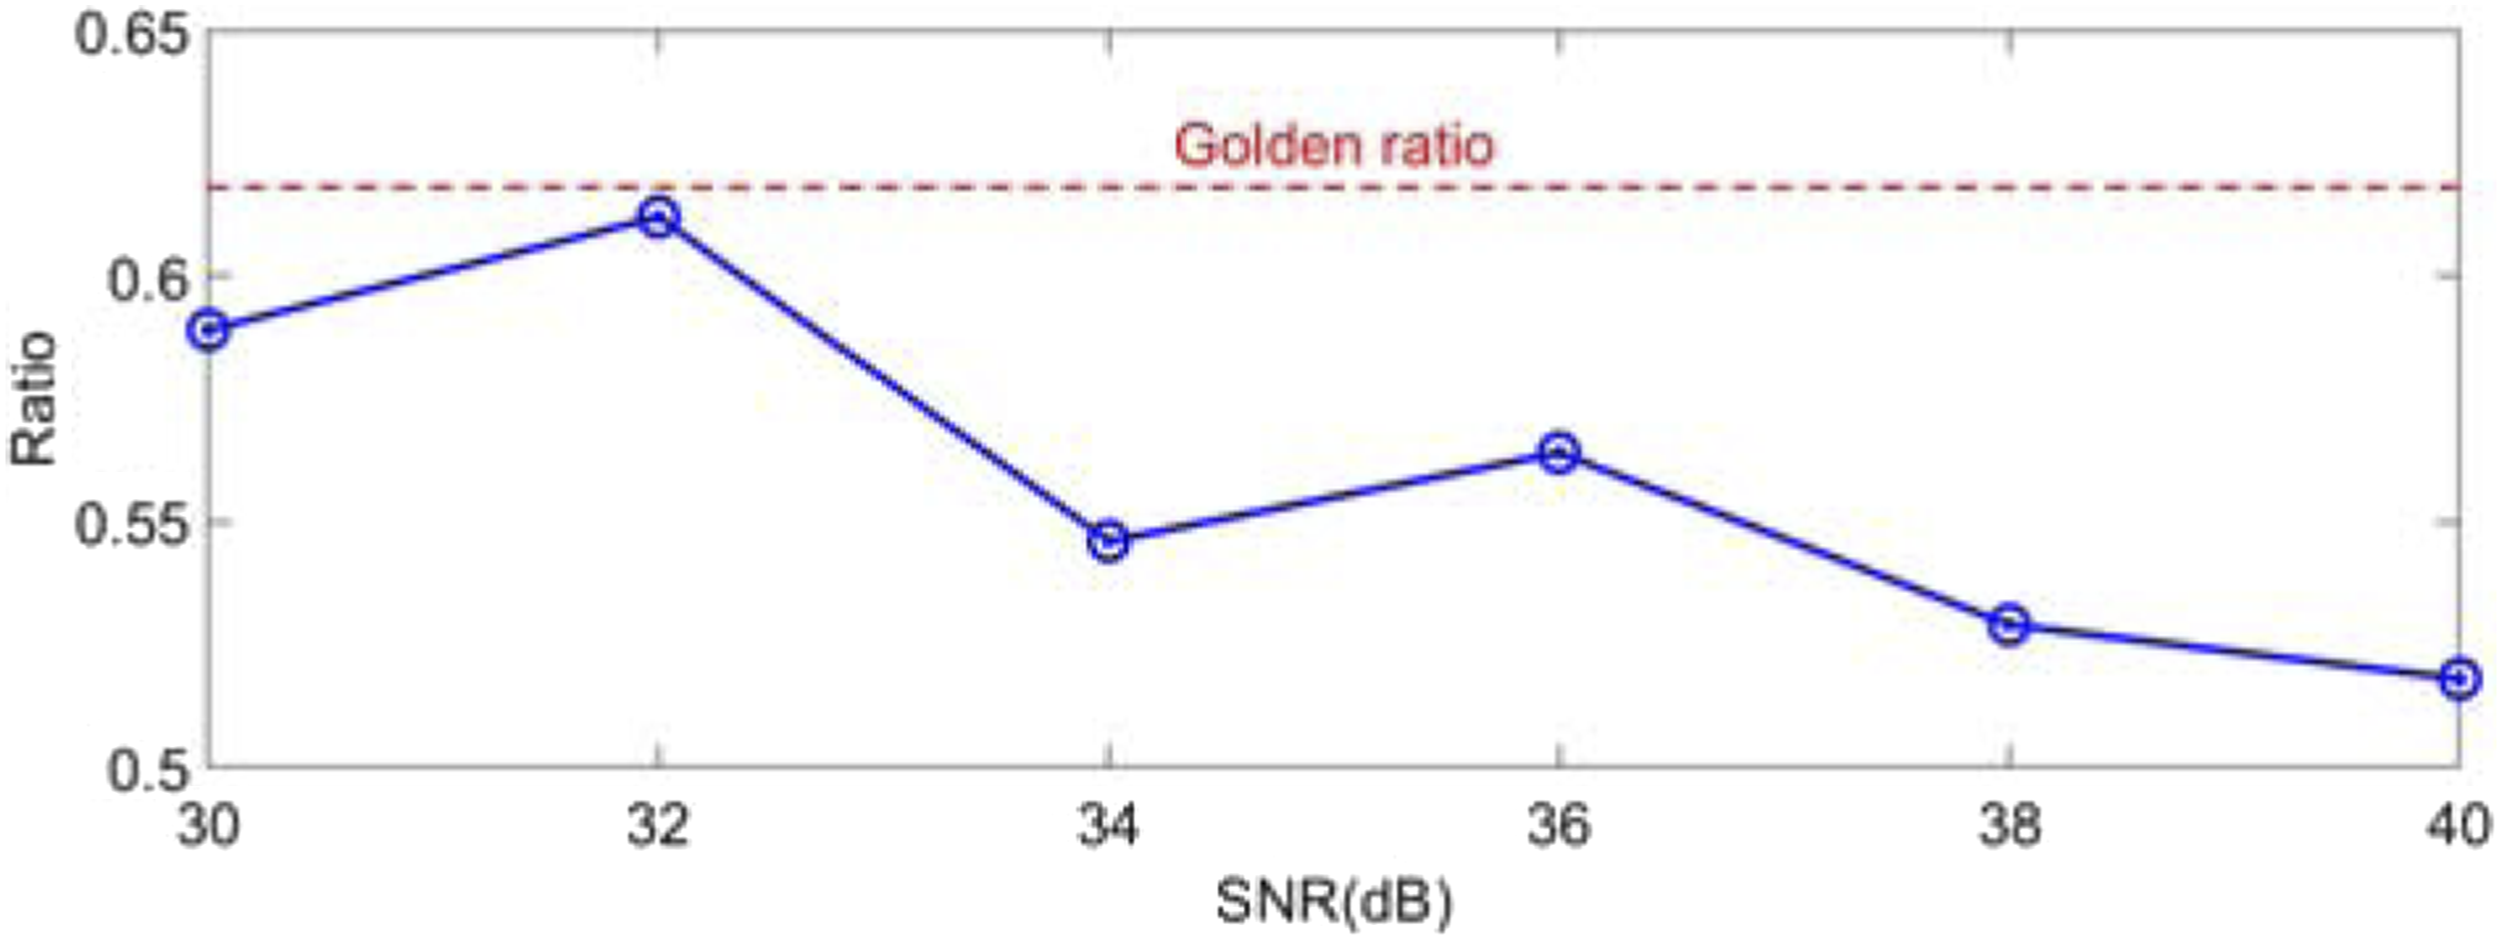
MFDFA, EMD-MFDFA, and the proposed method are also applied to estimate Relationships of (a) Evaluation indicators of multifractal parameters for noisy p-model time series with 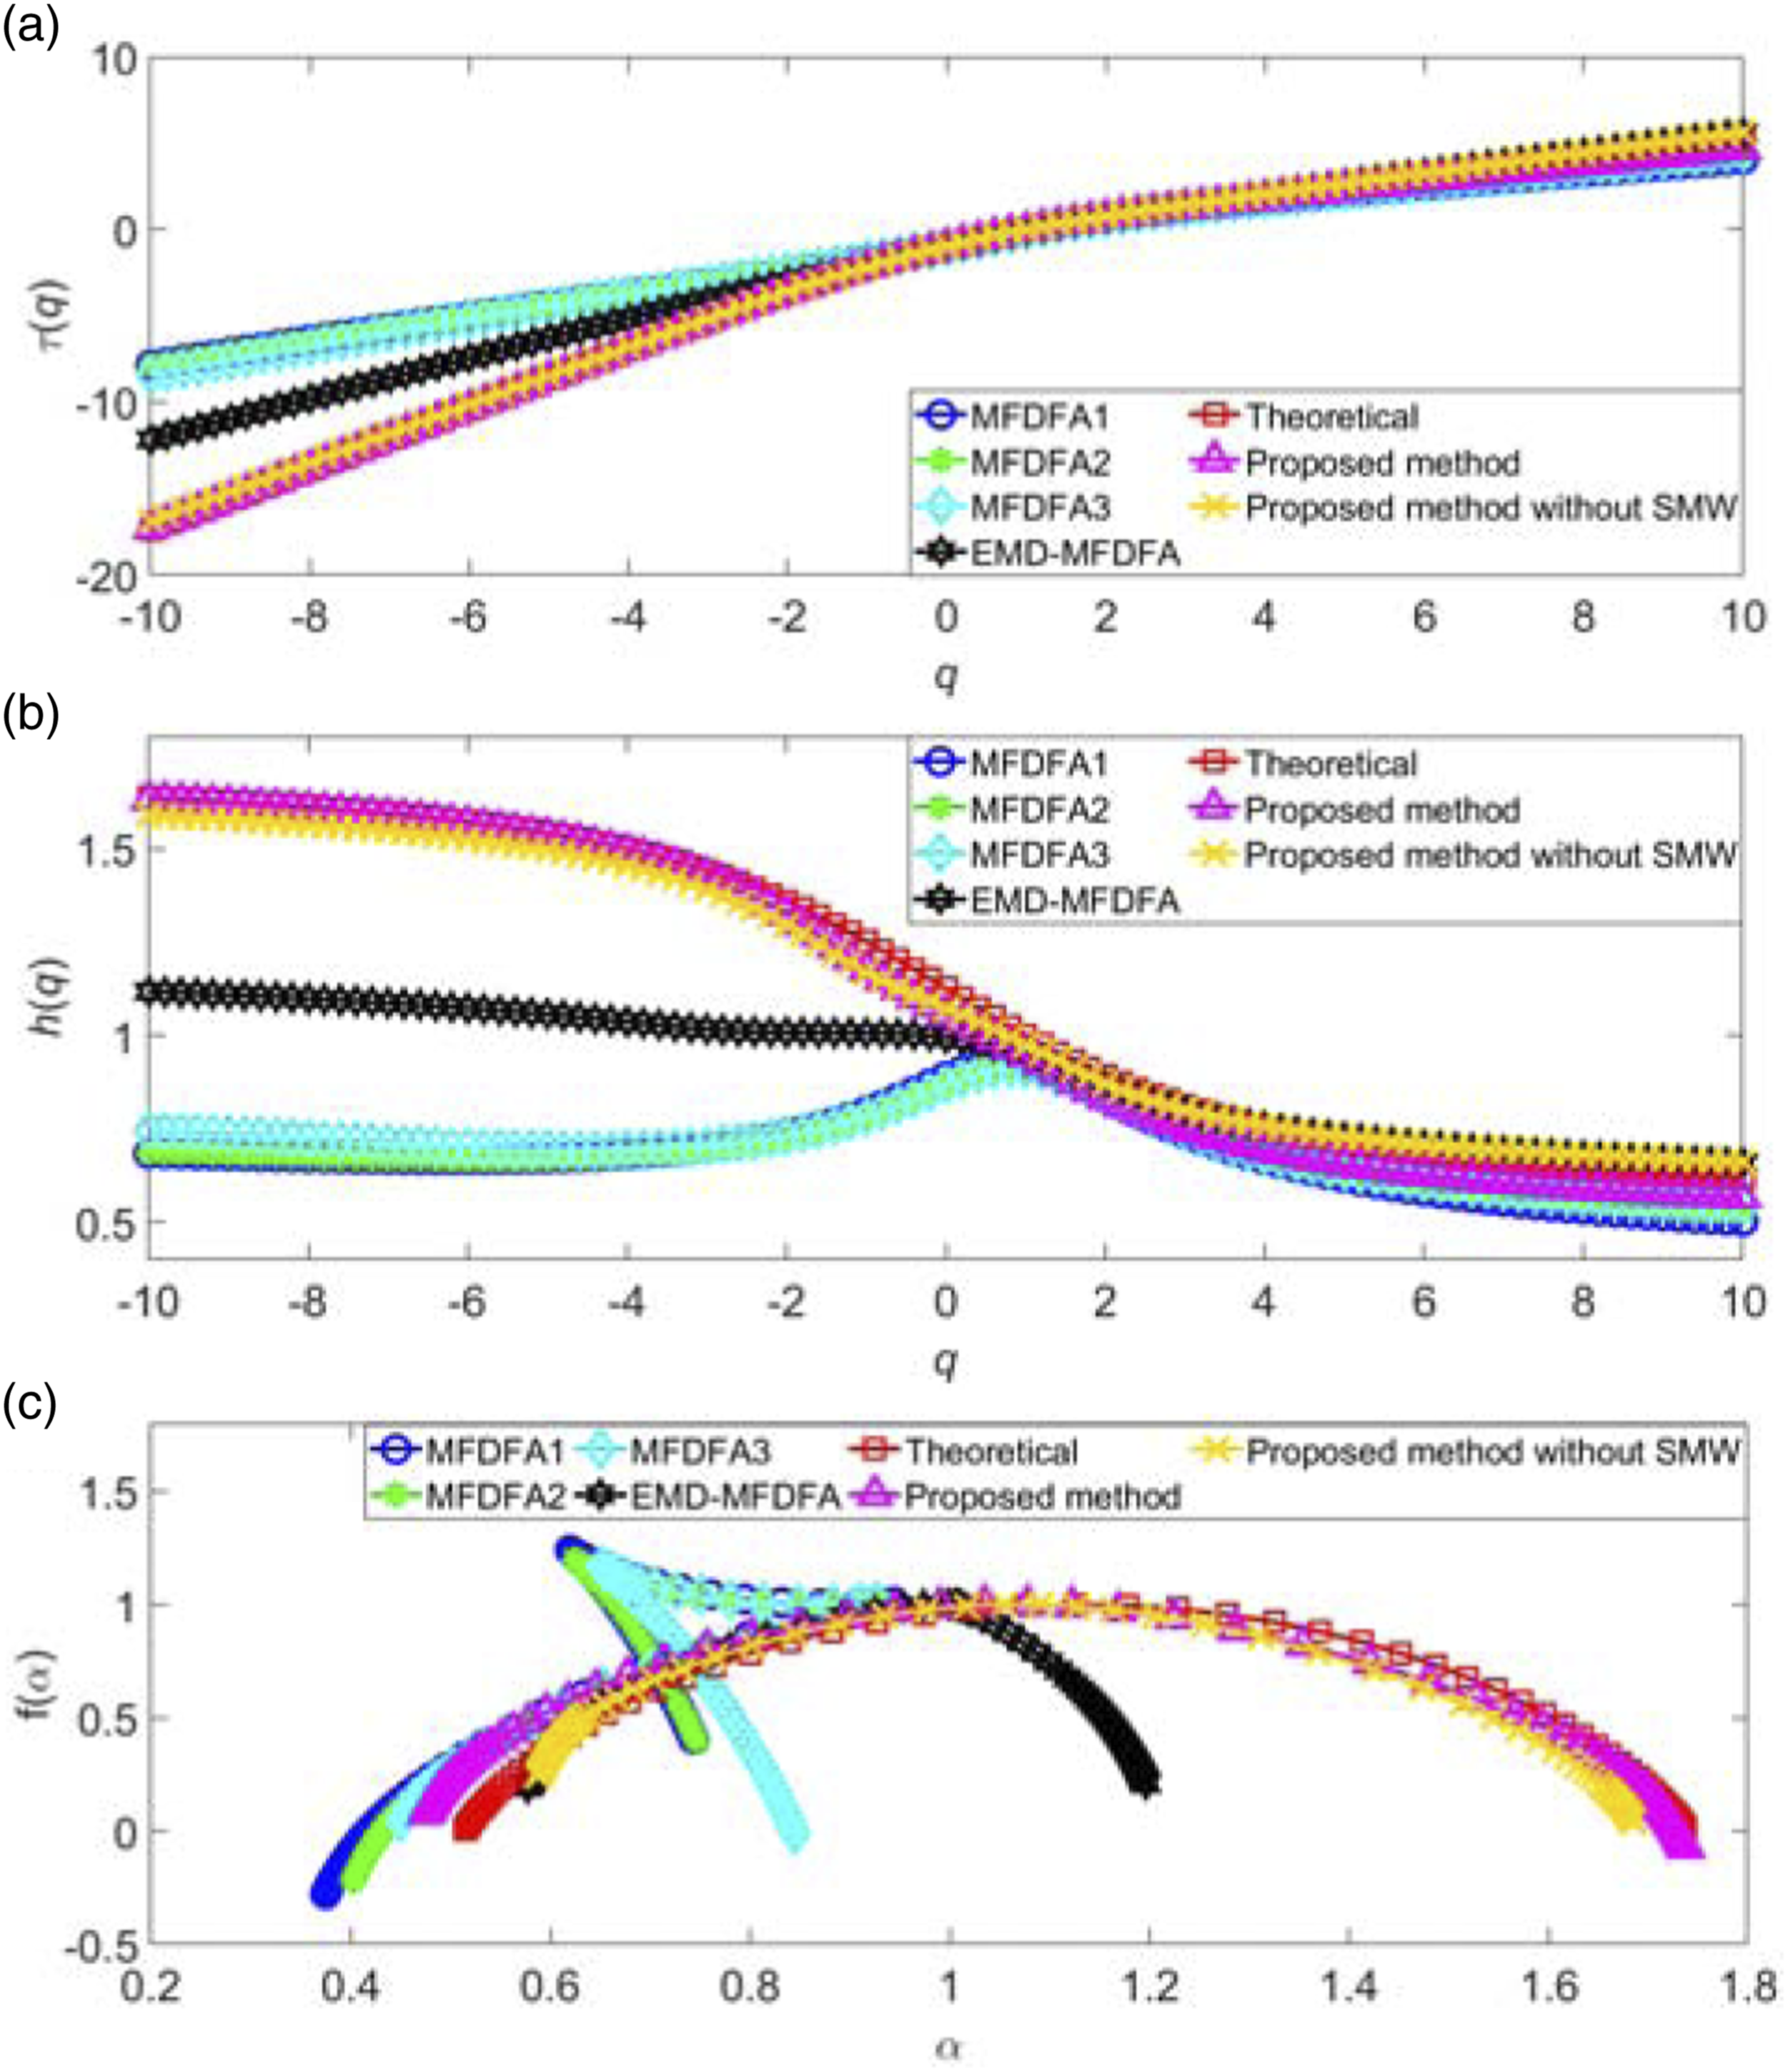
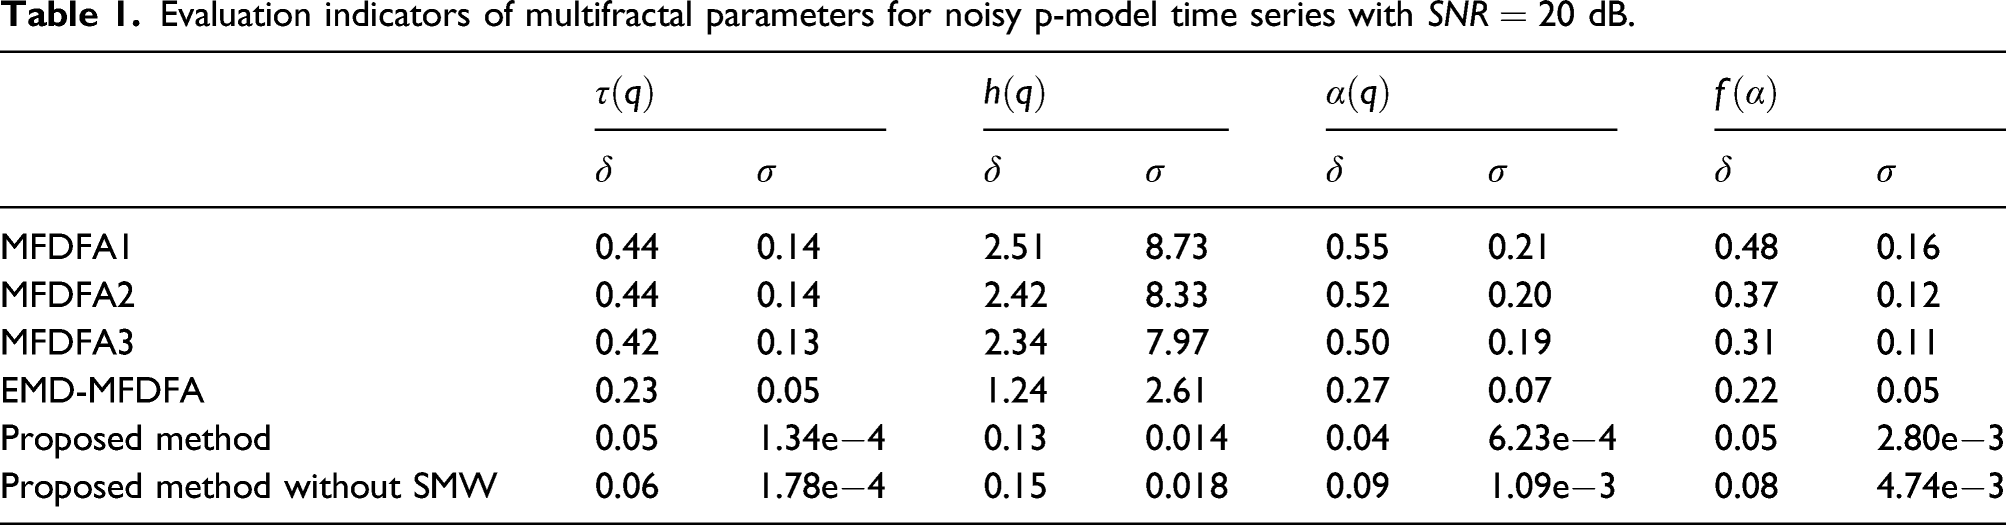
Additionally, the proposed method without SMW is also employed to estimate
To further verify the anti-noise performance of the proposed MEMD-MFDFA method, the multifractal scaling exponent Evaluation indicators of analysis results: (a) Average absolute error 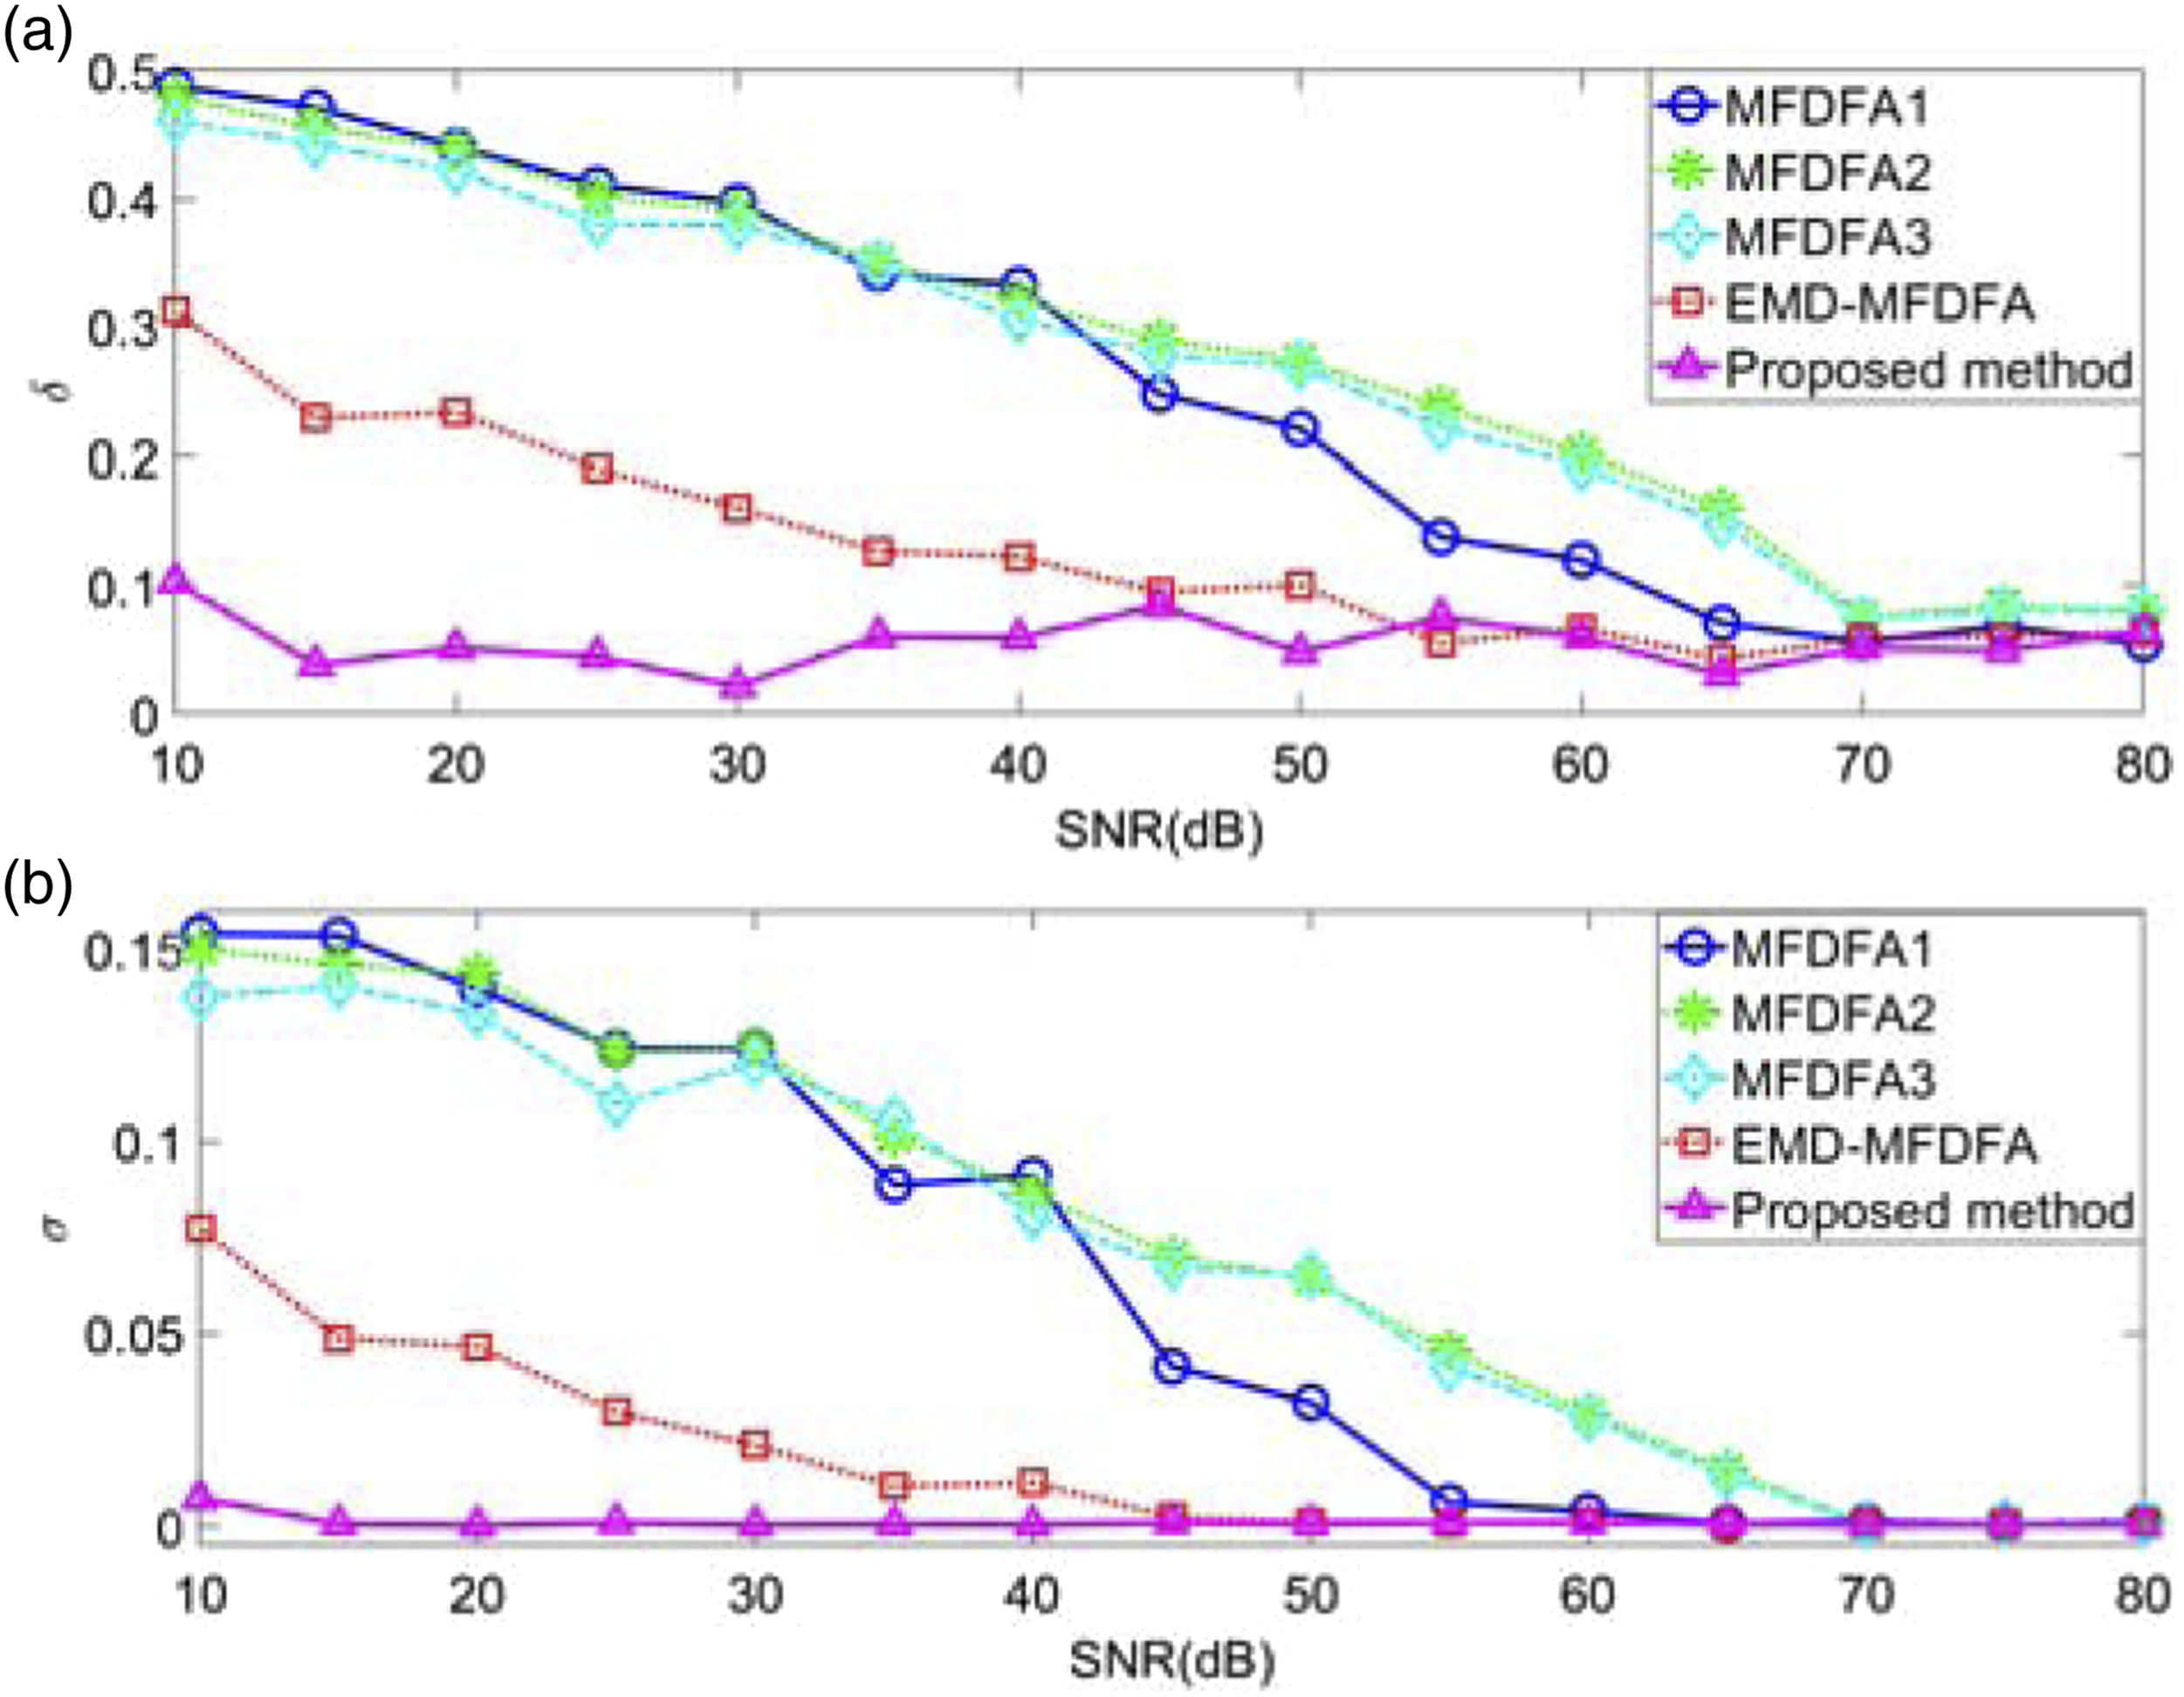
Furthermore, it can be seen from Figure 7 that with the decrease of SNR, both average absolute error and variance of EMD-MFDFA are increasing. In comparison with EMD-MFDFA, both the variation trends of average absolute error and variance of the proposed method are steady. In addition, the resultant
Application of proposed method in run-to-failure lifetime testing
Experimental set-up
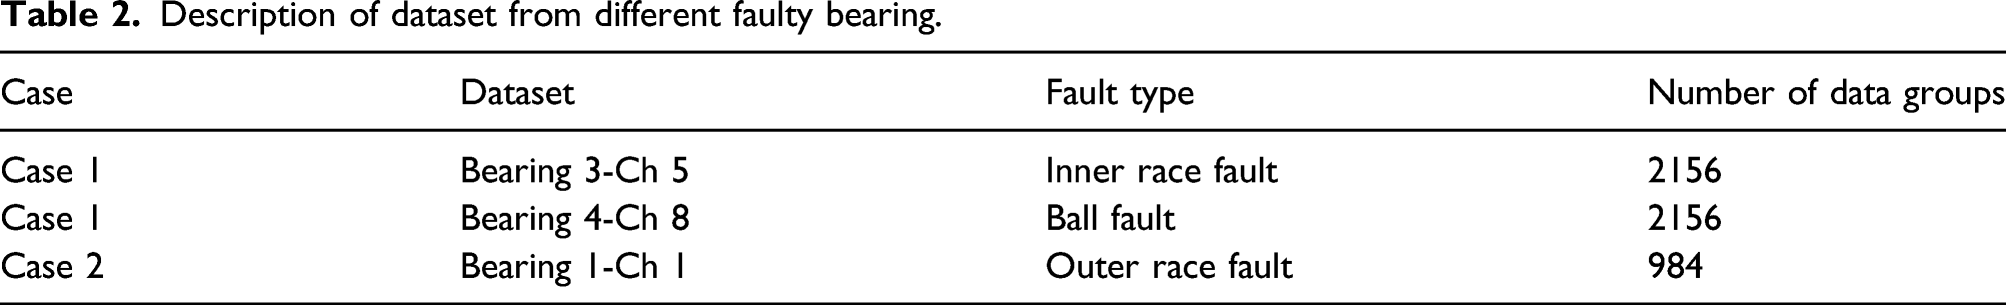
Three run-to-failure datasets for bearings containing outer ring fault, inner ring fault and ball fault, respectively, were provided by the Center for Intelligent Maintenance Systems (IMS) of Rexnord Corp.,
44
which are used to verify the effectiveness of multifractal characteristics extracted through the proposed method in reflecting the natural degradation of bearings under different health conditions. On the accelerated fatigue test bench shown in Figure 8, four Rexnord ZA-2115 double-row bearings, which were uniformly mounted on the same shaft with the constant rotation speed of 2000 rpm driven by an AC motor, were subjected to a 6000 lbs radial force generated by a spring mechanism. The vibration signals with data length of 20,480 points were collected every 10 min in terms of PCB 353B33 High Sensitivity Quartz ICP accelerometers with sampling frequency at 20 kHz. The detailed description of the dataset corresponding to the two cases studied in the presented work is shown in Table 2. Test bench of IMS. (a) Experimental system, (b) System diagram. Description of dataset from different faulty bearing.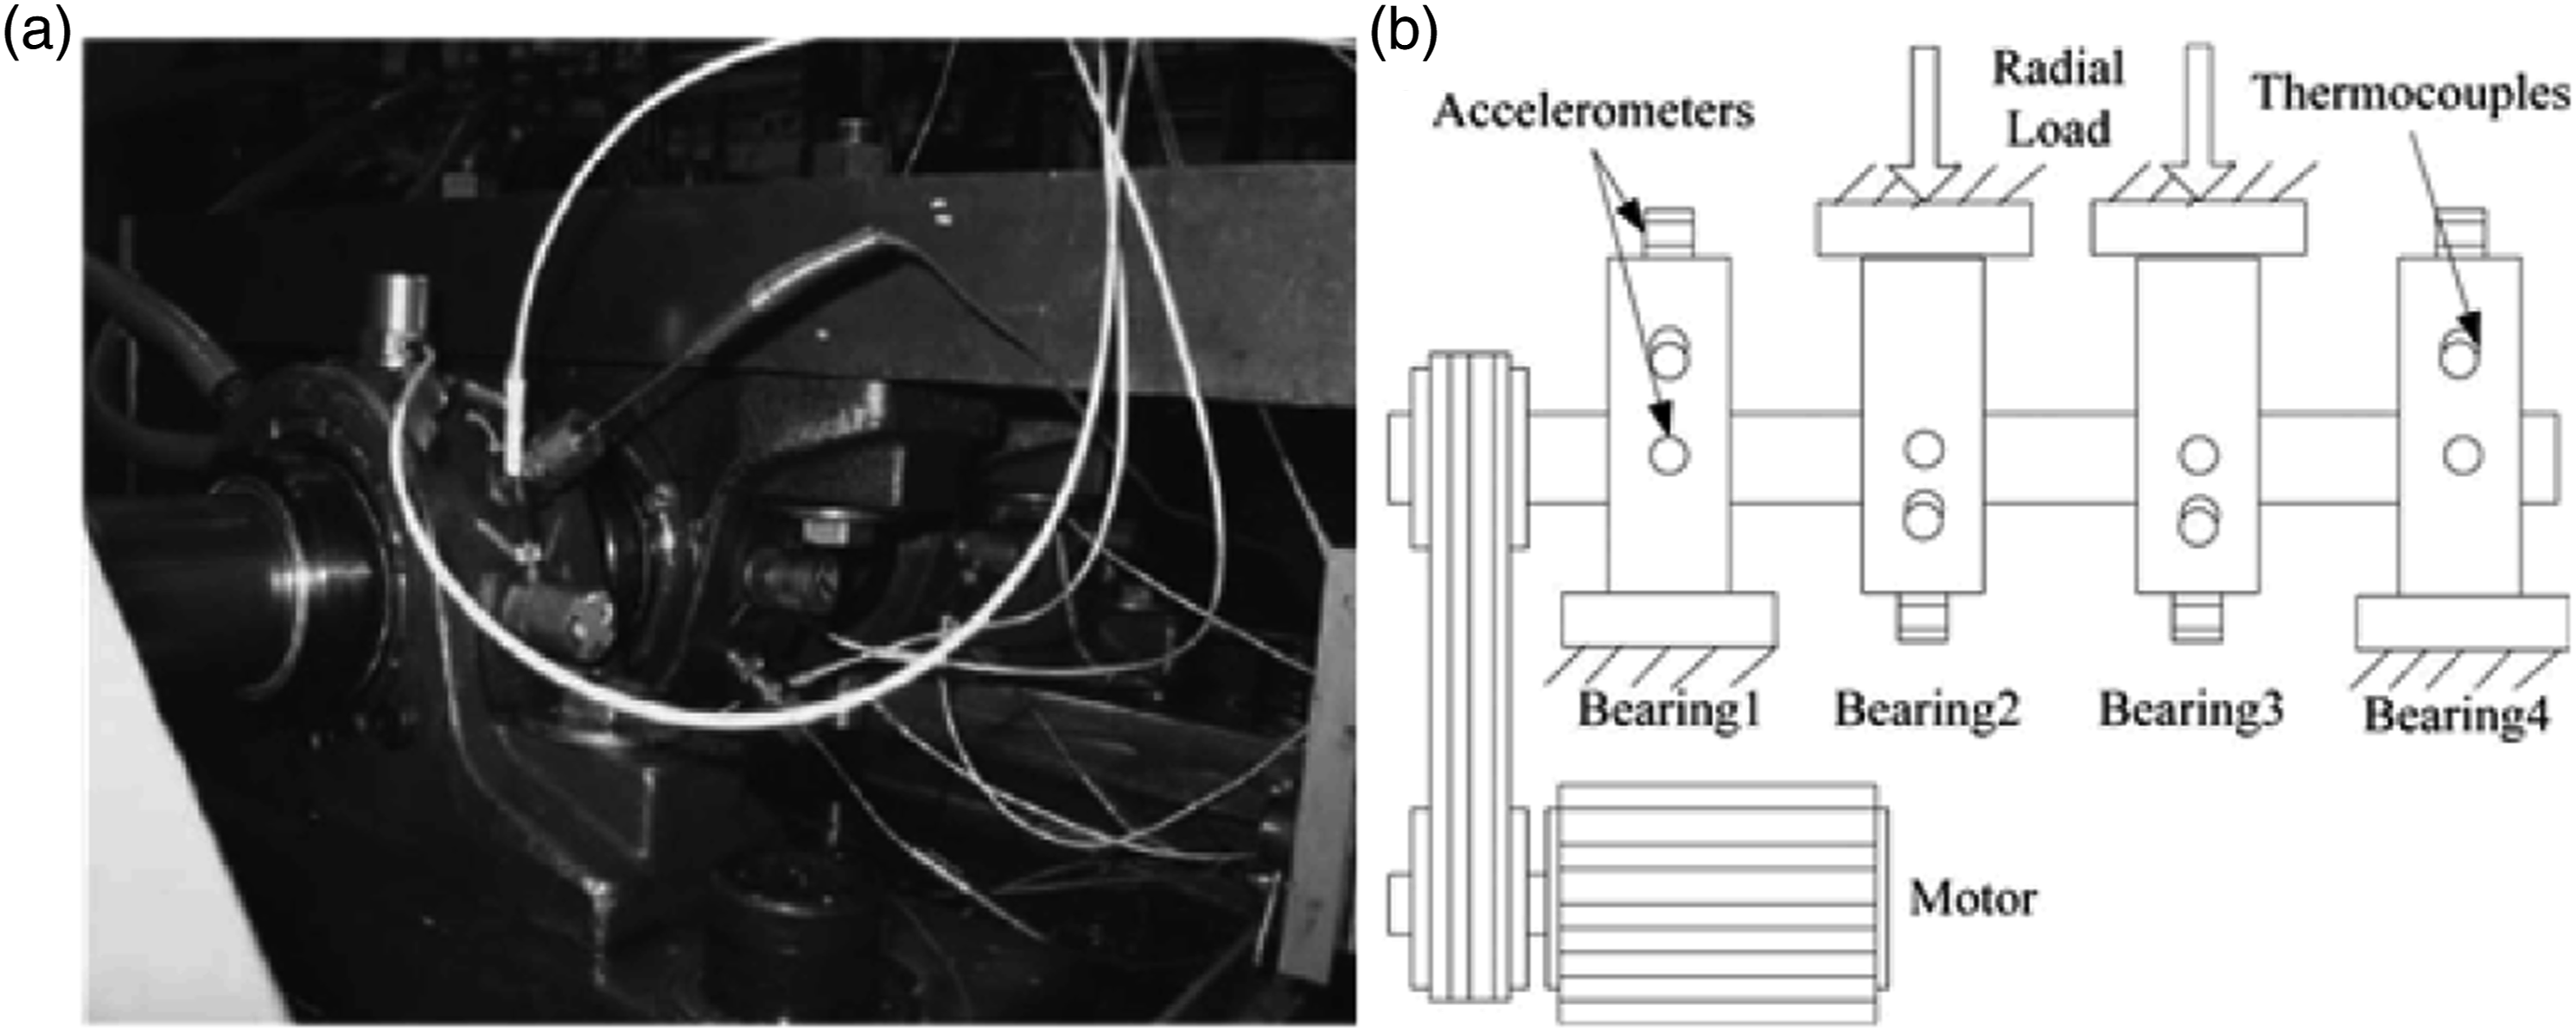
Experiment Results
The accelerated fatigue test of the bearing continued for nearly a week until an obvious failure occurred at the outer ring of Bearing 1-Ch 1, of which the vibration signal is displayed in Figure 9. Based on the previous work,
9
Growth Rate of Real-time Mahalanobis Distance with Cumulative Sum (GRRMD-CUMSUM) was proved to be able to effectively distinguish the different health states during the entire operation by calculating the rate of performance degradation of the bearing based on the features of envelope spectrum. Consequently, this indicator is used to reflect the degradation process throughout the life cycle of Bearing 1-Ch 1. Vibration signal of Bearing 1-Ch 1 in time domain.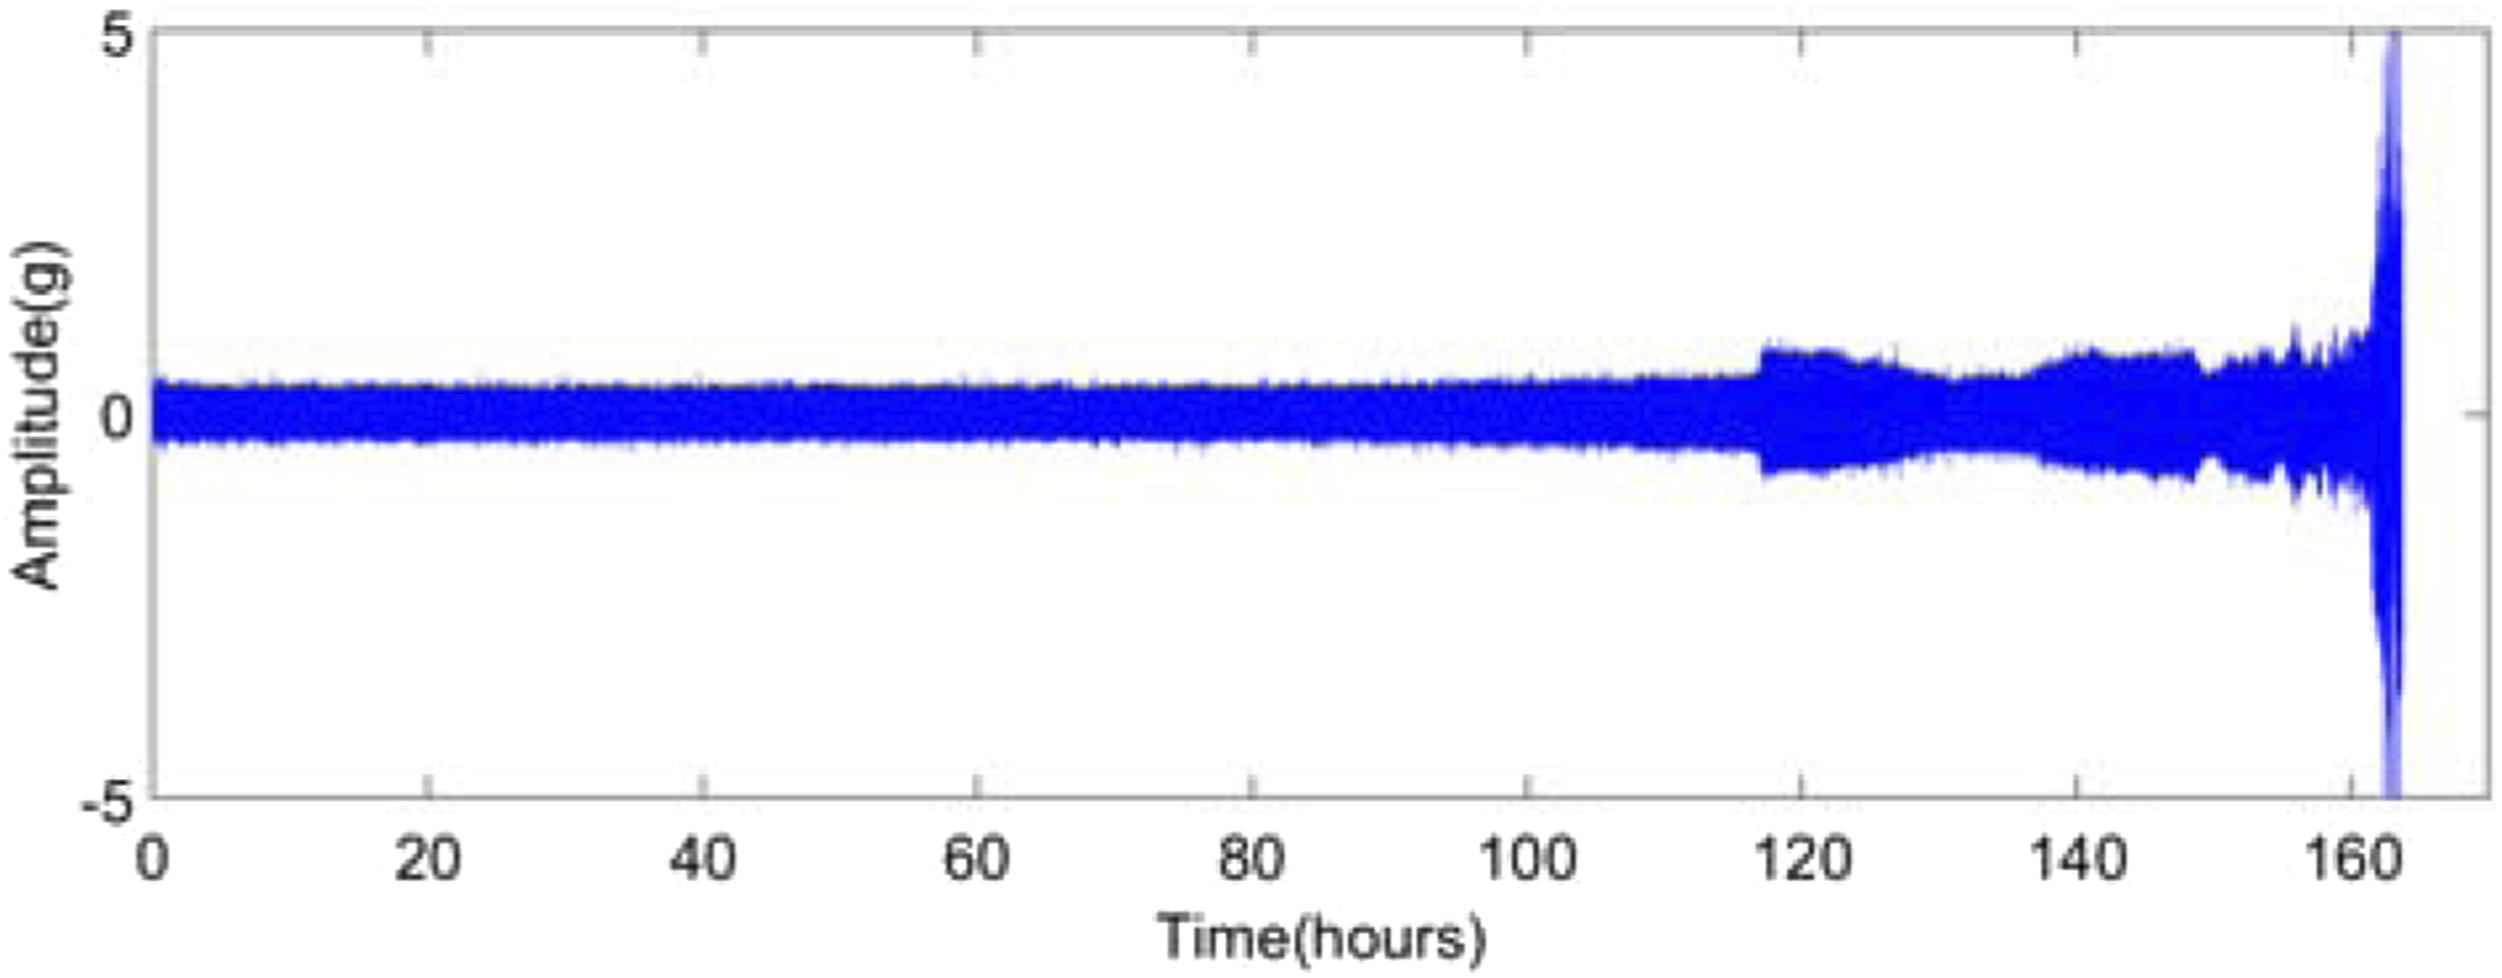
As depicted in Figure 10, four phases including normal phase, incipient fault phase, severe fault phase, and failure phase are highlighted for Bearing 1-Ch 1 according to the change trend of GRRMD-CUMSUM. Twenty data groups are then randomly selected from each of identified degradation stages to carry out multifractal analysis. Subsequently, these bearing vibration signals are analyzed in the light of the proposed method. As a result, the calculated multifractal spectrums are displayed in Figure 11(a). It can be seen from Figure 11(a) that for negative q, the multifractal spectrum corresponding to the failure stage is distinguished from the rest but that corresponding to the other three stages cannot well distinguish different health conditions during the performance degradation process of the bearing, which indicates that it is not significant to extract the features from the multifractal spectrum at negative q for the condition monitoring. The multifractal spectrums in the range of GRRMD-CUMSUM of test data. (a) Complete multifractal spectrums, (b) Partial multifractal spectrums at positive q of different performance degradation stages based on proposed method.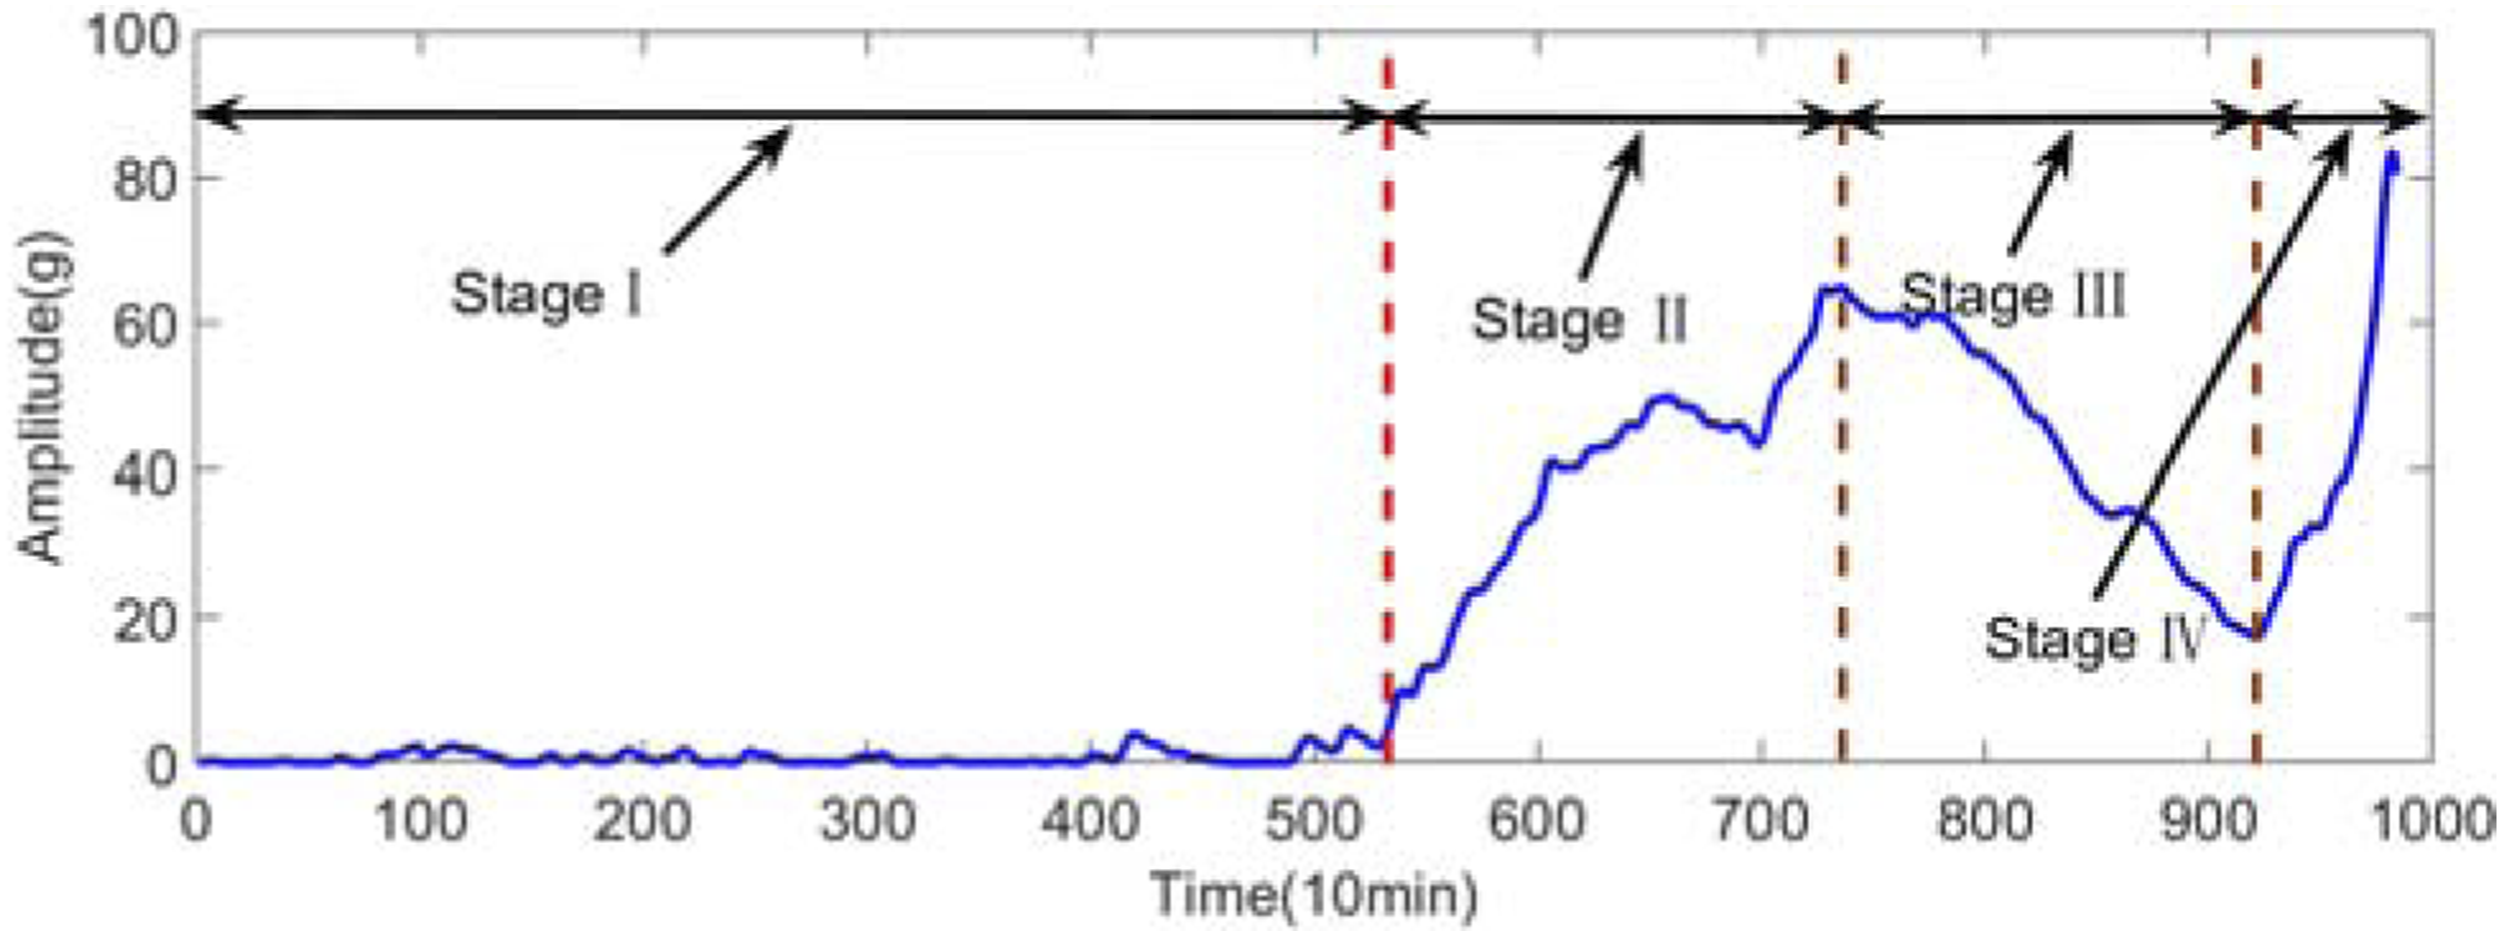
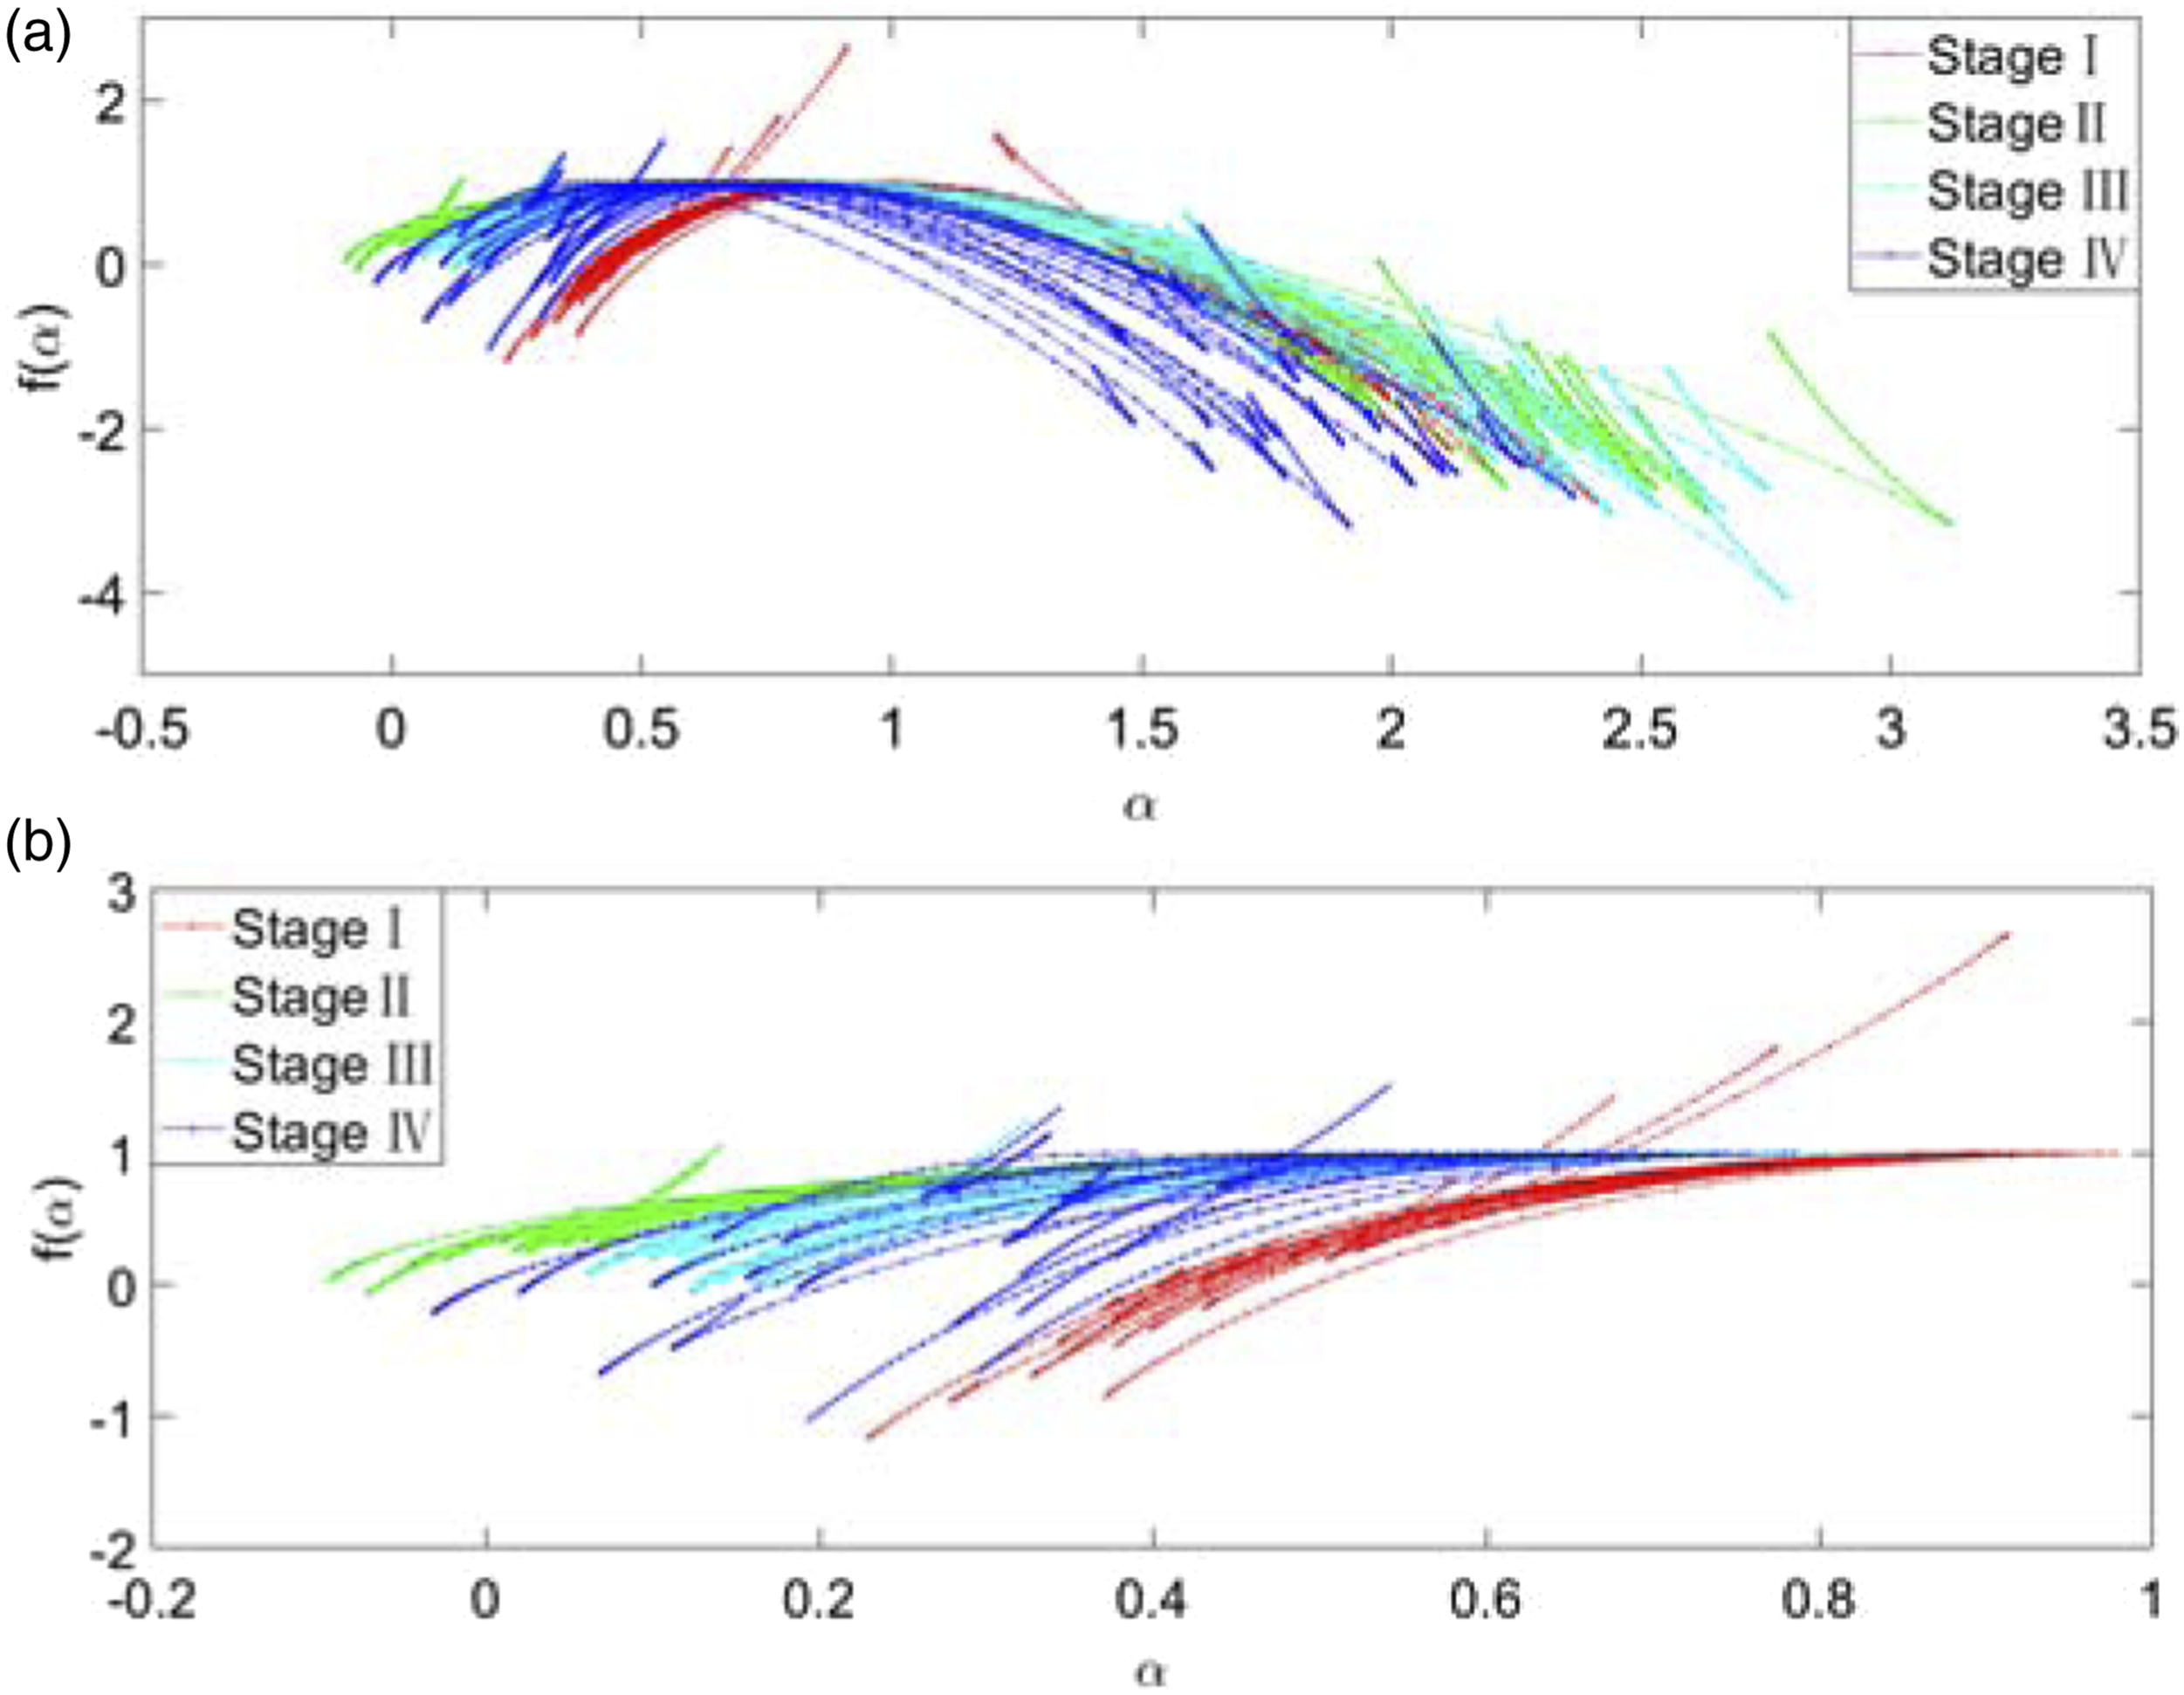
Partial multifractal spectrums at positive q of different performance degradation stages based on the proposed method are shown in Figure 11(b). Normal, incipient fault and severe fault conditions can be effectively identified in accordance with the location differences of the partial multifractal spectrums as depicted in Figure 11(b). Different from the multifractal features extracted from bearing vibration signals in the first three stages, it can also be observed in Figure 11(b) that the multifractal spectrums corresponding to the failure stage have serious dispersion, and even overlap significantly with those of severe fault stage. The irregular contact between the fragmented outer ring raceway surface and other components in the failure stage results in the instability of multifractal features. Therefore, the horizontal and vertical coordinates of each point on the partial multifractal spectrum at positive q, namely, the singularity exponent
Extraction results of multifractal features: (a) Change trend of singularity exponent 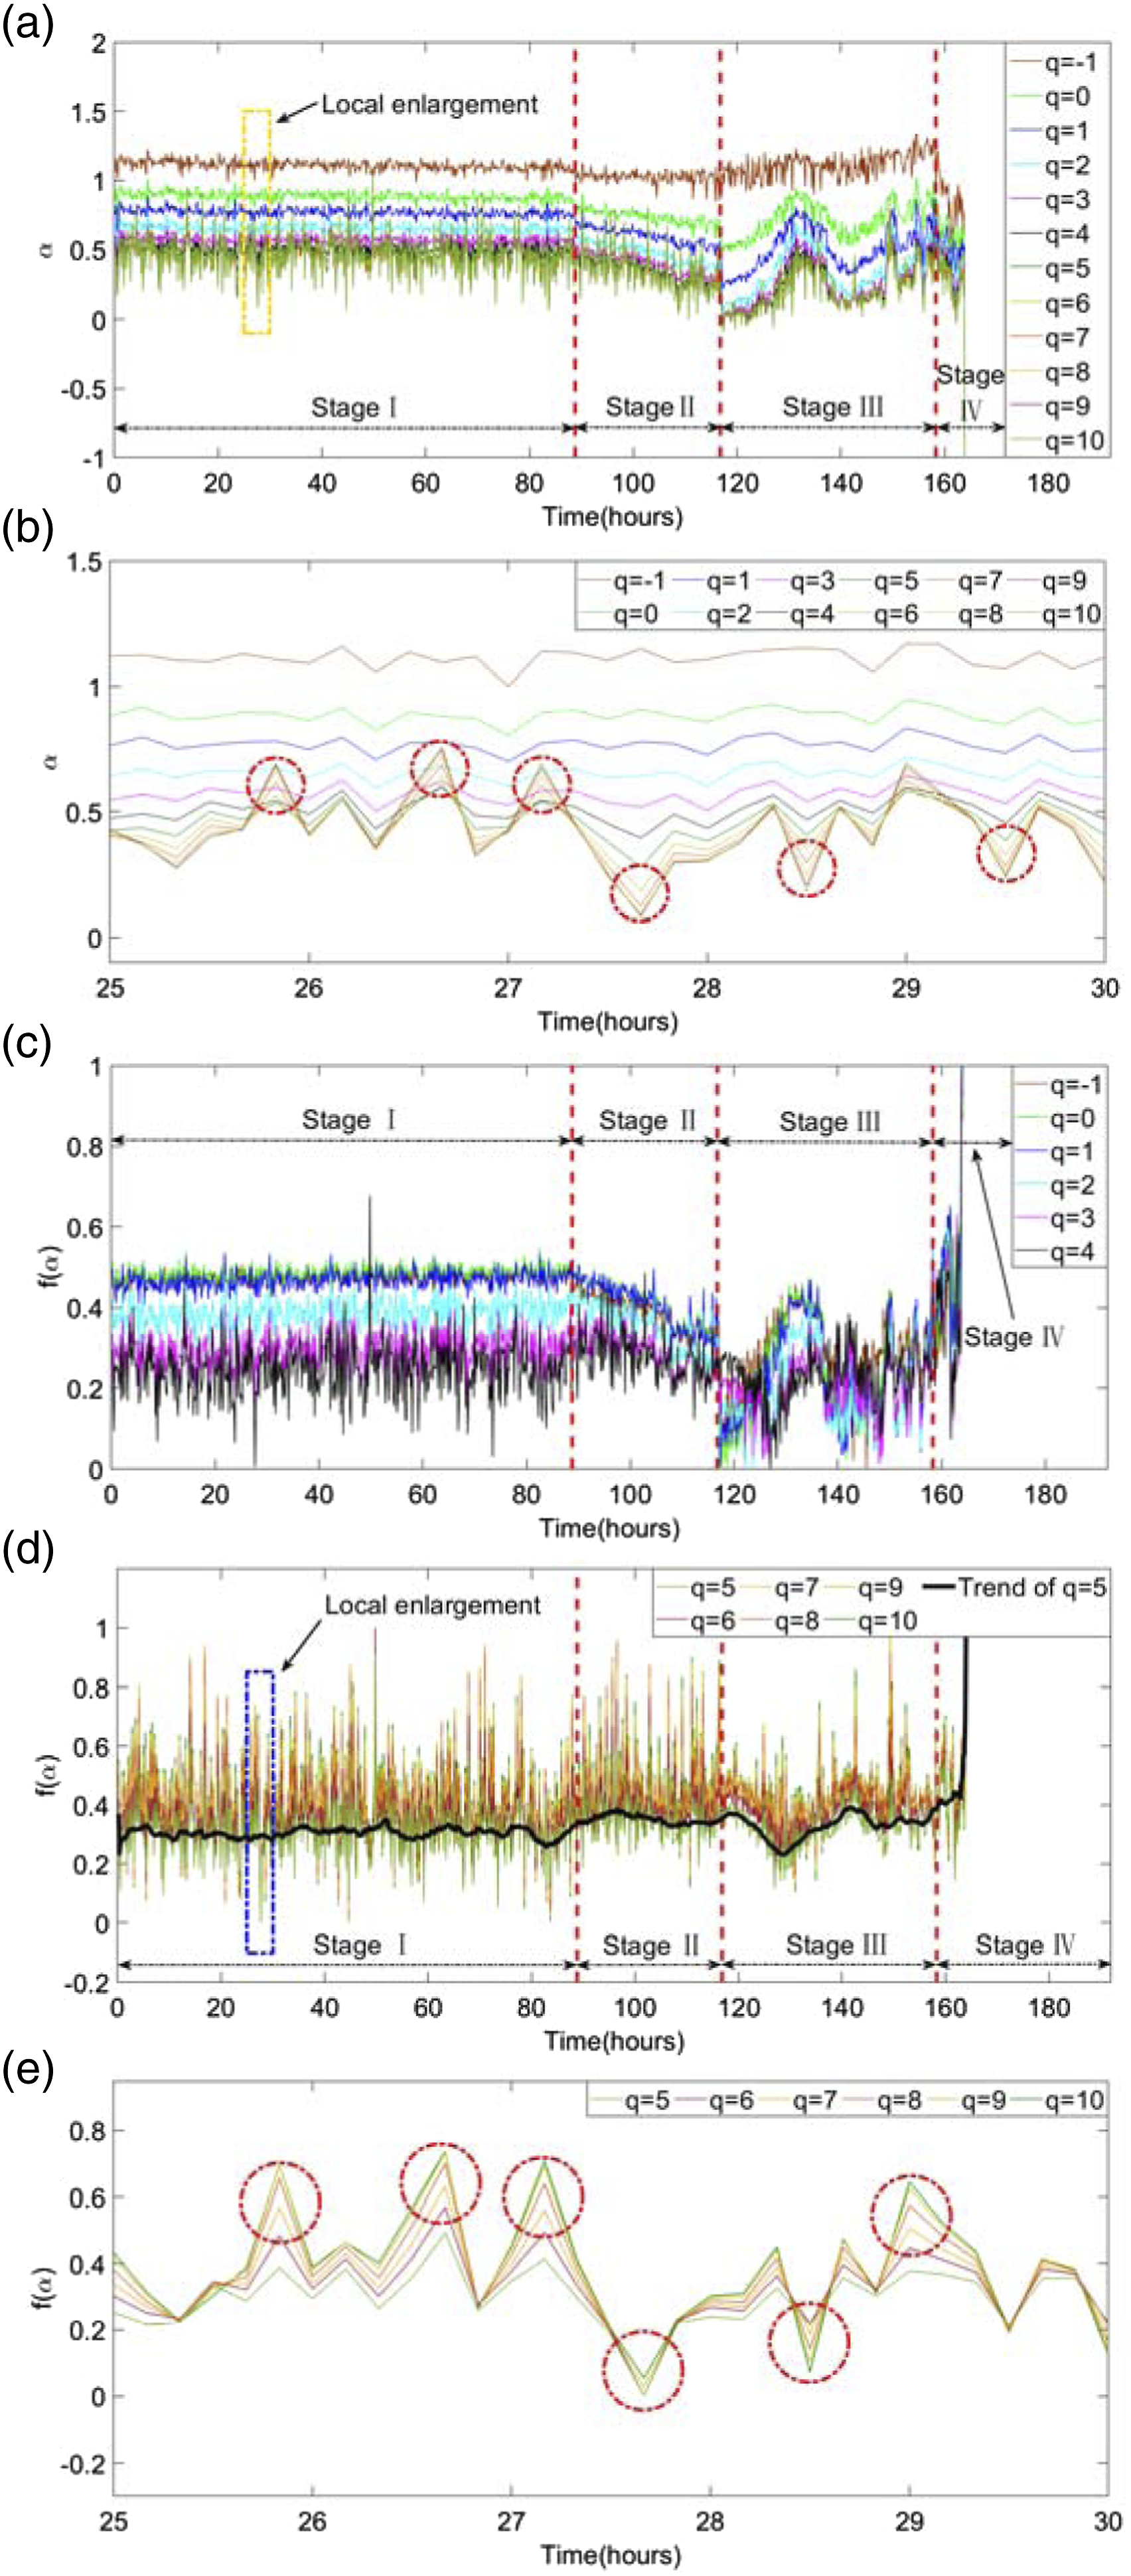
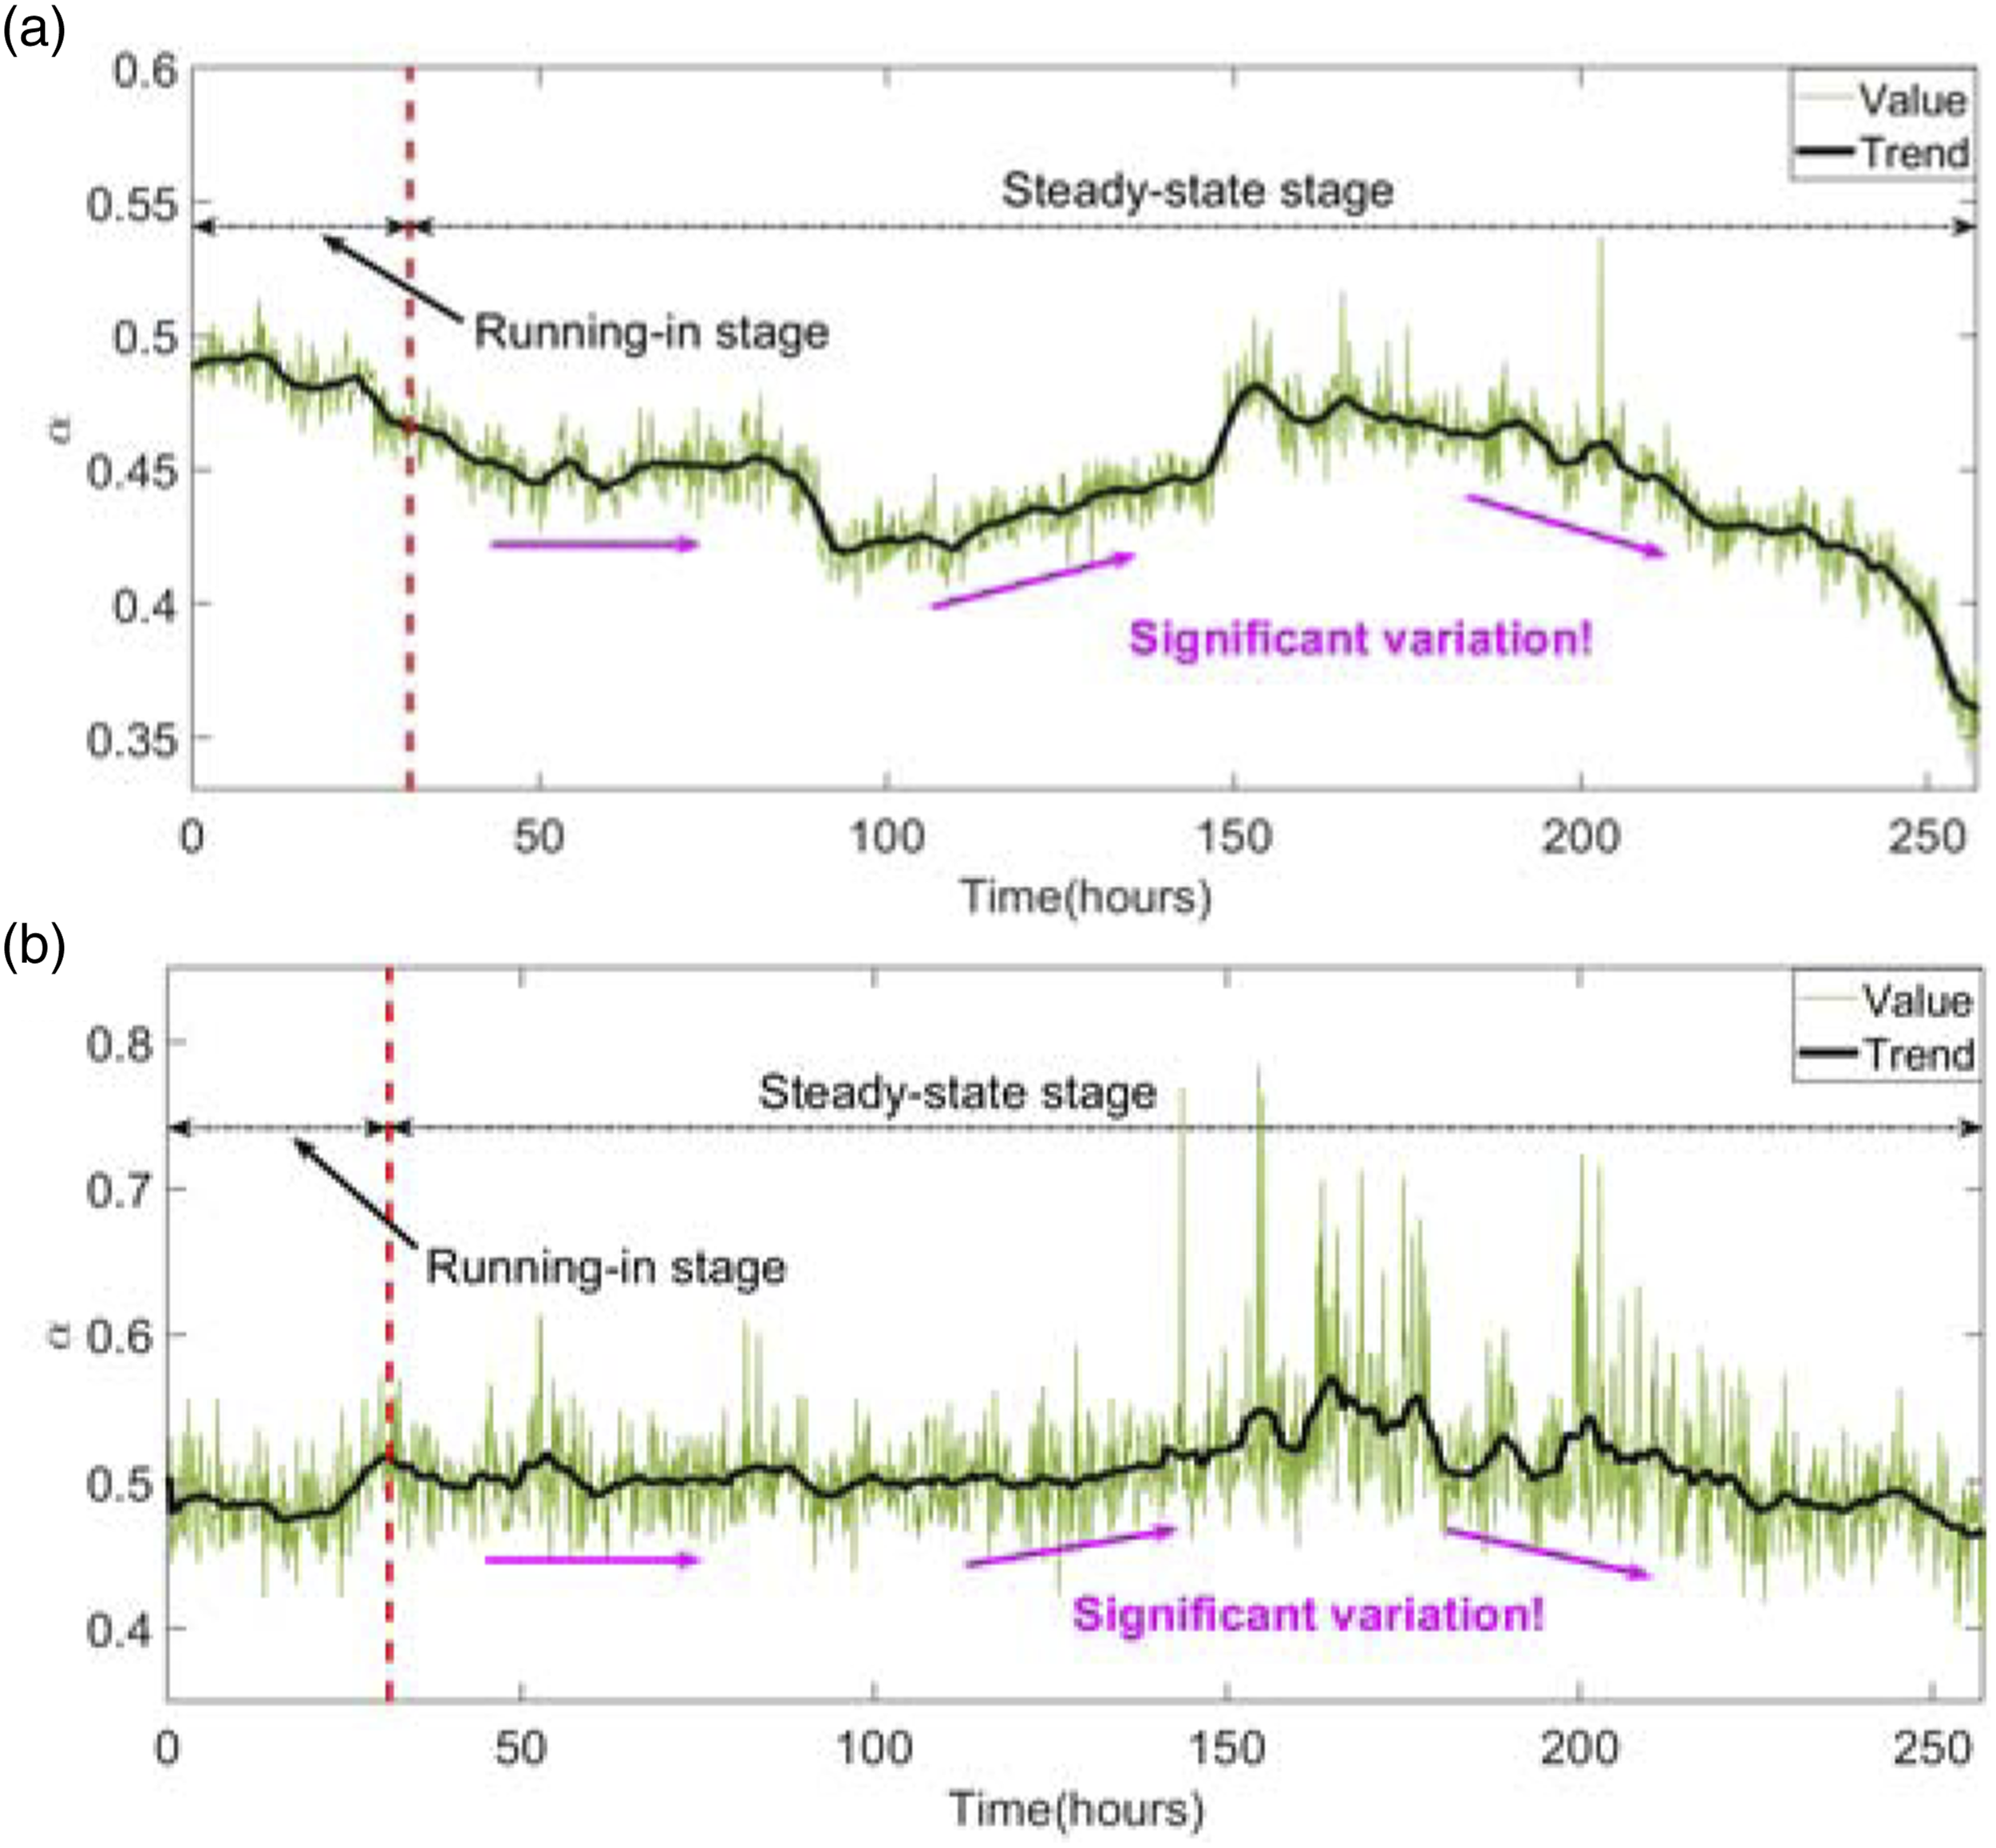
It can be seen from the change trend of
For stage I, the changes of
For stage II, when a small defect is generated, the trend of
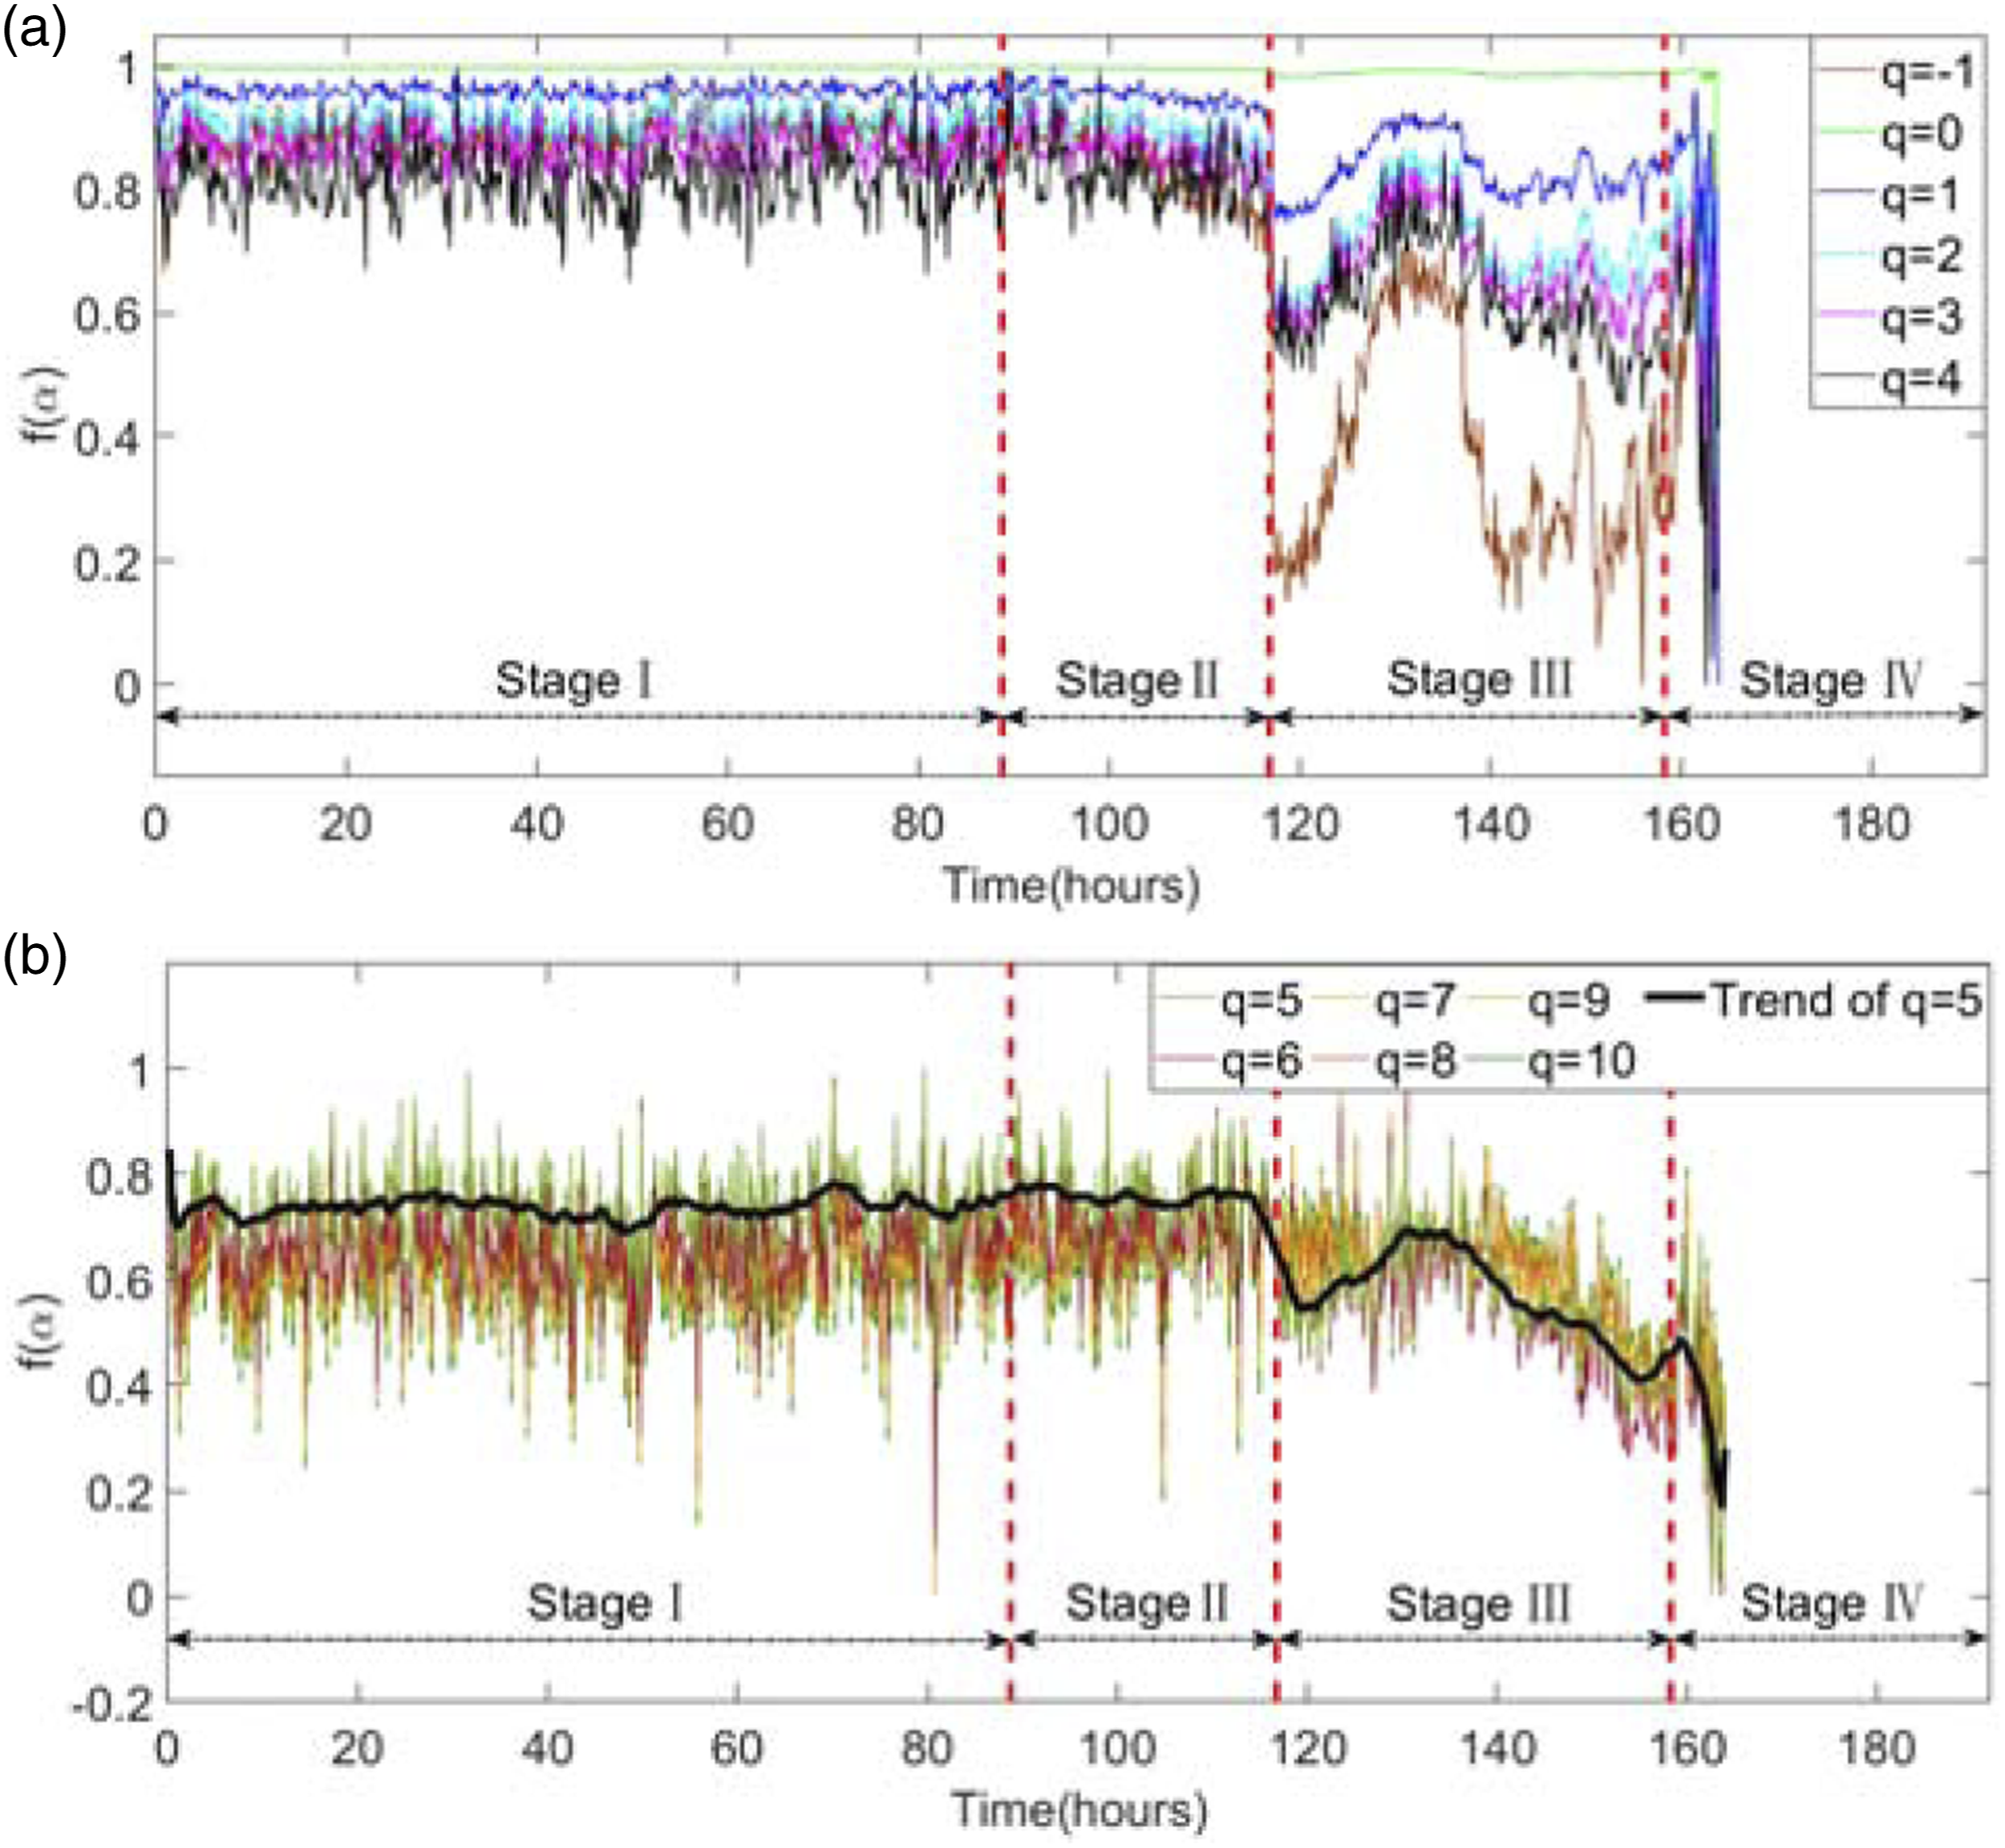
For stage III, the trailing edge of a small defect would become smoother under the mutual effects of abrasive wear, spalling, and over-rolling behavior,
45
which may be cause the healing phenomenon in the performance degradation of bearings. The amplitude of
For stage IV, the bearing continues to operate at a rapidly increasing rate of performance degradation in the failure stage. Although the trend of
Additionally, some results are provided as follows on the basis of Figures 12(a) and (b). 1) When q starts to increase from 1, the trend of 2) When q increases to 4, the larger q is not much assistance to improve the classification results of the bearing performance degradation stage. 3) There are several local fluctuations highlighted by red circles in the same position of the trends of 4) Relative to the singularity exponents
According to equation (20), when q is equal to 0, the multifractal spectrum
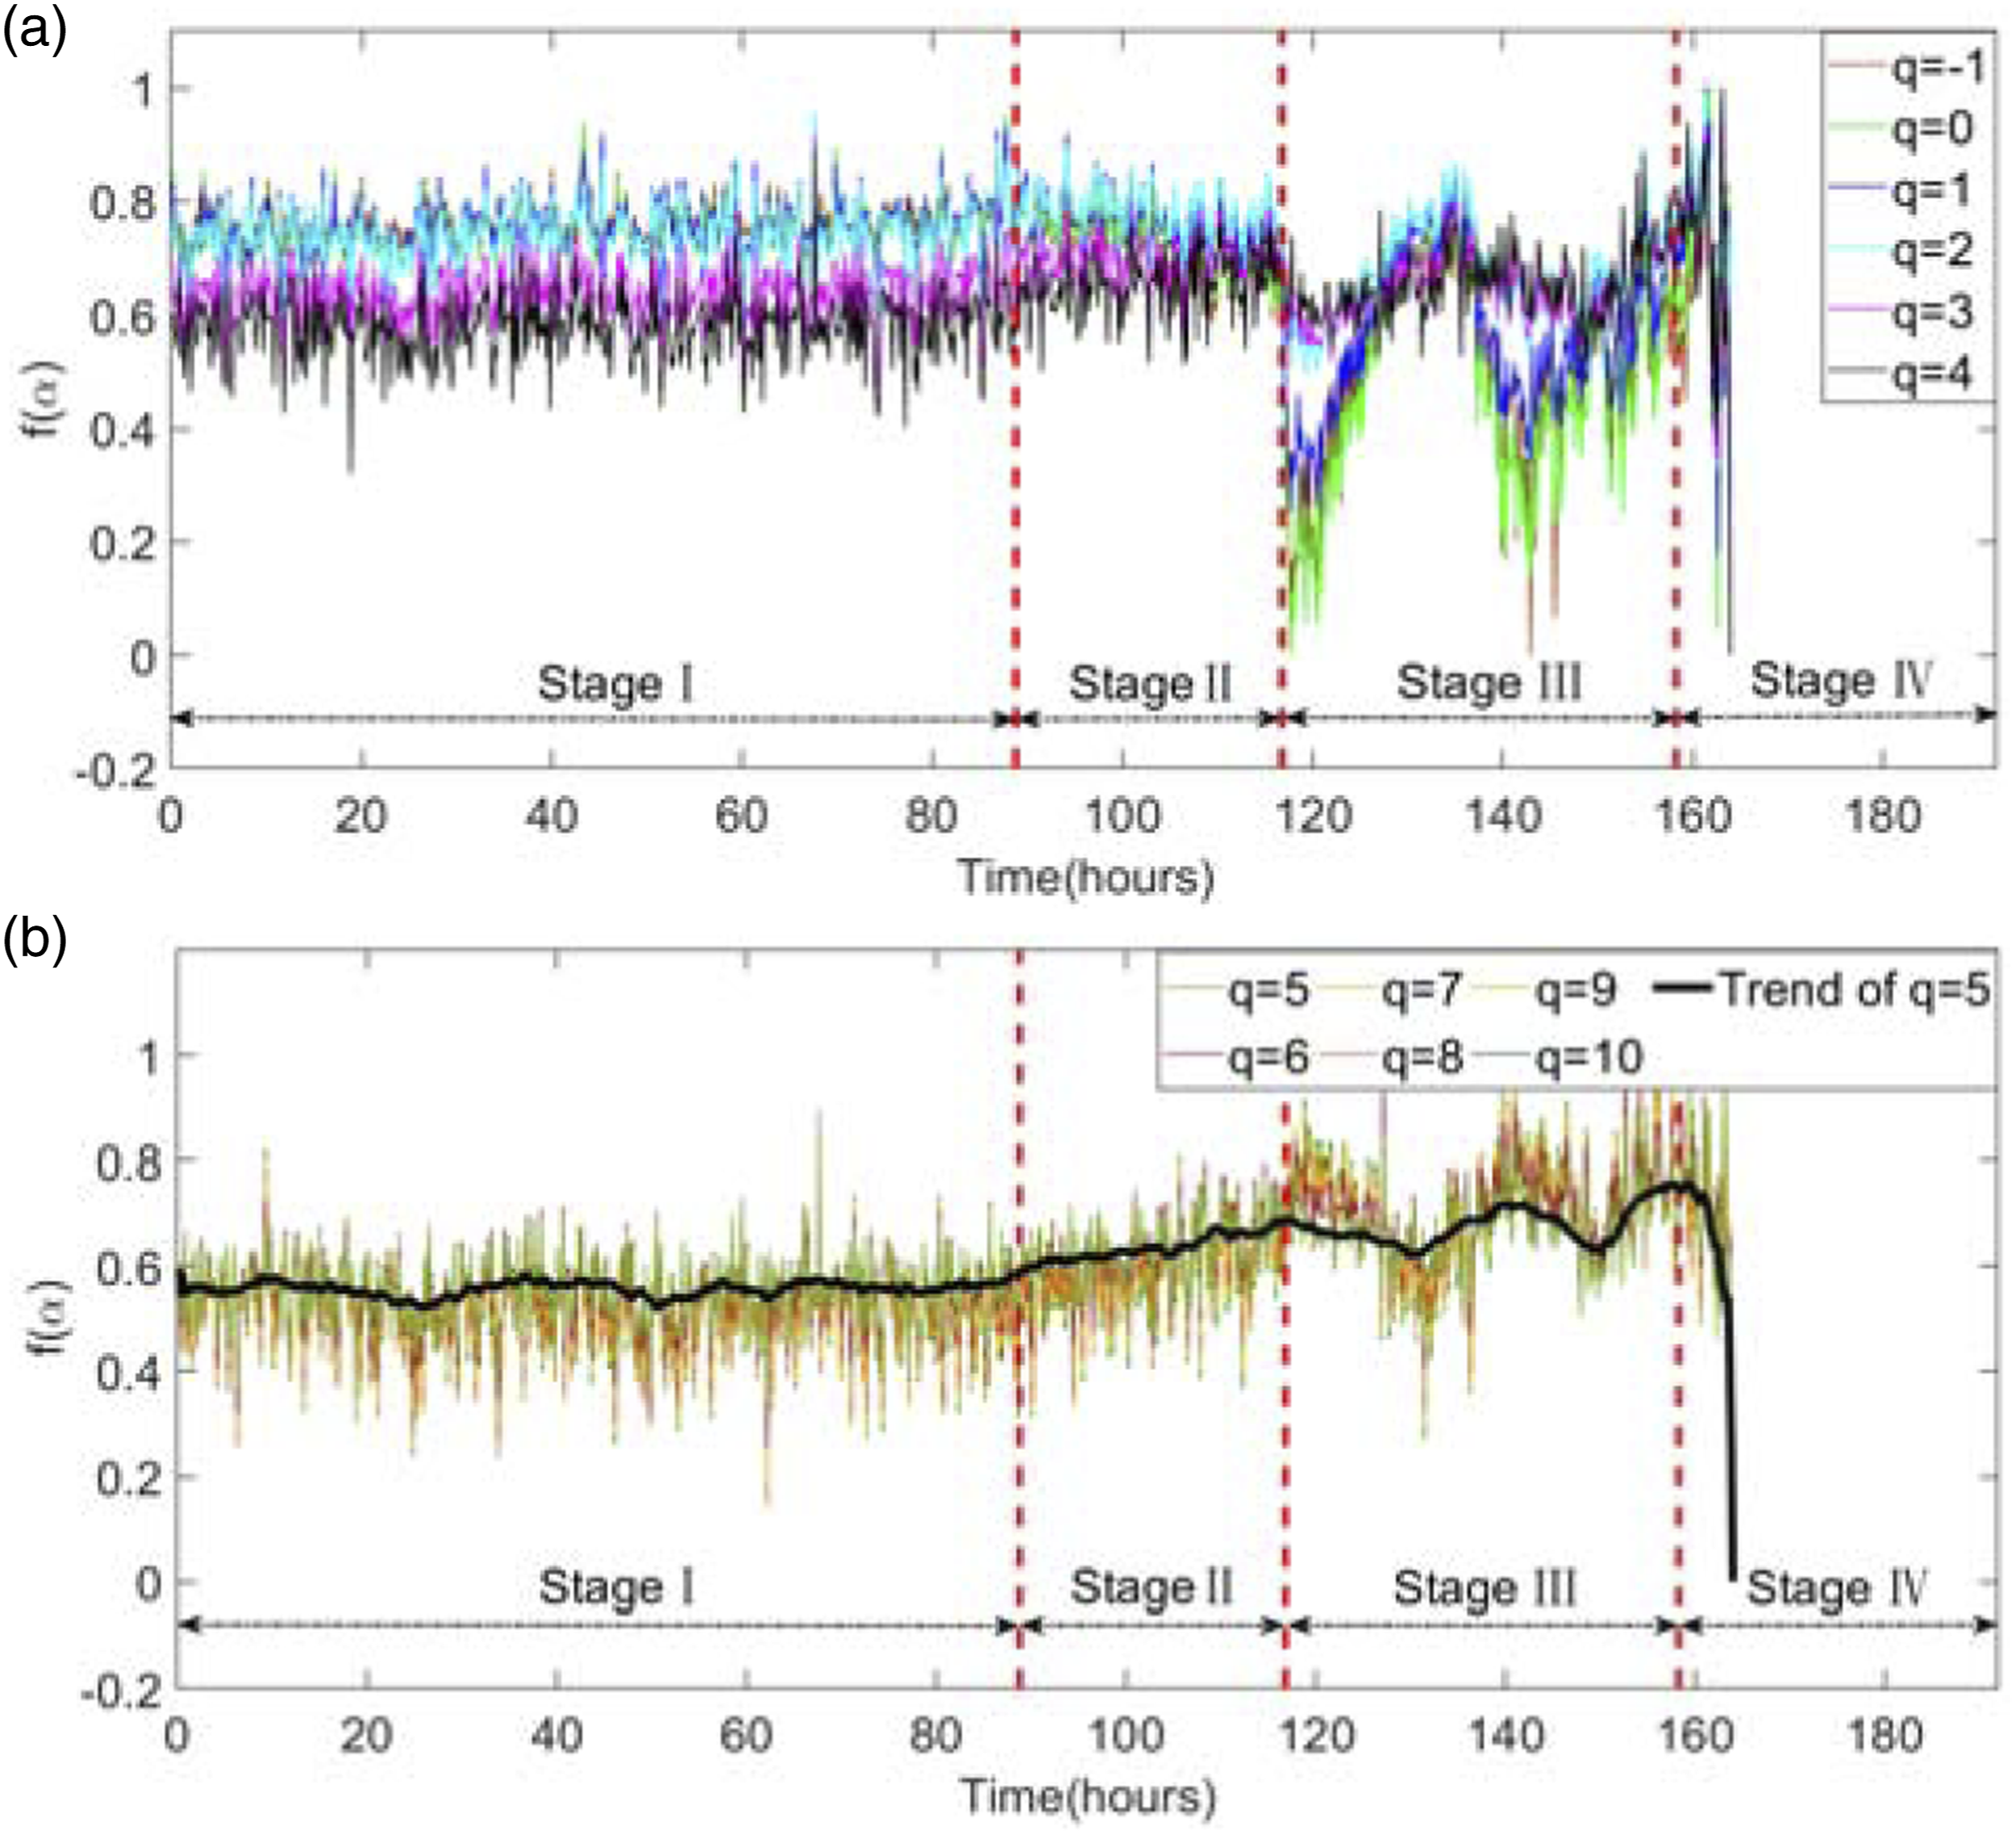
As shown in Figure 12(c), when q is in [−1, 2], the trends of multifractal spectrum
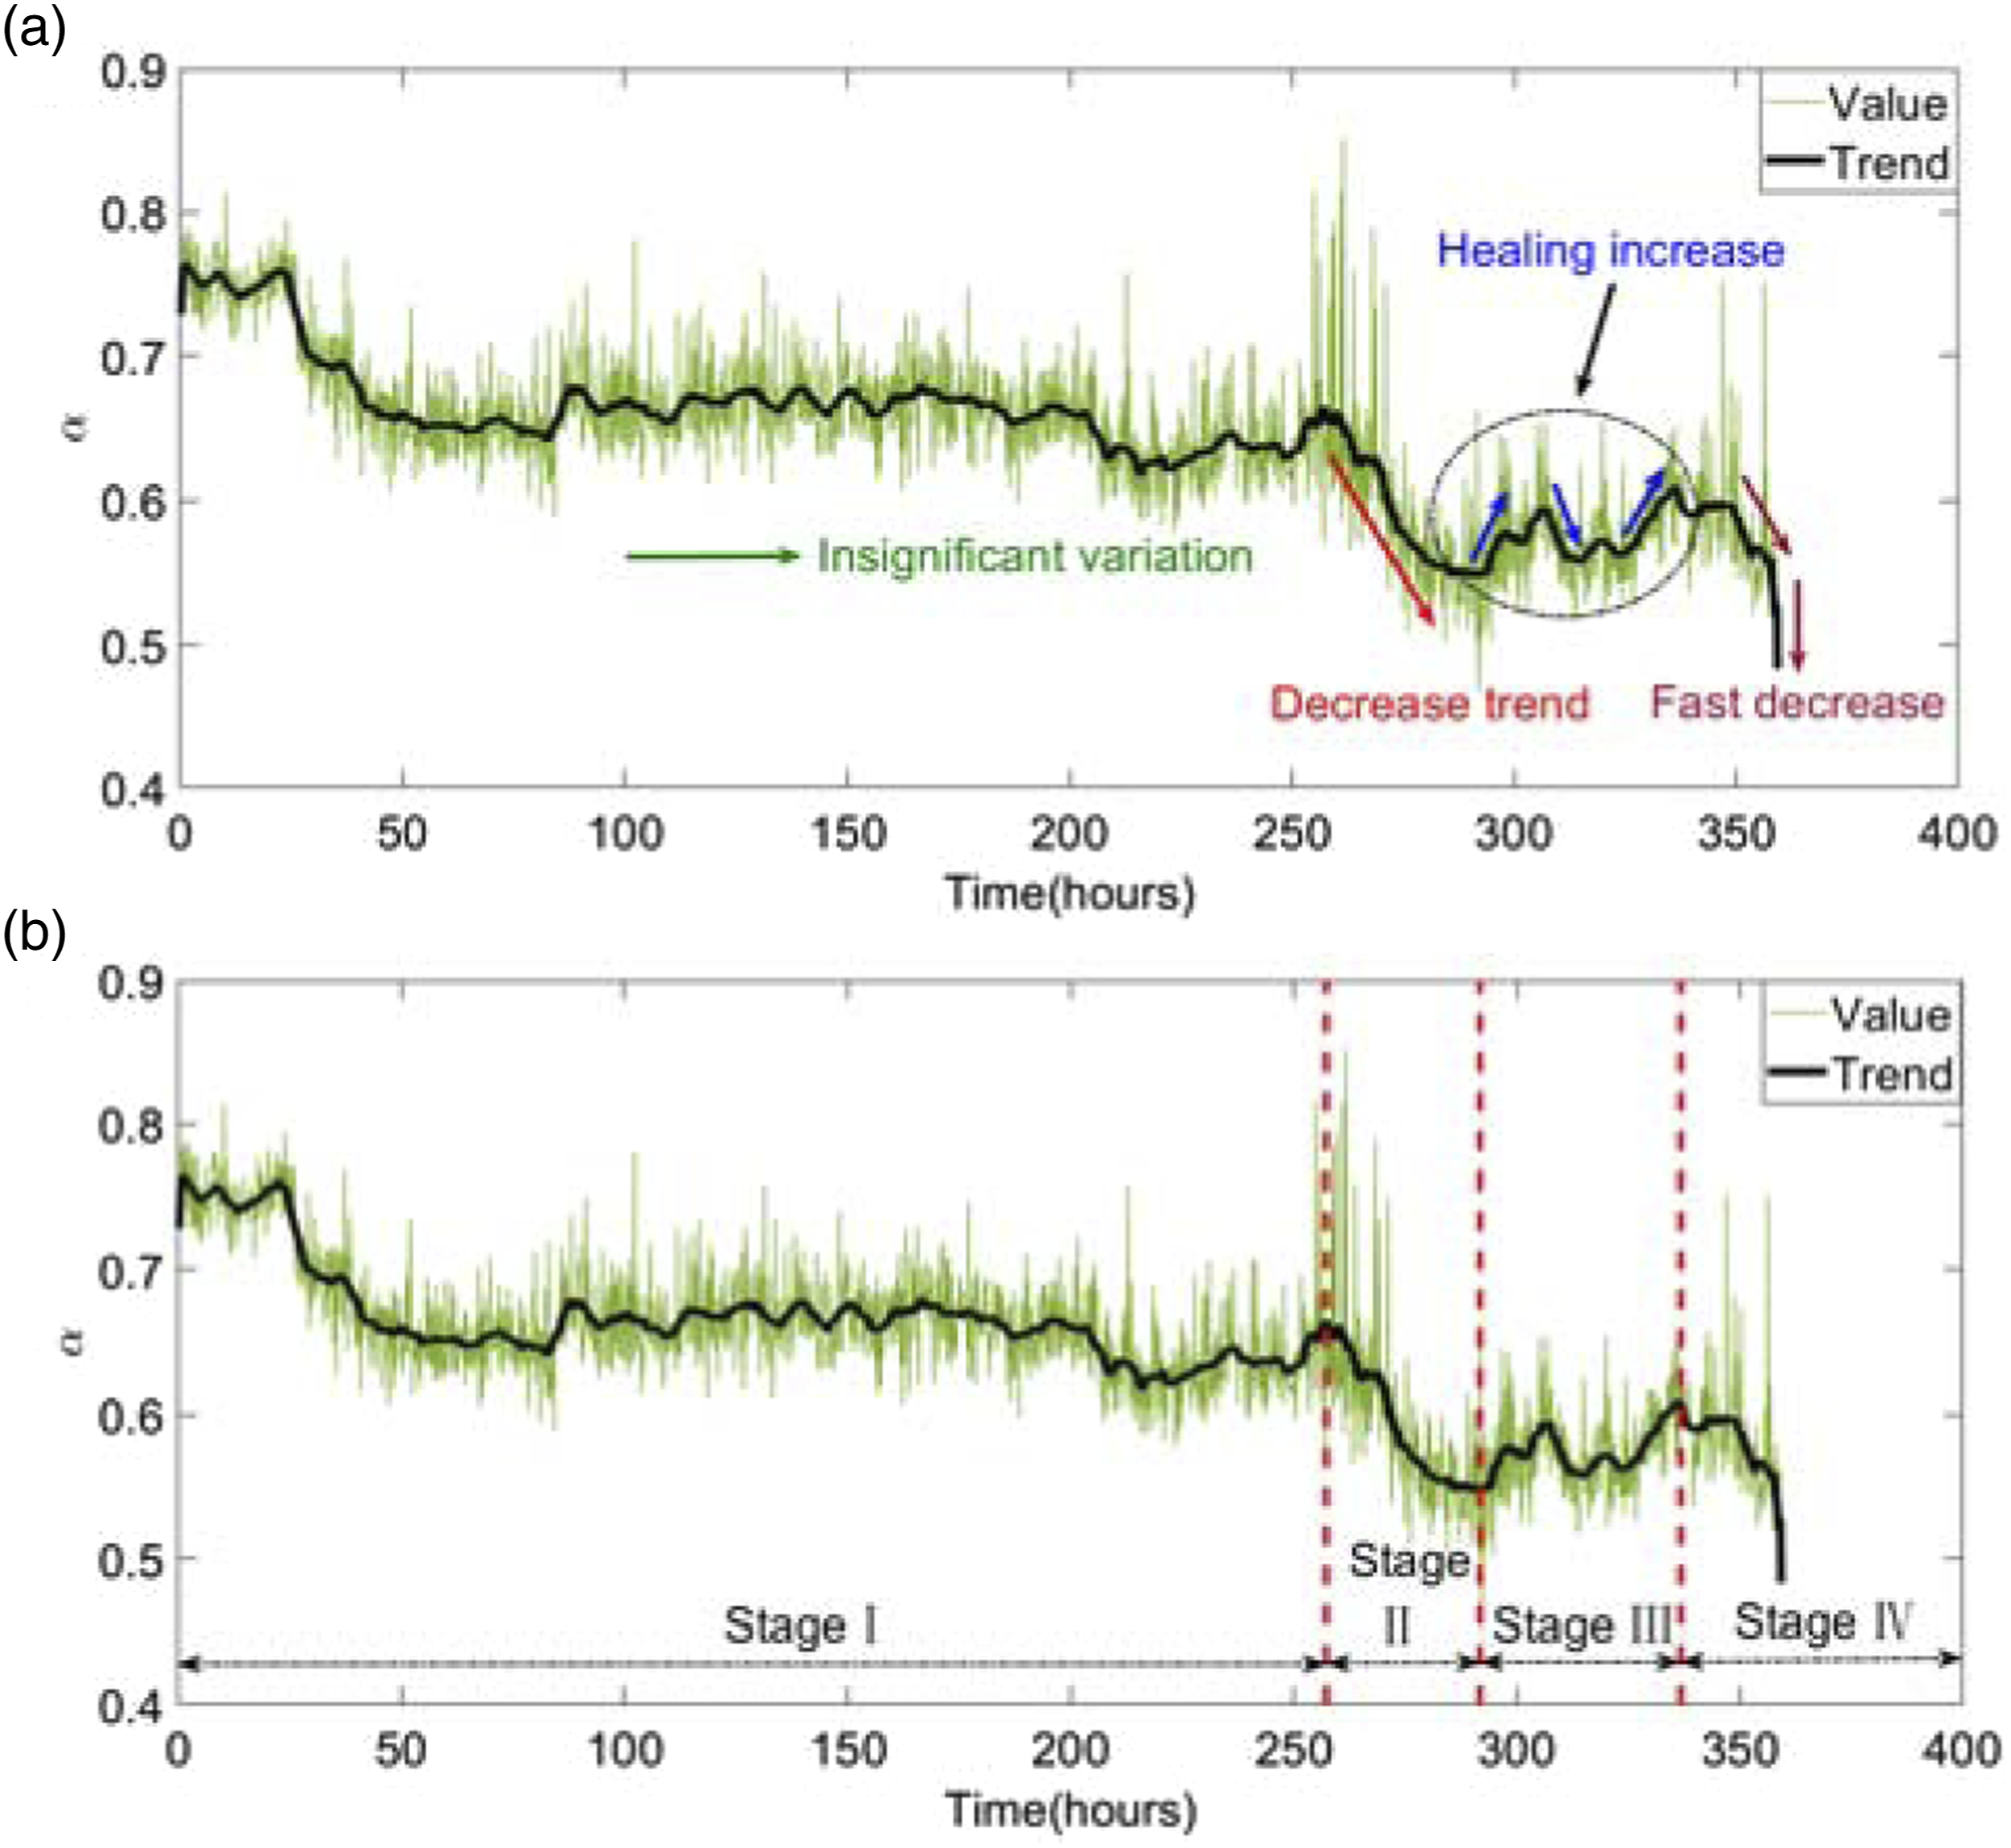
In addition, the other two run-to-failure datasets containing different bearing fault types are also utilized to verify the performance of multifractal features in condition monitoring of the running bearing. The singularity exponent (a) Trend analysis, (b) Condition monitoring (after 200 h of operation) of singularity exponent (a) Trend analysis, (b) Condition monitoring of singularity exponent 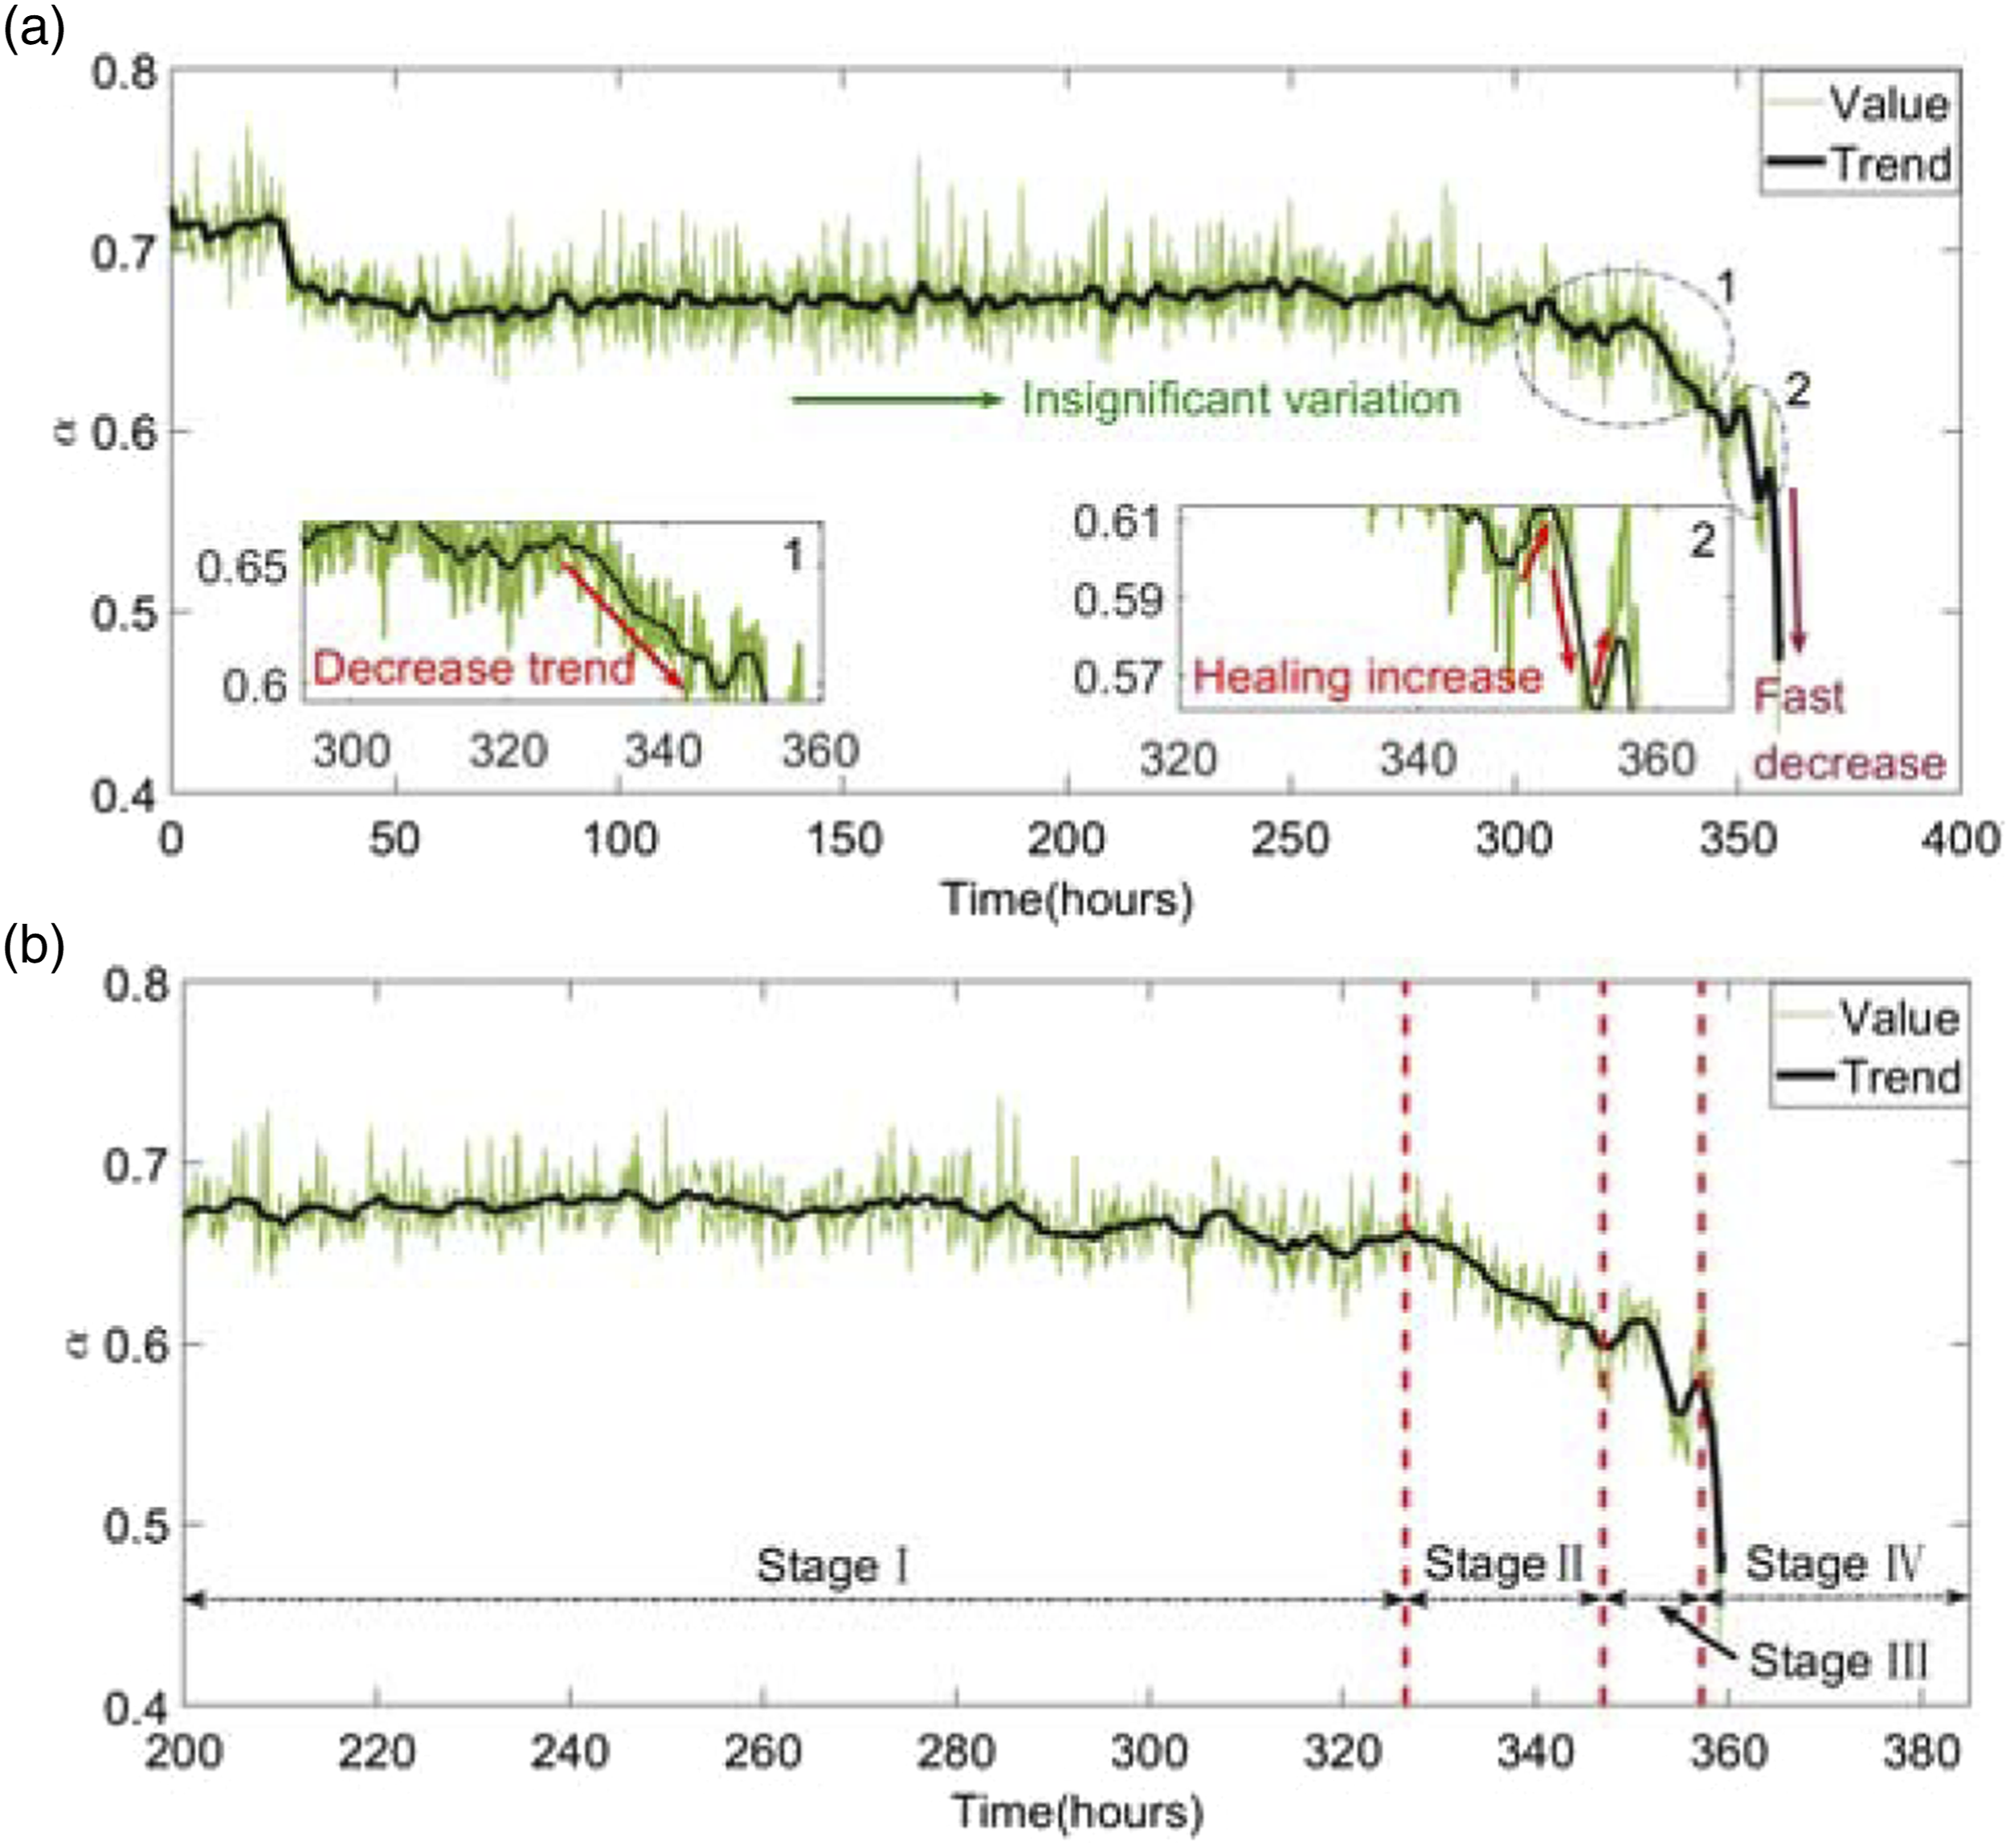
Discussion
Both MFDFA1 and EMD-MFDFA are also employed to extract multifractal features by the same dataset of Bearing 1-Ch 1. The multifractal spectrum obtained under different bearing health conditions can be utilized to evaluate the ability of the multifractal features extracted by these analysis methods in distinguishing the different performance degradation conditions of bearings.
Similar to the above experiment, the 20 data groups randomly selected from each of identified degradation stages are analyzed by MFDFA1 and the results are shown in Figure 15. As shown in Figure 15(a), the multifractal spectrums at negative q of the bearing under four conditions overlap each other and are difficult to be distinguished, which indicates that multifractal characteristic parameters at negative q cannot reveal the differences in the dynamic behaviors of the bearing under different conditions. From the partial multifractal spectrum at positive q shown in Figure 15(b), it can be seen that the normal condition can be well distinguished from other abnormal conditions, but there is a slight overlap between incipient and severe fault stages. (a) Complete multifractal spectrums, (b) Partial multifractal spectrums at positive q of different performance degradation stages based on MFDFA1.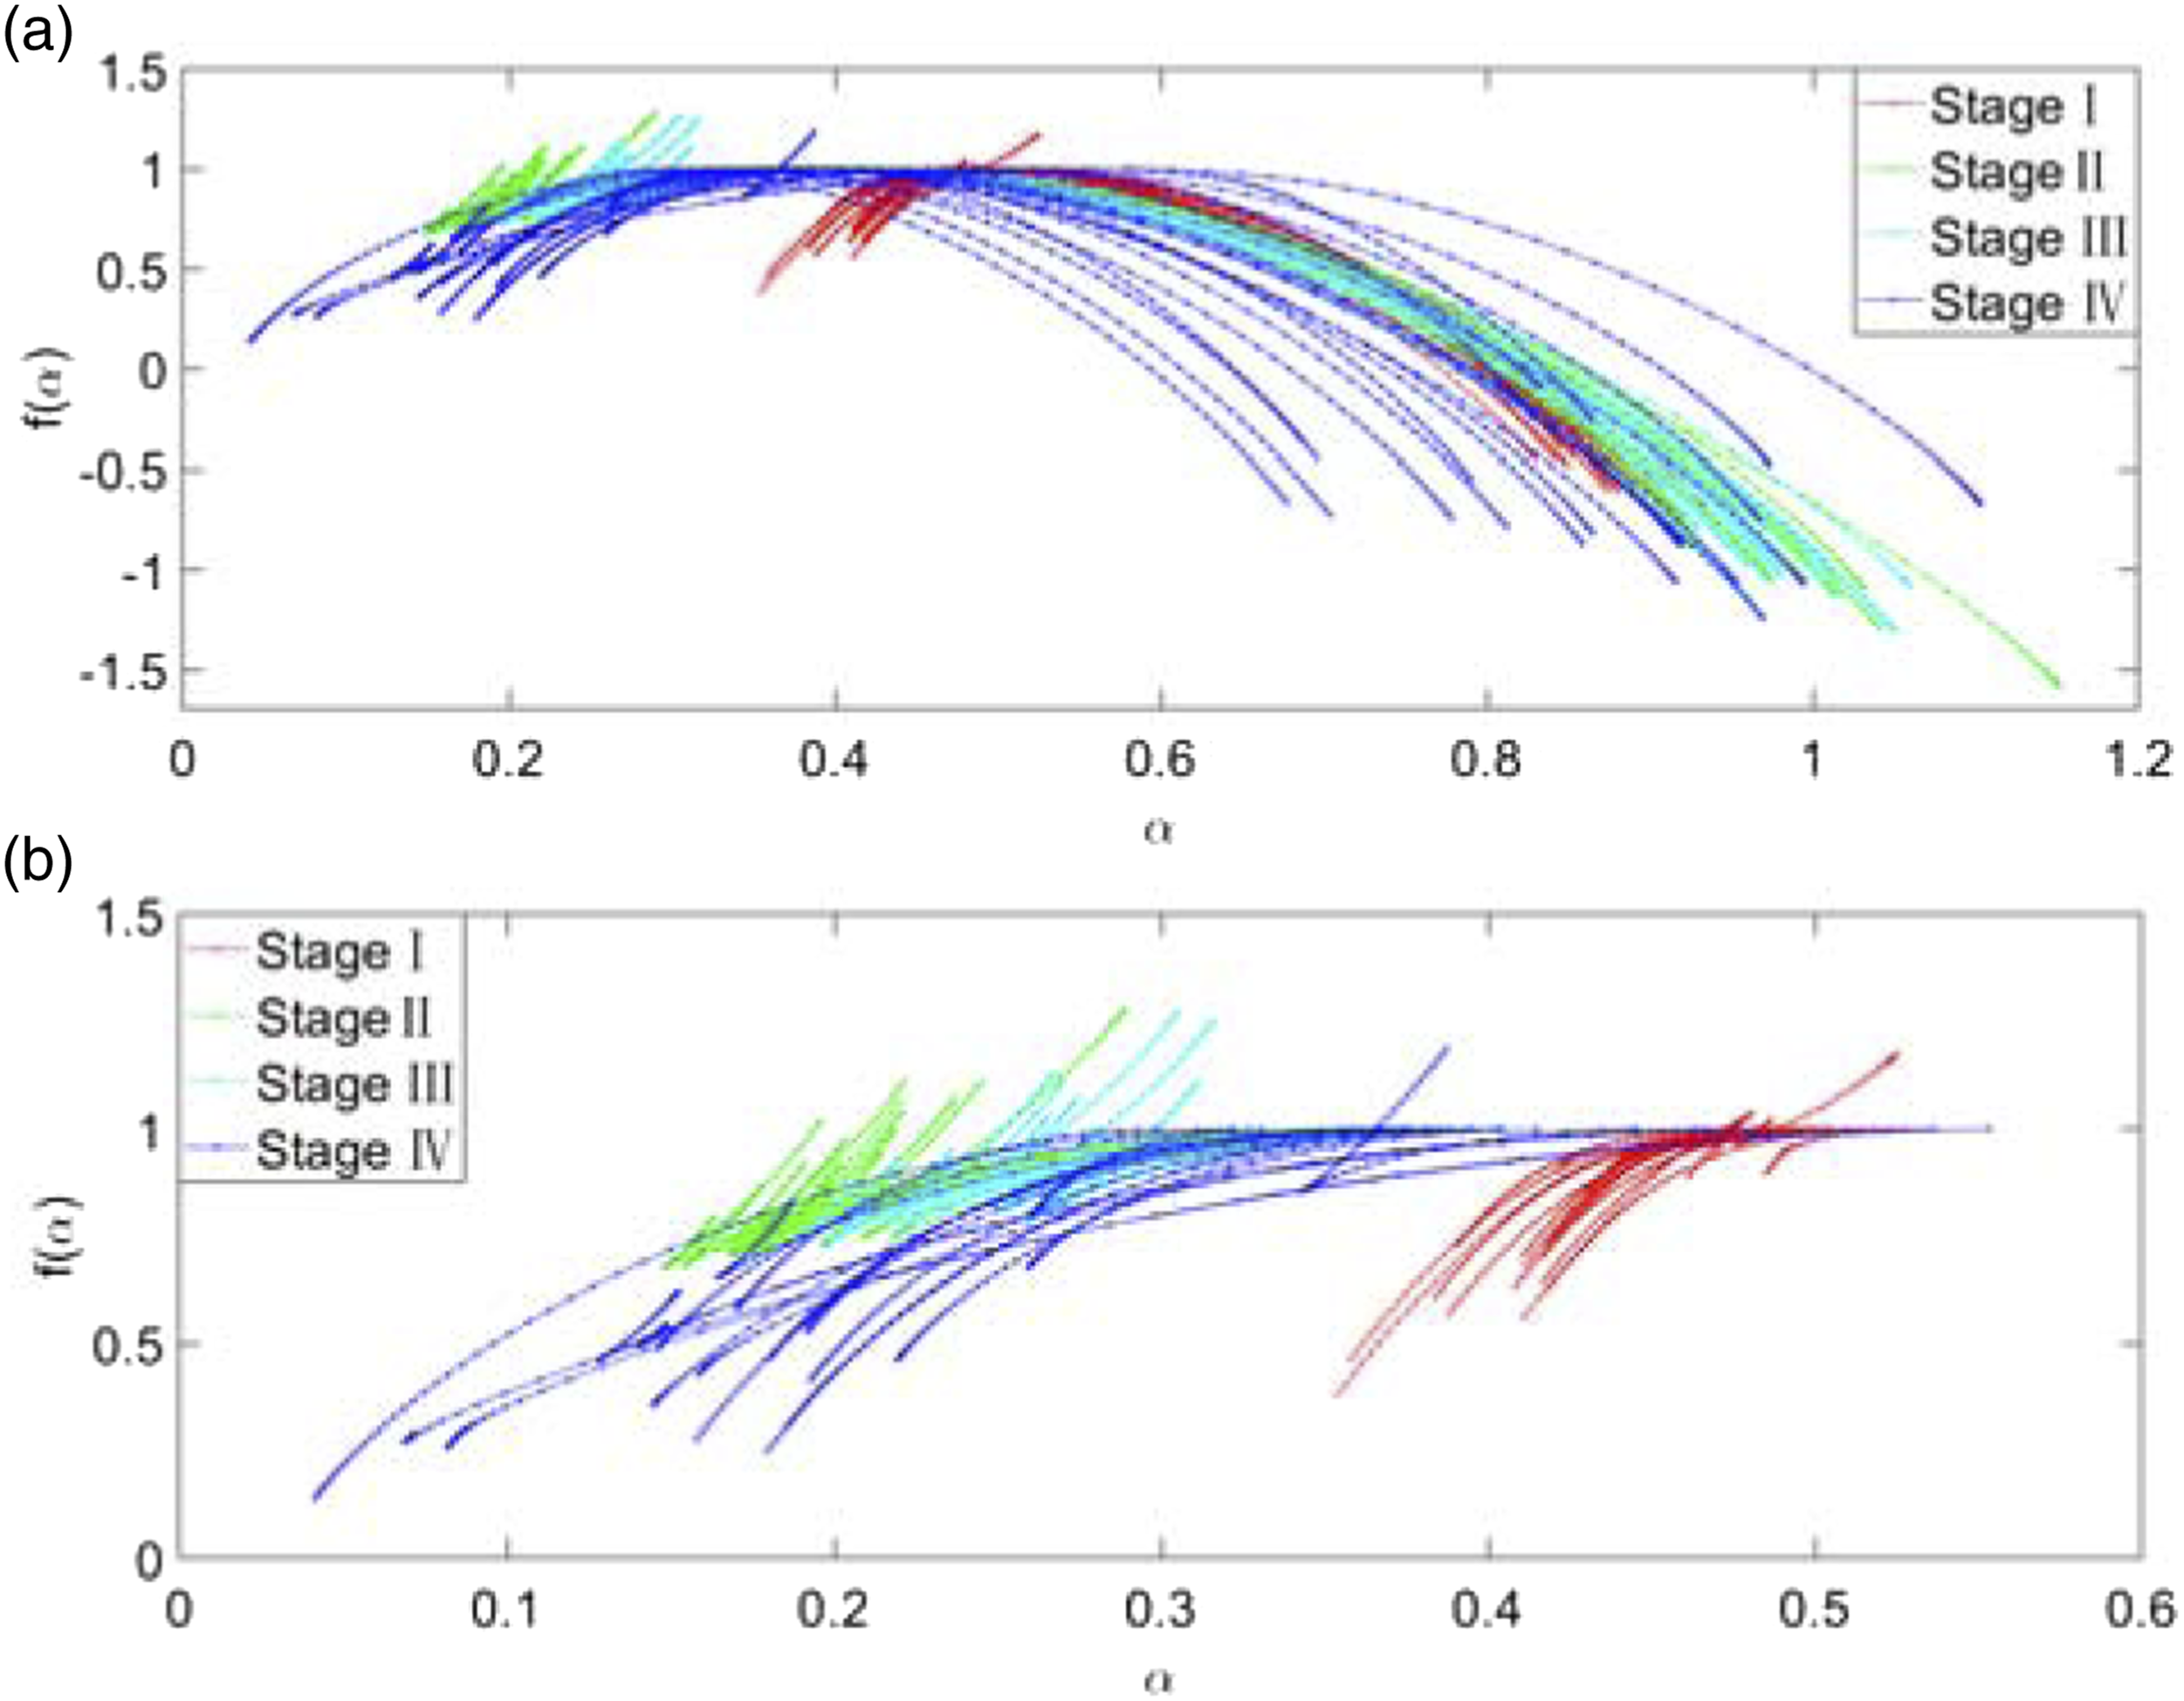
Also, these selected vibration signals are analyzed by EMD-MFDFA and the results are displayed in Figure 16. As shown in Figure 16(a), for negative q, it is hard to distinguish the four stages of the running bearing by their multifractal spectrums, which is similar to the results obtained from MFDFA1. Compared with the proposed method and MFDFA1, Figure 16(b) shows that the partial multifractal spectrum at positive q calculated by EMD-MFDFA under different bearing health conditions have more serious overlap with each other. Nevertheless, the results of EMD-MFDFA also manifest that the partial multifractal spectrum at positive q is more suitable than that at negative q to reflect the fault evolution of bearings in the whole life cycle, which is consistent with the results of the proposed method and MFDFA1. (a) Complete multifractal spectrums, (b) Partial multifractal spectrums at positive q of different performance degradation stages based on EMD-MFDFA.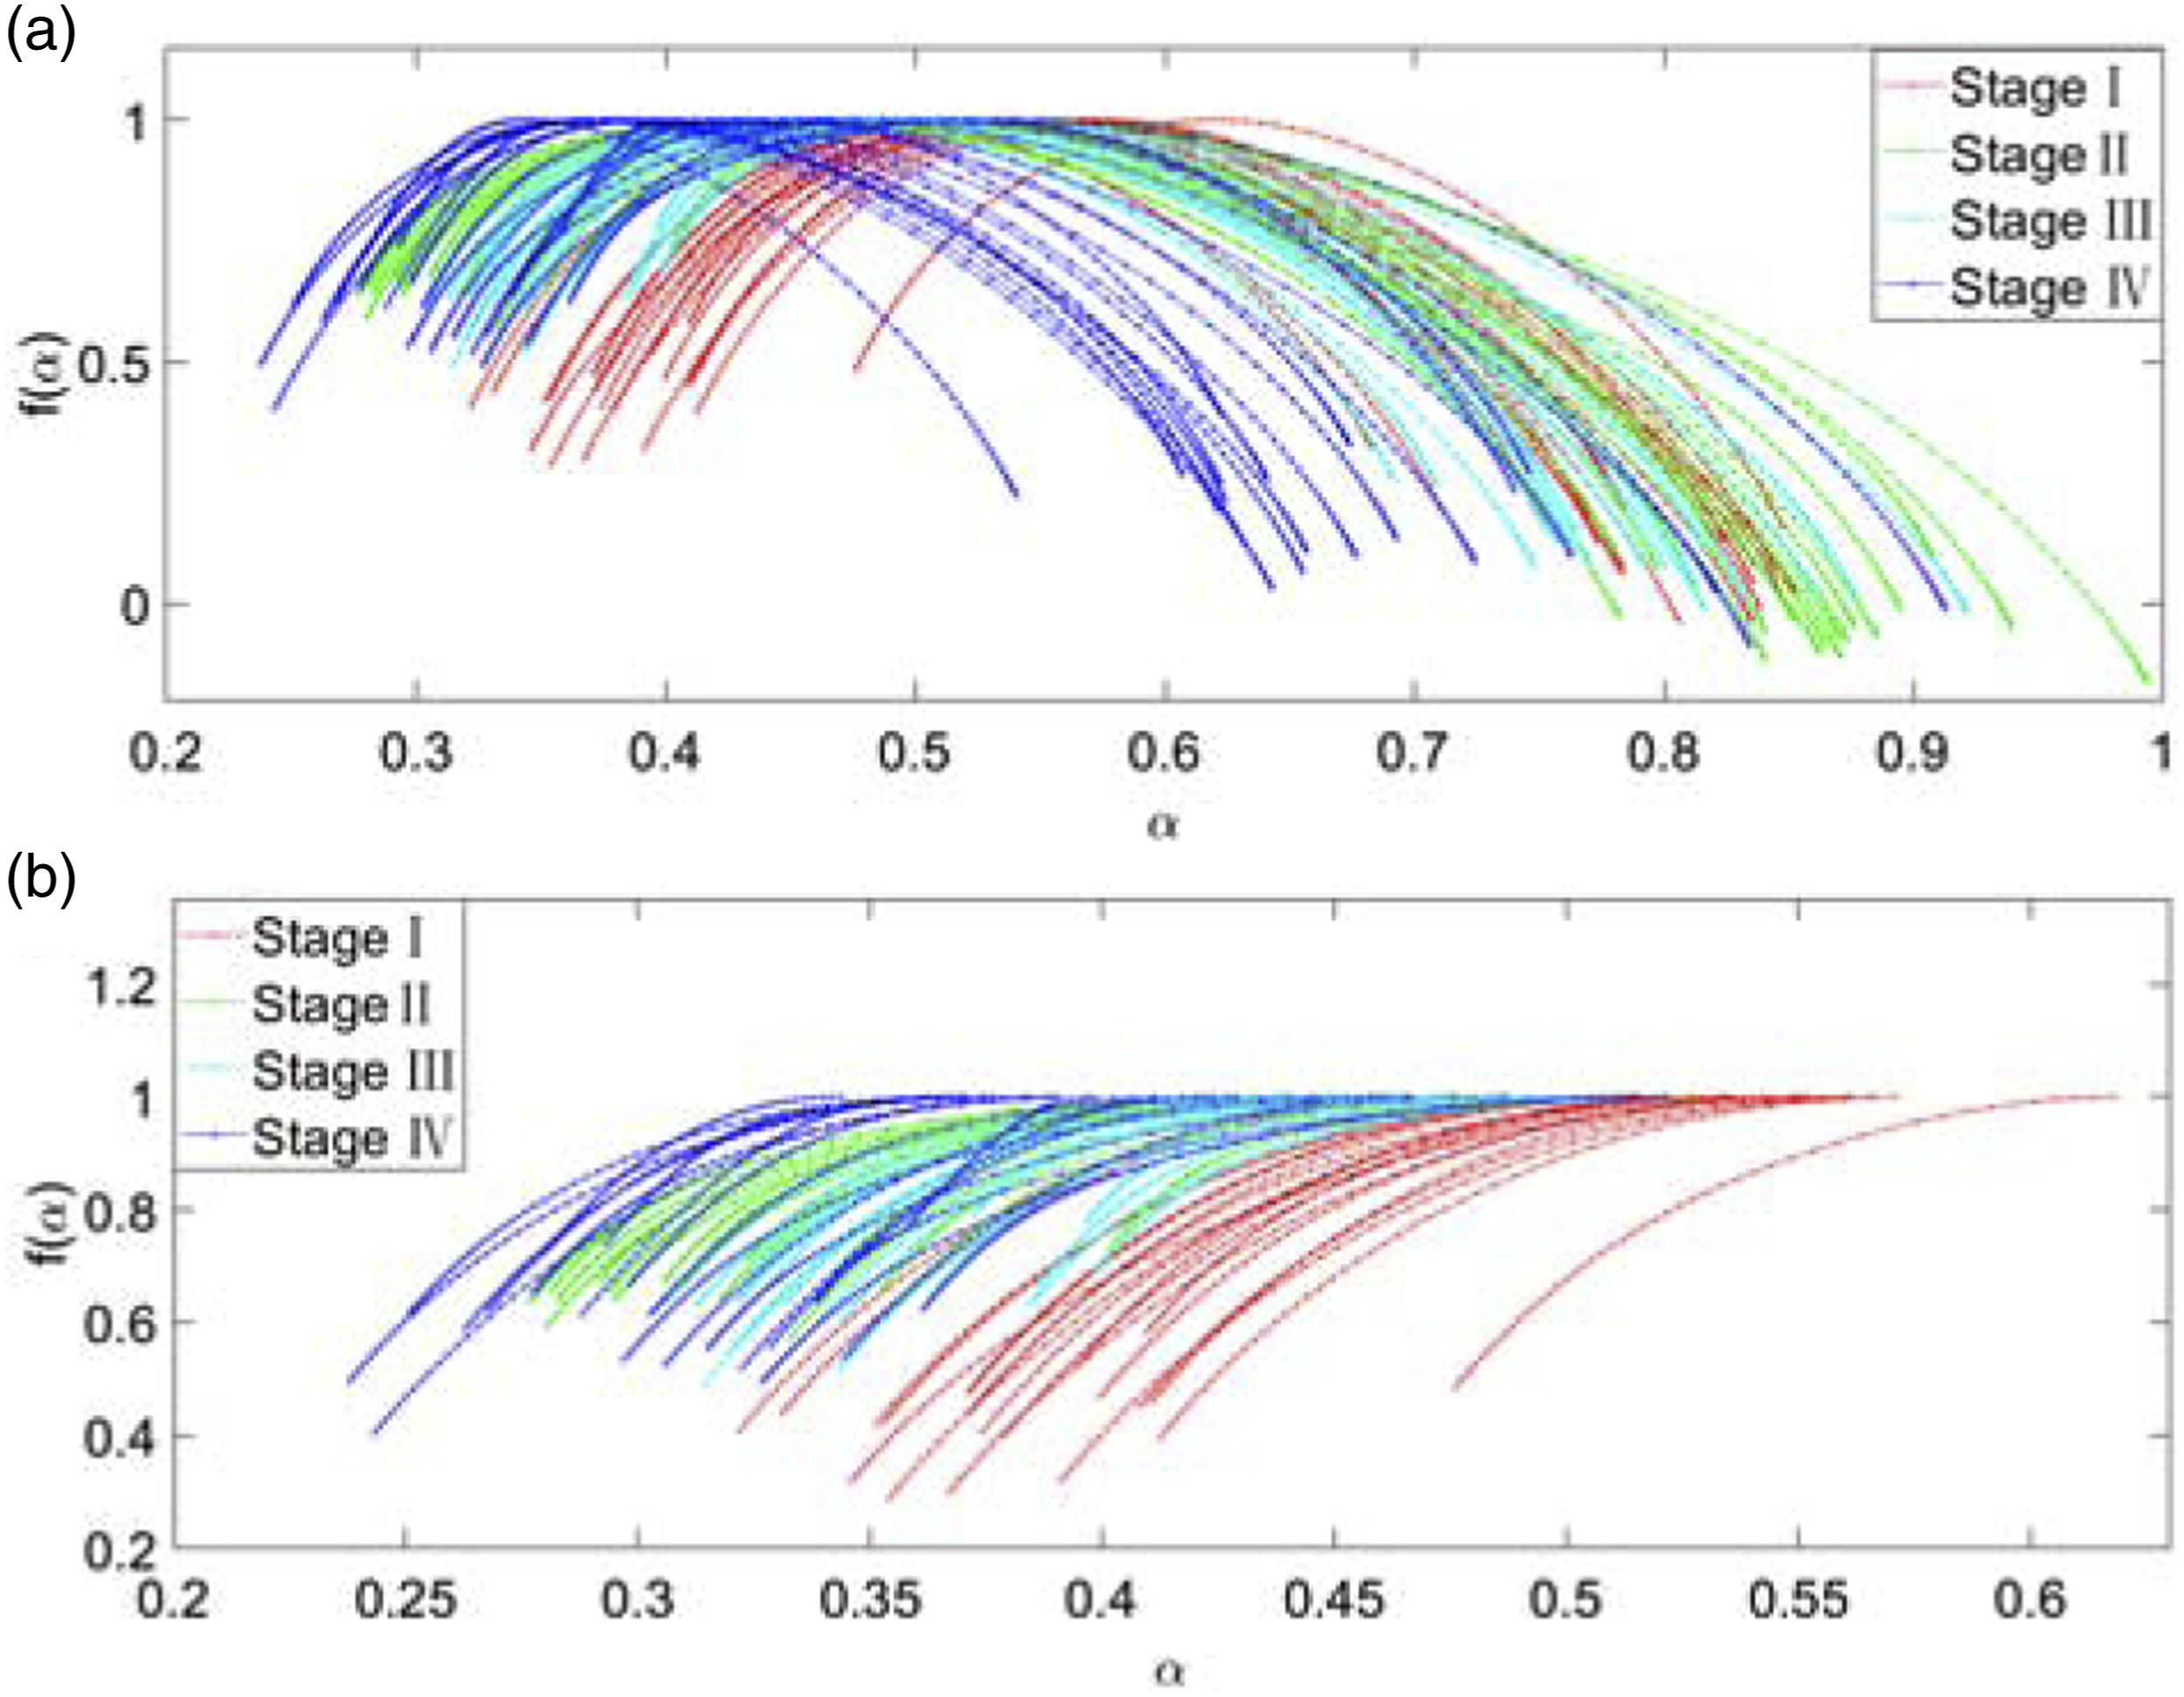
As shown in Figure 17(a), four different health conditions of bearings can be discriminated from each other in the trend of singularity exponent Trend of singularity exponent Trend of multifractal spectrum Trend of multifractal spectrum 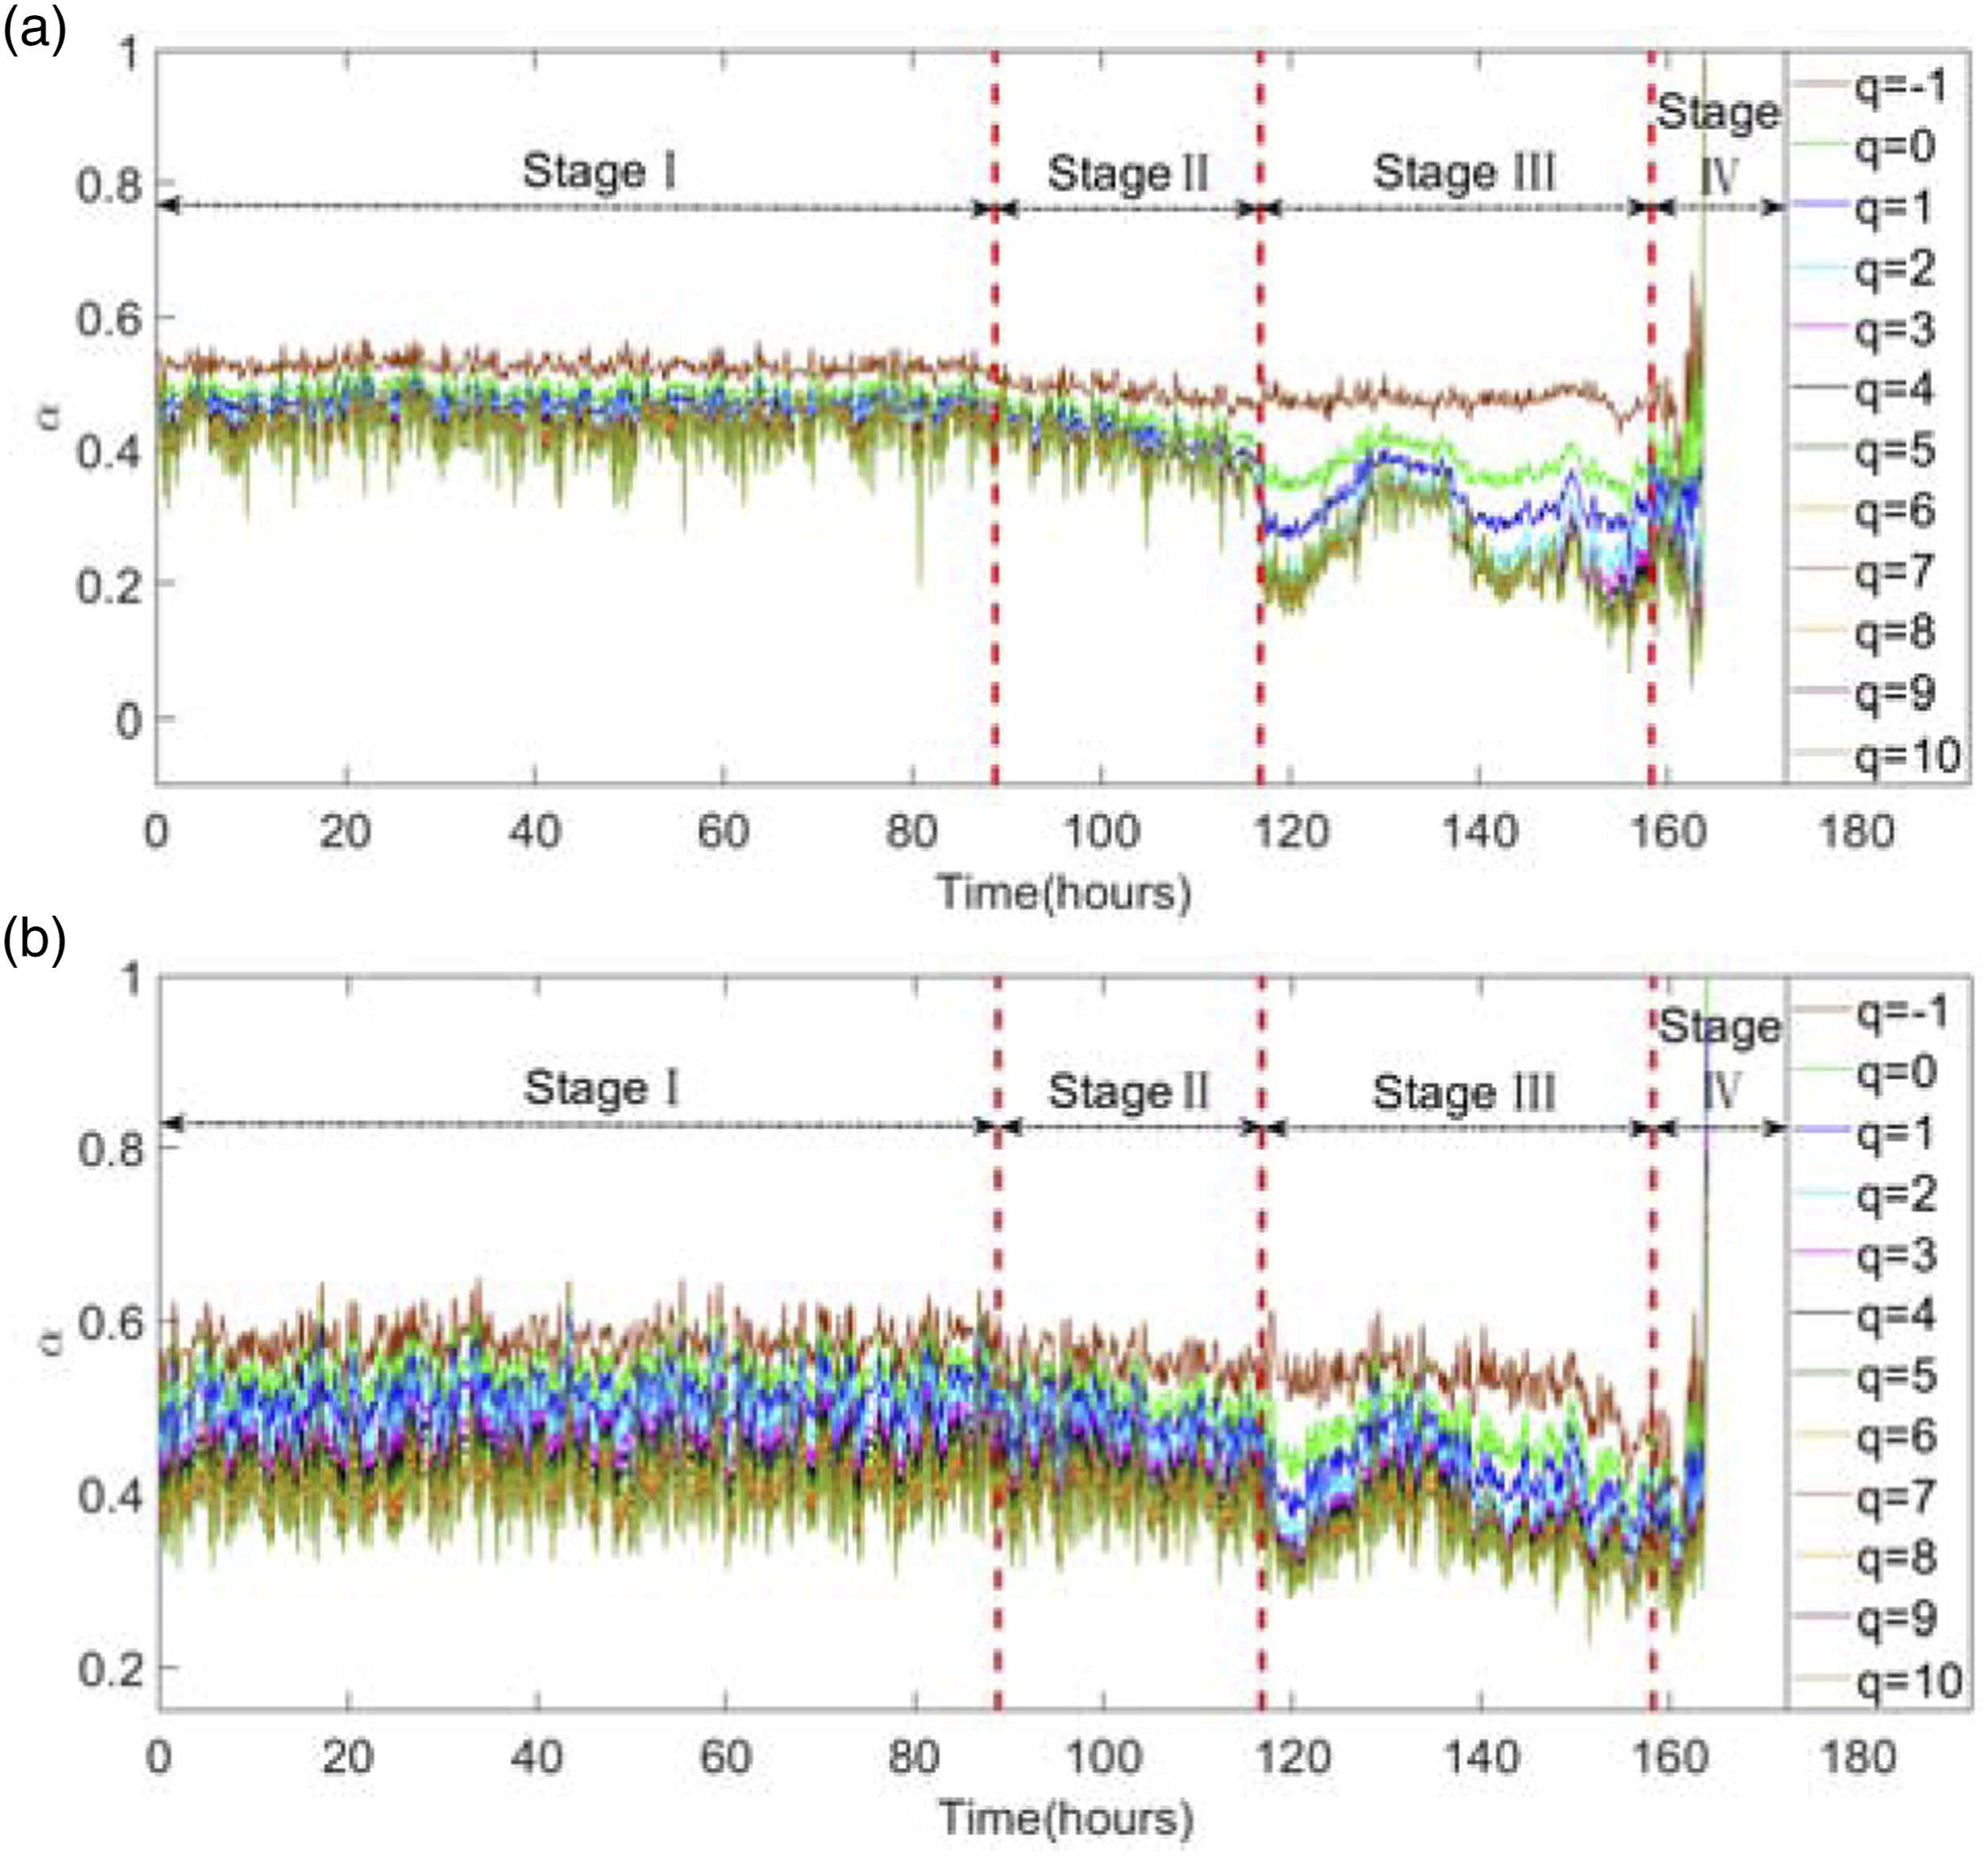
The normal stage is well known as the comparatively steady state of the whole life cycle of the running bearing, which is significantly important to recognize the anomalies due to the occurrence of small defect or crack area. To further prove the superiority of the proposed method in monitoring the health condition of bearing in stage I, MFDFA1 and EMD-MFDFA are applied to Bearing 3-Ch 5 and Bearing 4-Ch 8 for comparison and the results are shown in Figures 20 and 21. In accordance with the analysis of the health conditions of Bearing 3-Ch 5 and Bearing 4-Ch 8 by MFDFA1 and EMD- MFDFA, it can be observed in the stage I that the singularity exponent Trend analysis for stage I of singularity exponent Trend analysis for stage I of singularity exponent 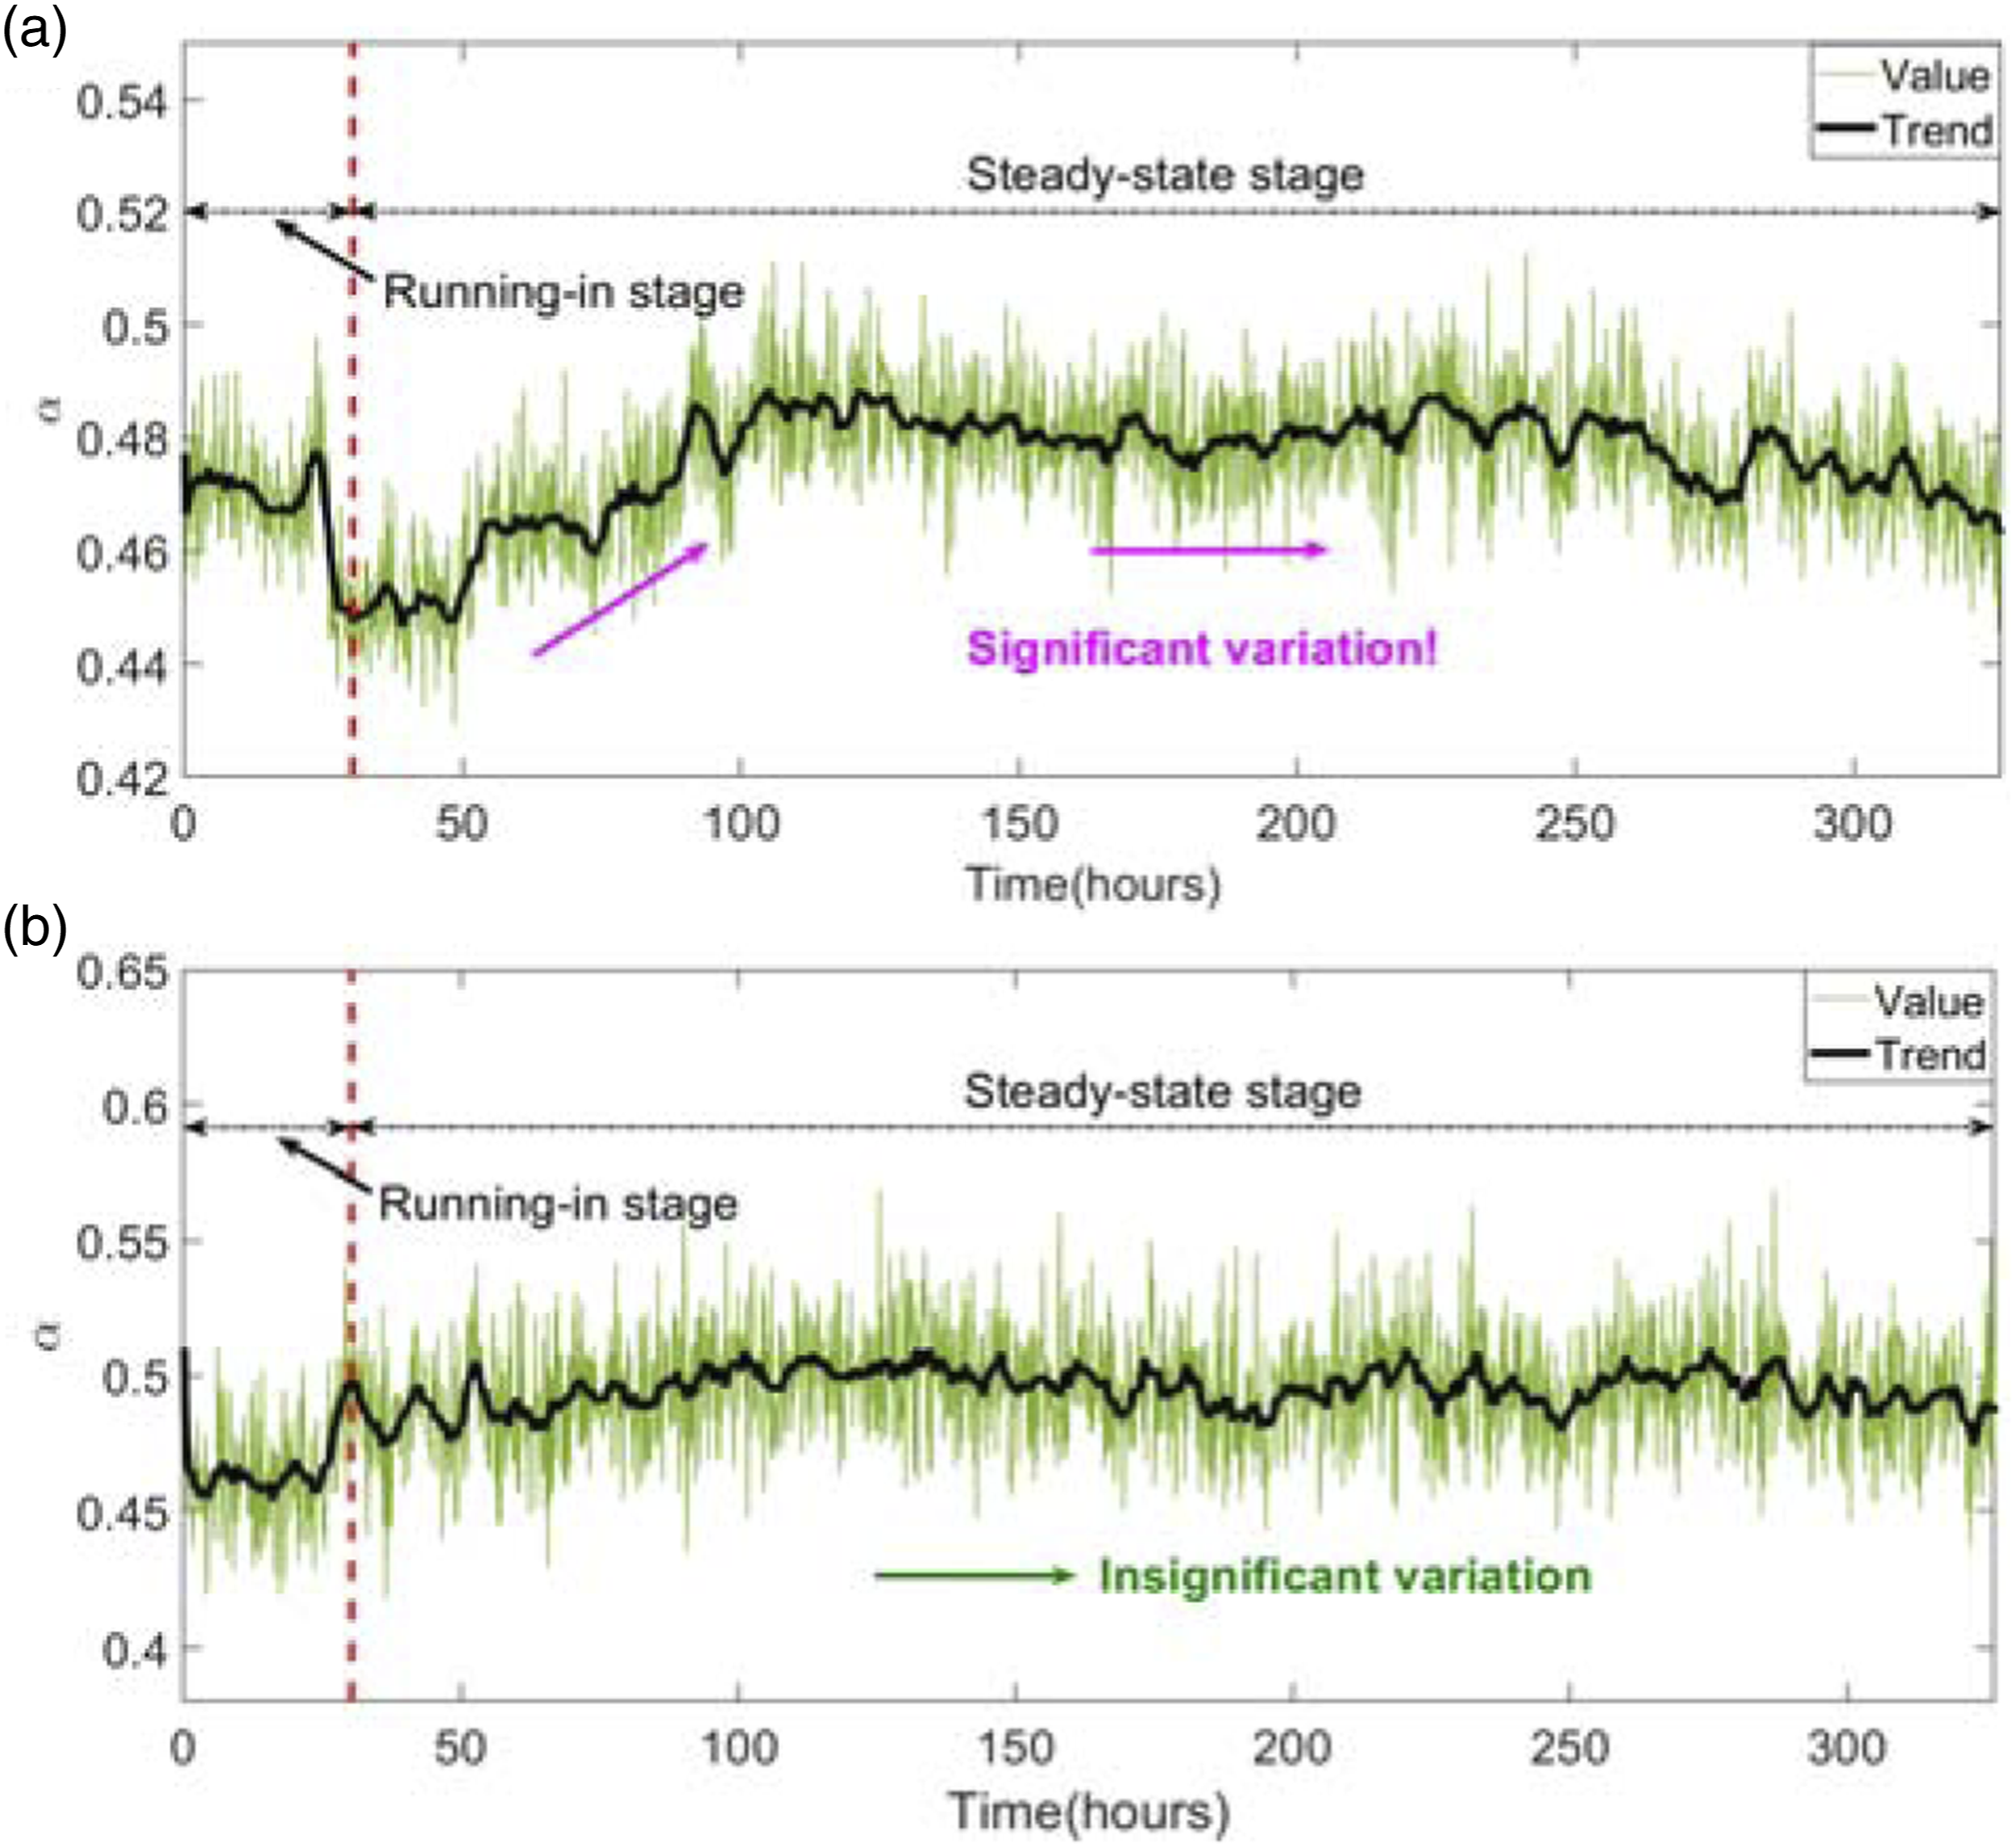
It can be found that both multifractal spectrums in Figure 11 and Figure 15 present anomalies at both ends. It indicates that both the proposed method and MFDFA1 seem to destroy the multifractal structure of the original signal. However, according to the previous analysis results, it can be known that for the partial multifractal spectrums at positive q, the corresponding multifractal spectrum characteristic parameters Fluctuation evaluation of trend curves of various multifractal spectral characteristic parameters calculated by proposed method, MFDFA1 and EMD-MFDFA: (a) 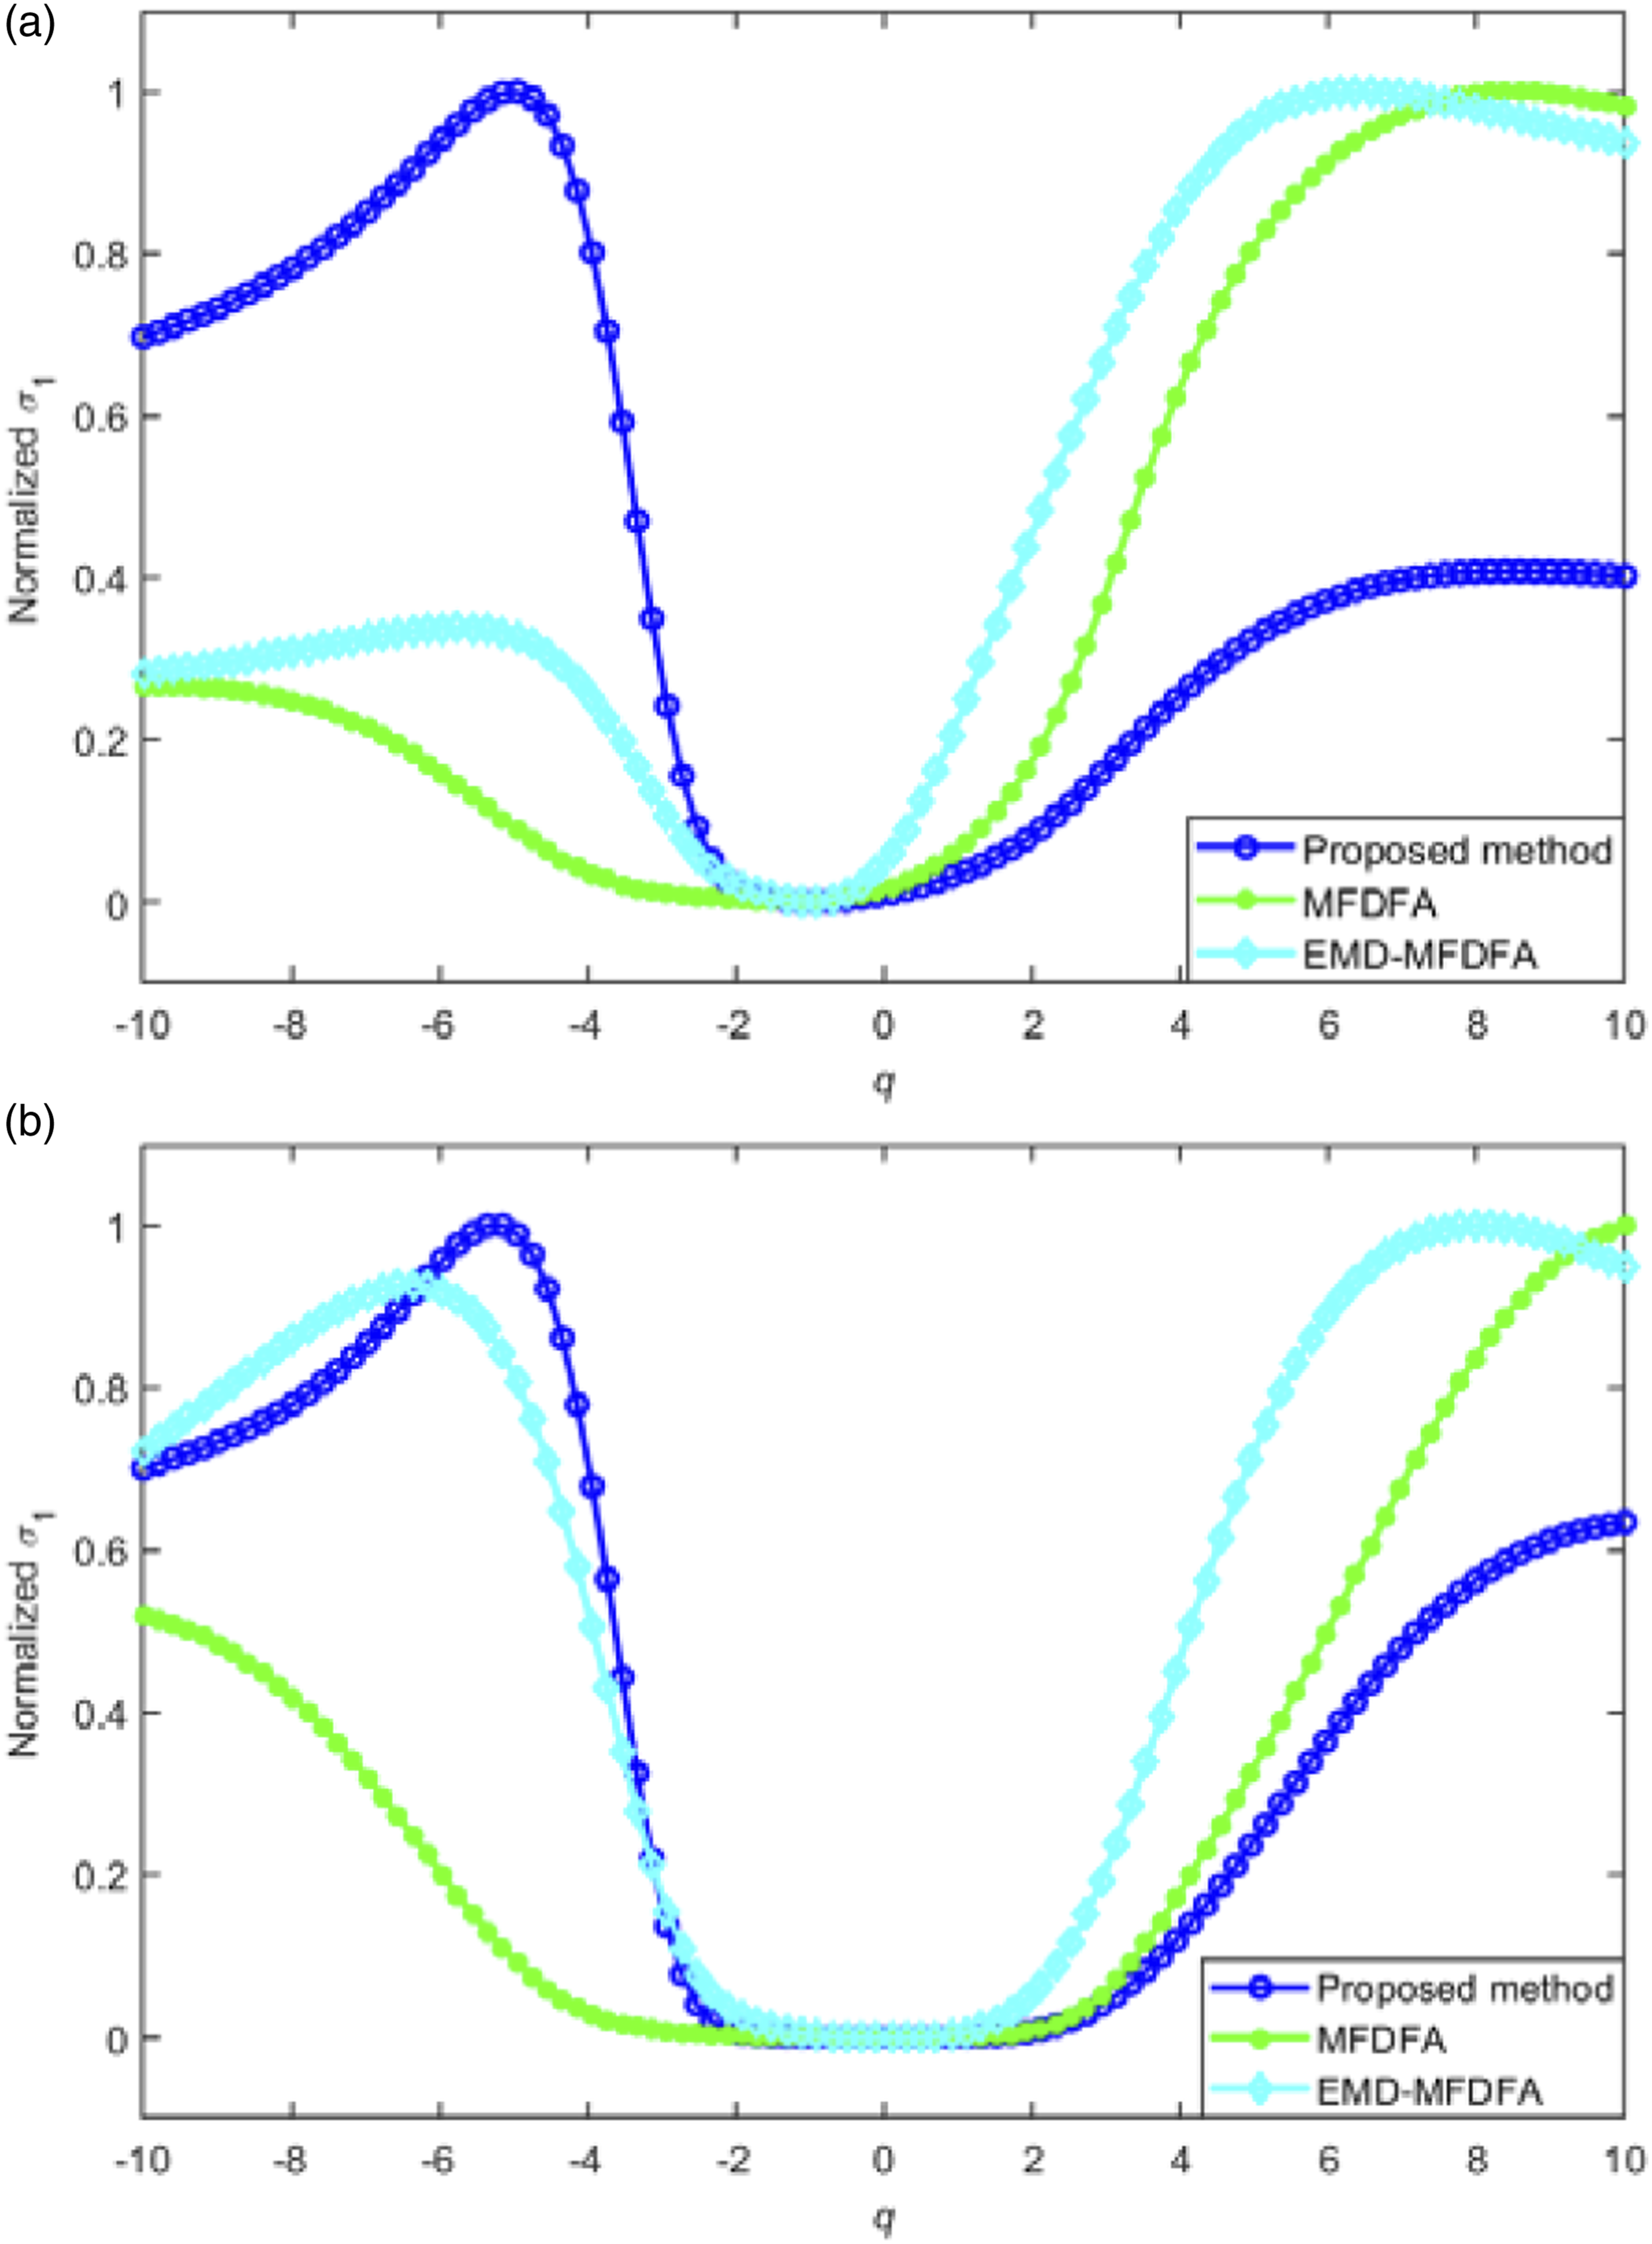
Conclusion
In this paper, an approach of MEMD-MFDFA based on the IMF selection strategy and SMW segmentation method is proposed to extract multifractal features for the early fault identification and performance degradation assessment of rolling bearings. Several simulated and experimental cases are given to verify the correctness of the proposed method. The following conclusions could be drawn. (1) The developed MEMD-MFDFA method is superior to MFDFA and EMD-MFDFA in anti-noise by investigating the simulated multifractal signal produced from the p-model algorithm. (2) Multifractal characteristic parameters on the multifractal spectrum at positive q of vibration signals can be employed to reflect the performance degradation trend of running bearings. (3) With the increase of q, the fluctuation of the corresponding multifractal characteristic parameters becomes stronger. Moreover, the appropriate characteristic parameters of the multifractal spectrum in the middle region can be determined according to their fluctuation degree, which provides a new idea for the establishment of an effective performance degradation indicator based on the multifractal spectrum. (4) Compared with MFDFA and EMD-MFDFA, the multifractal characteristic parameters extracted by MEMD-MFDFA are proved to be more effective in early fault identification and performance degradation assessment according to the experimental results.
Footnotes
Declaration of conflicting interests
The author(s) declared no potential conflicts of interest with respect to the research, authorship, and/or publication of this article.
Funding
The author(s) disclosed receipt of the following financial support for the research, authorship, and/or publication of this article: This work was supported by the National Natural Science Foundation of China (Grant no. 51765034) and Excellent Graduate Student “Innovation Star“ project of Education Department of Gansu Province (Project no. 2021CXZX-446). This work was also supported by Science and Technology Projects of Gansu Province (Project no. 21JR7RA305) and Key Laboratory of Cloud Computing of Gansu Province (Gansu Computing Center).