
Abstract
Cracks in concrete structures are one of the most important indicators of structural damage, and it is a necessity to detect and measure cracks for ensuring safety and integrity of concrete structures. The widely practised approach in inspecting the structures is by performing visual inspections followed by manual estimation of crack widths. This approach is not only time-consuming, laborious, and time-intensive but also prone to subjective errors and inefficient. To address these issues, we propose a novel deep learning framework for detecting cracks and then estimating crack widths in concrete surface images. Our framework handles both small- and large-sized images and provides a prediction of crack width at locations specified by the user. The proposed framework uses Attention Recurrent Residual U-Net (Attention R2U-Net) with Random Forest regressor to predict crack width with the mean prediction error of ±0.31 mm for crack widths varying from 0 to 8.95 mm and produces the lowest absolute maximum error of 1.3 mm. Our model has a coefficient of determination (R 2) of 0.91, showing a non-linear mapping function with low prediction errors. We compare our model with a combination of four other segmentation models and regression models. Our proposed model has superior performance compared to other models, and one can easily adopt our framework to a variety of Structural Health Monitoring applications using Internet of Things sensors.
Keywords
Introduction
Concrete is the world’s most used man-made material and is being used to build bridges, builds, dams, roads, pipelines, and many other critical infrastructures. 1 The occurrence of concrete cracks shows underlying structural damage and requires continuous monitoring and measurement. The development of these cracks in terms of width and length may severely affect the structural safety, strength, and maintenance of these structures. Early detection of cracks, localizing them and quantifying the crack widths play an important role in ensuring sound structural health and durability. For example, as per the current inspection manual regulated by the local road and bridge management agency, the manual specifies that either single or multiple cracks with a width greater than 0.3 mm could affect the structural integrity of concrete structures, and require continuous measuring and monitoring. 2 In particular, the inspection manual 2 also specifies requiring location, extent (i.e., length), width of cracks, and changes in these defects (compared to previous inspections) as key indicators of potential changes in the structural capacity and performance. The location, length, and width of these defects also inform condition rating, overall maintenance, and repair information for inspected structures. 2 This work focuses on detecting millimeter-level accuracy of crack widths from concrete structure images. This level of accuracy and measurement of cracks are crucial for the inspection and maintenance of concrete structures. For example, in the inspection and maintenance manual of the local infrastructure agency, 2 it is highlighted that those crack locations and crack widths are the key indicators of the performance and capacity of concrete structures.
Traditional structural engineering relies on visual inspection by measuring the crack widths using gauges and then transferring these measurements to the drawings. They often measure the crack widths at pre-determined locations as set by the end users or decided based on the structure. However, this process of manual measurements is not only labor-intensive but also time-consuming and prone to subjective errors. 3 In addition, manual inspection is infeasible at many hazardous locations where the inspection team cannot access the structures. 4 Sensors such as strain gauges, 5 vibrating wire strain gauges, 6 and distributed fiber optic sensors 7 have been used to assess crack widths. People have also explored used Non-Destructive Testing (NDT) technique such as the ultrasonic Coda Wave Interferometry (CWI) to detect cracks. 8 However, automating the detection of cracks is not workable with these approaches and would require setting up of sensors and devices regularly to measure crack widths. Therefore, it is critically important to use a robust, automated crack width measuring techniques to provide accurate and less-expensive solutions for assessing infrastructure damages.
Image processing methods
To enable automated detection of cracks and widths, engineers and researchers explored imaging systems to detect structural defects since ‘90s. Imaging systems allow to capture the structures as images and then analyze individual images to detect defects. For instance, image processing is used to detect spalling and transverse cracks 9 and concrete cracks. 10–13 Researchers have designed Computer Vision-based intelligent algorithms to automate such tasks where analyzing individual image is laborious and time-intensive. For example, vision-based algorithms can quickly detect cracks in large structures, such as in dams 14,15 and bridges 16,17 with high accuracy. Likewise, we find vision-based algorithms being used in many engineering projects with applications to detect cracks in pavements, 18,19 road surfaces, 20,21 concrete surfaces, 22,23 concrete bridges, 24 and pothole detection. 25,26 Over the years, computer vision algorithms have been playing an important role in reducing cost, saving time and also providing much higher detection accuracy (matching or exceeding human performance).
To detect damage and assessment loss of reinforced concrete elements, Rivera et al. 27 proposed an automated procedure involving digital image processing called “I-Crack” to detect crack width from nine reinforced concrete shear of walls comprising different aspect ratios and reinforcement ratios. They use a range of image processing techniques (including morphological operations, segmentation) and pattern recognition to estimate width and compare with I-Crack. The results show a reasonably good accurate estimation, and the estimation varies with different reinforced concretes.
Lins and Givigi 28 propose crack recognition and crack measurement algorithms to estimate crack width. The crack recognition algorithm uses color histogram and particle filtering to detect cracks in four categories: complex, diagonal, vertical, or horizontal. Then the crack measurement algorithm uses the least-squares first degree polynomial approach to approximate the width. This approach has an error rate of 7.51% in estimating the crack widths.
Cho et al. 29 propose an edge-based crack-width transformation algorithm to detect concrete structural cracks. The technique comprises five steps: transforming crack widths, filtering aspect ratios, searching crack regions, filling holes, and finally, the threshold operation. They detect cracks in the images, but do not provide the width of the cracks. Also, the approach is more heuristic because of multiple variables used in detecting the cracks, and hence, may not always generalize well to different datasets.
Nguyen et al. 30 propose automatic crack-width measurement framework in 2D multiple-phase images. First, they enhance the cracks in images through filters; next, they use B-spline level set model to detect the crack locations, and in the last step they use Savitzky-Golay filter to measure crack widths. Although the results are good, they showed the results only in a few images, making it difficult to validate on larger datasets.
Deep learning methods
Since 2012, the deep learning field has gained significant attention for their ability to identify objects automatically in images, localize the detected objects, segment the objects from background, classify textual documents, and recognize voices. 31 Convolutional Neural Networks (CNNs) form a major part of deep learning architectures to achieve state-of-the-art performances. This superior attribute of CNNs is because of their ability to learn mapping functions automatically from input to output, especially from spatial data (such as images). Before the revival of deep learning field for various vision-based automated tasks, researchers relied on handcrafted features. Example of such handcrafted features for detecting cracks in images include Hough Transform (features) and Support Vector Machine, 32 texture features and neural networks, 33 edge features and Adaptive Boosting (AdaBoost), 33 and Wavelet filters (as features) and energy functionals. 34
We can broadly classify CNN-based crack detection into two categories 35 : (i) Region-based classification methods and (ii) Semantic segmentation methods. Region-based CNN methods focus on identifying and classifying whether particular regions in an image have cracks. Semantic segmentation methods try to classify each pixel as belonging to one of the pre-defined class labels. For example, we can label the pixels associated with cracks to one class and associate the remaining pixels can to another class. Thus, the semantic segmentation approach aims to provide pixel-level classification of pixels. This is much more suited for predicting crack width, especially when we want to measure the crack widths automatically and when we need a much finer information about the cracks. Region-based Classification Methods
Region-based methods consider certain image regions to detect cracks. In 36 , Beckman et al. use the Faster R-CNN 37 approach to detect concrete spalling. The CrackDN 38 approach by Huyan et al. uses a modified version of the Faster R-CNN 37 to detect sealed and unsealed cracks. In 37 , Zhang et al. combine convolution features along the time axis to produce favorable results in detecting and localizing cracks. Rao et al. 35 show how different region-based CNN methods perform with very high accuracy, sensitivity, and specificity. In addition, Rao et al. 35 show that by creating patches from the larger images, they can detect cracks with near perfect accuracy and compare models for real-time inferences. The drawback of region-based classification methods is that they do not provide information about the exact width of the cracks—they inform us of the region (in which a crack is present) but not the exact location of the crack. Therefore, we cannot directly use region-based classification methods for crack-width quantification and measurements. Semantic Segmentation Methods
Semantic segmentation methods aim to classify each pixel into one of the pre-determined classes (“crack” or “no crack”). In this direction, Zhang et al. 40 proposed CrackNet framework, which is a 5-layer CNN architecture, that detects cracks in 3D asphalt surfaces with 90.13% precision and 87.63% recall. On the other hand, Fully Convolutional Network (FCN) 41 employing encoder-decoder network has also shown excellent performance in classifying pixels and identifying cracks. 35 FCN employs encoder-decoder network to encode features (extract from input images with one of the backbone architectures from region-based methods to classify, but without the final output layer) and decode features (de-convolve and up-sample layers to reconstruct segmented images) to produce pixel-level classification. Li et al. 42 proposed FCN with DenseNet-121 (as encoder) to achieve a pixel accuracy of 98.61%. Yang et al. 43 tried FCN with VGG-19, but achieved the maximum accuracy of only 81.73%. In DeepCrack, 44 Liu et al. extend FCN by combining FCN and Deeply Supervised Nets (DSN), whereas Alipour et al. 45 introduced CrackPix framework using FCN to detect cracks. Their framework achieved 92% accuracy in detecting crack pixels and 99% in detecting non-crack pixels. Bang et al. 46 employ FCN with ResNet-152 encoder network to detect cracks in road surface images with an F-measure of 0.74. In 47 , Zhang et al. propose SegNet to detect pixel-level cracks. One of the limitation of these approaches is that after detecting the crack pixels, these methods do not estimate crack width from the segmented output.
Recently, Liu et al. 48 proposed U-Net architecture 49 to detect concrete cracks. Like FCN, the U-Net 49 uses encoder-decoder network but with some changes to the network architecture (please refer to Rao et al. 35 for more detailed information). In 48 Liu et al. use Focal Loss to improve the detection of crack pixels, but do not estimate crack width.
The performance of the handcrafted (manual) features often falls behind the deep learning methods. As a result, vision-based crack detection methods that use deep learning methods often outperform traditional approaches. In this paper, our proposed approach adopts a semantic segmentation deep learning framework. Our approach incorporates an encoder-decoder network with attention mechanism, time information (Recurrent Residual), and Random Forest regressor on top to predict crack width from user-specified locations.
Methodology
In this section, we present Attention Recurrent Residual U-Net (Attention R2U-Net) framework for detecting concrete cracks at pixel-level and predicting crack widths in RGB images. The Attention Recurrent Residual U-Net (Attention R2U-Net) model is a combination of Attention U-Net
50
and Recurrent Residual U-Net,
51
designed for detecting pixel-level cracks in color images containing concrete surfaces. The proposed Attention R2U-Net model segments cracks at pixel level, and we use Random Forest (RF) regressor for learning the mapping function to estimate crack width from segmented pixels. From the literature, we see that the patch-based detection of cracks do not provide several pixels belonging to crack regions
35
—they only identify the region where there is a crack which sometime is inefficient if we want to know the width of the cracks (say in millimeter or number of pixels). To address these challenges, we introduce a new pixel-wise segmentation architecture for generating crack segmentation map. This is a two-step approach including: (1) dense prediction map of each pixel from input image to segmented image using Attention R2U-Net and (2) predicting crack widths using a Random Forest regressor. The following subsections describe each of these steps. The current section describes the Attention U-Net architecture, training methodology and predicting crack width. Figure 1 provides three flowcharts: Figure 1(a) training the segmentation model, Figure 1(b) the regression (prediction) model, and Figure 1(c) testing the complete (segmentation + regression) model. The flowcharts also highlight the steps connected to different sections of this article. Crack width prediction flowchart: (a) training segmentation model, (b) training regression model, and (c) predict crack width by combining segmentation and regression models. Note: we have shown Attention R2U-Net segmentation model and Random Forest as the regression model as an example here. However, when comparing the model performances, we change the segmentation and regression models.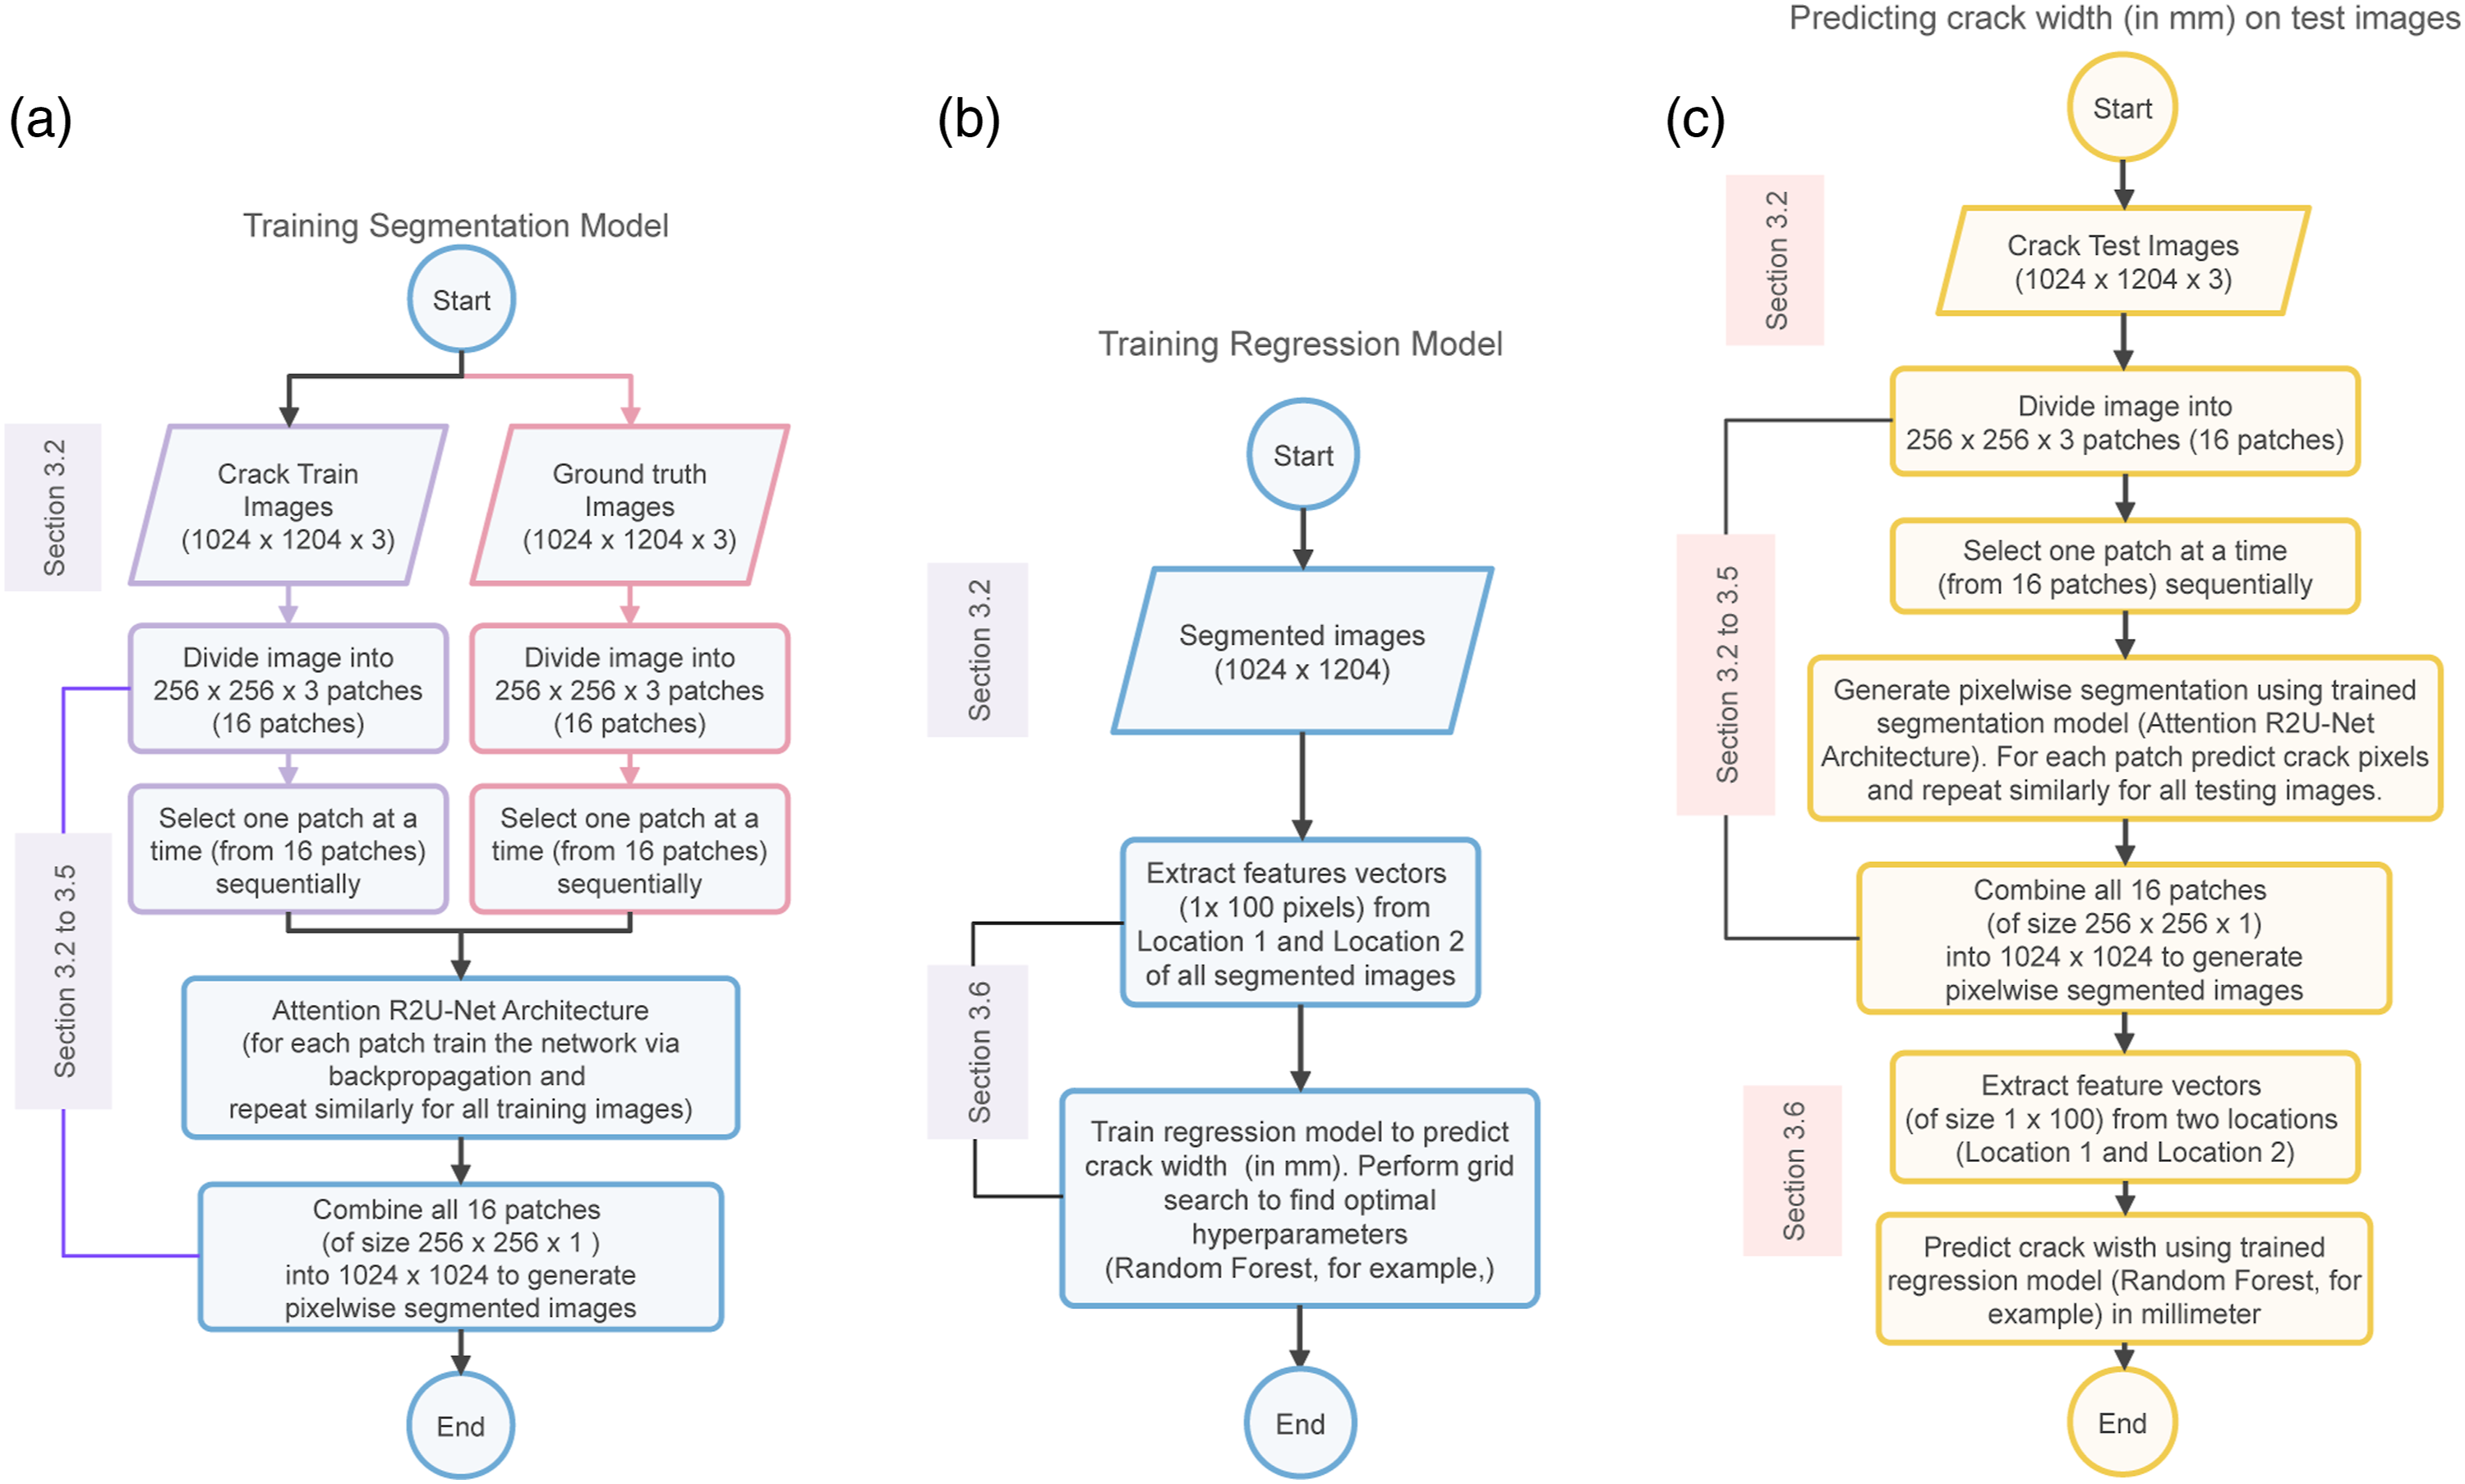
Attention R2U-Net Architecture for Crack Segmentation Map
Figure 2 shows the Attention R2U-Net architecture used for crack segmentation. It has two main paths: contracting and expansive. In the contracting path, we do a series of 3 × 3 convolutions, Rectified Linear Unit (ReLU) activations and 2 × 2 max-pooling operations with a stride (step) size of 2 (i.e., we are “down-sampling”). For each down-sampling operation, we double the number of channels. In contrast, the expansive path does the reverse of contraction path that is, contracting path incorporates “up-sampling” operation followed by 2 × 2 up-convolution (reduces feature channels by half), concatenating respective cropped feature maps from contracting path, and two 3 × 3 convolution operations each succeeded by ReLU activation. Here, the crop operations compensate for losing border pixels during convolution operations. At the end of the network, we have 1 × 1 convolution that maps 64-channel features into two-class (“crack” and “non-crack”) pixel-level segmentation map. In the up-sampling and down-sampling operations, we use Recurrent Residual (R2) convolutional unit as shown in Figure 2, where we pass a recurrent convolution network through a residual unit. In addition, we have Attention Gates (AG) that take gate signal from the layer below and concatenate feature maps through skip connections to enhance features at coarser and finer levels. We have designed our approach to use Attention R2U-Net on 256 × 256 for predicting pixel-level crack segmentation map. Therefore, a 1024 × 1024 × 3 size input image will have 16 number of 256 × 256 × 3 image patches. We feed each patch to the Attention R2U-Net to produce a 256 × 256 segmentation map and then combine these segmentation maps to form a segmentation map whose size equals the original image size. We show this procedure in Figure 2 and suggest readers to refer to
50,51
for further information about R2U-Net and Attention U-Net. Pixel-level crack detection based on Attention R2U-Net architecture in RGB images. Input images of size 1024 × 1024 are divided into 256 × 256 patches to create 16 such patches. Each patch is then used as input to Attention R2U-Net for training and testing to produce crack segmentation map. These 16 segmented patches are then combined into a single 1024 × 1024 image to produce the final crack segmentation map of the original image.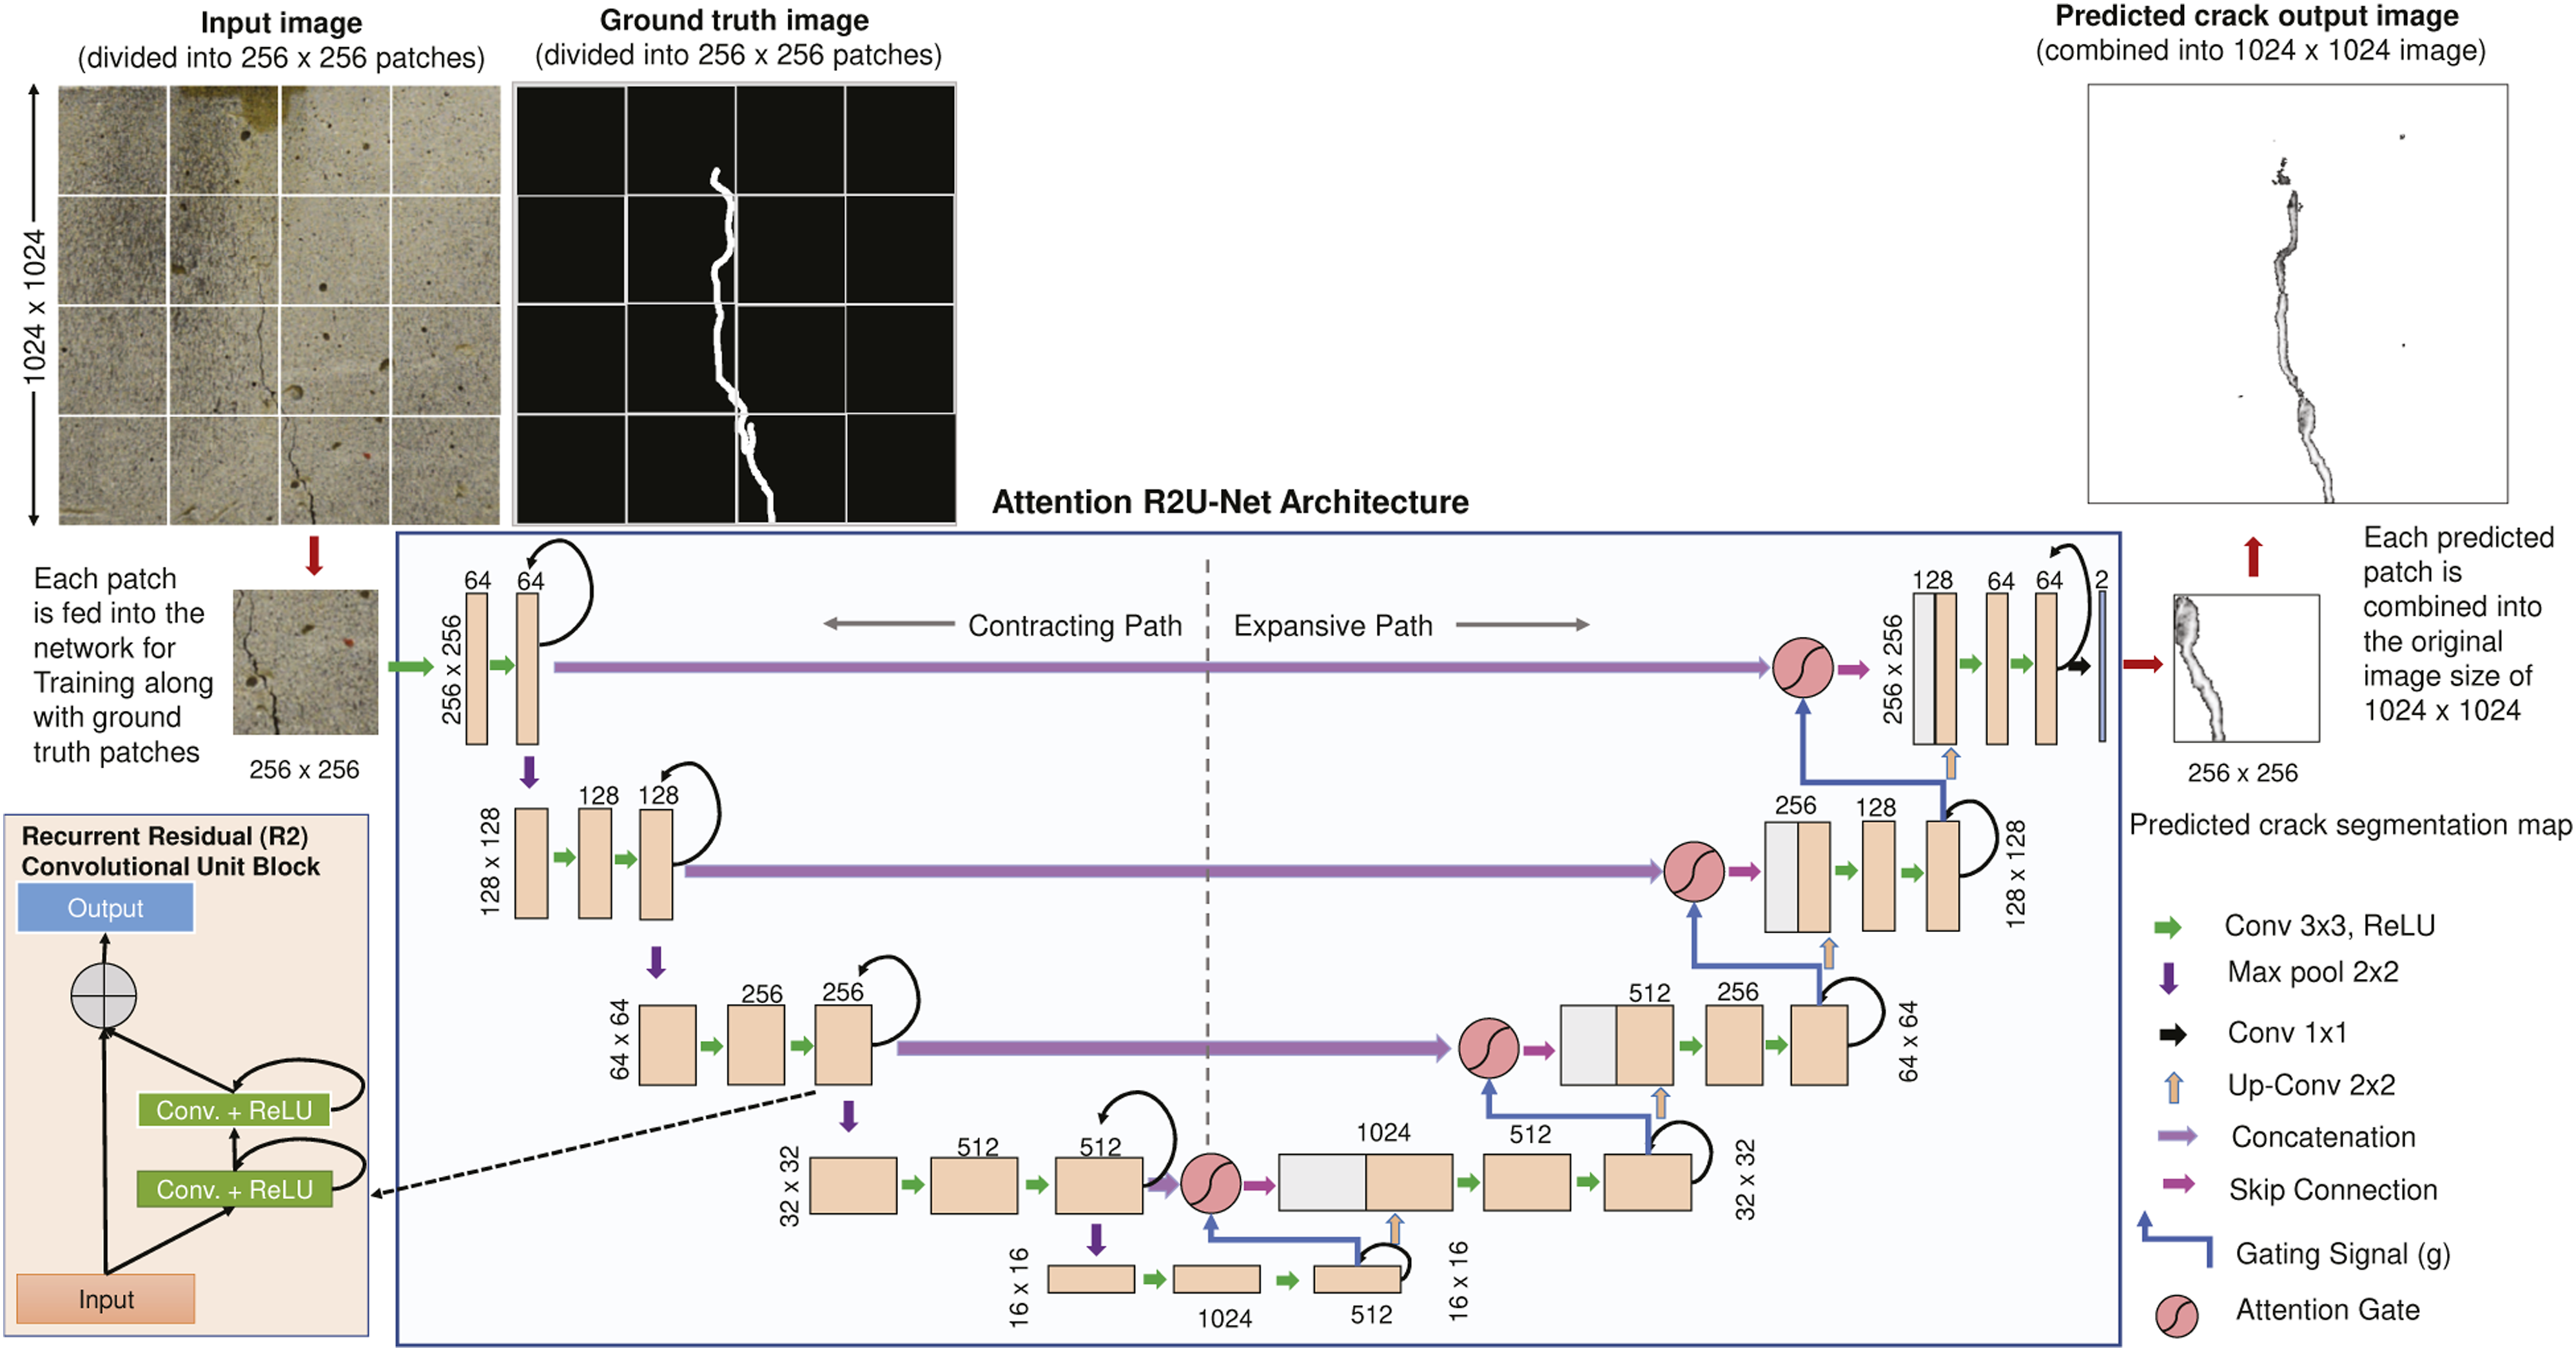
Training Attention R2U-Net
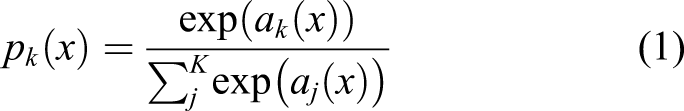
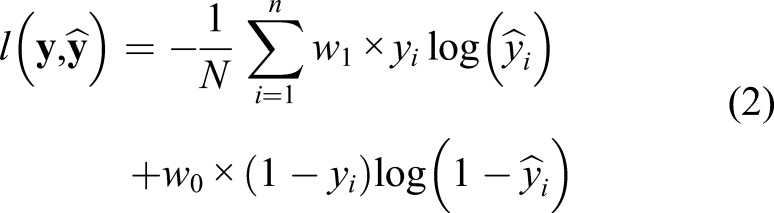
We train the input images along with their ground truth segmentation maps using Stochastic Gradient Descent (SGD) optimization algorithm to learn the Attention R2U-Net weight parameters. For training the network, we combine the soft-max function with binary cross entropy (BCE) loss function at the last layer. The soft-max function provides the probability of each pixel either belonging to crack or non-crack, given by
We can express the binary cross entropy (BCE) loss as
Crack width prediction: Attention R2U-Net + Random forest
Figure 3 shows the overview of our approach to predict crack width from Attention R2U-Net segmentation map and Random Forest regressor. To predict the width of the cracks, we extract feature vectors (1 × 100 pixels) containing segmentation map of cracks from Attention R2U-Net at two locations. During training, these feature vectors are used to map from segmentation output from Attention R2U-Net to crack width. In the testing phase, the feature vectors from test images provide the predicted crack width. The Random Forest Regressor
52
maps the segmentation map using feature vectors to generate crack widths. In our case, we use Random Forests to extract a random combination of features from n × 100 training features to generate n decision trees. Our approach constructs a decision tree based on the feature values and decides how best to predict the crack width. An individual decision tree alone is not sufficient, as it may lead to under- or over-training. Hence, Random Forests use a combination of decision trees to make several weak predictions. Then, the aggregated (averaged) weak predictions from individual trees predict a single continuous value, which in our case is the crack width. Crack width prediction (in millimeters) from crack segmentation map. The crack segmentation map produced by the Attention R2U-Net architecture is combined into 1024 × 1024 size, then 1 × 100 pixel values are extracted from two locations to be given as input to a Random Forest regressor for predicting the crack width. During training, 1 × 100 pixels from two locations from each training image are extracted and given as input with the actual (manually) measured width measured. In the testing phase, 1 × 100 pixels from any location can be given as input and the network will predict the crack width in millimetres.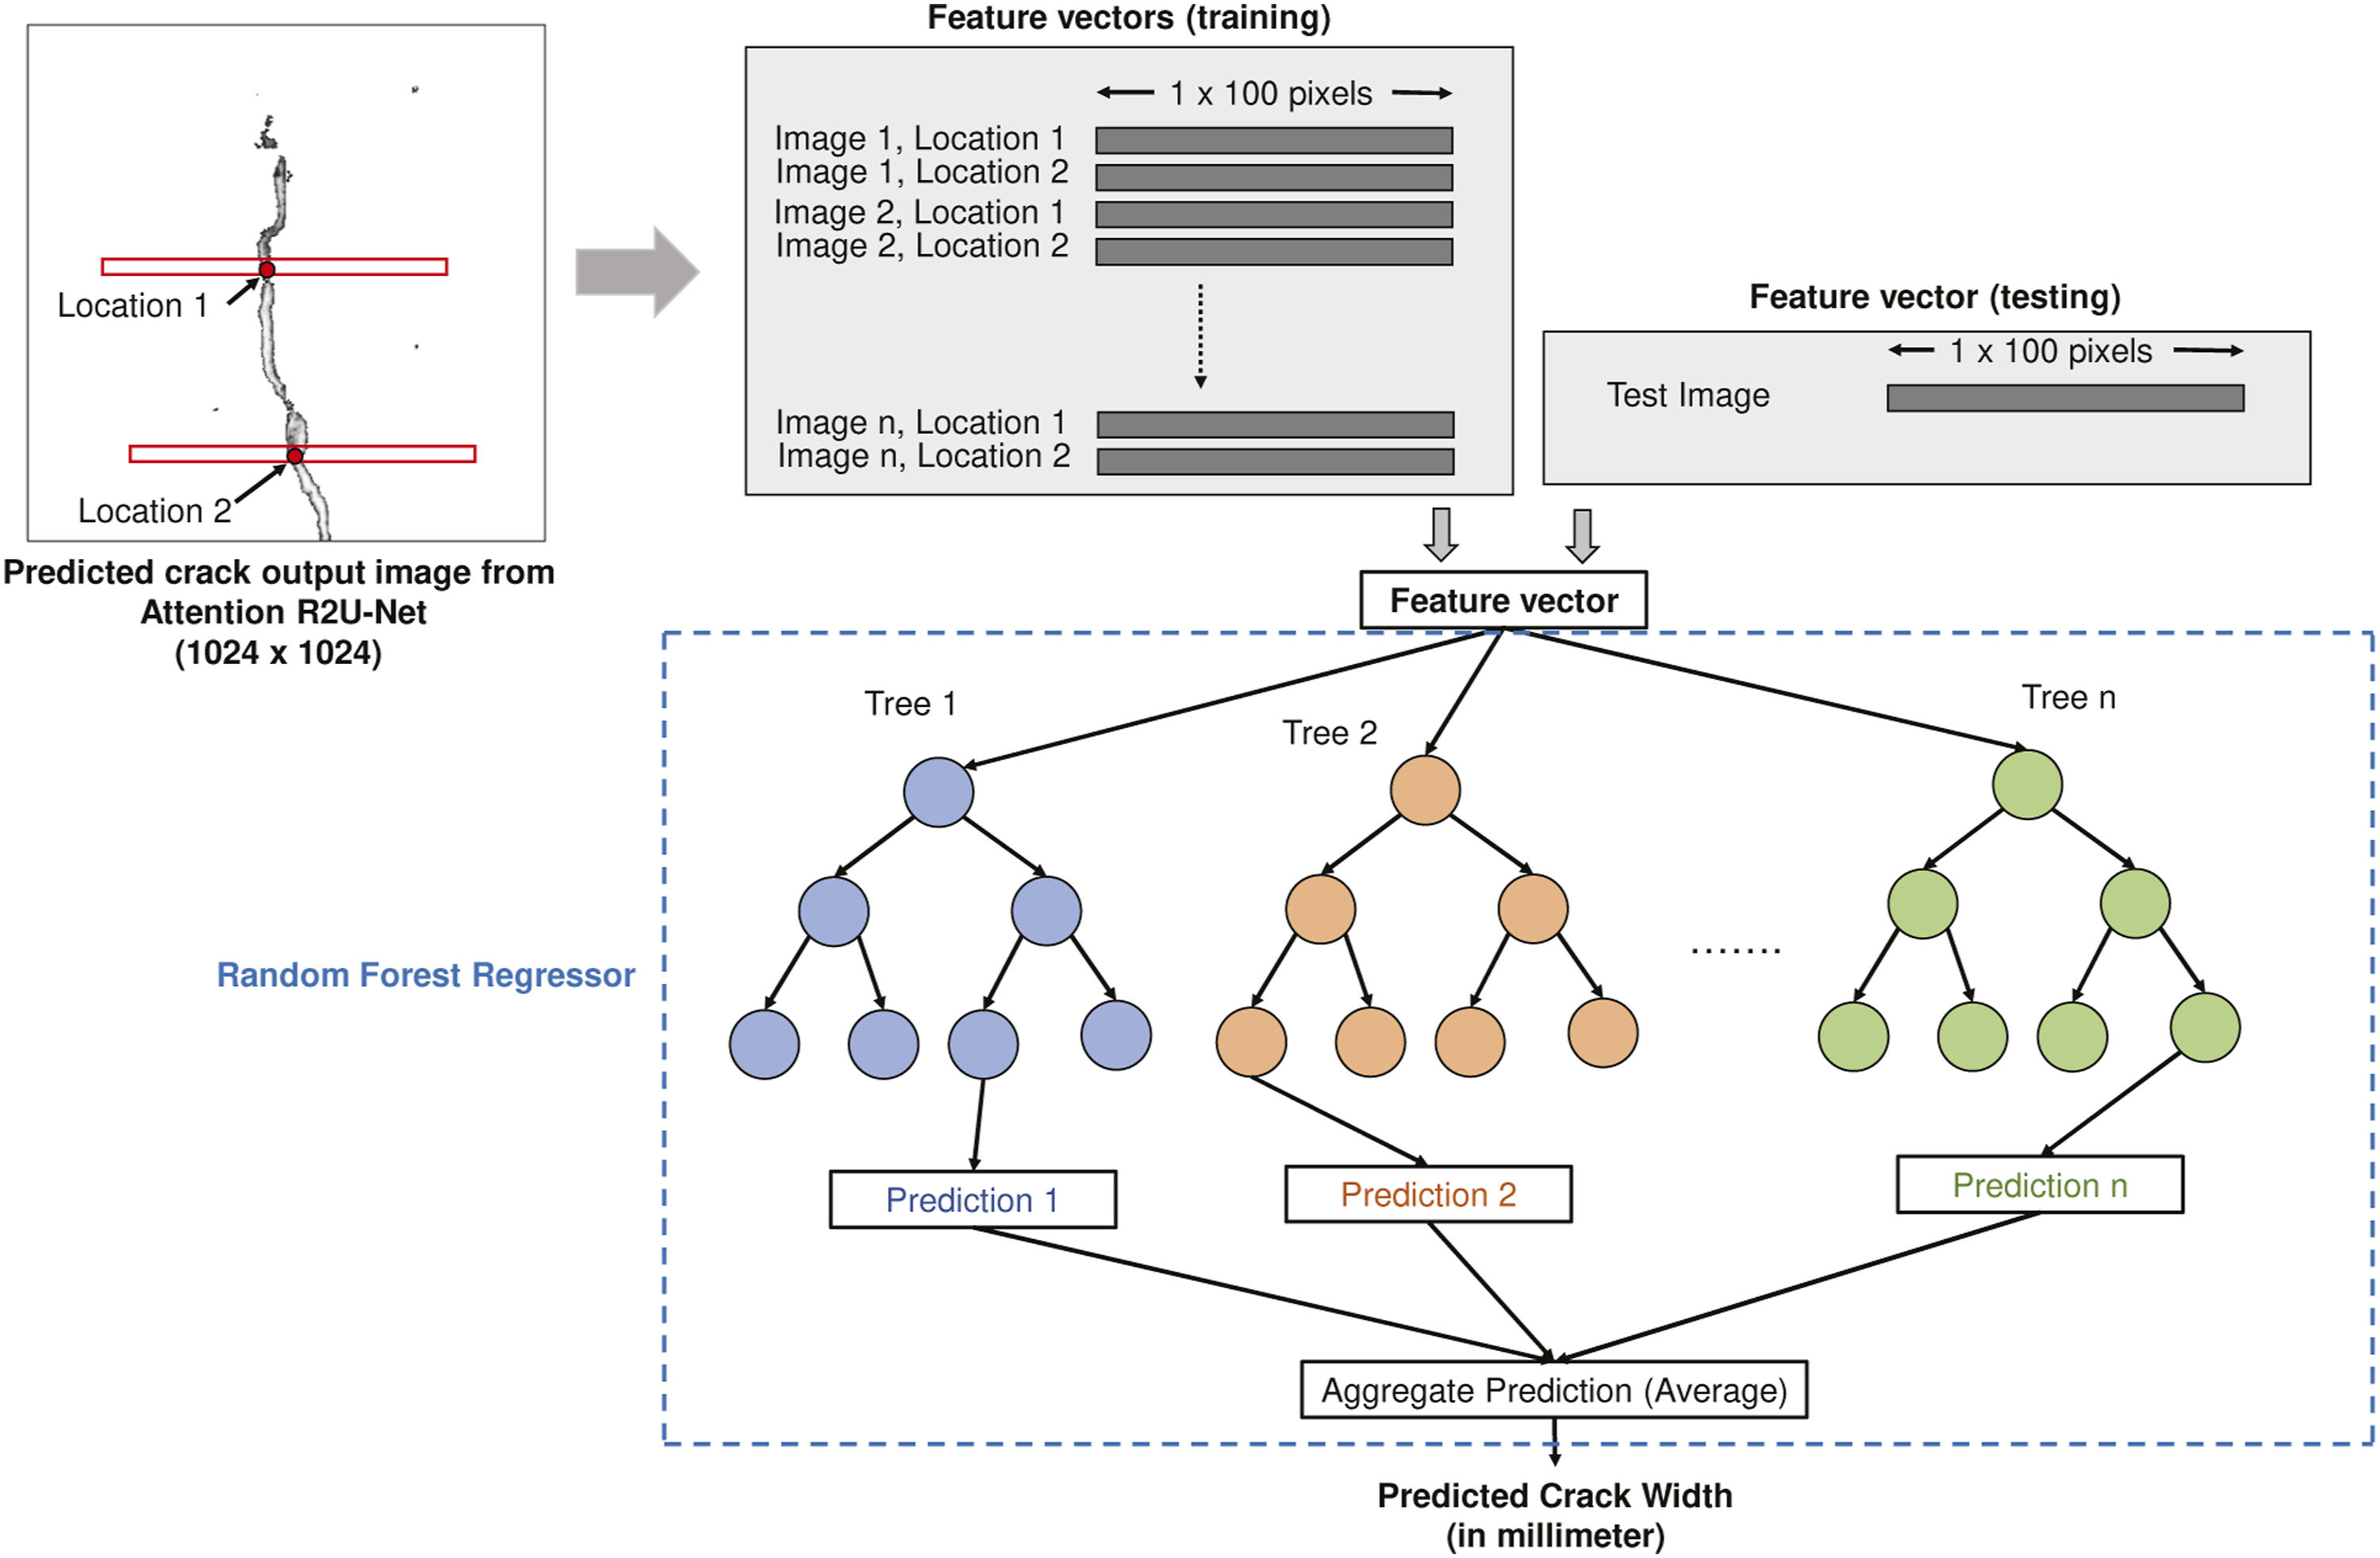
Experiment and evaluation
Model training and configuration
We implemented all the models using Python 3.6 and PyTorch 1.4 comprising Nvidia V100 Graphics Processing Unit (GPU) card with 16 GB graphics memory on Ubuntu 16.04 to train the models. To test the performance of the trained models, we used a laptop with 64-bit Ubuntu Operating System (OS), 16 GB RAM and eighth generation Intel® CoreTM i7-8550 CPU with a clock speed of 1.80 GHz.
Dataset and annotation
Details of the dataset used for training, validation, and testing the segmentation models. Details include the number of images and image sizes used from three different concrete beams (C1, C2, and C3) for training, validation, and testing.
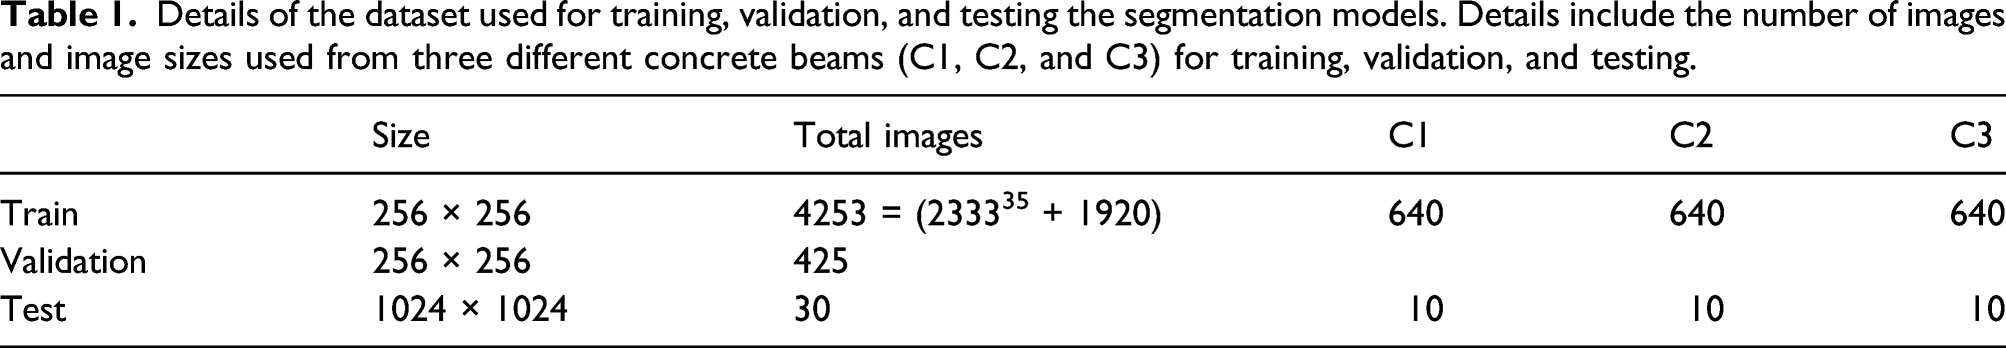
We annotated each pixel in the image as “crack” or “no crack” and other researchers can access via this link ∗ .
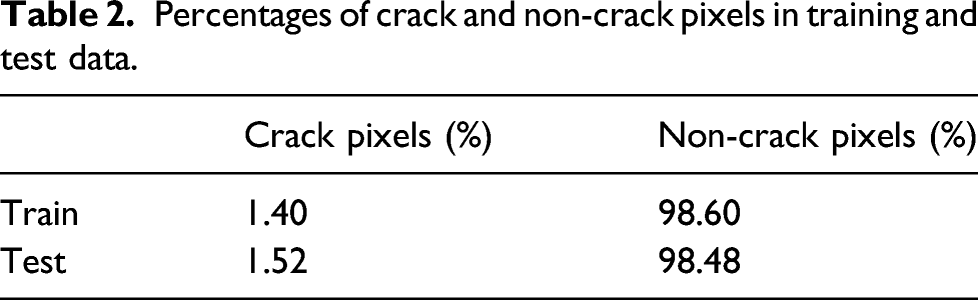
Handling data imbalance
Percentages of crack and non-crack pixels in training and test data.
Evaluation metrics
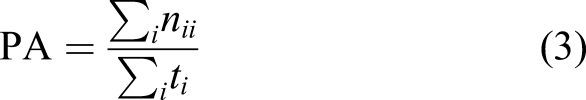
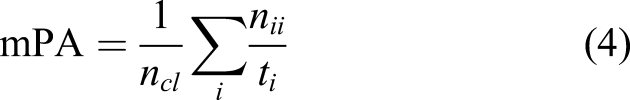
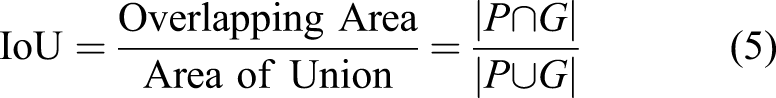
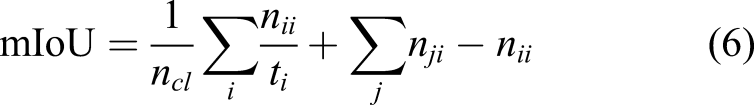
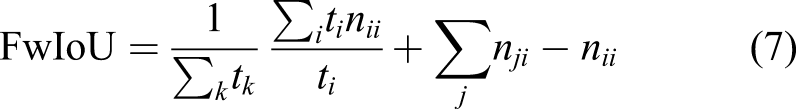
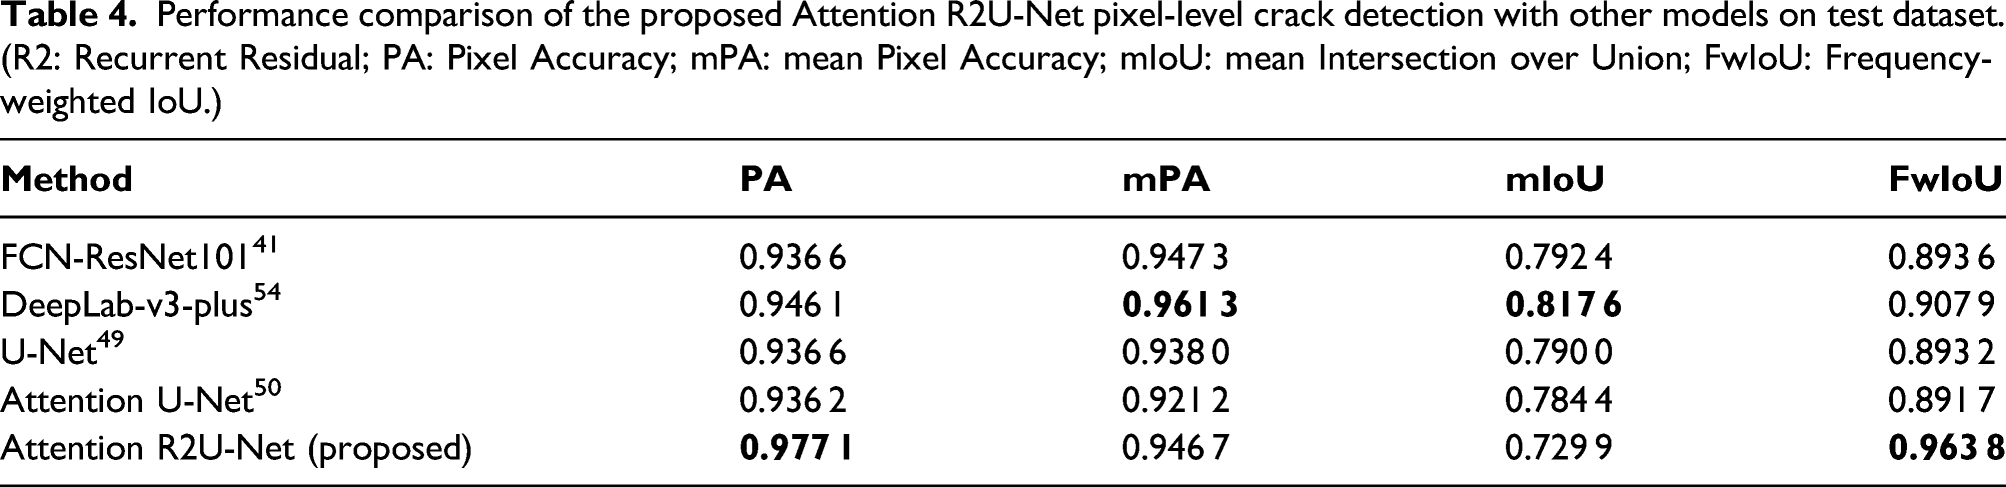
The most widely used metrics for evaluation of segmentation maps are: (i) pixel accuracy (PA), (ii) mean pixel accuracy (mPA), (iii) mean intersection over union (mIoU), and (iv) frequency-weighted intersection over union (FwIoU). 42 We use these metrics to quantify our results. In addition, Boundary F1 score (BF) provides an efficient metric to measure each individual segmentation structures within an image. 53 However, we are not using BF score to evaluate our results as it is more appropriate for contours with shapes, whereas it is not suitable to measure crack widths. In this work, we adopt the definitions of these metrics defined in 41 .
If we represent the number of classes as n
cl, the number of pixels n
ij
of class i predicted to be of class j, and t
i
= ∑
j
n
ij
being the total number of pixels of class i, then we can compute: • Pixel accuracy (PA) as the number of correctly identified pixel for each class • Mean pixel accuracy (mPA) as the average accuracy over all classes • Intersection over Union (IoU) measuring the amount of predicted overlapping pixels with respect to ground truth pixels • Mean IoU (mIoU) as the average IoU over all classes • Frequency-weighted intersection over union (FwIoU) extending mIoU with weights assigned based on frequency of each class
Training and validation of pixel-level segmentation models
In this work, we use the BCE loss function in (2) as the primary training optimization objective and allow ±2 pixel tolerance for validating the models. We use Stochastic Gradient Descent (SGD) with step learning decay of 25 epochs, and learning rate decay (γ) of 0.1. During training, all the layers in the model were allowed to update gradients, and we have used 50 epochs with a mini-batch size of 4, 8, 16, or 32 (depending on how much GPU memory is available for each model before starting the training). In this work, we consider the best models based on how each model performs on validation dataset.
Training and validation of regression models prediction
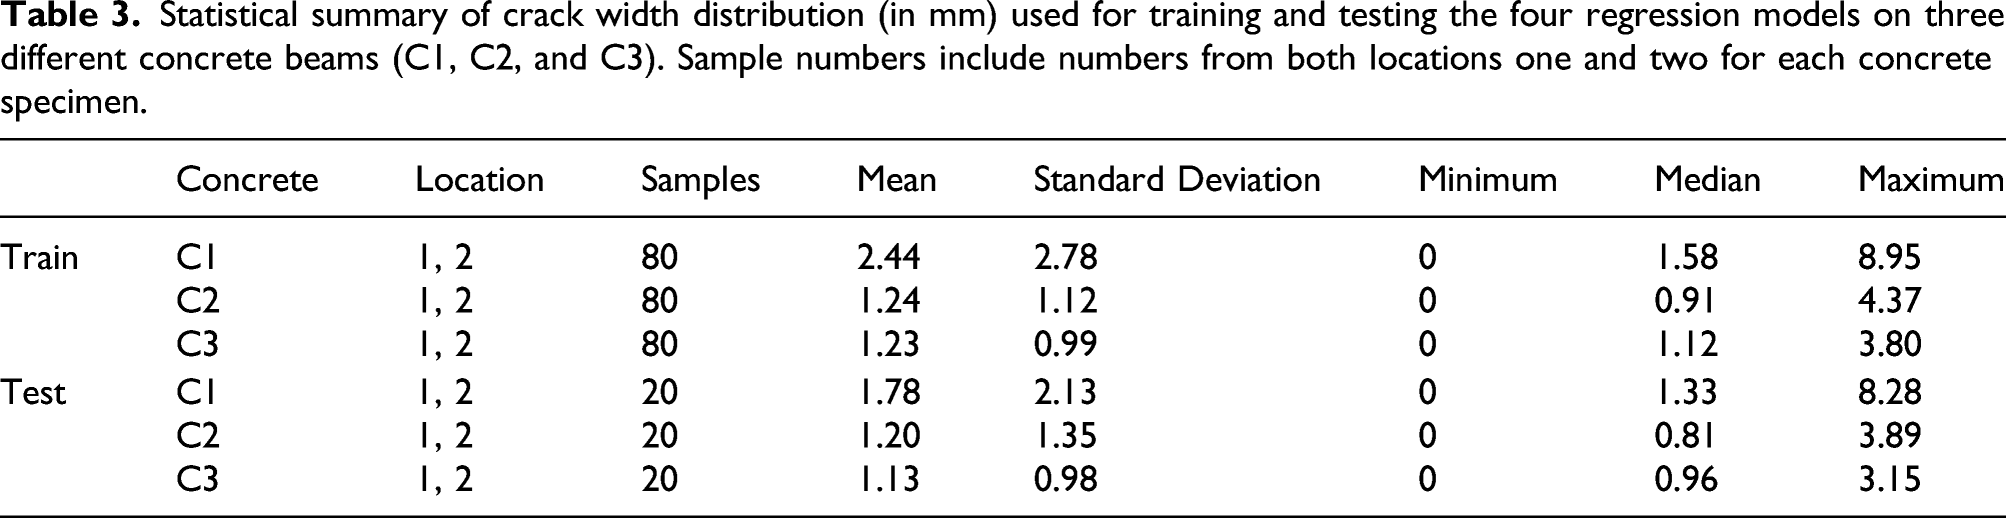
Statistical summary of crack width distribution (in mm) used for training and testing the four regression models on three different concrete beams (C1, C2, and C3). Sample numbers include numbers from both locations one and two for each concrete specimen.
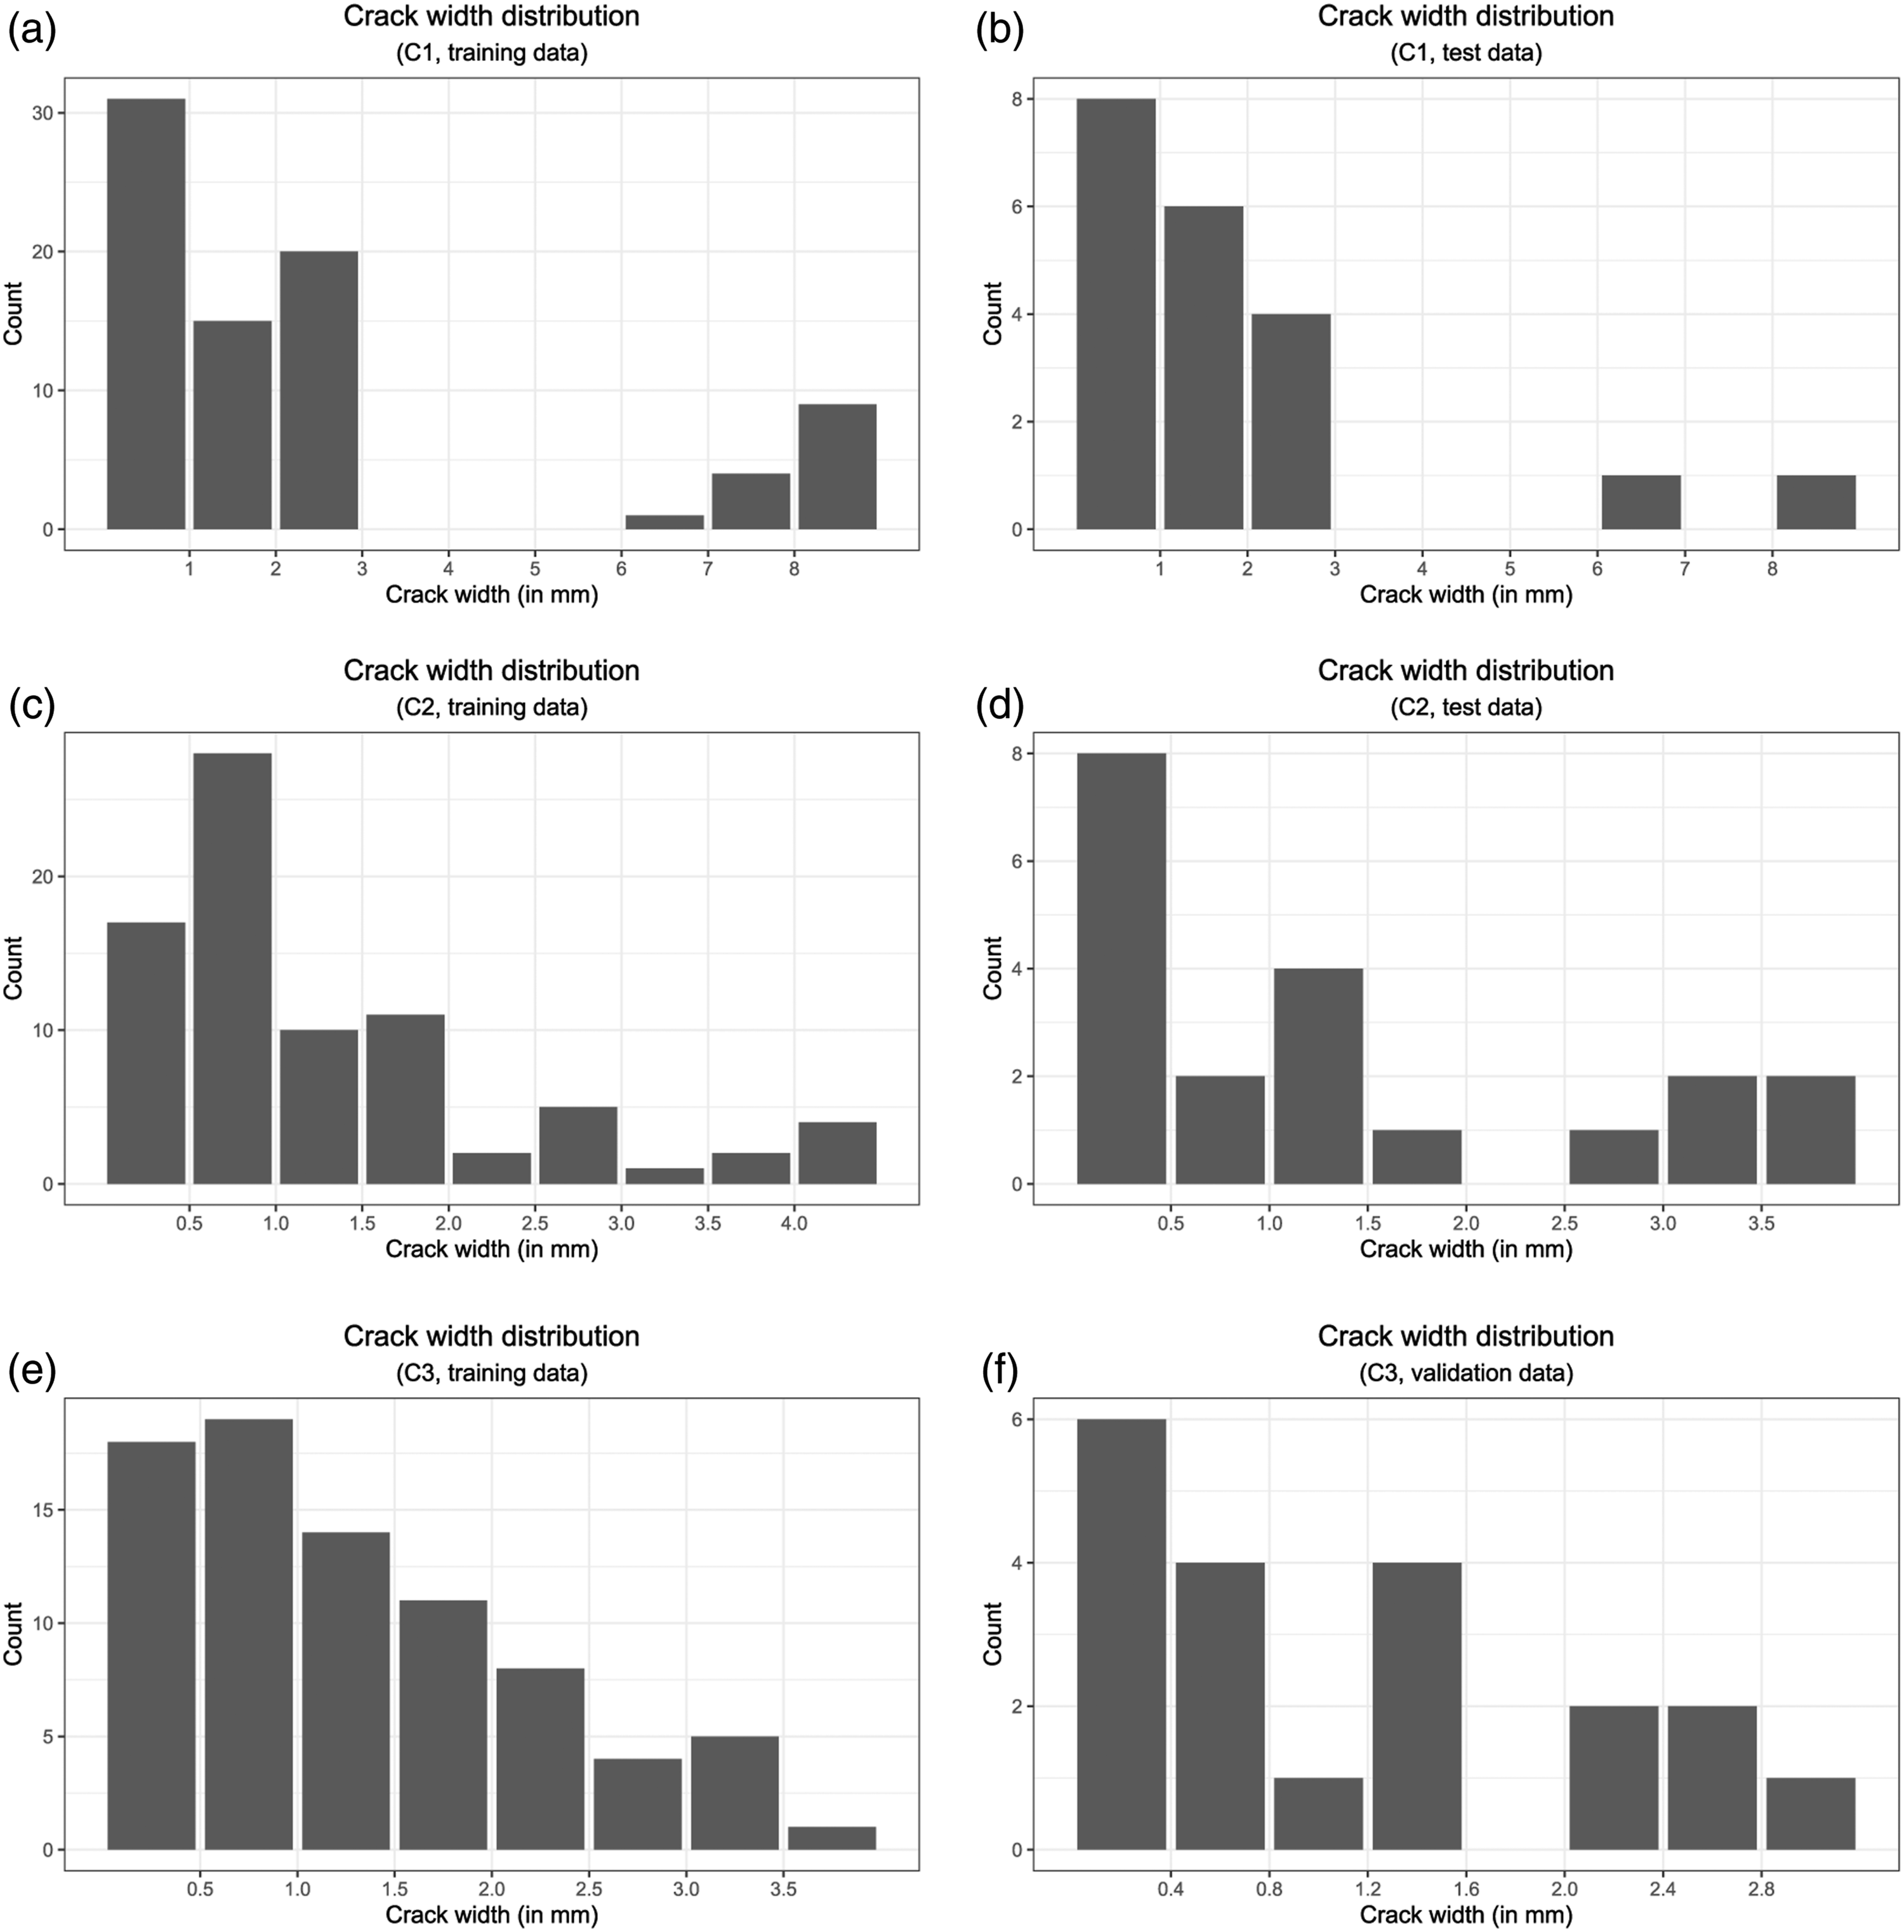
Crack width distribution used for training and validating regression models to predict crack width for three concrete surfaces (C1, C2, and C3).
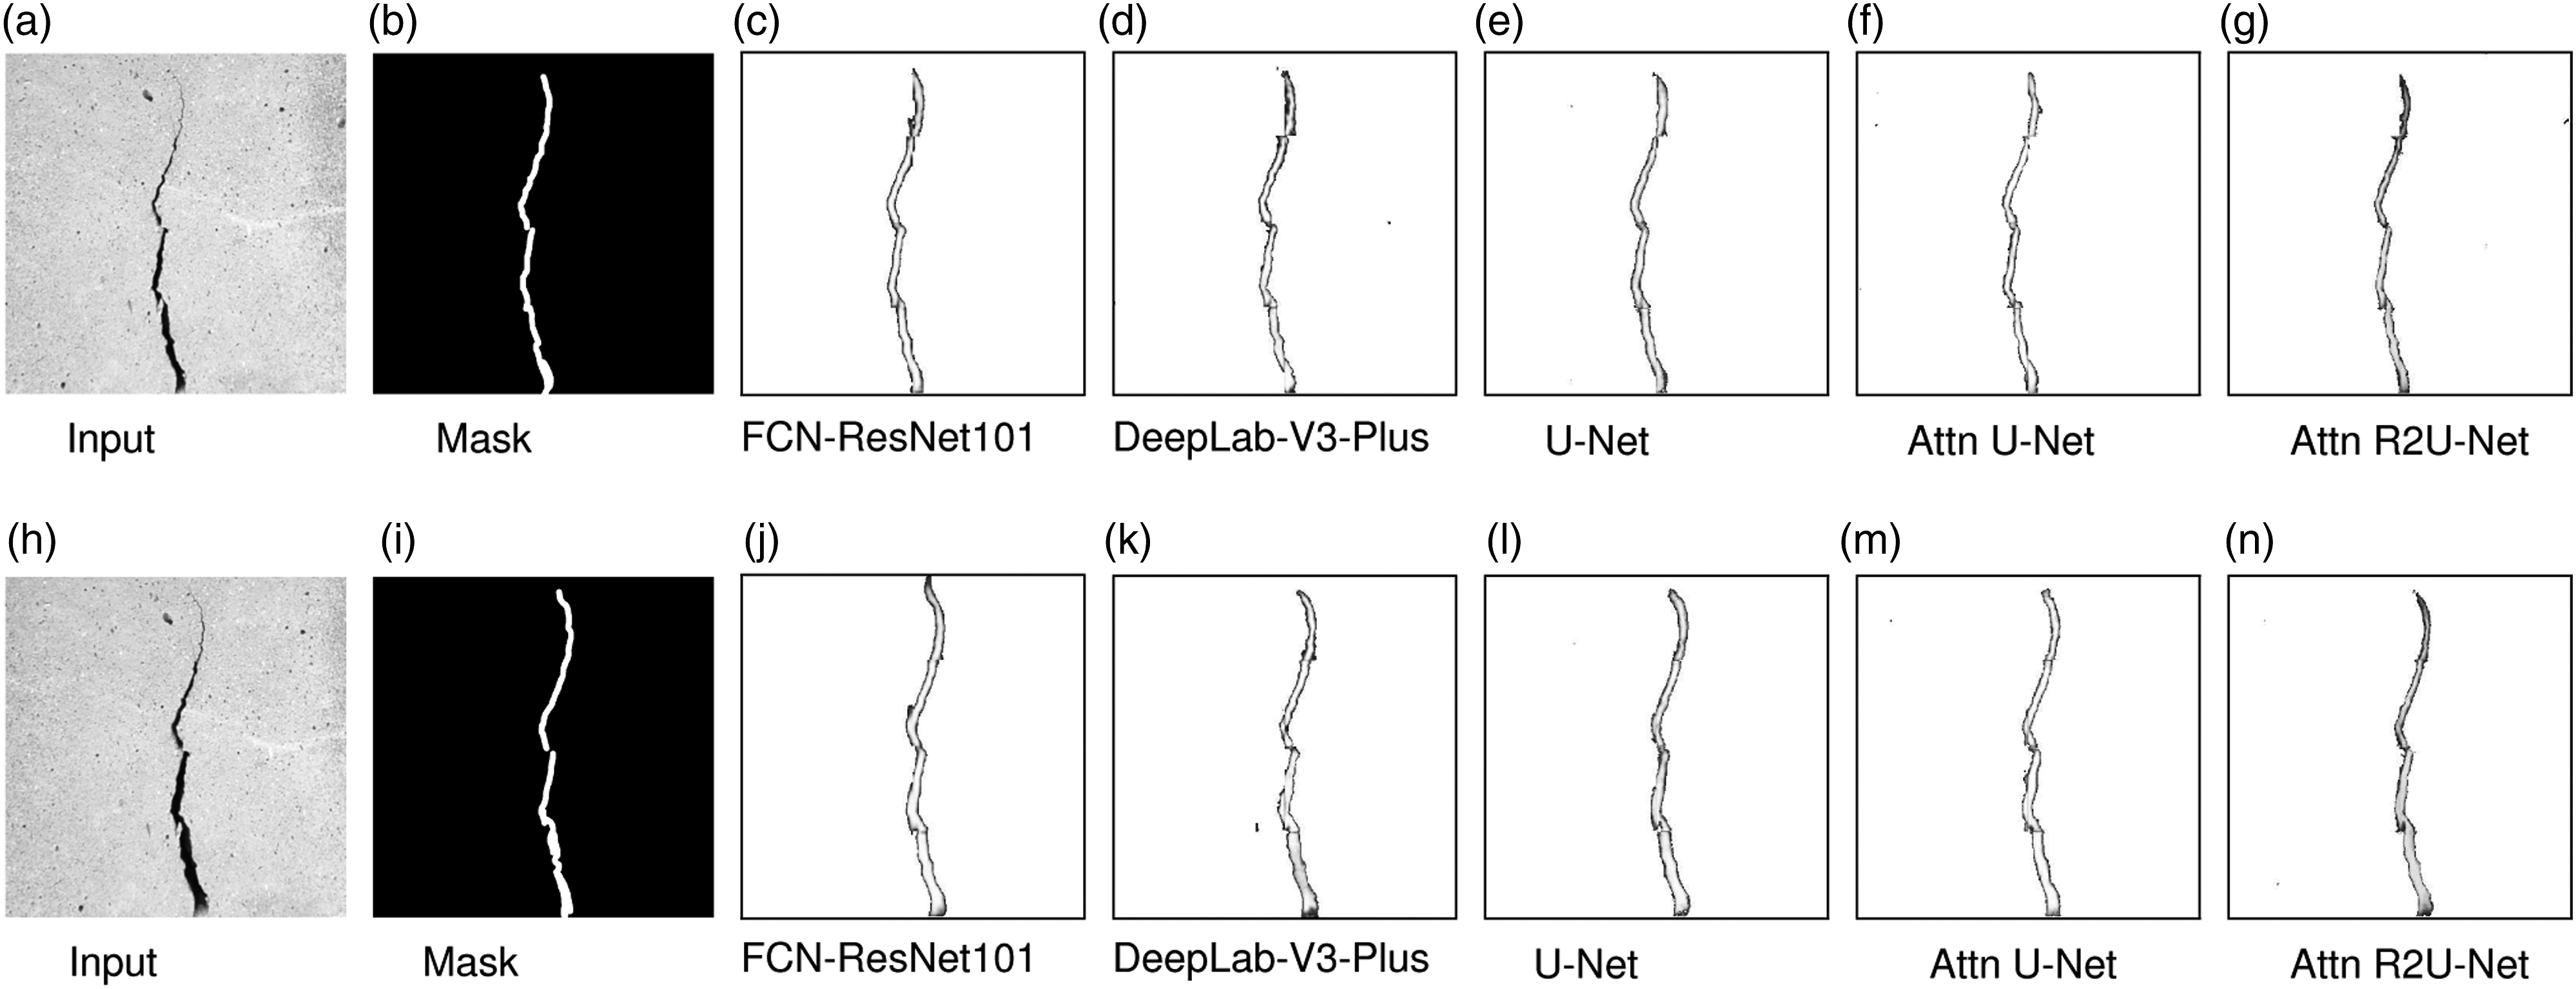
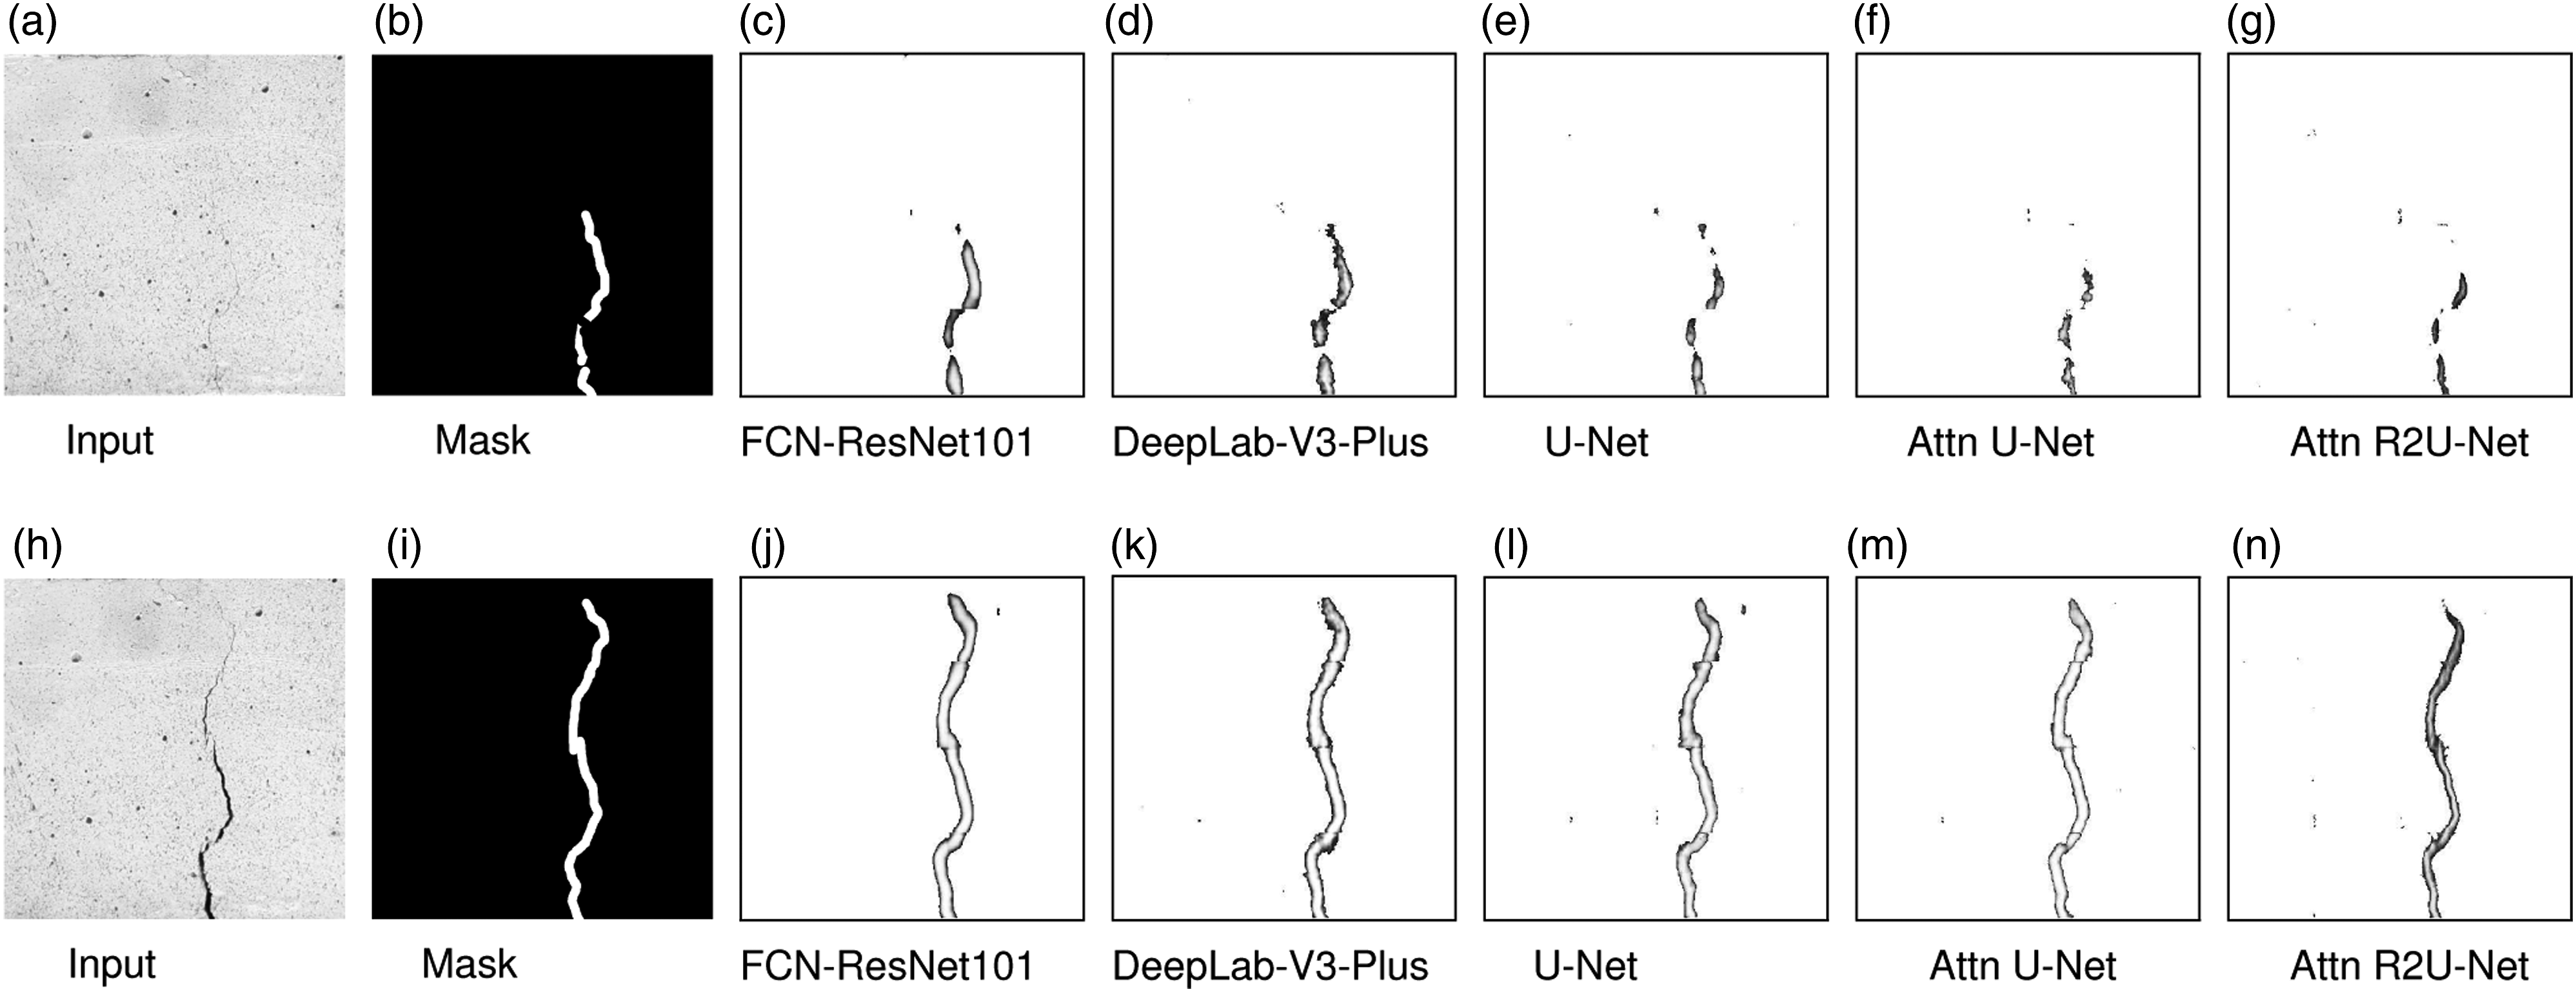
Comparison of segmentation results
Figures 5, 6, and 7 show the sample segmentation output of U-Net, Attention R2U-Net and other segmentation models for the three concrete surfaces (C1, C2, and C3). We notice that the three concrete specimen (C1, C2, and C3) have different textures and hence the prediction results will be different. This provides us with an opportunity to generalize our models for crack detection. We compare our Attention R2U-Net results with other state-of-the-art segmentation architectures, such as Attention U-Net,
50
Recurrent Residual U-Net,
51
FCN-ResNet101,
41
and DeepLab-v3-Plus.
54
Comparison of pixel-level segmentation results for concrete specimen C1 for two different test images [(a): IMG_0008 and (h): IMG_0035]. Mask in the ground truth. Attention R2U-Net also detects small holes present in the images. Comparison of pixel-level segmentation results for concrete specimen C2 for two different test images [(a): IMG_0026 and (h) IMG_0037]. Mask in the ground truth. Comparison of pixel-level segmentation results for concrete specimen C3 for two different test images [(a): IMG_0001 and (h): IMG_0017]. Mask in the ground truth.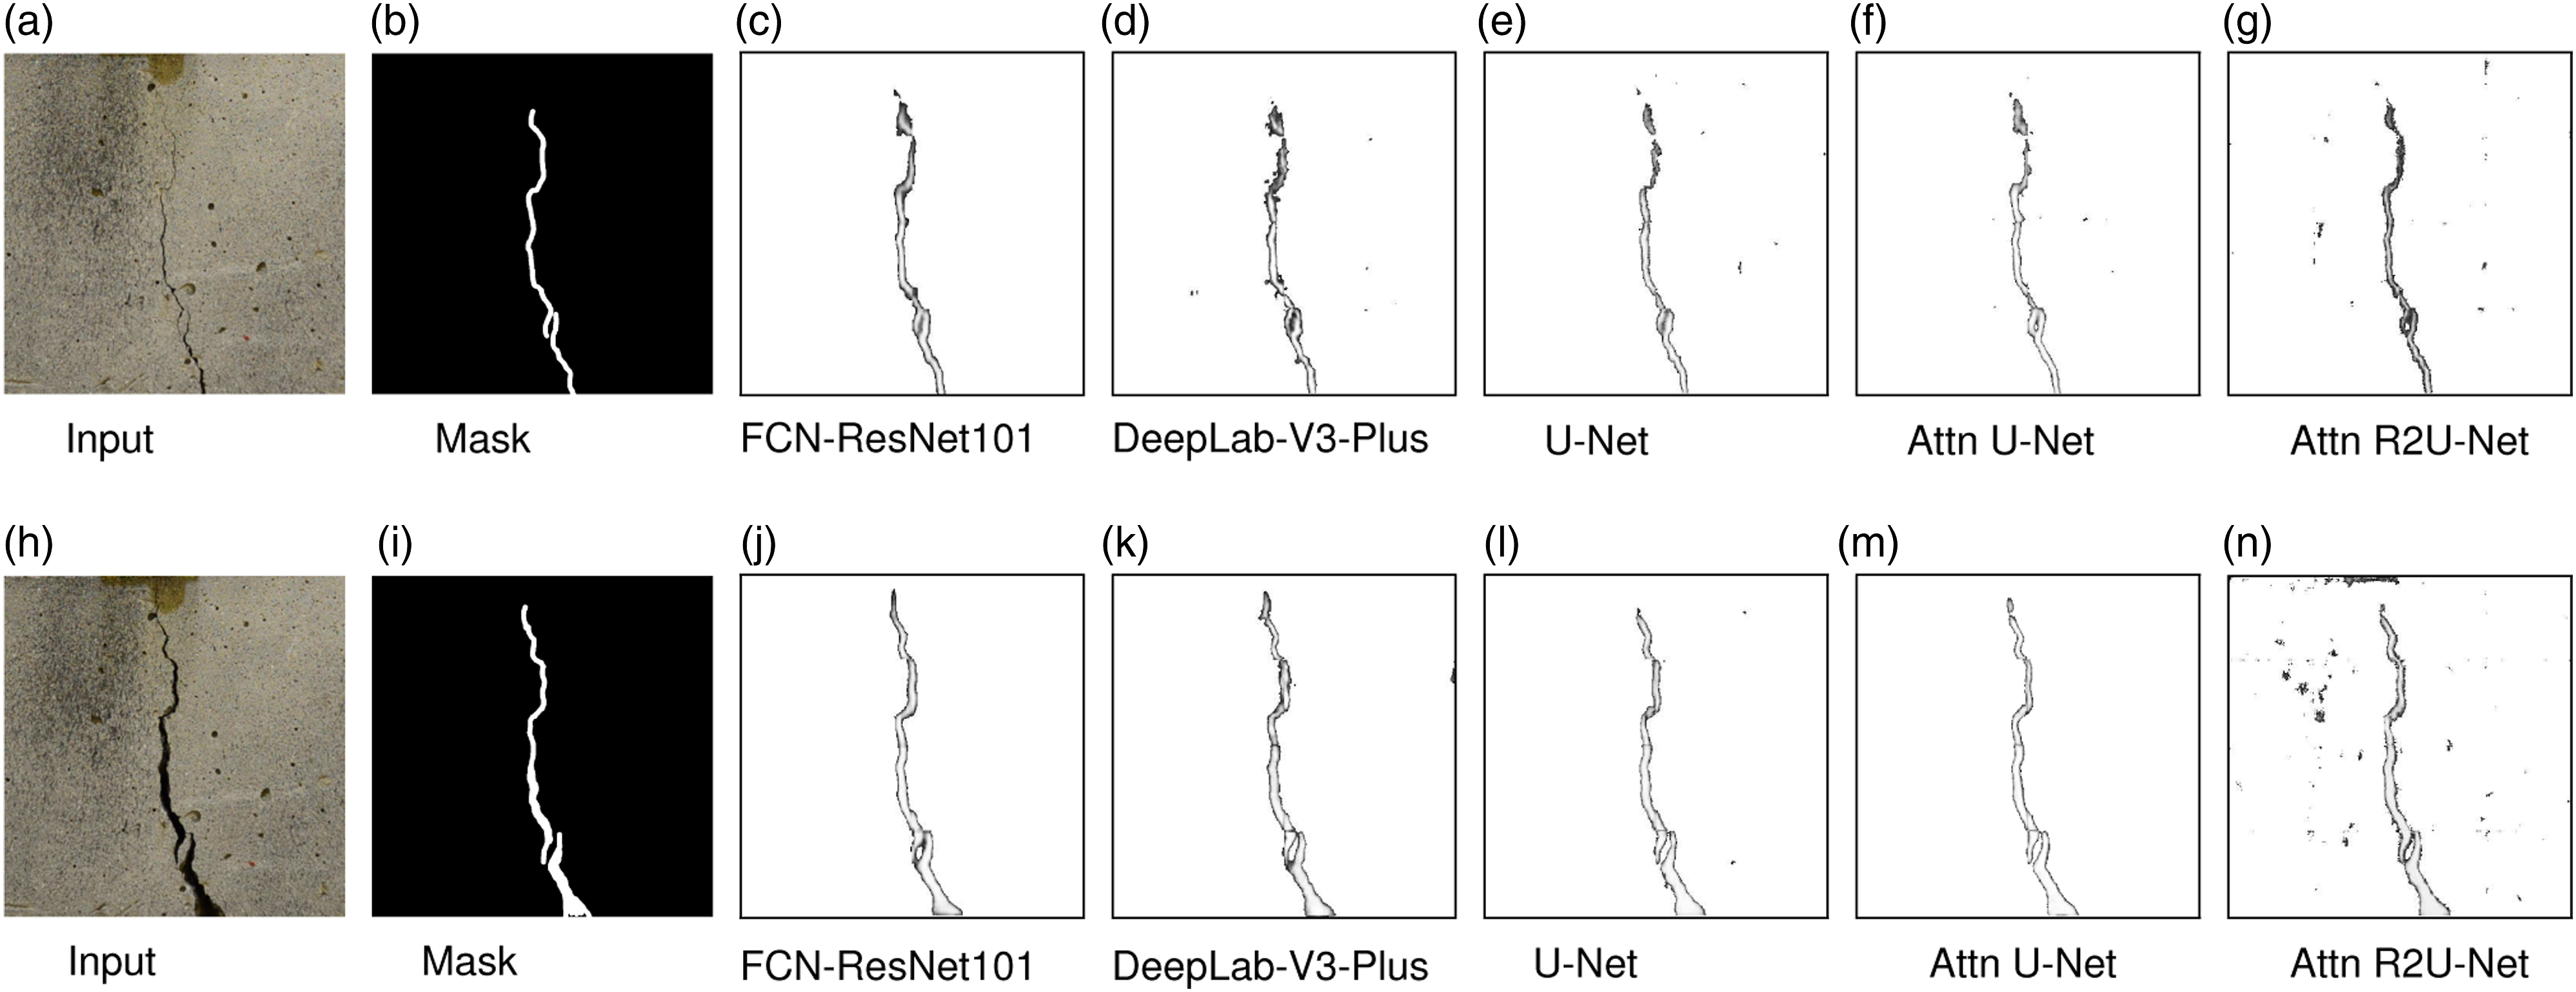
Performance comparison of the proposed Attention R2U-Net pixel-level crack detection with other models on test dataset. (R2: Recurrent Residual; PA: Pixel Accuracy; mPA: mean Pixel Accuracy; mIoU: mean Intersection over Union; FwIoU: Frequency-weighted IoU.)
Comparison of crack width prediction
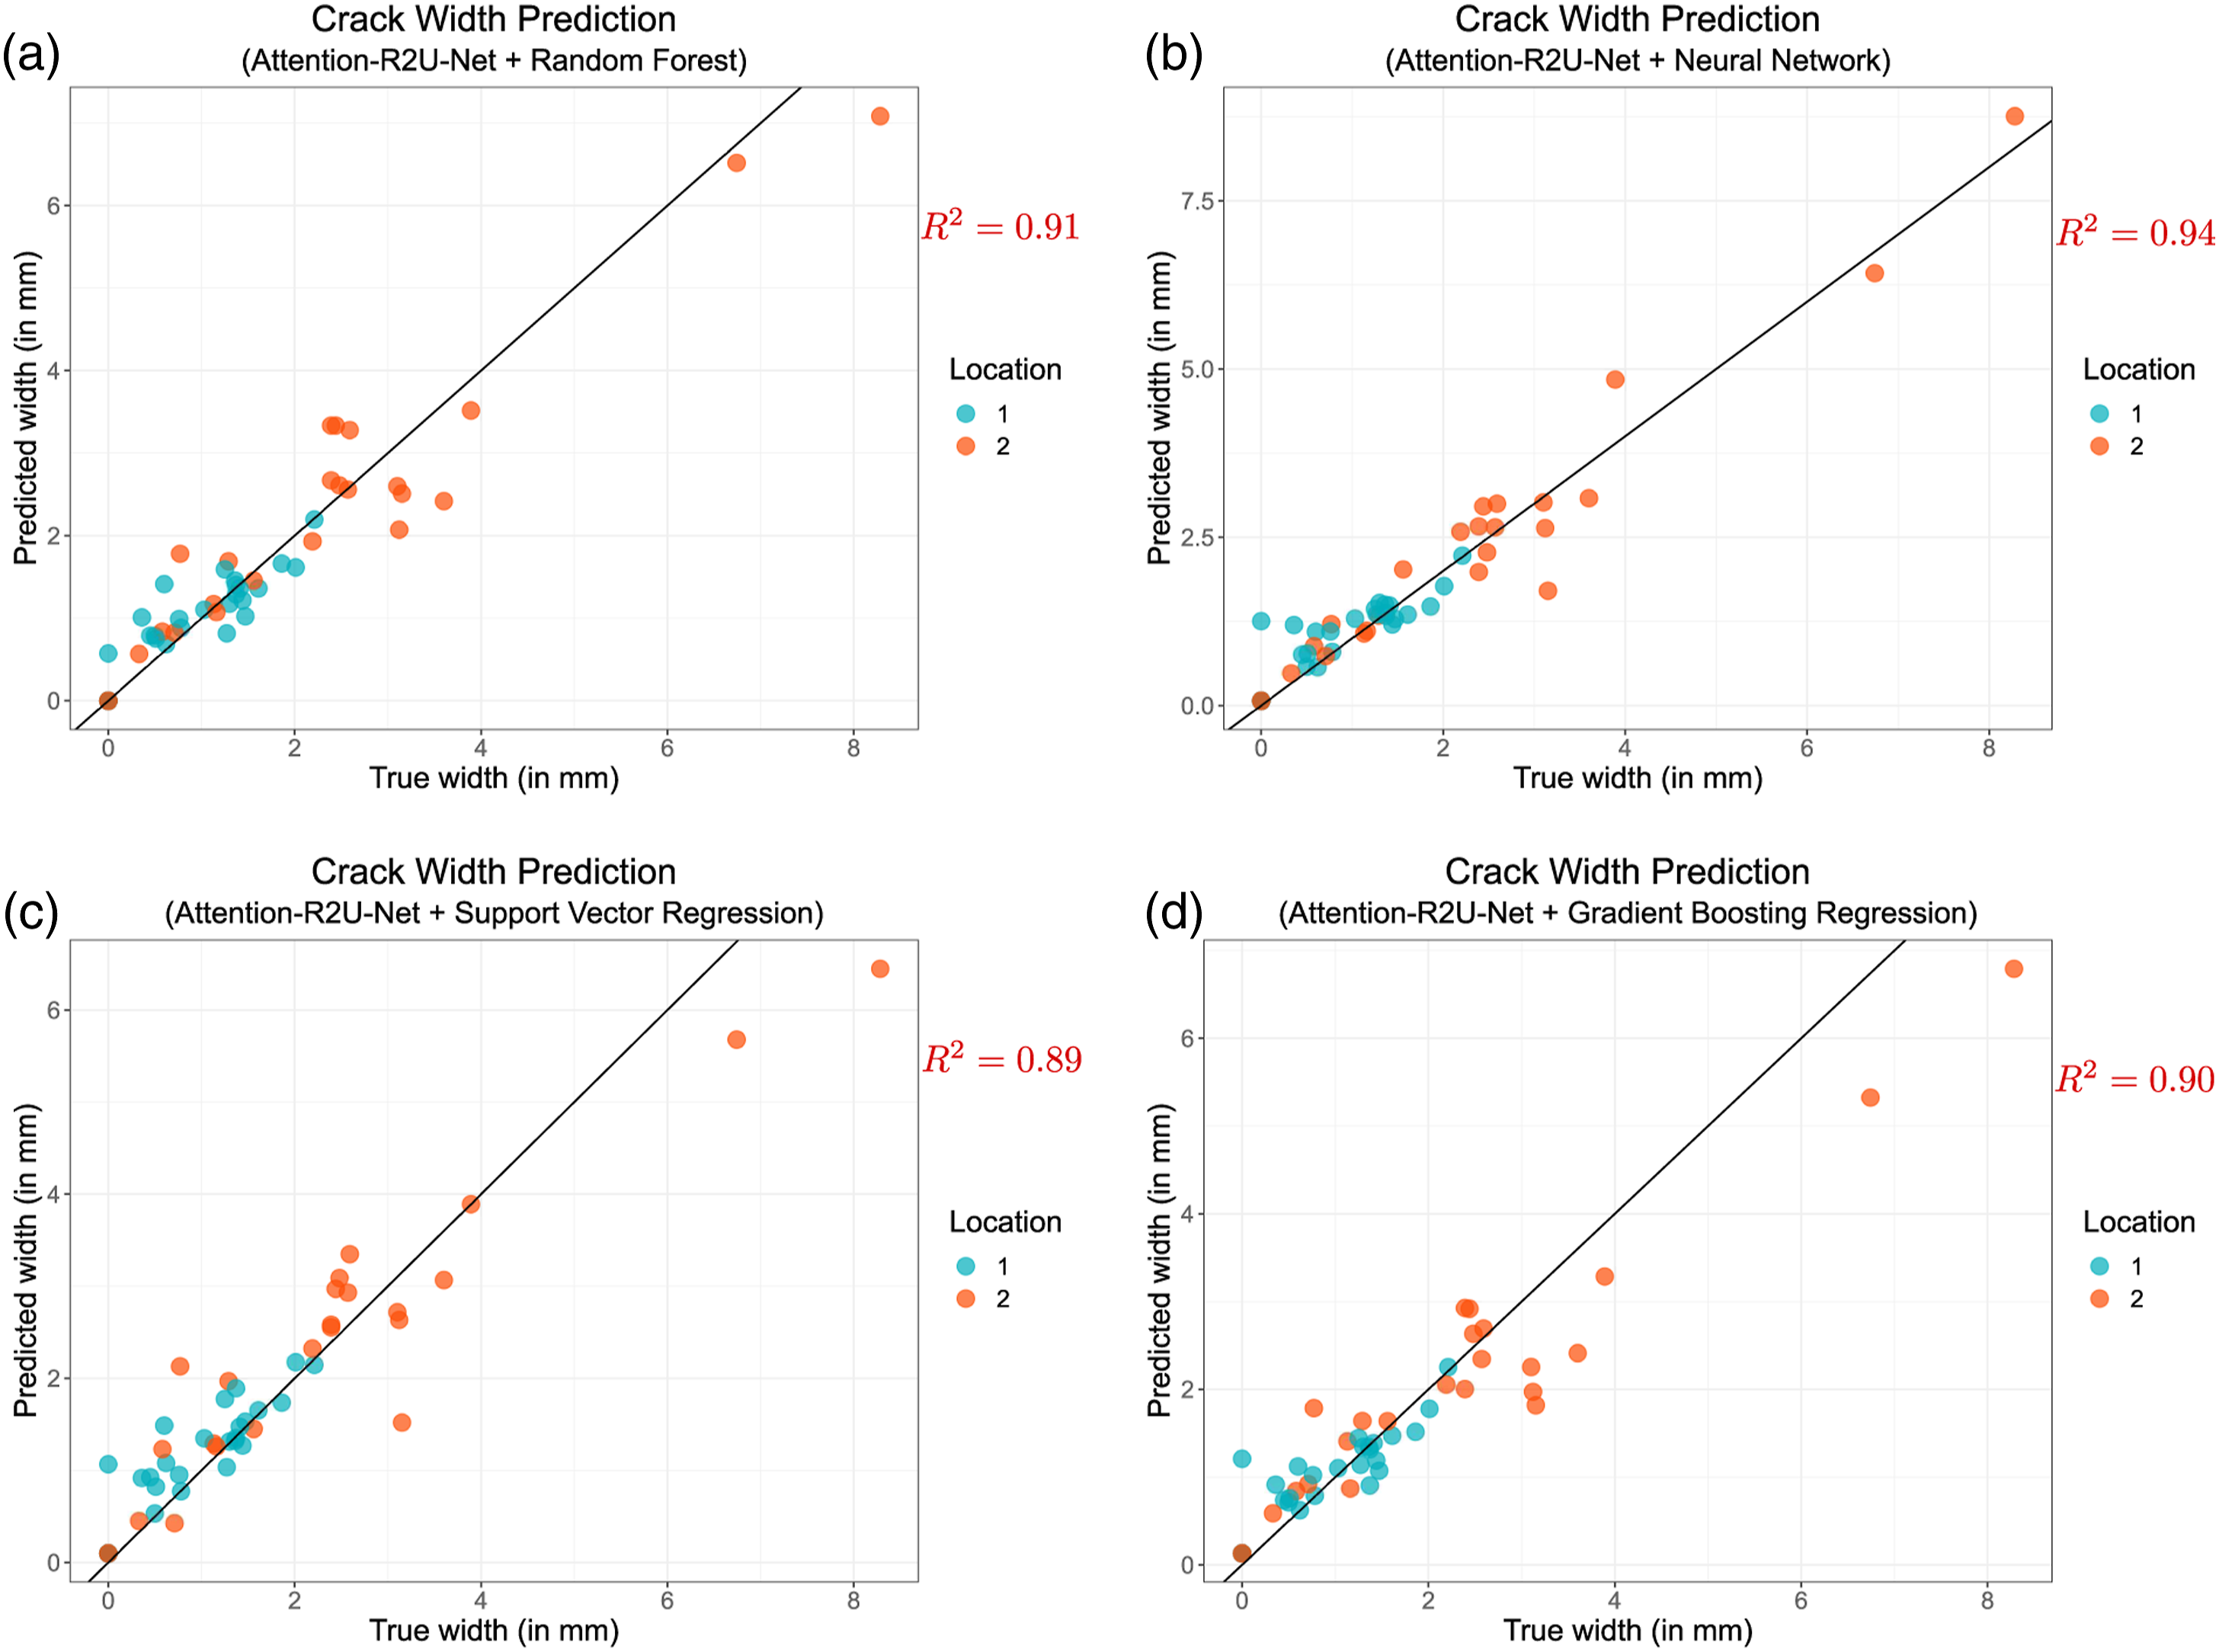
Comparison of crack width prediction models (segmentation combined with regression). Comparison includes five segmentation models in combination with four regression models. We use Mean-Squared Error (MSE), Root Mean-Squared Error (RMSE), R-Squared (R 2, coefficient of determination) and Absolute Maximum Error (AME) to evaluate the models. Attention R2U-Net segmentation with Neural Network regression model provides the lowest absolute maximum error. (RF: Random Forest; NN: Neural Network; SVR: Support Vector Regression; GBR: Gradient Boosting Regression; XGBR: Extreme Gradient Boosting Regression.)
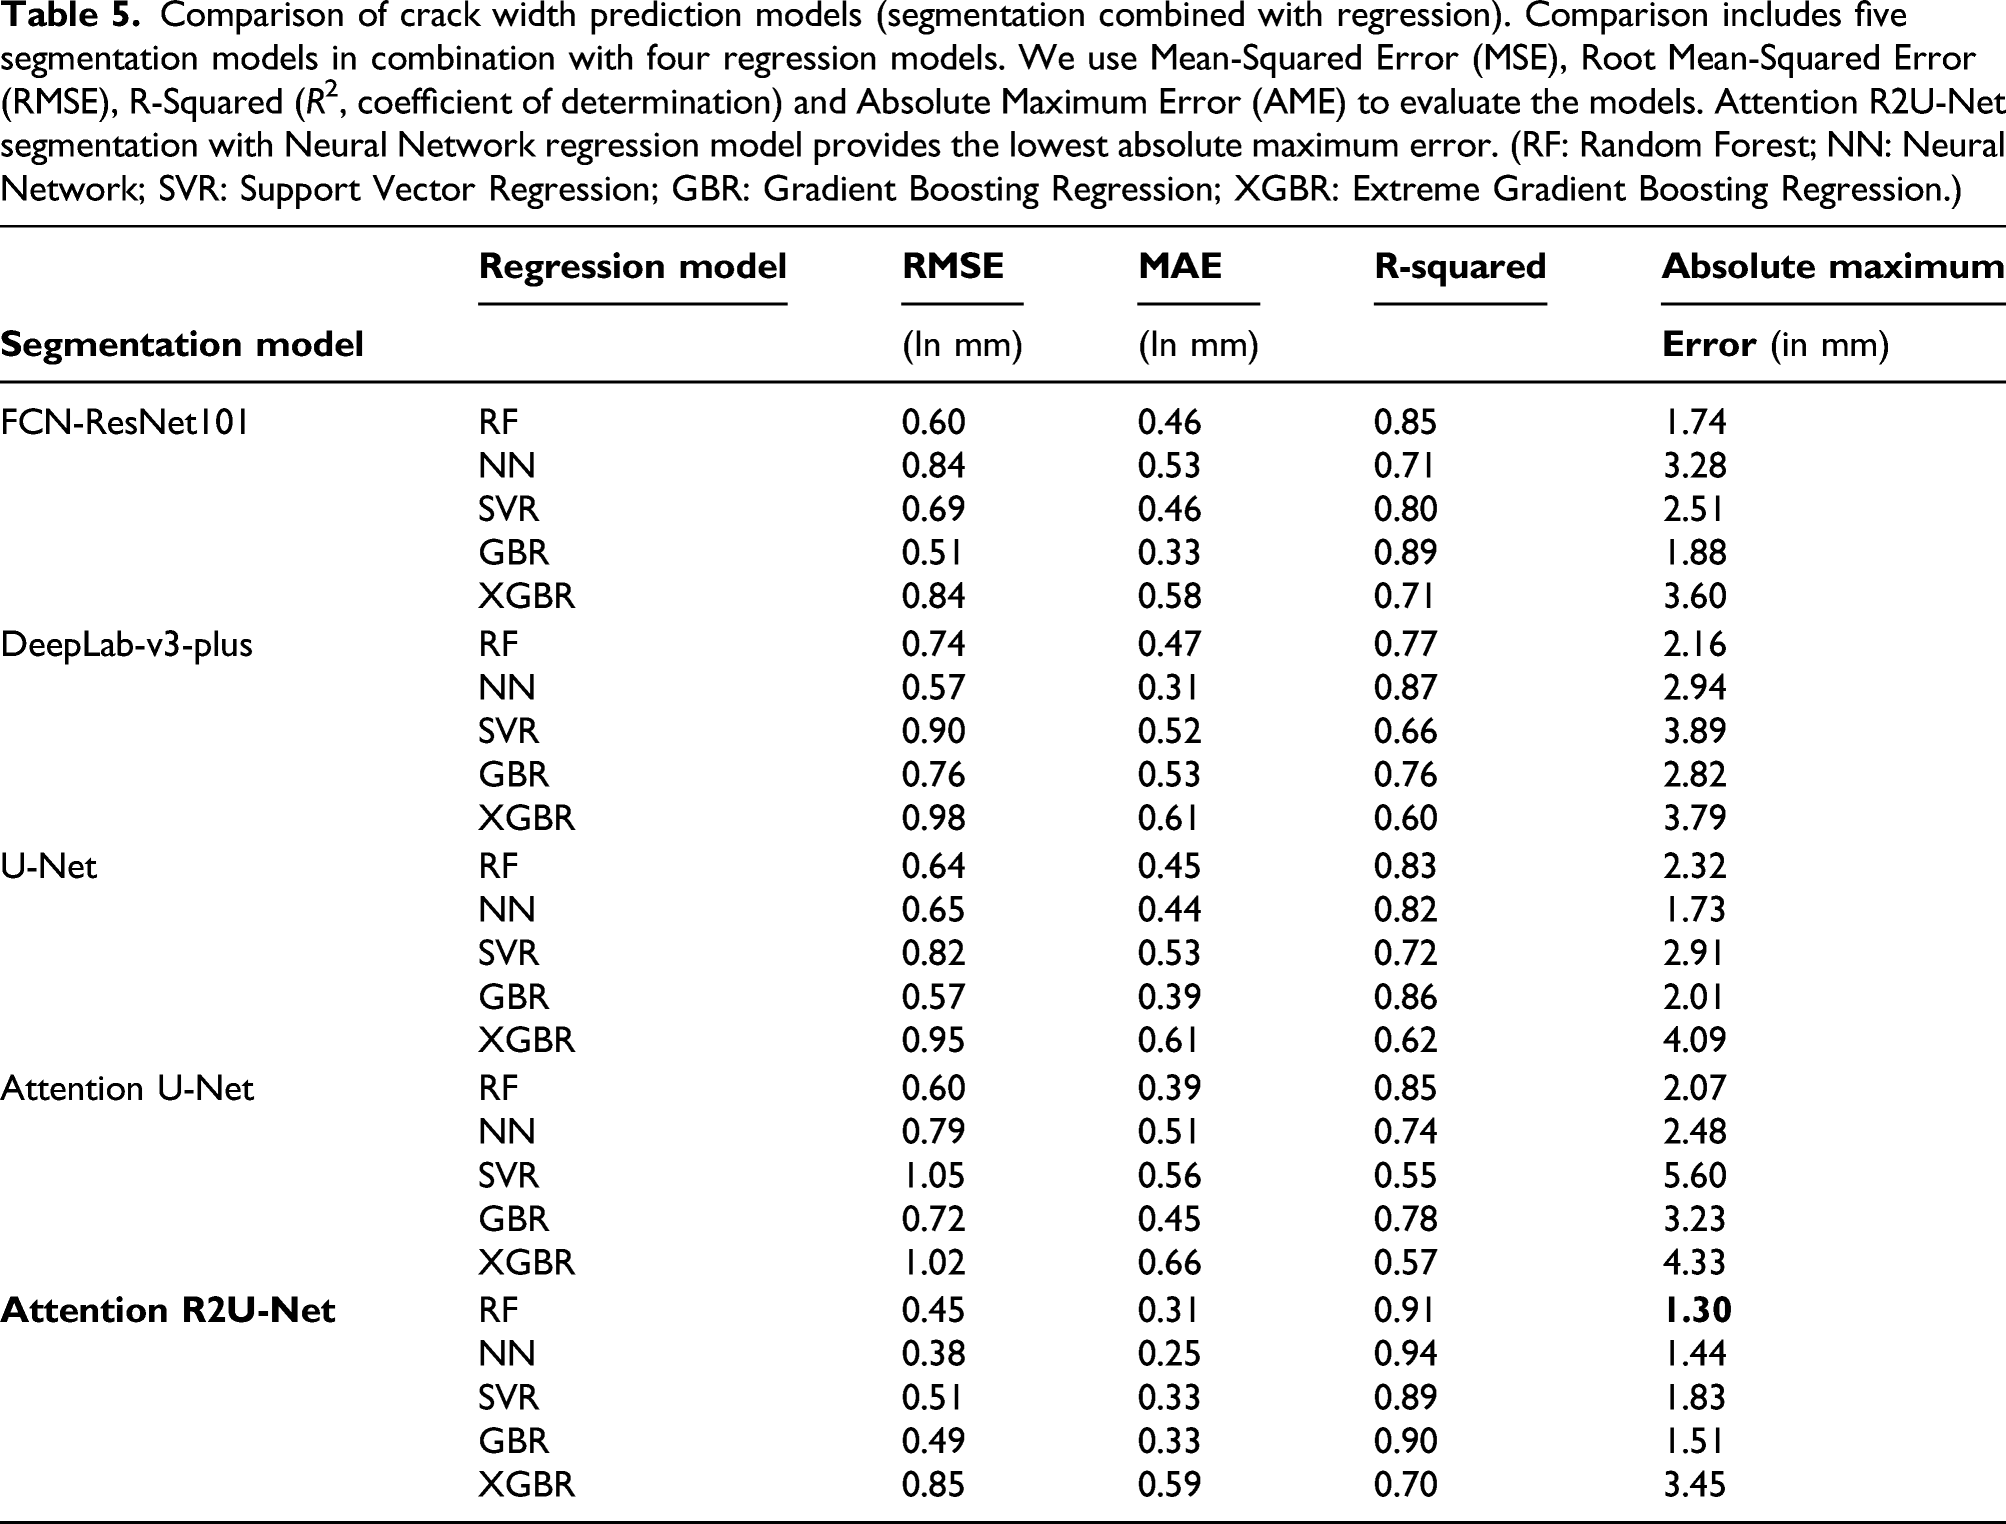
From Table 5 overview, we notice that Attention R2U-Net provides the highest R 2 (with lower RMSE and MAE) when compared with FCN-ResNet101, DeepLab-v3-Plus, U-Net and Attention U-Net. Along the same lines, one can notice that RF regression model performs better than other regression models. We prefer RF over NN in predicting crack width as RF has inherent advantages in the way it creates decision trees and randomizes the data during training, reducing over-fitting and generalizing well for new, unknown data points. For example, Attention R2U-Net with NN produces R 2 = 0.94 and AME of 1.44 mm, whereas the Attention R2U-Net with RF has a slightly lower R 2 = 0.91 but better AME of 1.3 mm. We can attribute this property to NN model’s higher variance (trying to fit all points in the model during training), whereas RF tries to reduce variances by using random subsets of training samples and subsets of features (i.e., subsets of feature vector columns) during training to learn the mapping function from crack segmentation to predict crack width.
Figure 8 shows the regression results of Attention R2U-Net with RF, NN, SVR, and GBR for three concrete beams (C1, C2, and C3) used in this research. There were 60 crack-width testing samples (refer to Table 3 for more information dataset) containing varying crack widths from 0 mm to approximately 8.95 mm. C2 and C3 have crack widths ranging between 0 and approximately 4 mm, whereas C1 from 0 to Crack width prediction grouped by concrete specimen type (C1, C2, and C3) for four regression models with Attention R2U-Net: (a) Attention R2U-Net + Random Forest (R
2 = 0.91), (b) Attention R2U-Net + Neural Network (R
2 = 0.94), (c) Attention R2U-Net + Support Vector Regression (R
2 = 0.89), and (d) Attention R2U-Net + Gradient Boosting Regression (R
2 = 0.90). Crack width prediction grouped by two locations (1 and 2) for four regression models with Attention R2U-Net: (a) Attention R2U-Net + Random Forest (R
2 = 0.91), (b) Attention R2U-Net + Neural Network (R
2 = 0.94), (c) Attention R2U-Net + Support Vector Regression (R
2 = 0.89), and (d) Attention R2U-Net + Gradient Boosting Regression (R
2 = 0.90).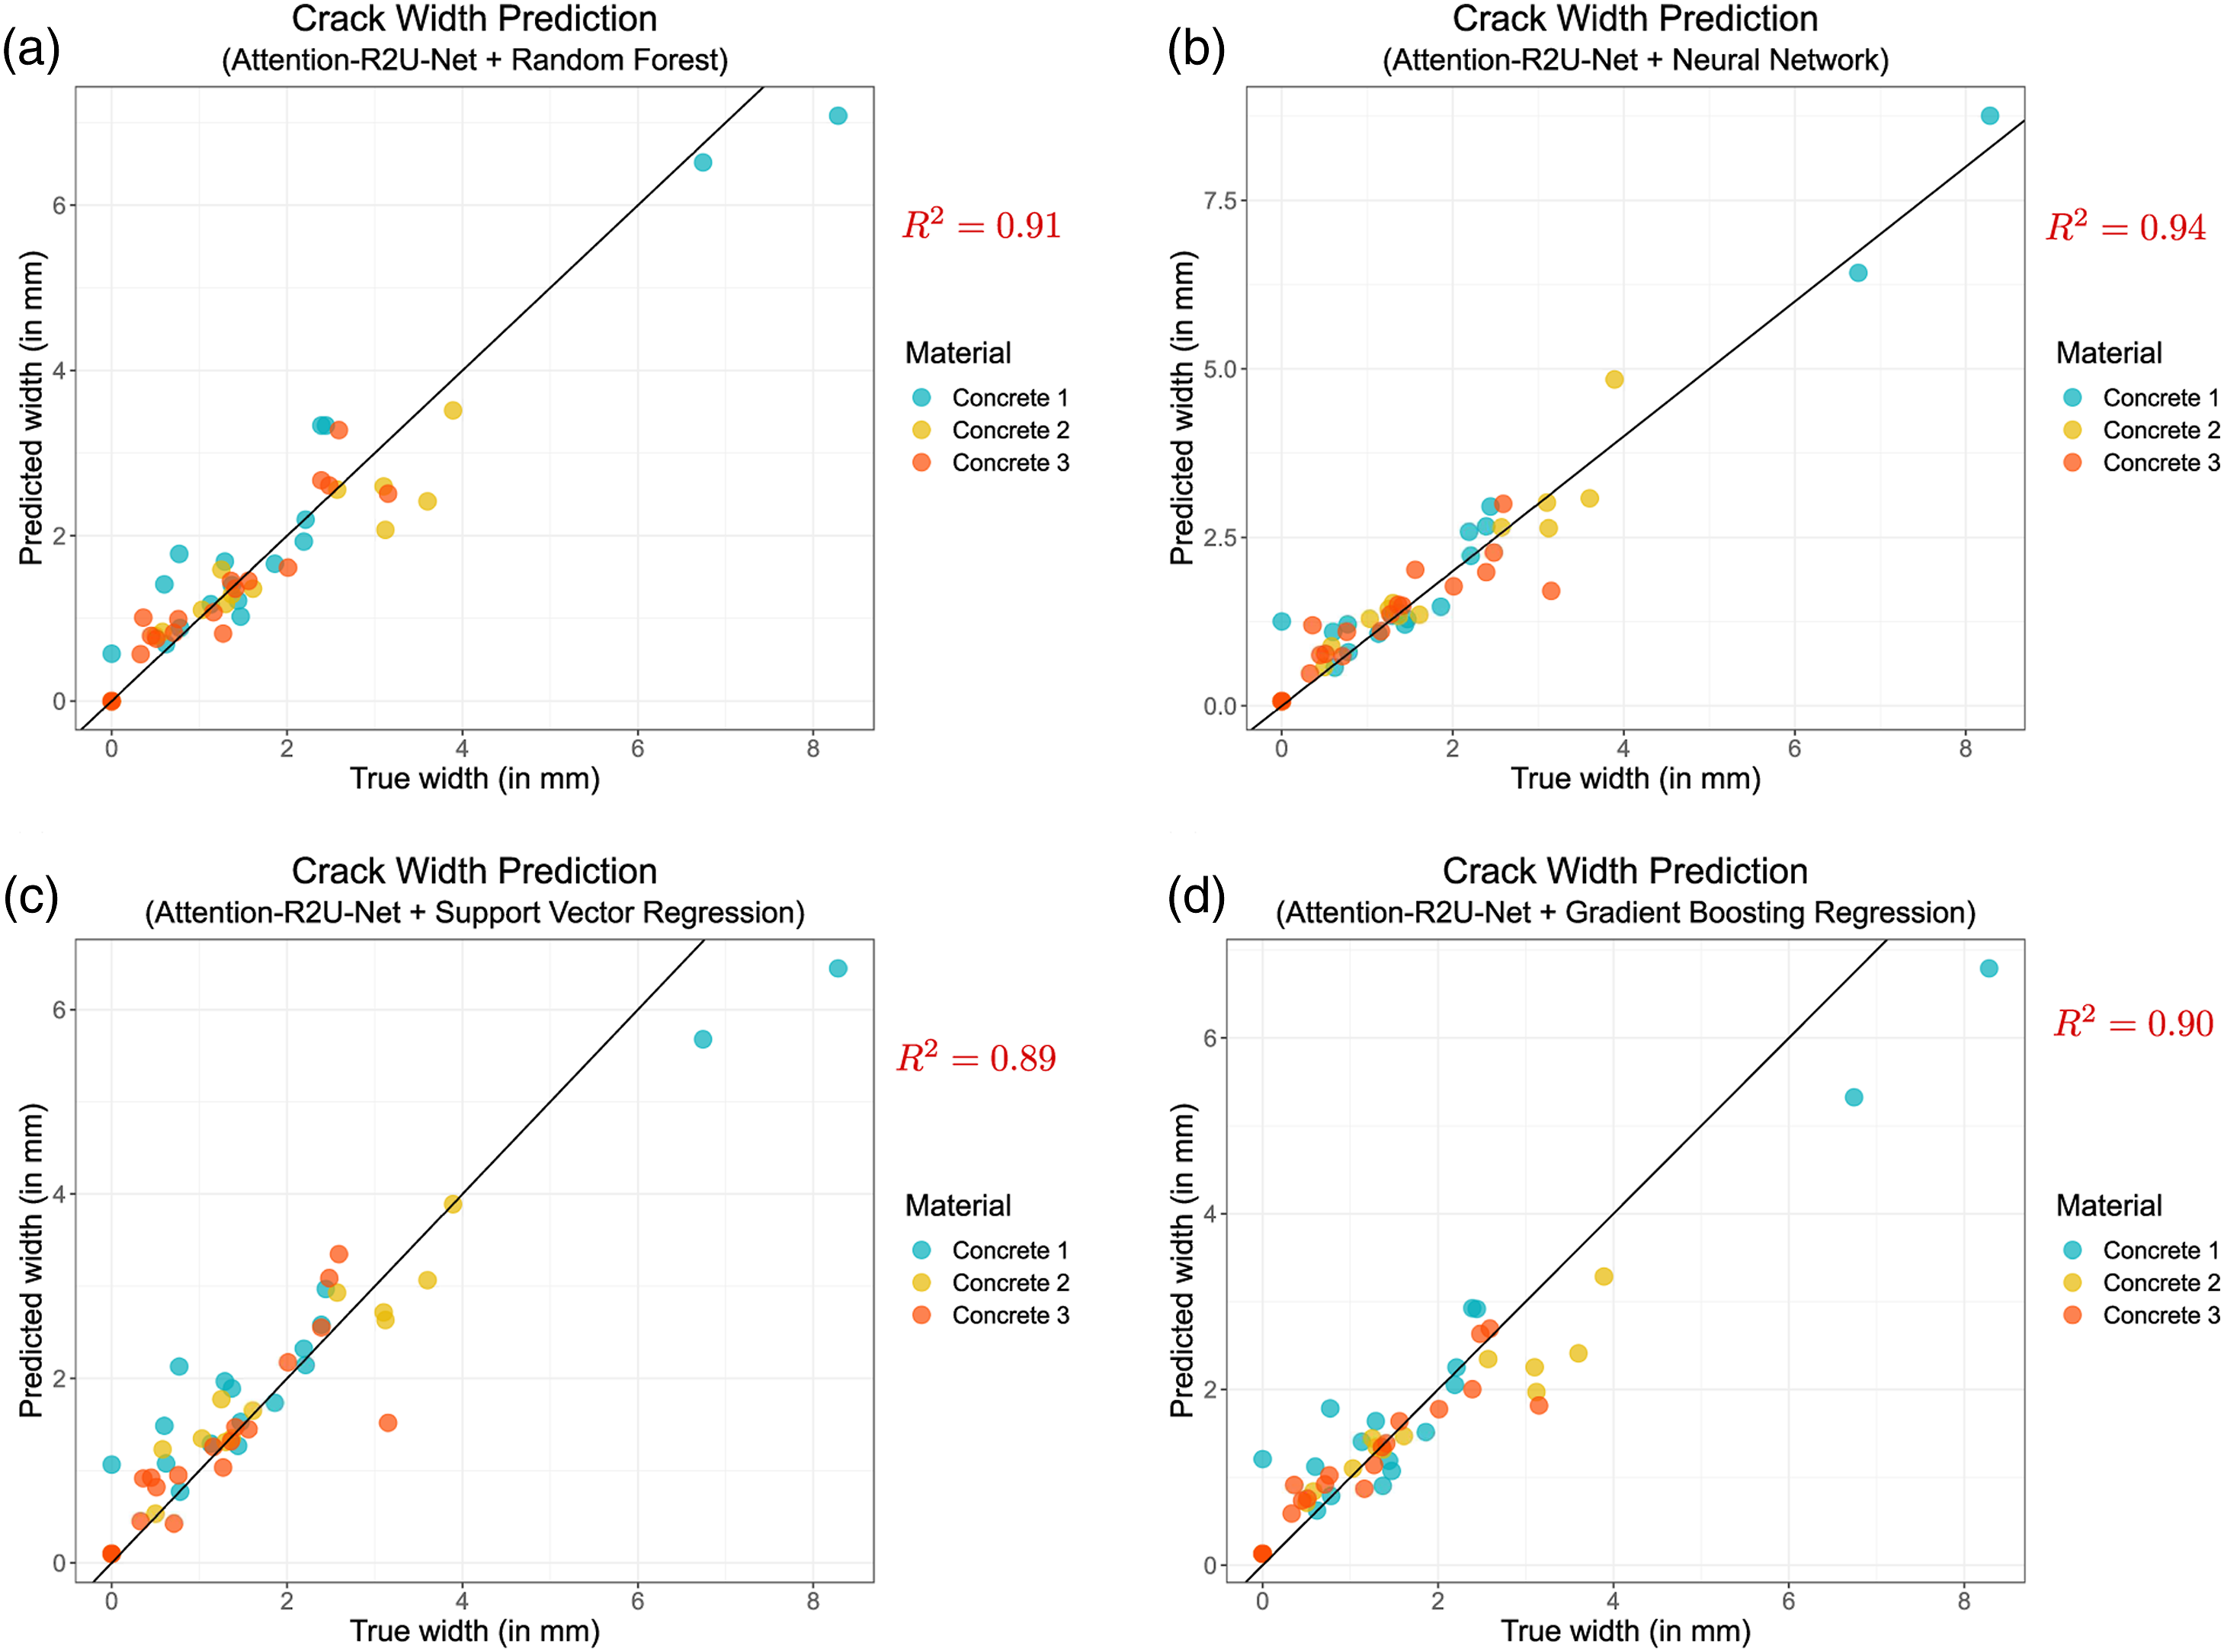
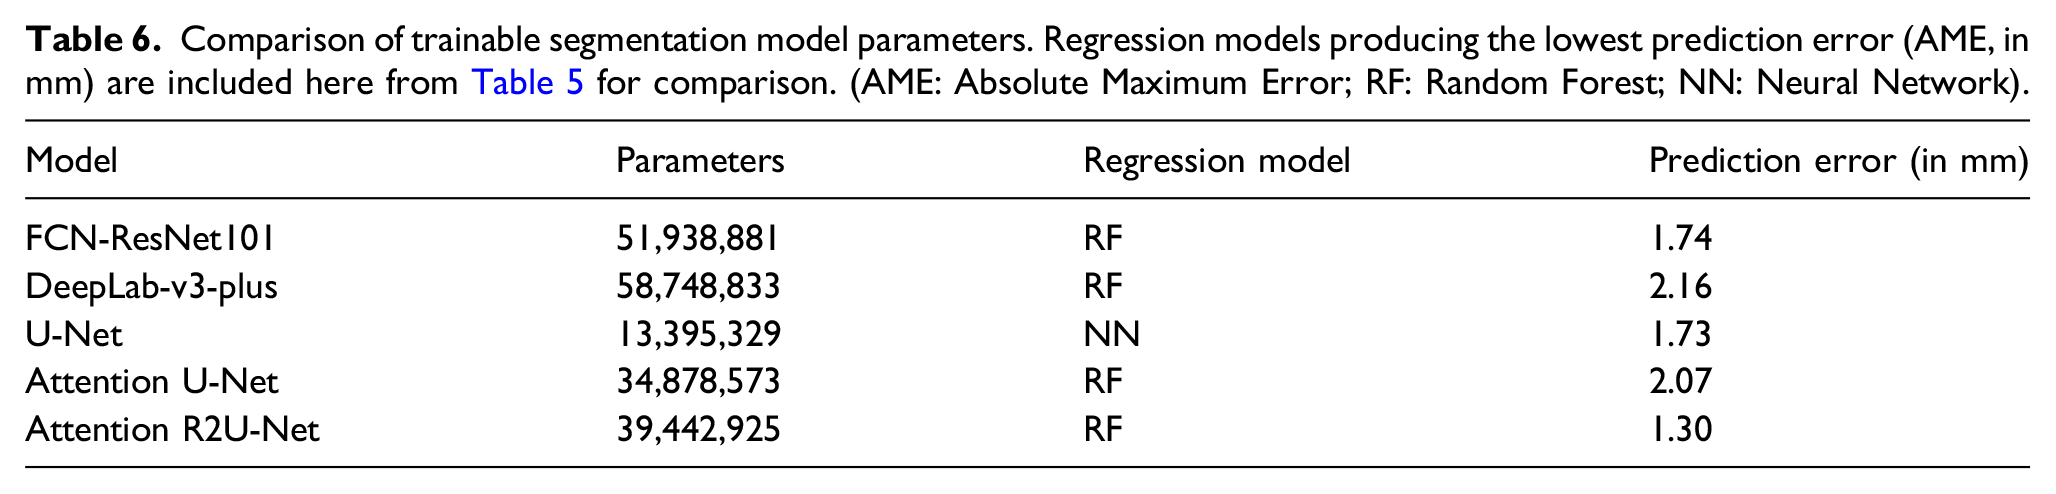
Comparison of trainable segmentation model parameters. Regression models producing the lowest prediction error (AME, in mm) are included here from Table 5 for comparison. (AME: Absolute Maximum Error; RF: Random Forest; NN: Neural Network).
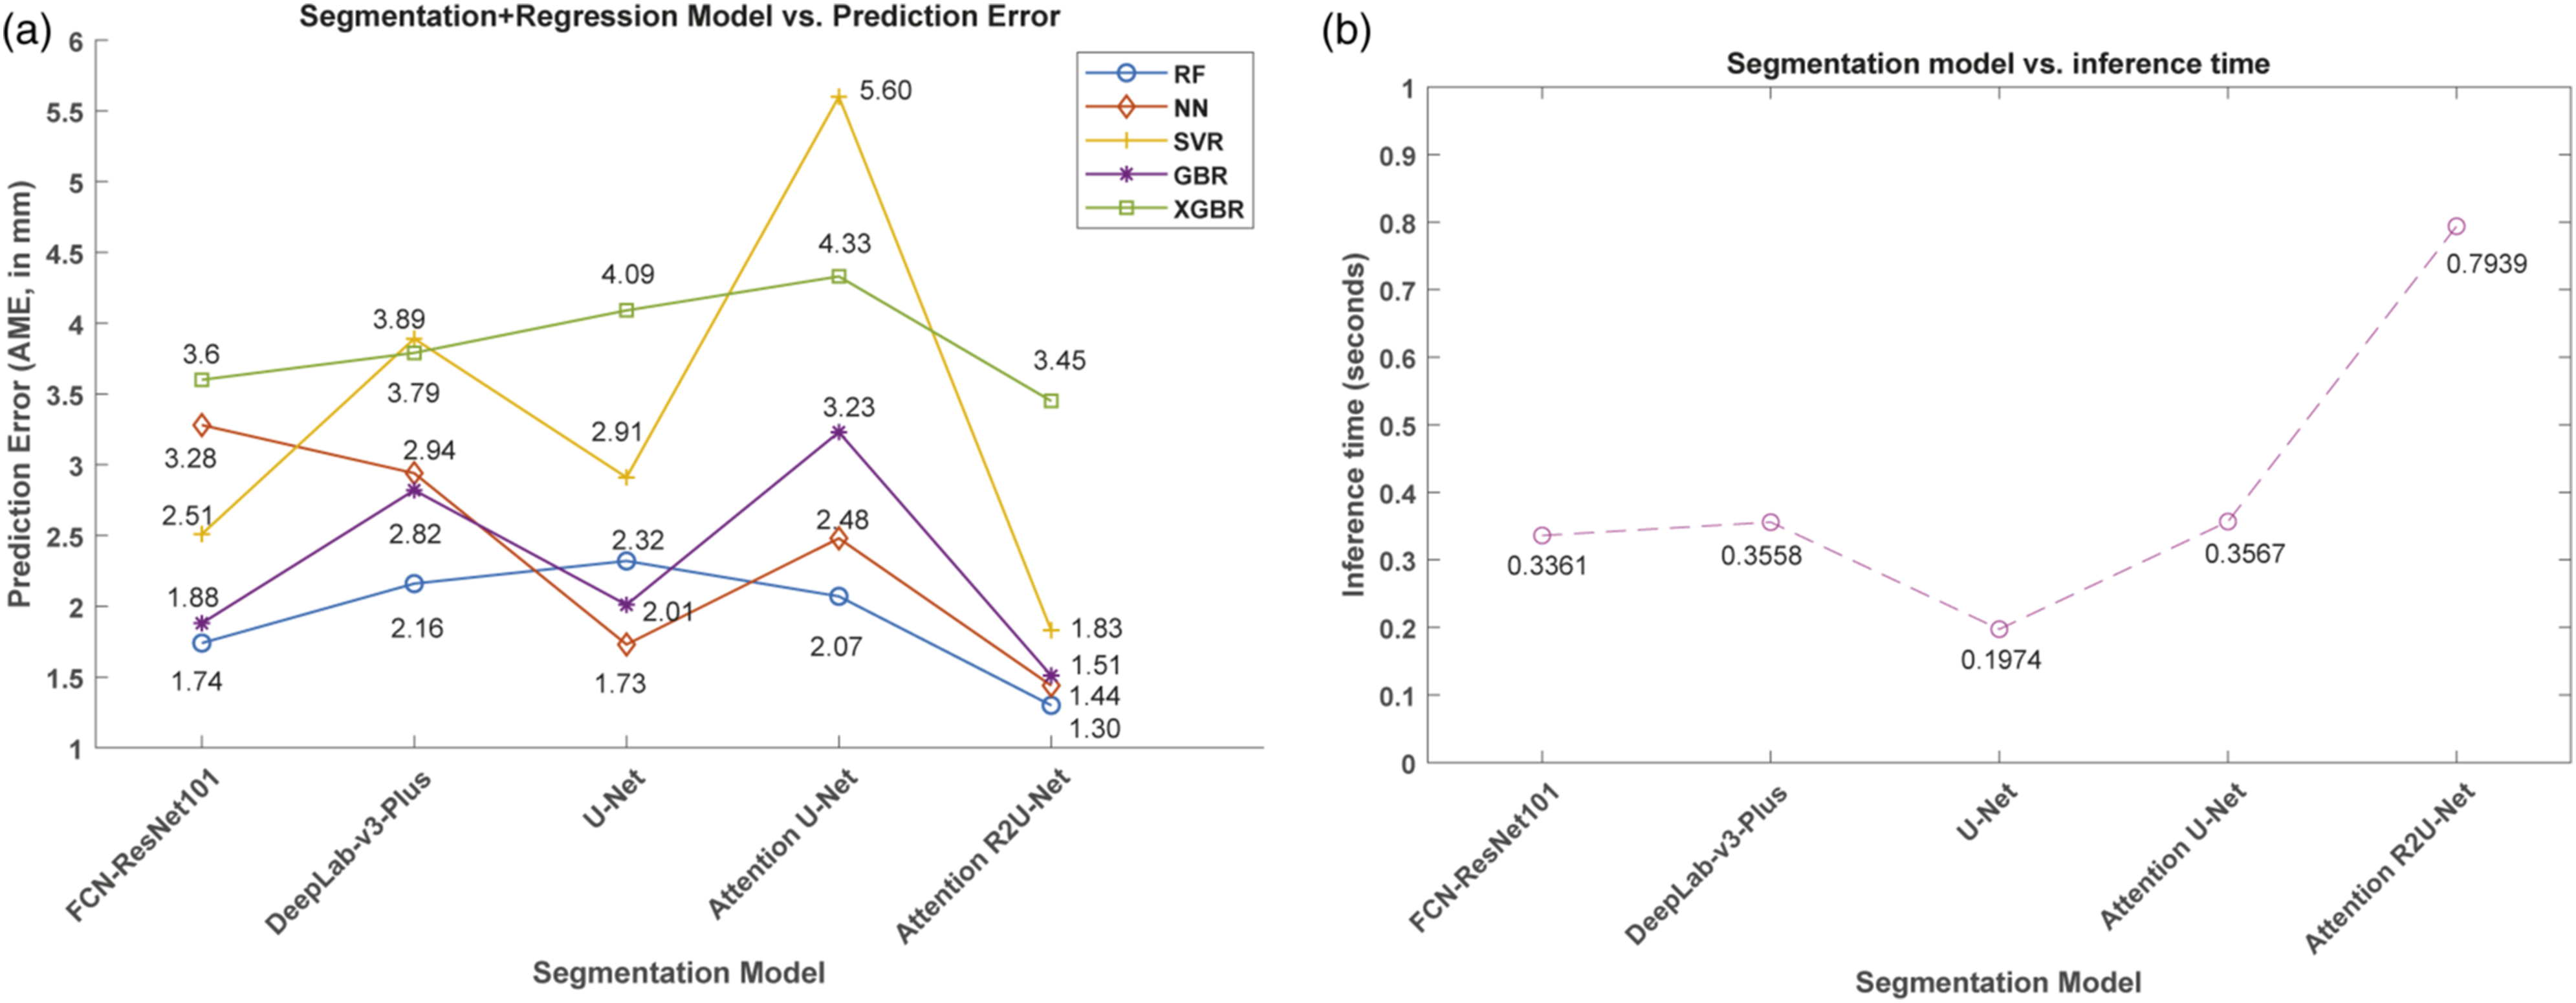
Comparison of (a) prediction error (AME, in mm) and (b) inference time (in seconds) per patch of size 256 × 256. The plot is based on average inference time calculated on test images using the trained segmentation models. There is a trade-off between achieving the lowest absolute maximum error (Attention R2U-Net) and the inference time.
On the other hand, U-Net has the lowest model complexity (and the number of trainable parameters) and hence requires only about 0.2 s per patch but has higher AME (of 2.32 with RF as a regressor, refer to Table 5). The remaining segmentation models have in-between complexities, and hence, their inference times also lie in-between. We also note from Table 6 that the model with more trainable parameters does not necessarily result in slower inference. For example, both FCN-ResNet101 and DeepLab-v3-Plus have 51 million and 58 million parameters, respectively. In contrast, Attention R2U-Net has 39 million parameters but requires a higher inference time. Attention R2U-Net with RF provides the lowest AME compared to other segmentation methods and has a higher R-squared measure. This work outlines the model complexities and inference times, and depending on the nature of crack width prediction application, one can choose a suitable model. Please note that the model parameters listed in Table 6 do not include parameters from regression models. The number of regression model parameters are significantly less compared to the segmentation model parameters.
The proposed (segmentation) approach has two main advantages to predict crack width when compared to region-based methods. First, when we compare the inference times of the proposed Attention R2U-Net with the region-based crack detection approaches,
35
the VGG-16 (with the highest accuracy) requires 0.22 s to infer the presence of a crack on the patch size of 64 × 64. If we extrapolate the same inference time of VGG-16 to a patch size of 256 × 256 to compare with the Attention R2U-Net, we see that the VGG-16 requires
We note that the patch-based detection of cracks does not provide several pixels belonging to crack regions as they only identify the crack regions, but not the width of the cracks. 35 In other words, we want to detect millimeter-level accuracy of crack widths for automated detection of cracks. As presented in this work, the accurate detection and measurement of cracks are crucial in the inspection and maintenance of concrete structures. For example, in the inspection and maintenance manual of the local infrastructure agency, 2 it is highlighted that those crack locations and crack widths are the key indicators of the performance and capacity of concrete structures. The trained model developed in this work can be deployed on drones to inspect bridges by detecting and quantifying cracks on concrete beams, columns. In addition, the developed model can be used to assist the measurement of cracks on the laboratory testing of concrete structures (e.g., concrete walls under seismic tests in 27 ).
Comparison of detected crack length
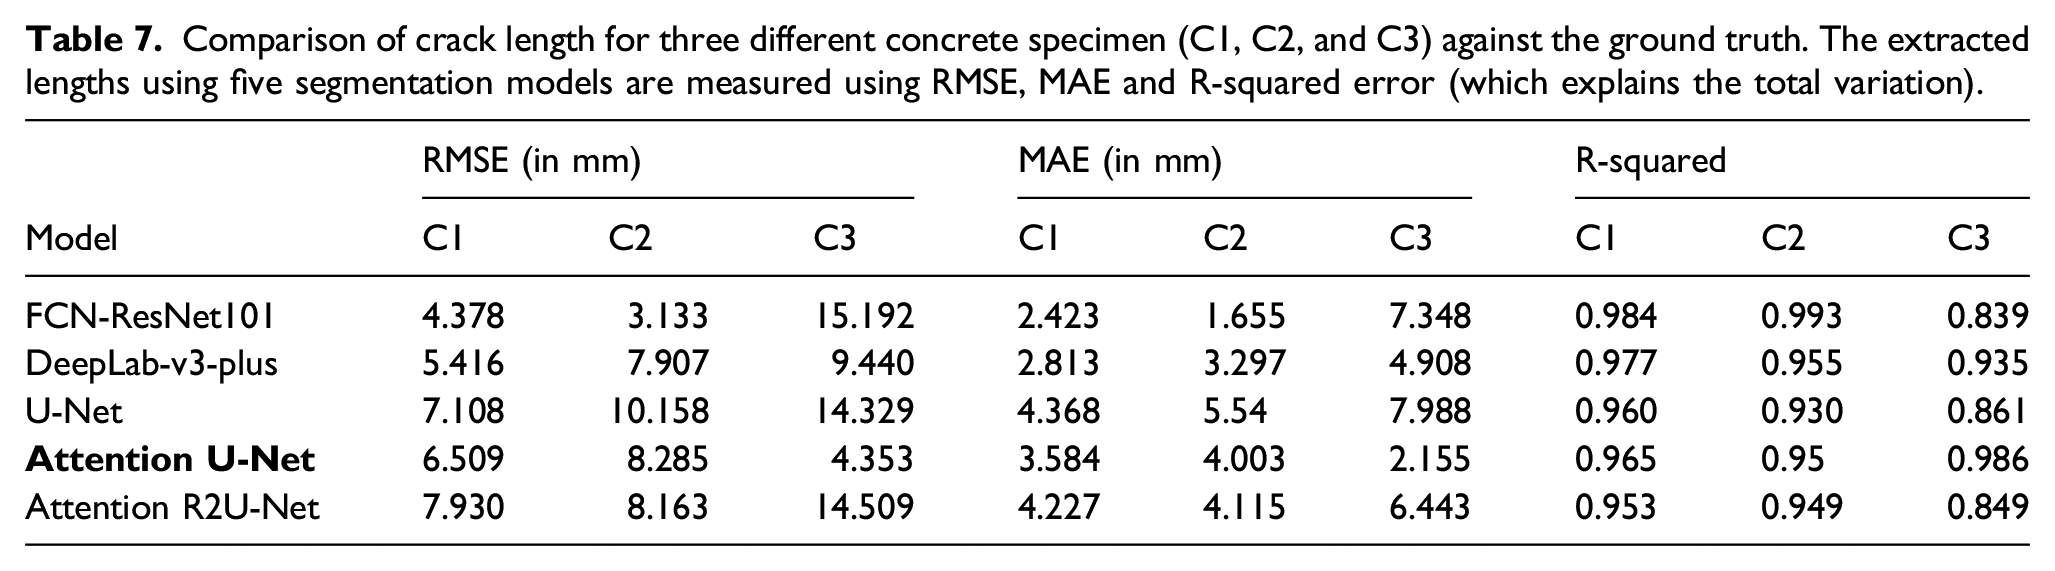
Comparison of crack length for three different concrete specimen (C1, C2, and C3) against the ground truth. The extracted lengths using five segmentation models are measured using RMSE, MAE and R-squared error (which explains the total variation).
Future work
In this research, we proposed Attention R2U-Net with RF for predicting crack widths in concrete images, which provides the lowest absolute maximum error (of 1.3 mm) and R 2 = 0.91. We also note some limitations in our work and try to address these in our future research. First, we collected data from three concrete surfaces in our lab. As we had limited data, we combined this data with another dataset to train the models. The crack widths in the two datasets vary and can introduce bias in the models we train. Second, acquiring large datasets and then annotating them at pixel level is a time-consuming and labor-intensive process. The pixel-level annotations depend on the domain expertise and precision with which experts can annotate, and the provision provided by the software. In our case, we use open source annotation tool (Sefexa † ) to segment pixels and this had limited capability in segmenting pixels, especially when the cracks were tiny and this might have inadvertently considered the surrounding pixels as belonging to cracks. Nonetheless, we have trained the models to produce robust results for a variety of crack widths with good accuracy and confidence. In addition, we have designed an image processing algorithm for automatically extracting the crack length for inspection and reporting purposes. In future work, one could also look into building regression models to map extracted length to match correct lengths. As our primary goal was to detect crack widths, we have not pursued this direction and instead we have shown that we could extract lengths that approximately match the correct length with no regression analysis.
Overall, the proposed work provides a promising solution for estimating and/or predicting crack width in concrete images. In our work, Attention Gates and Recurrent Residual convolutional layers in the Attention R2U-net improved the efficiency of detecting cracks and is therefore, performing well when compared to other segmentation models. This work will contribute towards automated detection of crack widths during building inspections, bride monitoring, and other SHM applications. We can also easily adopt the models to SHM using drones and Internet of Things (IoT), and integrate with other big data models that predict structural health from other IoT sensors.
Conclusion
This work focused on detecting millimeter-level accuracy of crack widths from images of concrete structures. This level of accuracy and measurement of cracks are crucial for the inspection and maintenance of concrete structures. This work proposed Attention Recurrent Residual U-Net (Attention R2U-Net) combined with Random Forest to predict pixel-level crack widths in concrete surface images. Patch-based crack detection approach cannot provide the crack width (or the number of pixels belonging to the crack), and hence they can only identify the region where there is a crack. In contrast, our work provides a deep learning framework for pixel-level crack prediction, with the mean prediction error of ±0.31 mm for crack widths varying from 0 to 1. Our proposed Attention R2U-Net with Random Forest is a novel framework for estimating crack width. To the best of our knowledge, we are the first to propose this framework for predicting crack width in concrete crack images. 2. Our framework uses local prediction and feature aggregation to handle larger-sized images (1024 × 1024 pixels or more). We achieve this by slicing images into smaller-sized patches (256 × 256 pixels) and combining them to have view cracks globally. This approach provides flexibility in analyzing larger images. It ensures that we can quickly train the models on IoT sensor devices with limited memory and processing capabilities, such as drones. 3. As our framework provides a direct estimate of crack widths in millimeters from input images, it enables real-time crack width prediction in building inspection, bridge monitoring and other SHM applications.
Our work also provides a way forward for processing large-sized images commonly acquired using High Definition (HD) cameras. We have compared our proposed framework with a combination of four other pixel segmentation models and regression models. Our proposed model produces the lowest absolute maximum error (1.3 mm). Further, one can quickly adapt our framework to various SHM applications using drones and IoT sensors.
Footnotes
Declaration of conflicting interests
The author(s) declared no potential conflicts of interest with respect to the research, authorship, and/or publication of this article.
Funding
The author(s) disclosed receipt of the following financial support for the research, authorship, and/or publication of this article: This work was supported by the CRC-P for Advanced Manufacturing of High Performance Building Envelope project, funded by the CRC-P program of the Department of Industry, Innovation and Science, Australia and funded by the Australian Academy of Science, Australia (the Asia Pacific Research Network for Resilient and Affordable Housing (APRAH)).