
Abstract
To cope with the intermittent power supply of the new renewable energies and demand fluctuations, Francis turbines are required to operate more and more in an extended operating range, far away from the design point. With this operating behavior, it is very complex to interpret the trend of vibration parameters typically used in Condition Monitoring and to define reasonable alarm and trip levels valid for all the operating range of the unit working in steady conditions. As in the efficiency curves of Francis turbines represented as a function of net head and load (Hill Chart), in this paper we propose to represent the most relevant vibration parameters in surfaces, called Vibrational Hill Charts, which allow a more accurate evaluation of the indicators and their trends and a better classification of abnormal values. To show the potential of Vibrational Hill Charts, a complete database obtained after 2 years of monitoring a large Francis Unit (444 MW rated power) has been used. The mapping of the relevant vibration parameters has been performed by means of Artificial Neural Networks. It is shown that by setting the action levels based on the resulting maps, rather than a constant value, a better diagnosis capacity is achieved as the Receiver Operating Characteristic will be improved. Furthermore, phenomena such as erosive cavitation, which is hard to be detected, could be also assessed with the use of multidimensional analysis based on the Vibrational Hill Chart. As a conclusion, with the Vibrational Hill Chart, the condition monitoring and diagnosis of hydraulic turbines could be improved.
Introduction
Due to the sustainable and environmentally friendly characteristics, new renewable energies (NREs) have been widely introduced into the energy market in the recent years. 1,2 However, the output of NREs like wind power and solar highly depend on the atmospheric conditions so that the supply of NREs to the power grid is intermittent and non-dispatchable. 3 This compromises the stability of the grid as the power generated and consumed must be continuously balanced.
In order to balance this complicated behavior of the electricity grid, hydro turbines have to regulate the operating condition more frequently and work in an extended range which is far away from the best efficient point (BEP). The extreme off-design operating points cause a series of hydraulic phenomena, which increase the excitation forces imposed on the units, 4 hence accelerating the wear and tear on the components of the unit. This situation also implies larger maintenance costs. For example, cracks and fractures on the runner and other components or erosive cavitation damages are serious problems that need to be addressed because they increase the overhaul periods. Although this new scenario shortens the remaining useful life of the machine and increases the maintenance costs, hydro power plant operators are interested in the extension of the operating range because it is always translated into great revenues yield due to the energy price difference. Statistical analyses of past data show that when there are load fluctuations caused, for example, by sudden changes of the weather conditions or generation outages the hourly price of the energy greatly increases. 5 In these events is when hydraulic turbines may be used in an extended range. Therefore, it is of great importance to accurately evaluate the consequences of operating the machine in an extended operating range.
High level of turbulence is a common phenomenon that can introduce excessive vibration and excite the natural frequencies of the machine. In deep part load and overload conditions, draft tube cavitation vortex rope appears, which is a cavity core with a precession frequency of about 0.25–0.35 times the rotating speed of the runner (f f ). 6,7 When the precession speed matches one of the natural frequencies of the hydraulic circuit, hydraulic resonance appears, which can generate huge power swings. 8–12 Rotor–stator interaction (RSI) is a typical interference between runner blades and guide vanes in Francis turbine 13 that generates strong periodical excitations on the rotating and stationary part of the unit. For the turbine runner, in case that one of the RSI frequencies matches one natural frequency of the structure large strain and stresses will be induced, which can drastically reduce the remaining useful life of the unit. 4,14,15 Other phenomena, such as erosive cavitation is also of paramount importance. Erosive cavitation is a very destructive phenomenon that occurs for some operating conditions. Although, some interesting methods for its detection have been proposed, 16–19 it is still necessary to investigate and to develop more accurate techniques.
For turbine units working in an extended range, it is important to analyze the effects of the aforementioned hydraulic phenomena and to quantify the relative costs of operating at these conditions. For these purpose, condition monitoring systems have been installed in several hydro turbines. 20,21 Condition monitoring systems typically acquire time signals from vibration sensors, temperature sensors, and pressure sensors installed on different parts of the unit. Furthermore, operating signals such as wicket gate opening, gross head, and output power are also acquired in order to characterize the operating point of the machine. These systems are a key component for the implementation of predictive maintenance on the units and therefore they can help to extend the useful life of different components, reduce the maintenance periods, and therefore reduce indirect costs. There are many examples where condition monitoring techniques have been successfully applied. Egusquiza et al. 22 analyzed the symptoms of typical types of damages in pump turbines based on 15 years of monitoring several power plants and proposed typical indicators for a vibration based monitoring . Valero et al. 23 discussed the possibility of operating range extension for a pump turbine and estimated the operating regions that need to be avoided according to the vibration signature. Presas et al. 24 discussed optimized monitoring strategy for power swing detection based on field test result with many sensors . Egusquiza et al. built up an empirical model to estimate the remaining life of Pelton turbines by researching the symptoms of 28 different Pelton turbines before and after maintenance. 20 In these studies, proper indicators to evaluate and detect different phenomena occurring in hydraulic turbines were proposed and validated.
With the development of sensors and Internet technology, new and faster on-line monitoring system have been installed on several turbine units and the signals acquired are sent in real time to the diagnosis centers, where they are postprocessed. This technology has also permitted to accumulate large amounts of data that could be used to feed artificial intelligence algorithms that can increase the diagnostic accuracy. However, in the field of hydraulic turbines, this technology is not improving as fast as in other fields such as wind turbine, gas engine, and civil engineering. 25,26 One possible reason is that the amount of data is very limited because hydraulic turbines are tailor-made for one specific power plant and they can be very different from each other. For example, data and experience acquired from a Francis turbine is not easily extrapolable to a Pelton turbine and viceversa. In a previous work, 21 the authors introduced the idea of generating three dimensional surfaces considering the head and load, which could be used to better characterize the vibration levels and to define what is a normal/abnormal level. Nevertheless, in that case the amount of data and sensors used was very limited (only one vibration sensor and only 1 month of operation) and therefore no clear conclusions regarding the diagnosis capacity of these type of surfaces could be extracted.
In this paper, we generalize the idea of Vibrational Hill Chart surfaces and propose a procedure based on Artificial Neural Networks to obtain them. In order to exemplify this procedure a complete dataset consisting of 2 years of monitoring of a large Francis turbine has been used. Based on the Vibrational Hill Chart curves, alarm and trip action limits are set up, respecting the allowable values recommended by the ISO standard 20816–5. 27 An analysis based on the Receiver Operating Characteristic (ROC) shows that these type of action limits based on the Vibrational Hill Chart performs a better classification of abnormal values (true positive rate or sensitivity is increased) than the constant thresholds limits. It is also discussed the feasibility of using multidimensional analysis methods based on these surfaces in order to detect incipient damages such as erosive cavitation.
Vibrational Hill Chart concept
Motivation
Traditionally in condition monitoring, indicators such as global features of the time signal (overall values) and spectral bands related to the excitation forces and to the dynamic response of the structure 22 are periodically obtained (e.g., every hour of operation).
Definition of zones and action limits for Francis turbines with top bearing housings braced against the station foundation according to the ISO 20816–5.
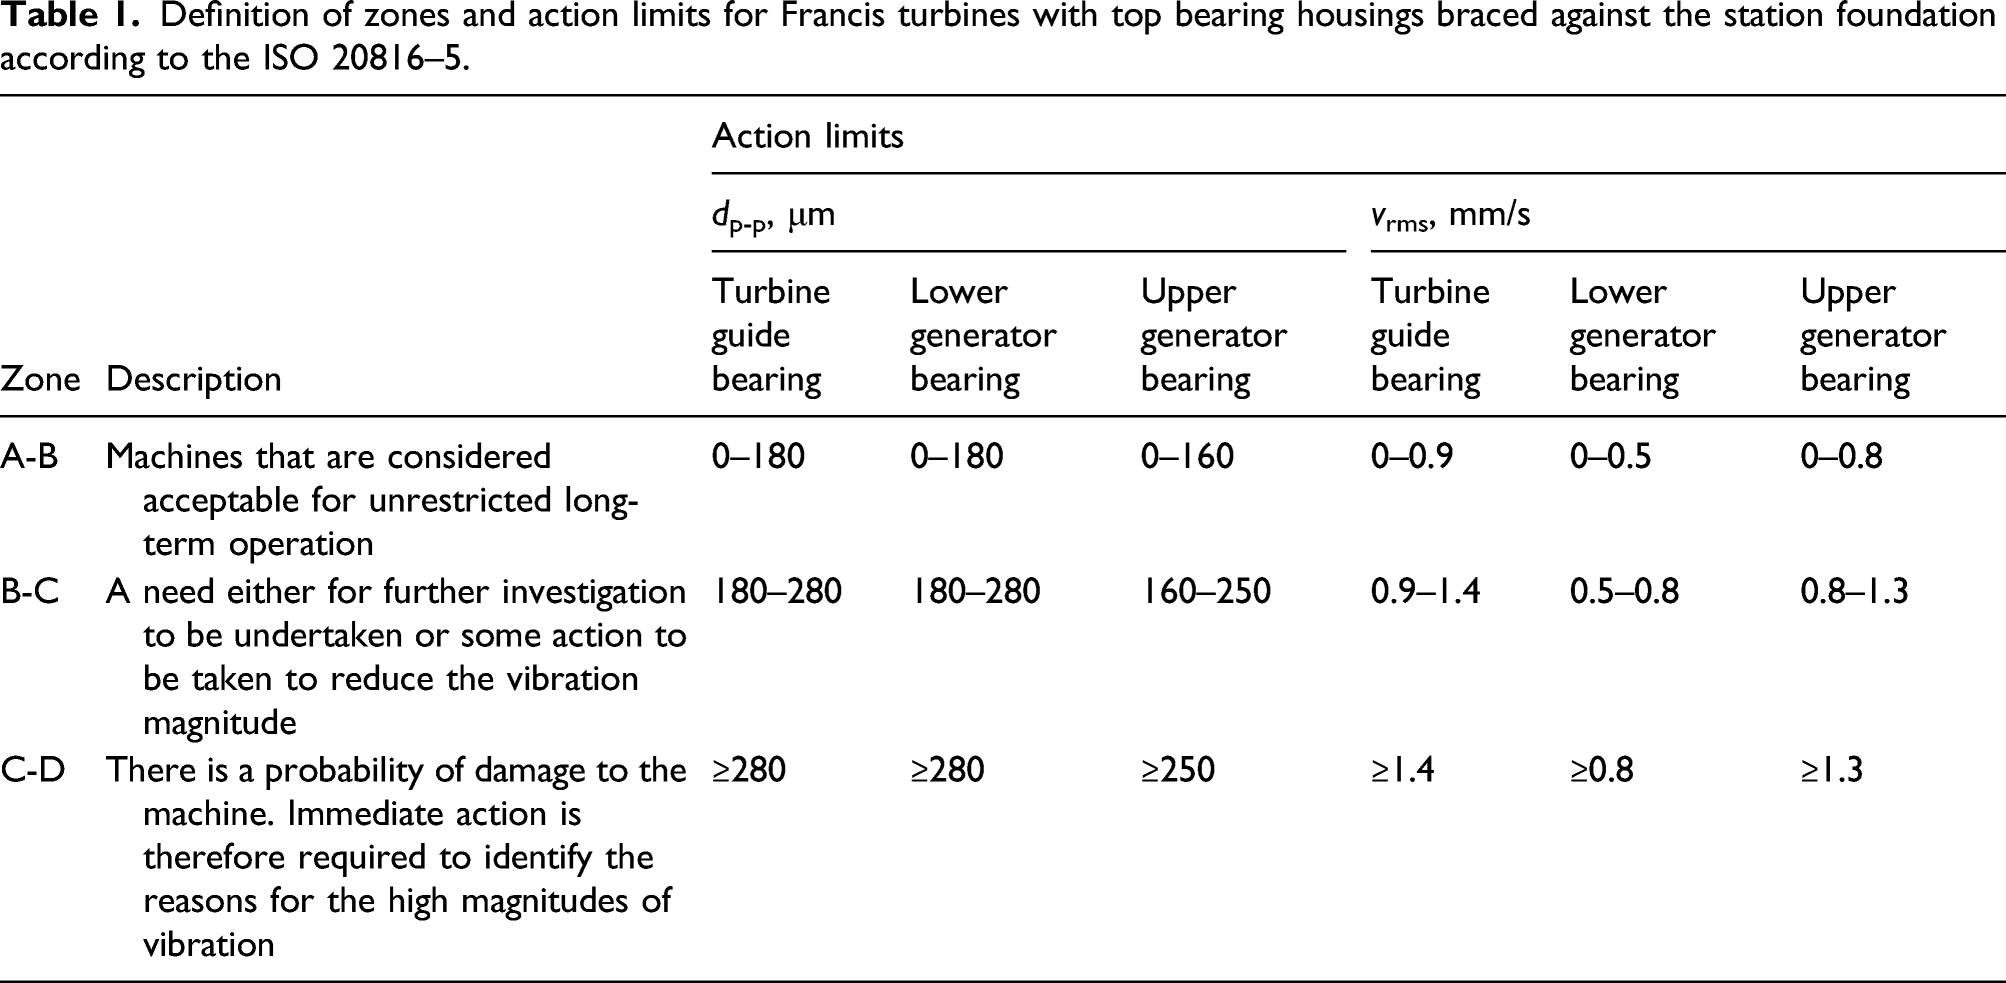
Besides, these global values, also spectral bands can be defined in order to relate these indicators (and a possible increase of them) to one specific phenomenon. A proposal of possible spectral bands and global values that can be used for the condition monitoring of a Francis turbine is shown in Figure 1 and summarized below: Spectral bands selection. a) Frequency bands of velocity; b) frequency bands of acceleration; c) frequency bands of displacement.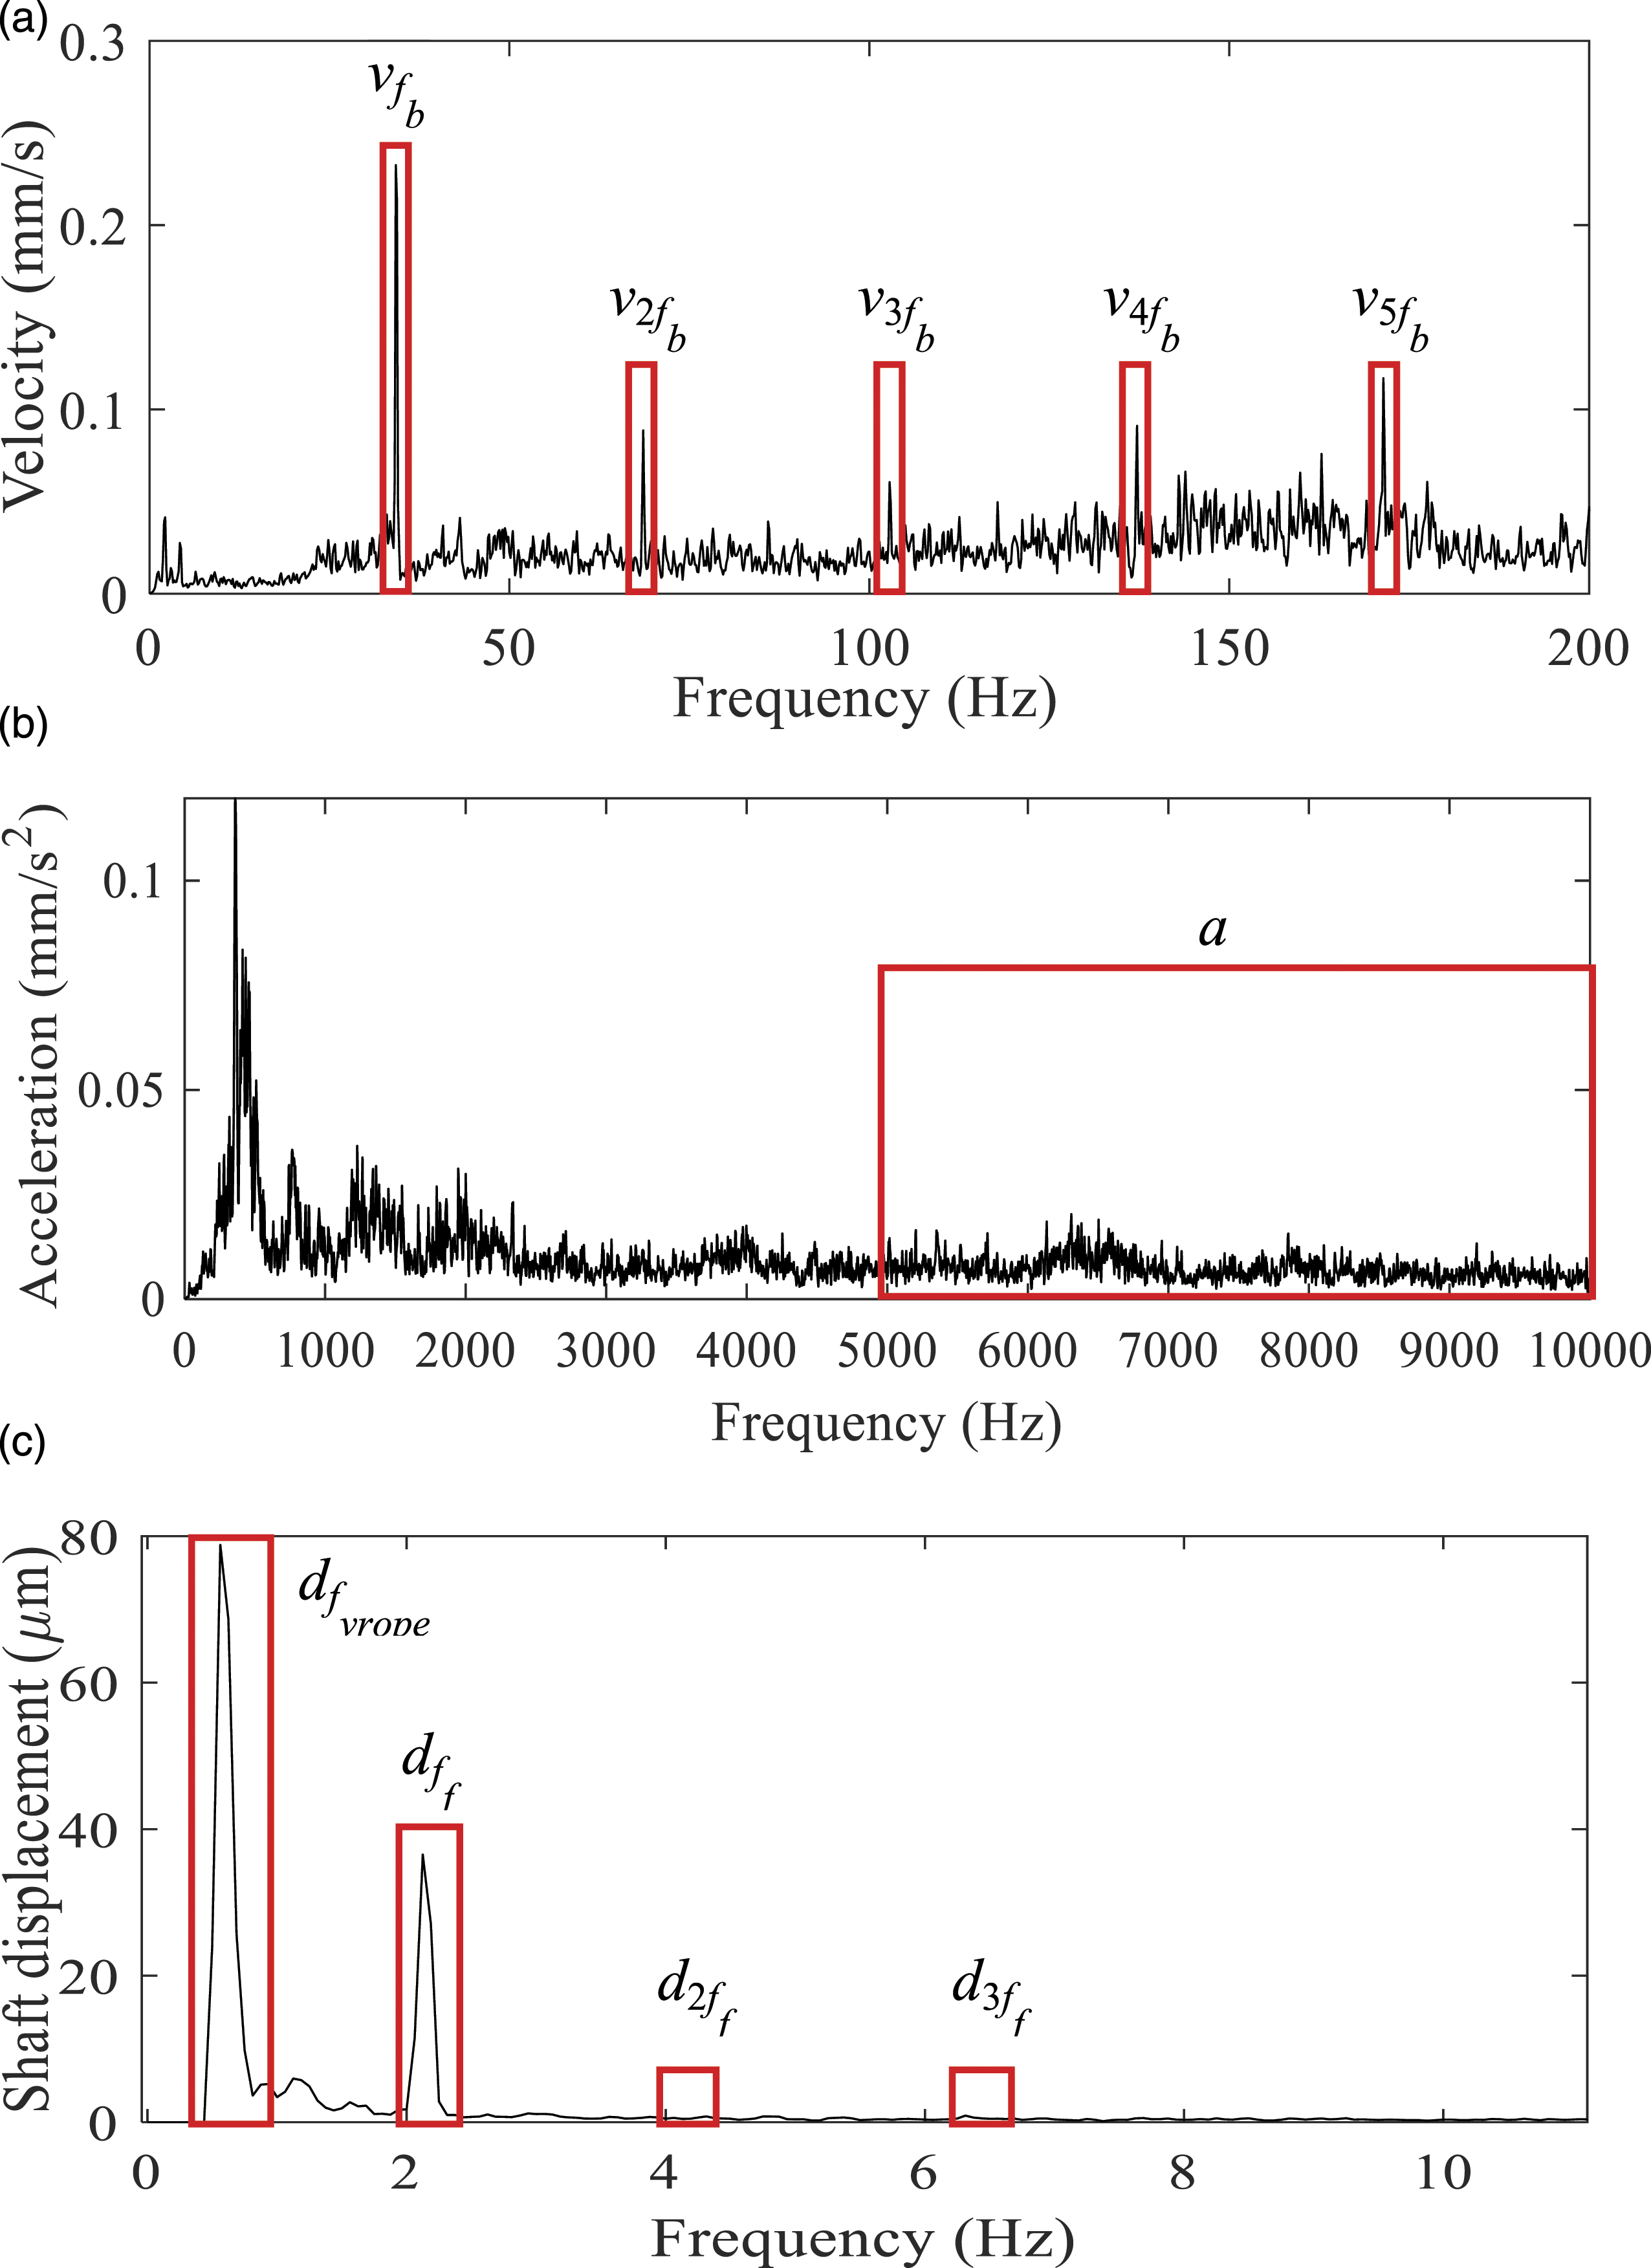
For the displacement sensors,
Other unusual phenomena such as rotodynamic instabilities may be considered in the overall value
For the accelerometers,
Other phenomena may be considered in specific bands that can be eventually defined.
Typically for all the indicators shown in Figure 1, alarm and trip levels can be also defined. For the global values, these limits can be defined according to the recommendation of the standards and for the spectral bands these limits can be defined with respect to reference values measured for the machine working in good condition. 22
Nevertheless, this approach based on constant alarm and trip levels do not consider that an indicator can show some symptoms of damage or abnormal behavior even if an alarm or trip value is not reached. For example, close to the Best Efficiency Point (BEP), where vibration levels are typically low, a symptom of damage or abnormal behavior could be that an indicator has increased a lot in a short period of time, even if the alarm levels are not surpassed. On the other side, far away from the BEP, excitations are higher and vibration indicators are typically much higher than in the BEP. In this situation, a relatively high value close to an alarm level can be normal if it is maintained over time.
An example of this can be seen in Figure 2, which corresponds to the monitored overall vibration level of the analyzed unit in this paper. In periods where the head is higher than the design head, the vibration levels are also higher and sometimes surpass the alarm level. Not only the levels are higher but also the relative variation of them. Therefore, in this situation it is difficult to establish protection levels and to perform accurate diagnosis of the unit. Measured vibration value, net head and action limits defined by the standard ISO 20816-5 on turbine bearing and generator bearing.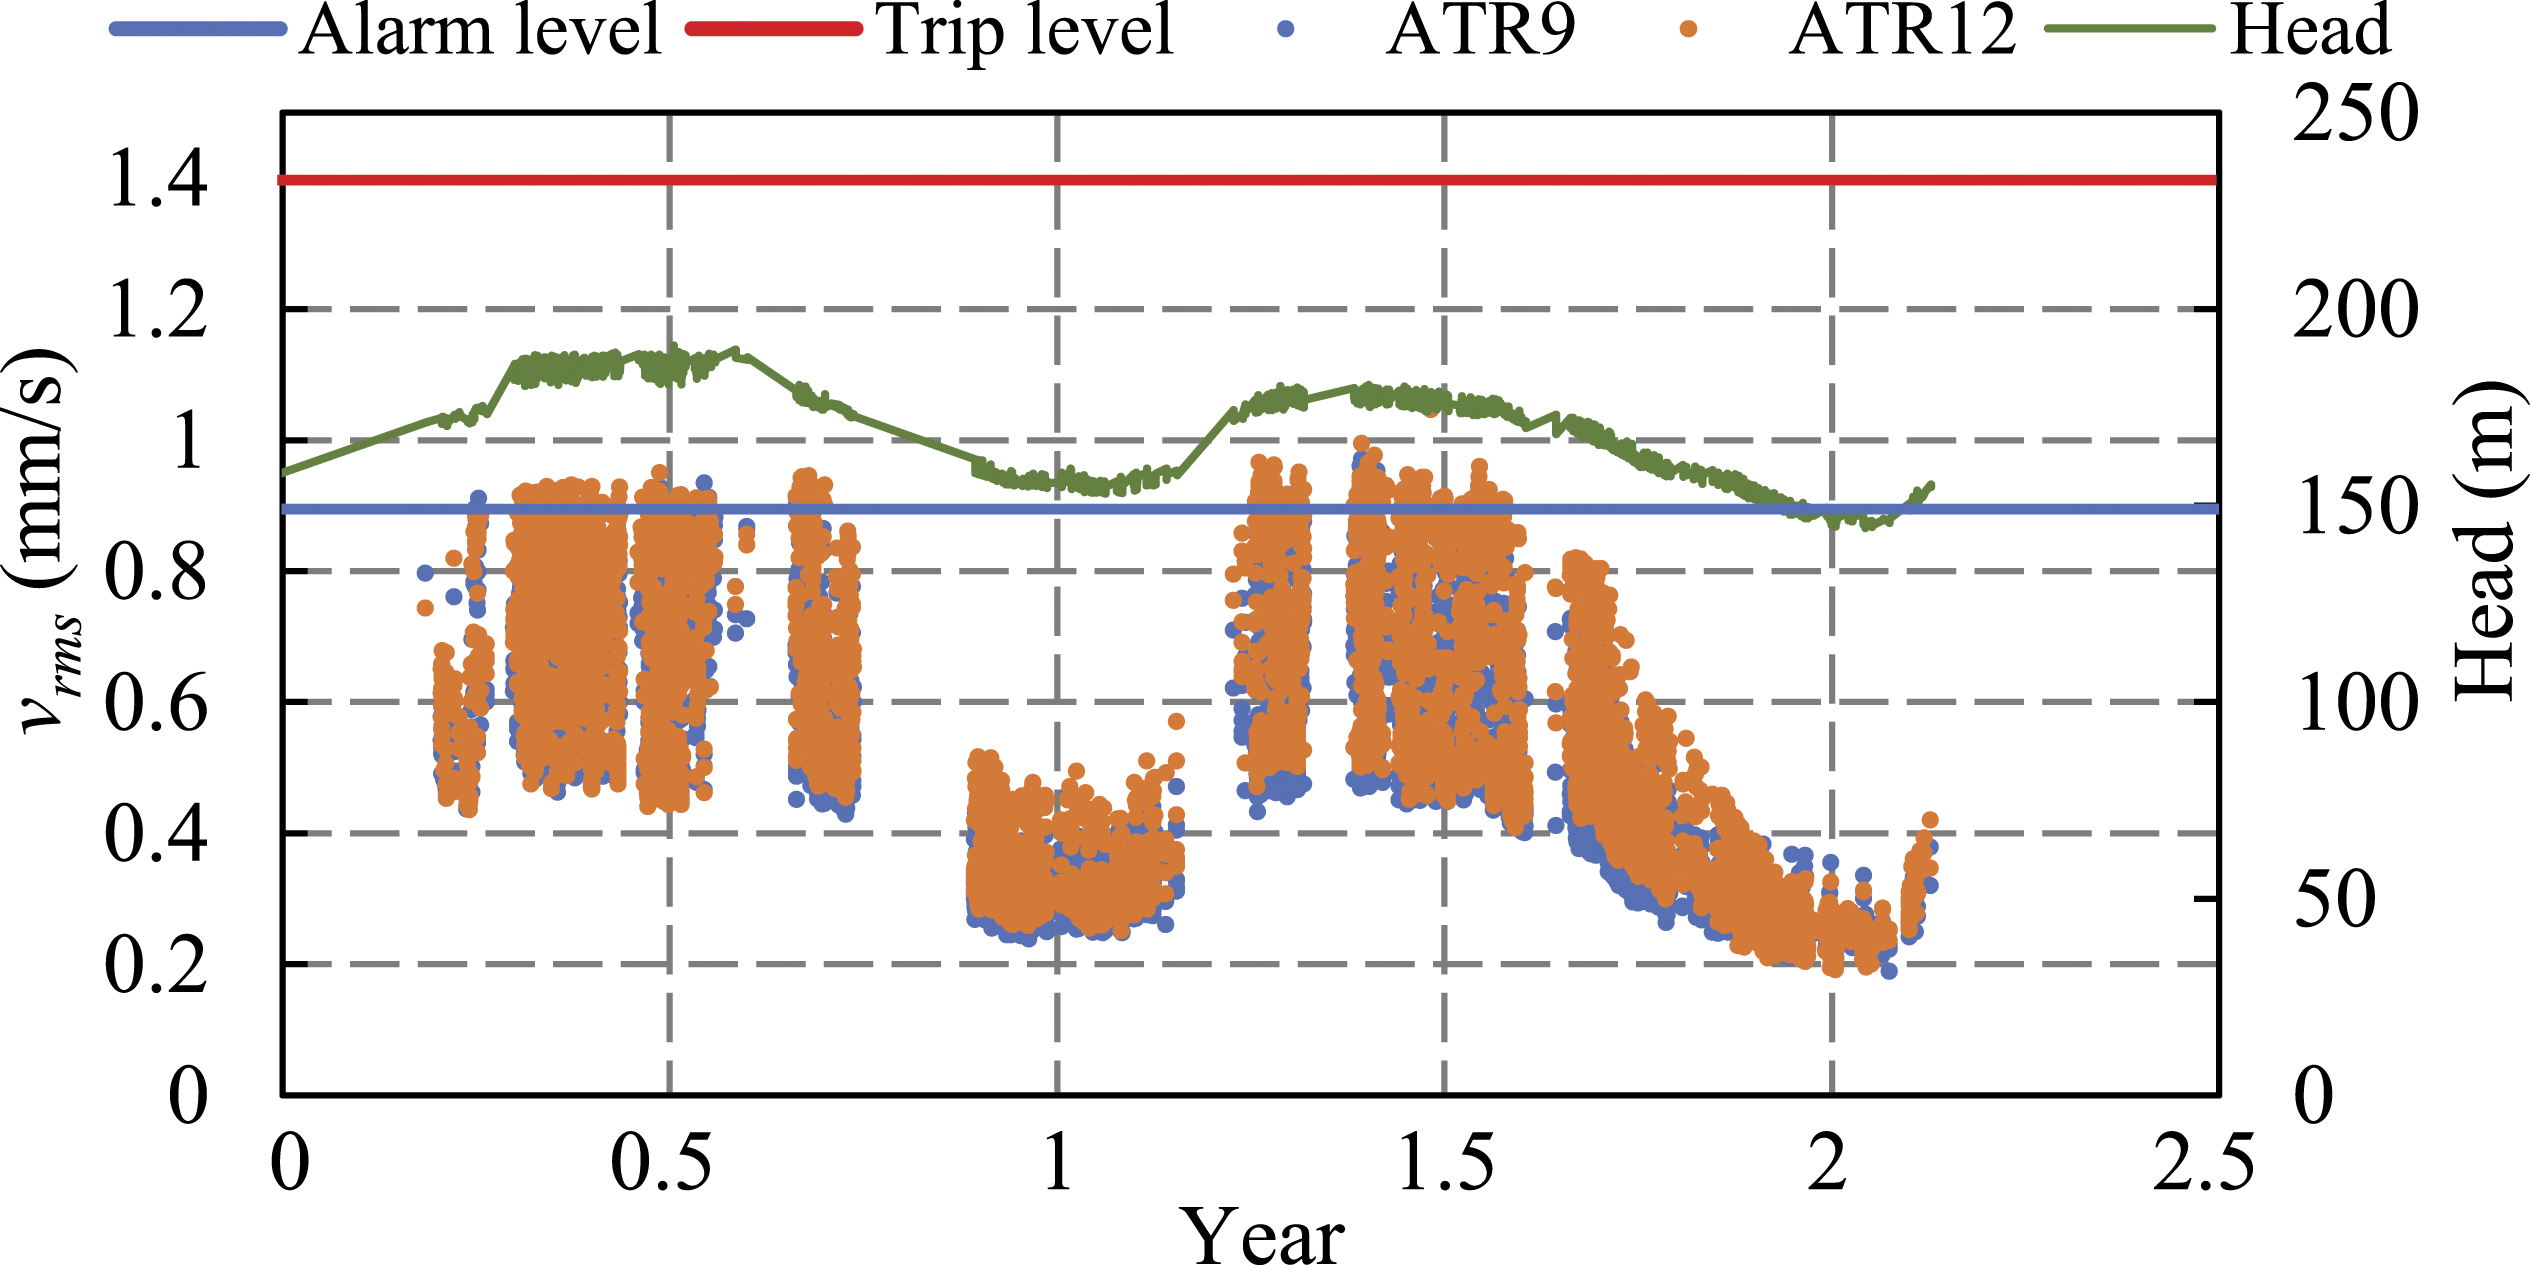
To improve the diagnosis capacity and in order to properly evaluate the vibration levels, the operating condition should be considered. For Francis turbines working in an extended operating range it could be useful to interpret these indicators considering the head and load. Based on the idea of the efficiency curves represented as a function of the head and power (or wicket gate opening), which are also known as Hill Charts, in this paper we propose to use “Vibrational Hill Charts” in order to improve the condition monitoring techniques.
Vibrational Hill Chart generation
The generation process is shown in Figure 3. The aforementioned indicators (Figure 1) are mapped against the head (H) and wicket gate opening (WGO), which are also monitored.
28
The mapping is performed with Artificial Neural Networks as will be explained below. As shown in a previous study, the fitting with Artificial Neural Networks (ANNs) has a better performance than other fitting methods.
21
The Vibrational Hill Chart fitting process.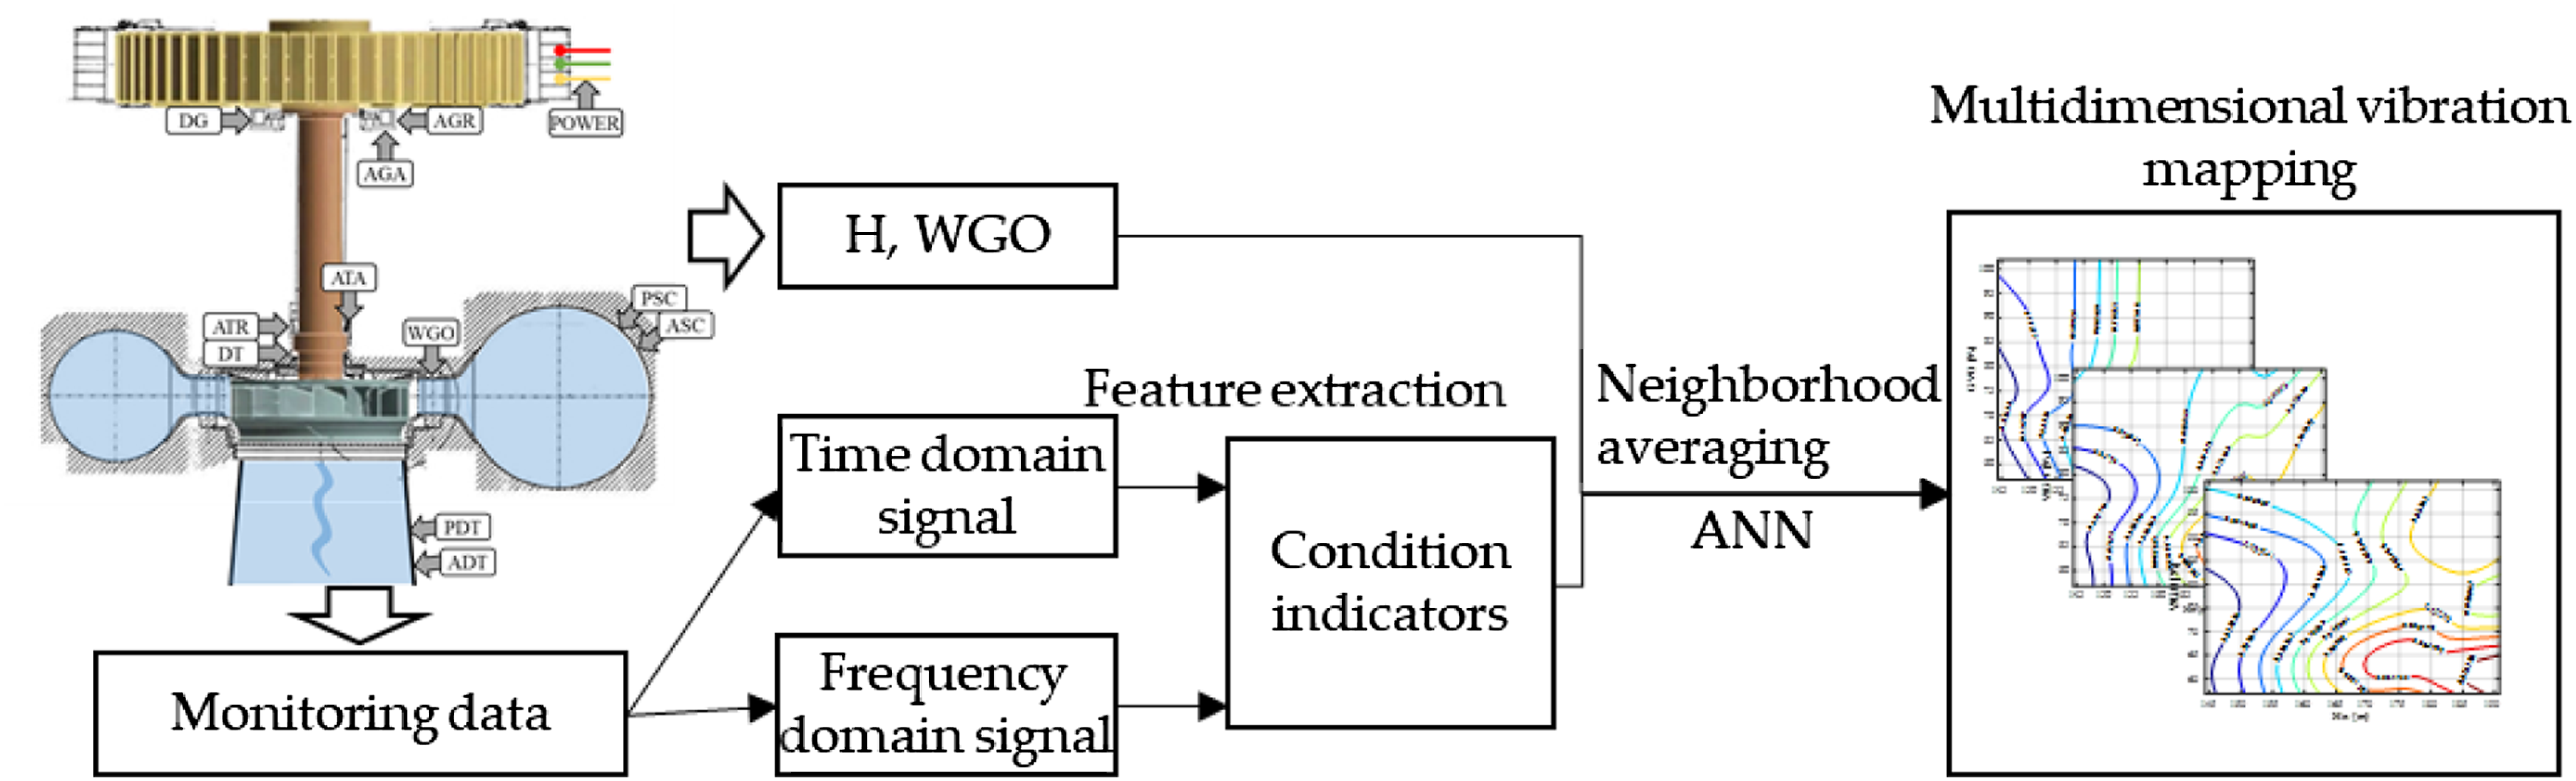
Before using the indicators as inputs of the NN, a neighborhood averaging process can be performed if the relative variation of the indicators is too high. It is well known that hydraulic excitations are highly stochastic for some operating conditions. As a result of that, some spectral band indicators can show a high variation for an identical operating condition if only one sample is taken. This effect can be reduced during the acquisition process, taking longer time signals and performing synchronous averaging in case that a tachometer or keyphasor is available. Nevertheless, this also requires a much higher capacity of the system for performing real time calculations and a much higher storage capacity.
In order to reduce the variability of the measured indicators once they are monitored, the neighborhood averaging can be applied for a long-term of data acquired (e.g., for this unit, 1 year could be used as the head and vibration levels oscillates with this period as seen in Figure 2). In a neighborhood averaging, for each measured indicator the corresponding averaged indicator is obtained according to equation (1) Example of the averaging process. Distribution of band level f
b
measured with an accelerometer during the monitoring period: a) distribution of the indicator in the Hill Chart plane H-WGO; b) Example of the probability distribution of the measured indicator and normal distribution; c) distribution of the indicator before the averaging; d) distribution of the indicator after the averaging.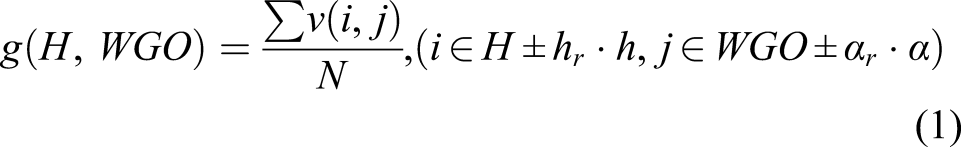
As an example, Figure 4(a) shows the distribution (in the Head-WGO plane) of all the operating conditions measured during the 2 years of monitoring period. Taking one operating condition into account (marked in red in Figure 4(a)), we can see that the indicator follows a normal distribution in the neighborhood (in Figure 4(b) the band level of f b for the neighborhood in Figure 4(a) is shown). By means of a Kolmogorov–Smirnov test (level α=0.05), it has been checked that all of the indicators generally follow a normal distribution for the neighborhood of the same operating condition and therefore for each operating condition the neighborhood averaging of the indicators will be considered as its indicator value. For symmetrical but non-normal distributions also the mean value could be considered. For non-symmetrical distributions the mode could be considered. Figure 4(c) shows the measured points of f b before the neighborhood averaging and Figure 4(d) shows the resulting values after performing the averaging.
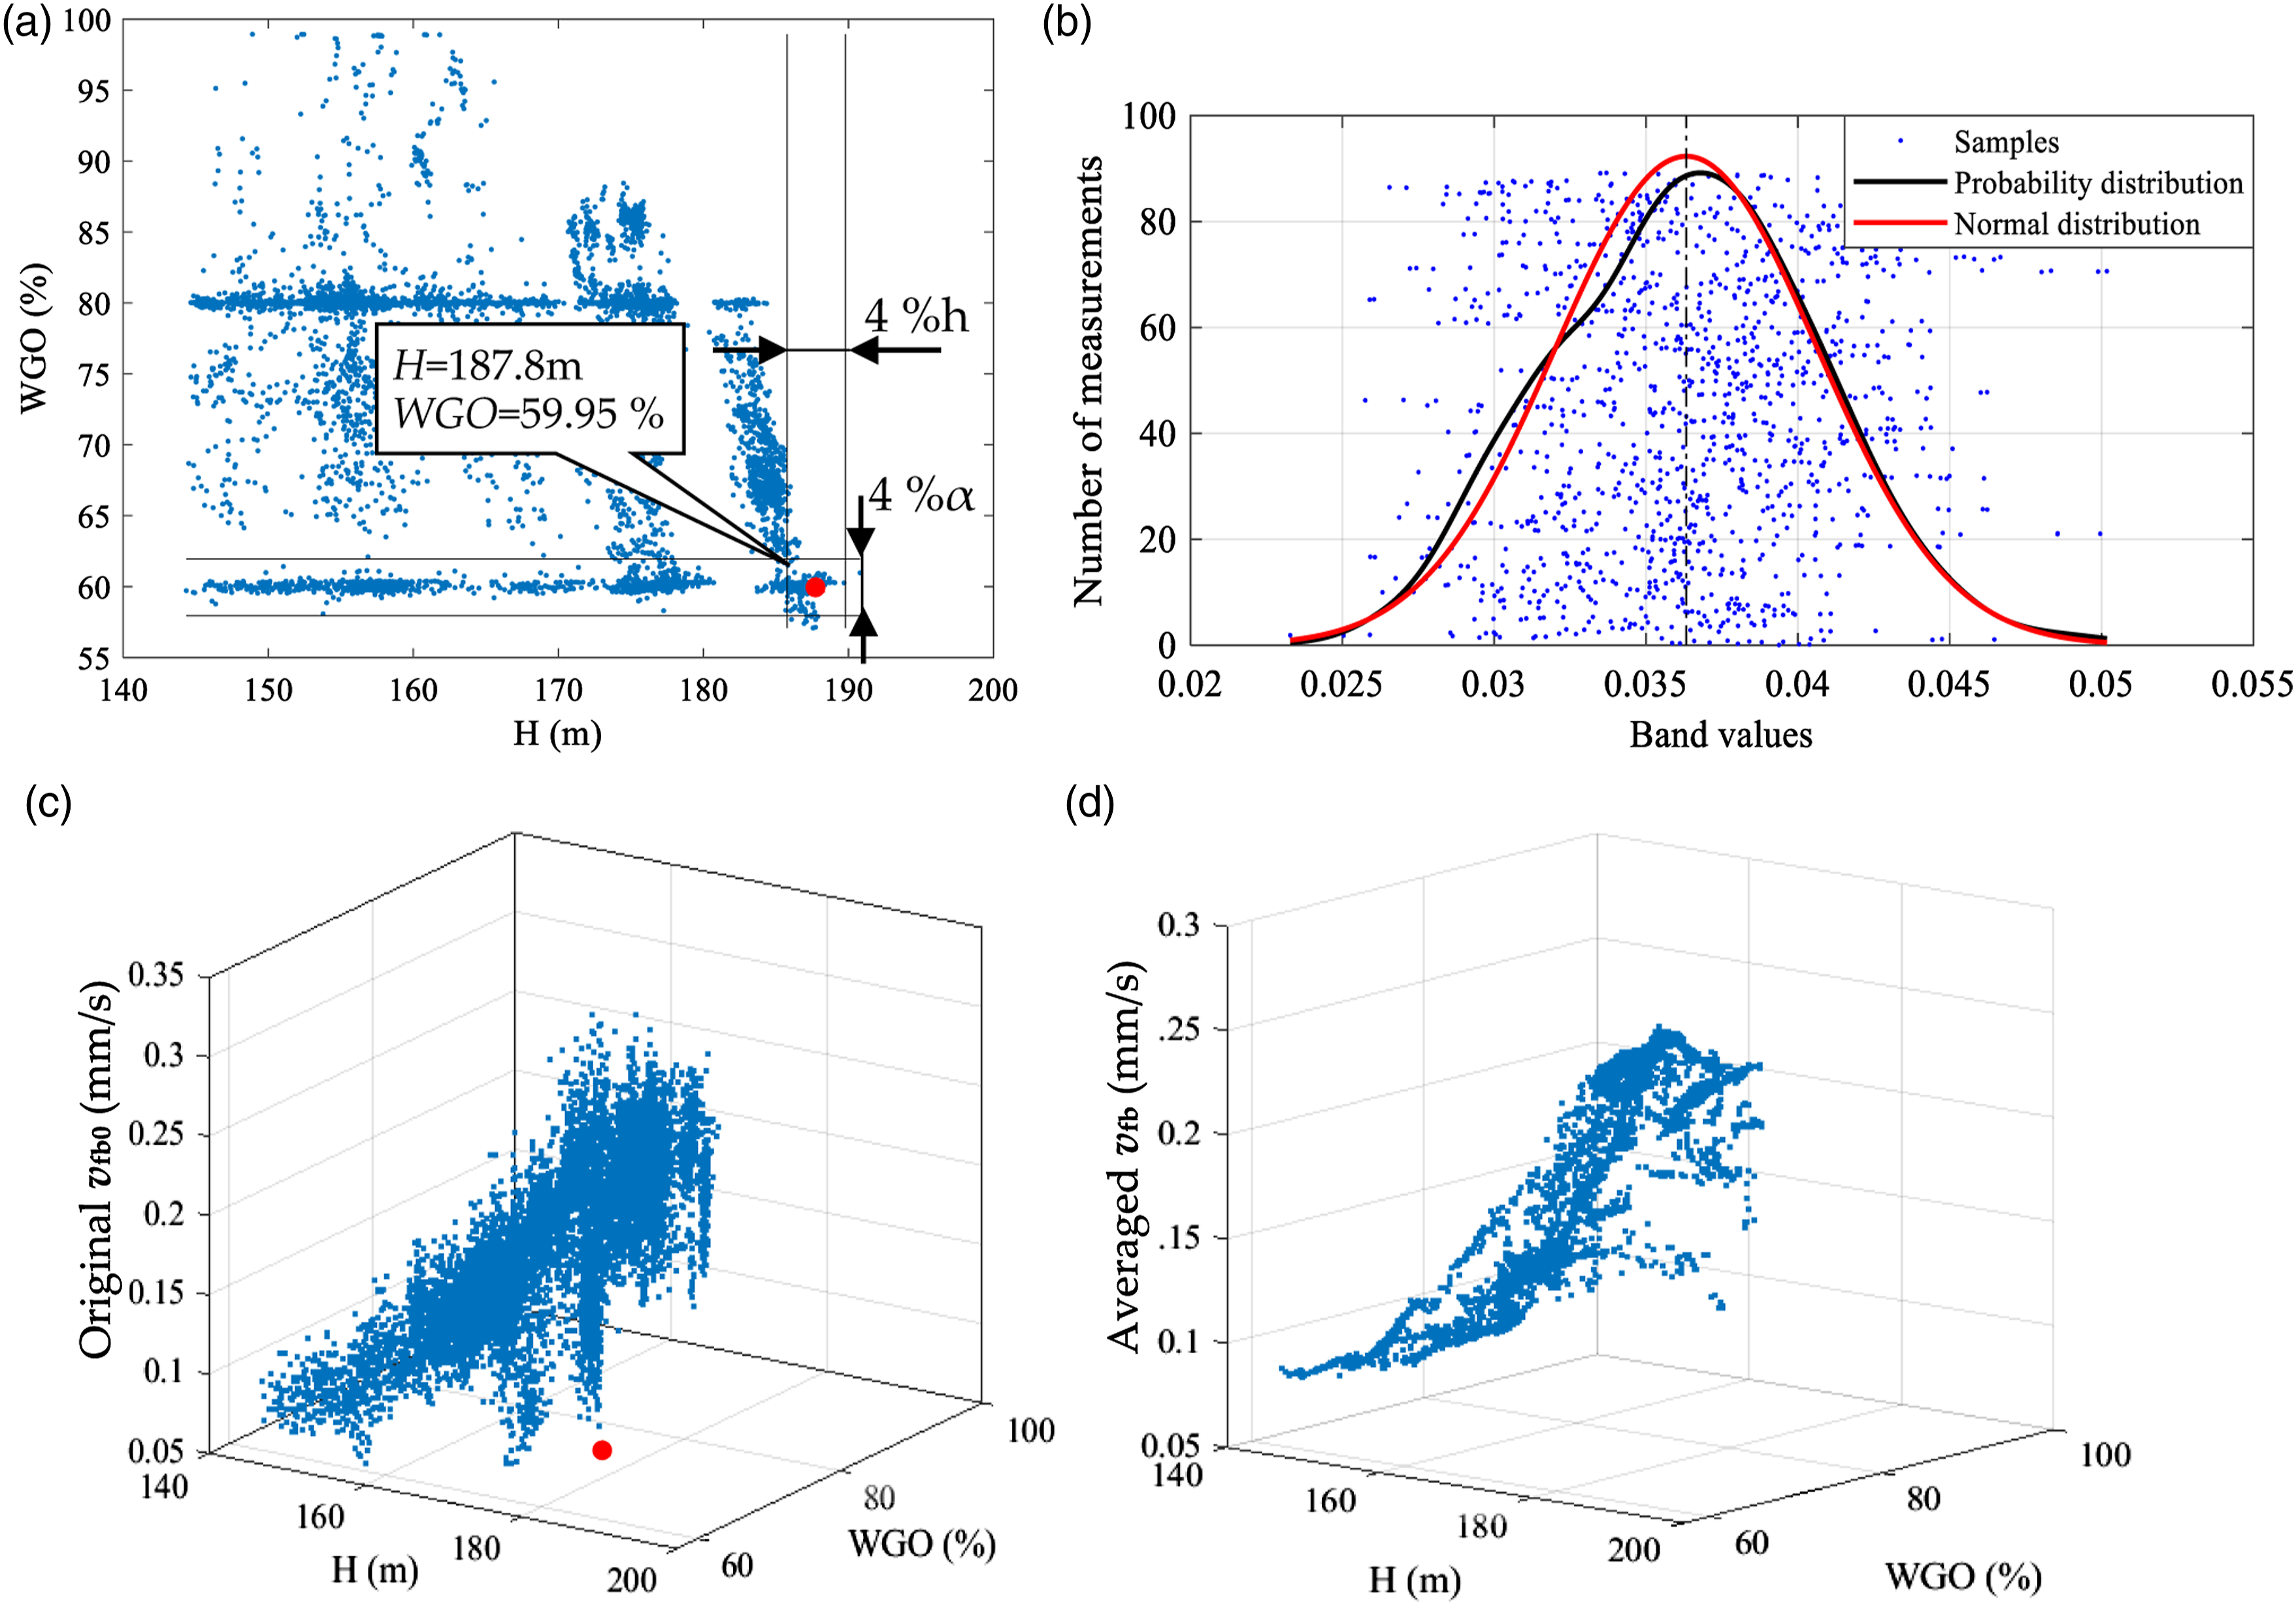
Once the indicators have been averaged an Artificial Neural Network is used in order to obtain the Vibrational Hill Chart surface. This ANN has the input layer (Head, WGO and biases) and a hidden layer with n neurons. It has been proven that a neural network with one hidden layer is able to fit any continuous C1 function
29
so only one hidden layer is used. The input data H and WGO has been normalized in order to remove the scale effects of each parameter. In the output the averaged indicator is used (Figure 5). Note that for the fitting process of each indicator an ANN is needed. Architecture of the fitting Artificial Neural Networks for each condition indicator.
The data is divided into three groups: training set, validation set, and testing set, which account for 70%, 15%, and 15% of the whole samples, respectively. Levenberg–Marquardt (LM) backpropagation function is chosen as the training algorithm. This training method has a fast convergence speed on training process of middle-sized feedforward networks. 30
After the training process, the ANN is able to generate a surface (Vibration Hill Chart) for the full operating range. This is done by introducing in the inputs several combinations of H, WGO laying in the operating range of the unit. For example, according to Figures 4, 30 uniformly distributed values for H a) Vibrational Hill Chart surface; b) Vibrational Hill Chart and its corresponding alarm and trip levels.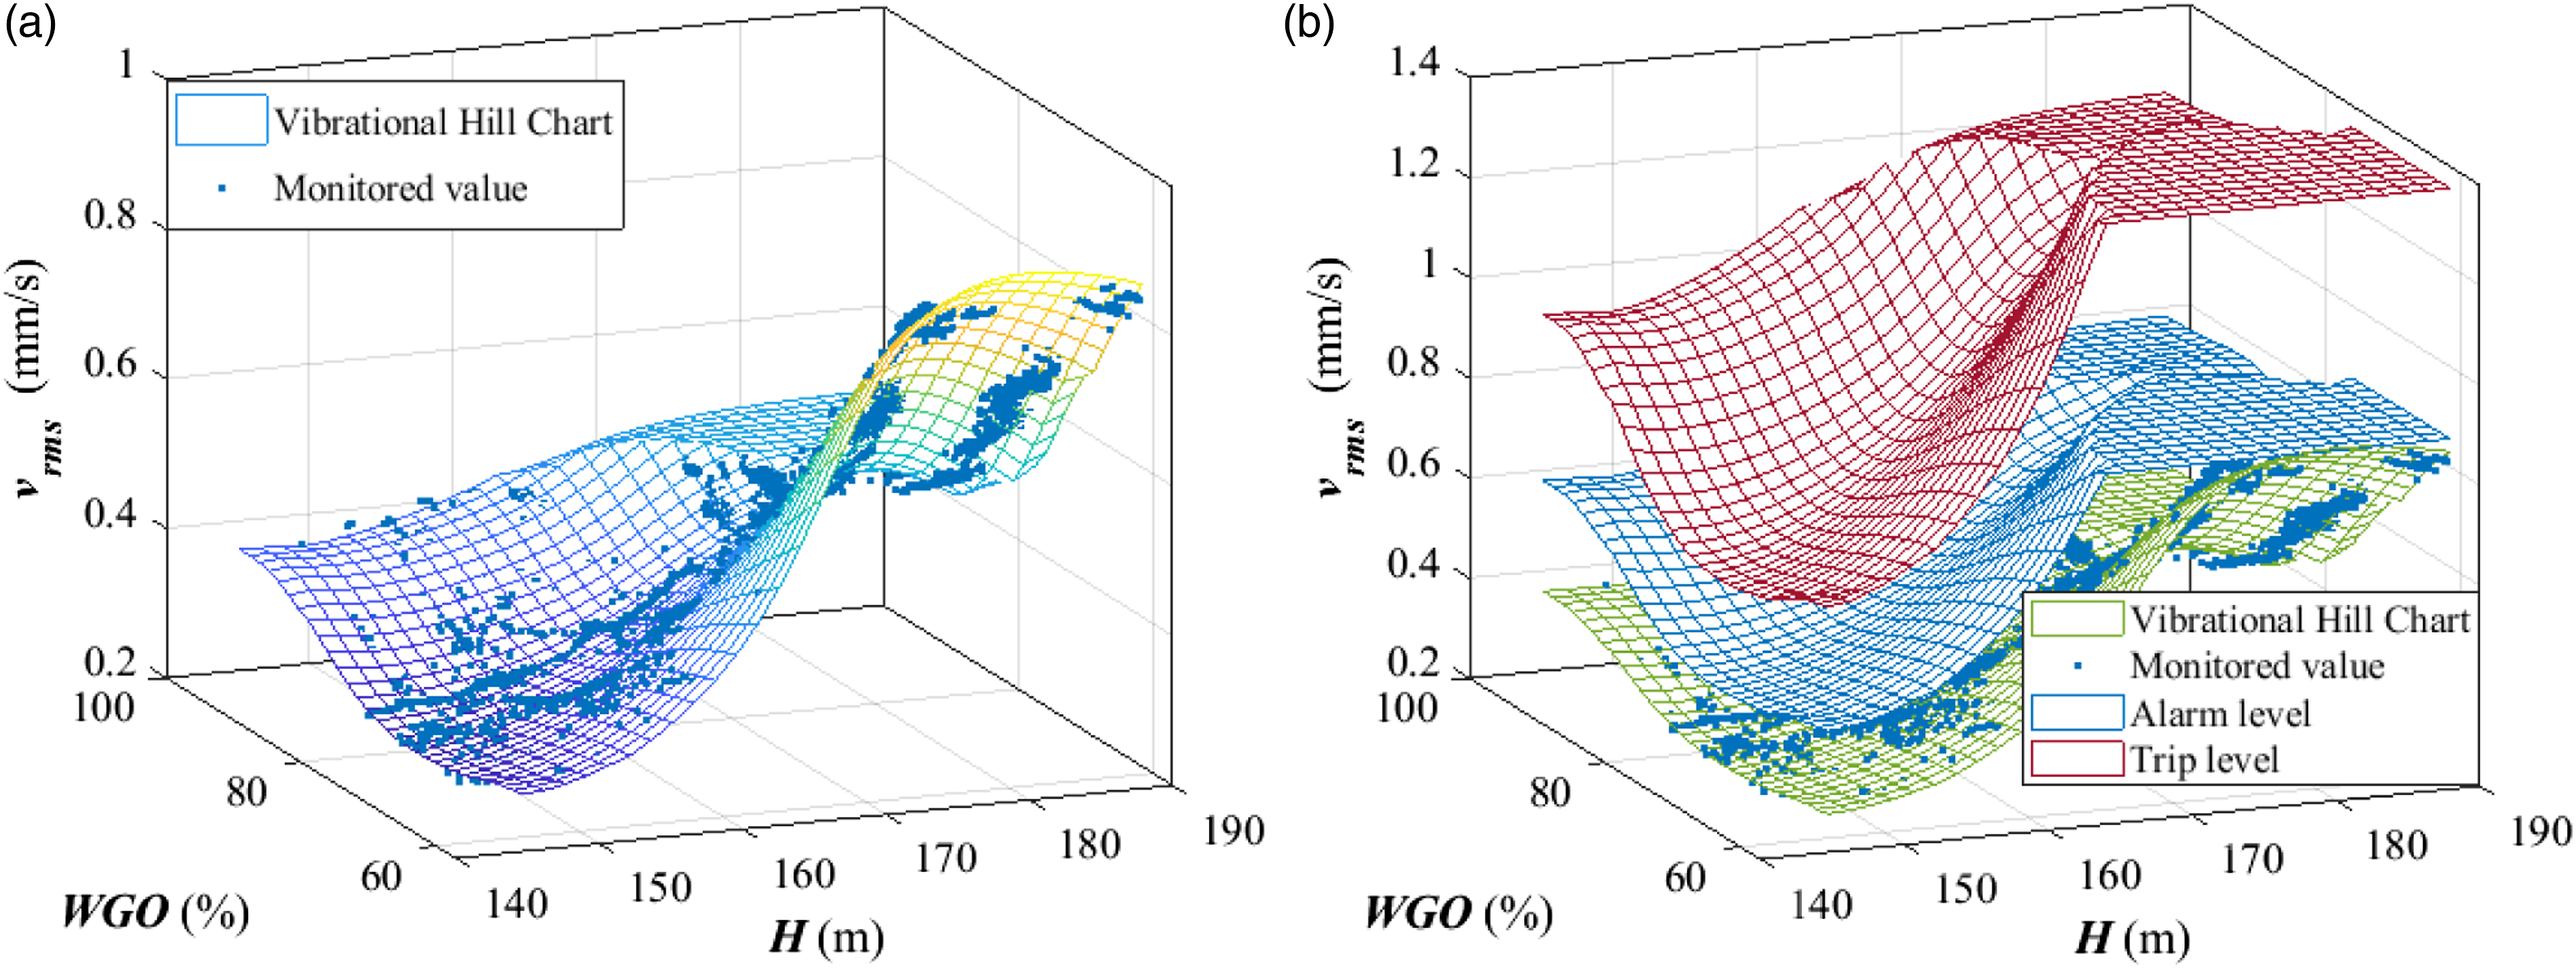
Definition of the alarm and trip levels according to the Vibrational Hill Chart
Based on the surface generated for every Condition Indicator, the alarm level B
a
and trip level B
t
are defined as

Case study
System description
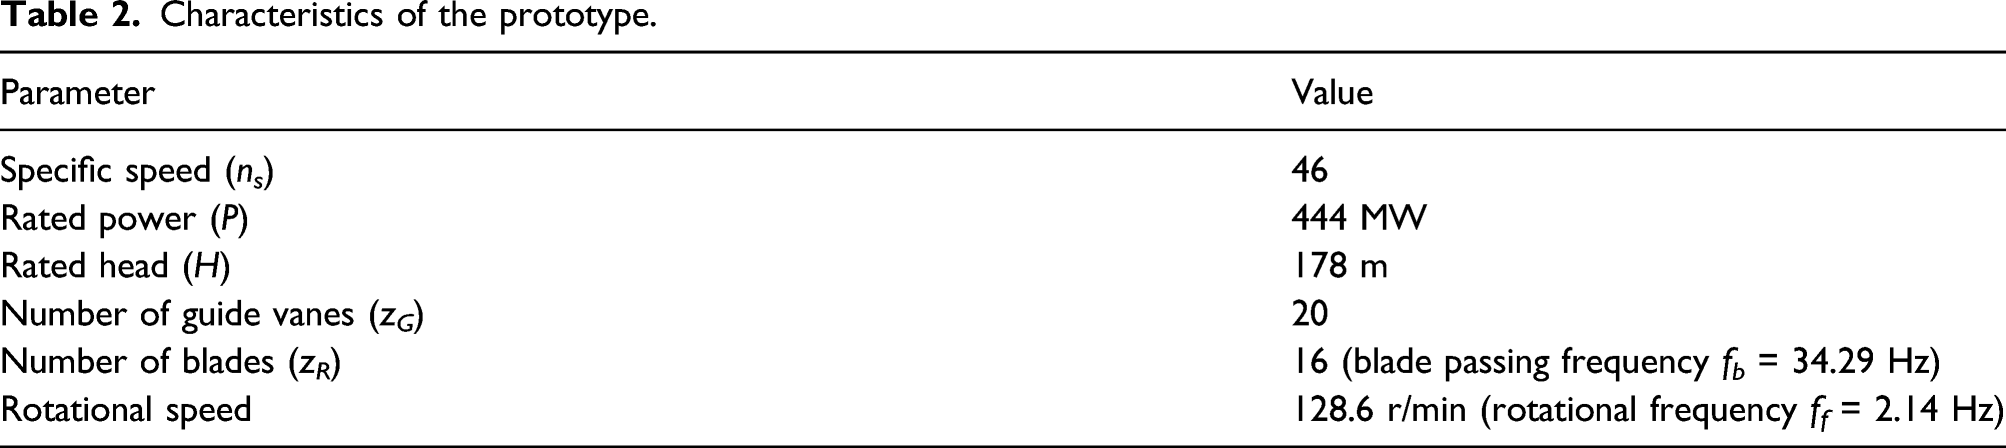
Characteristics of the prototype.
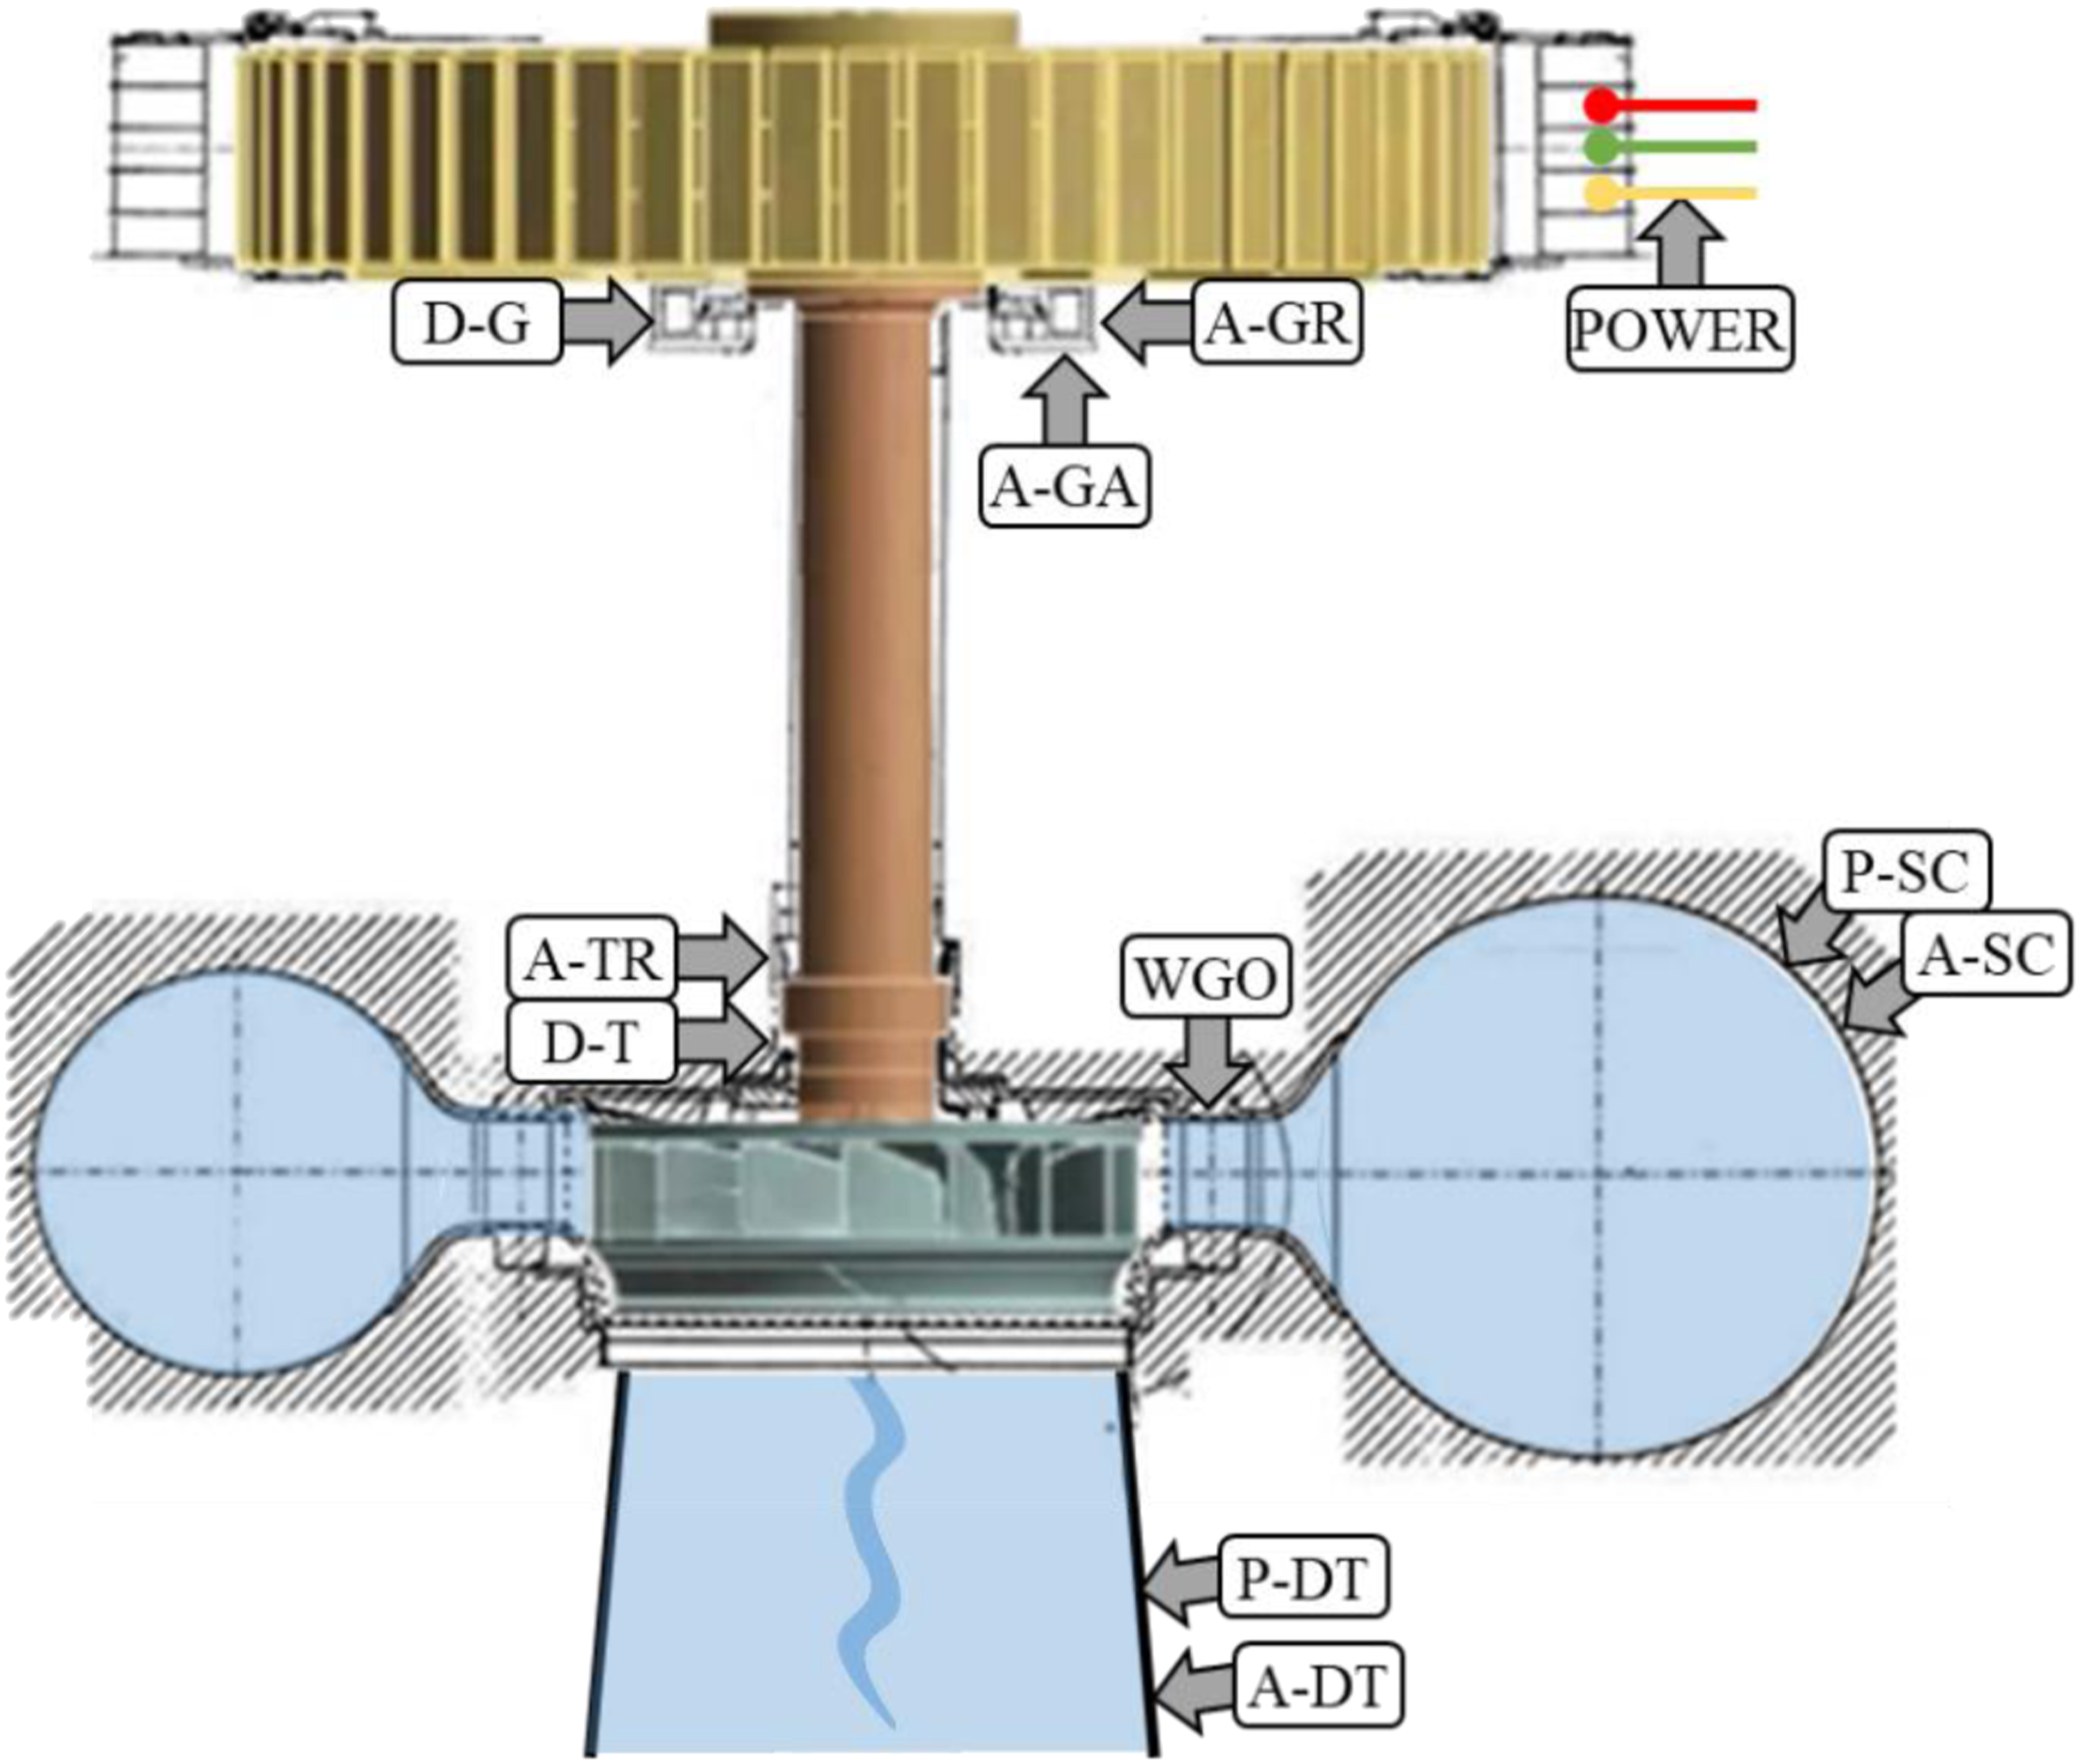
Structure of the machine and location of the sensors.
The machine has been monitored for 2.5 years. Figure 8 shows the cumulated operating hours of the unit as turbine for each month based on the acquired data. This unit operates sometimes as a synchronous condenser (for reactive power compensation), but for the study of this paper, these conditions have been removed as they are not representative of the normal operation mode (H and WGO are not defined in synchronous condenser mode). Operation hours for each month.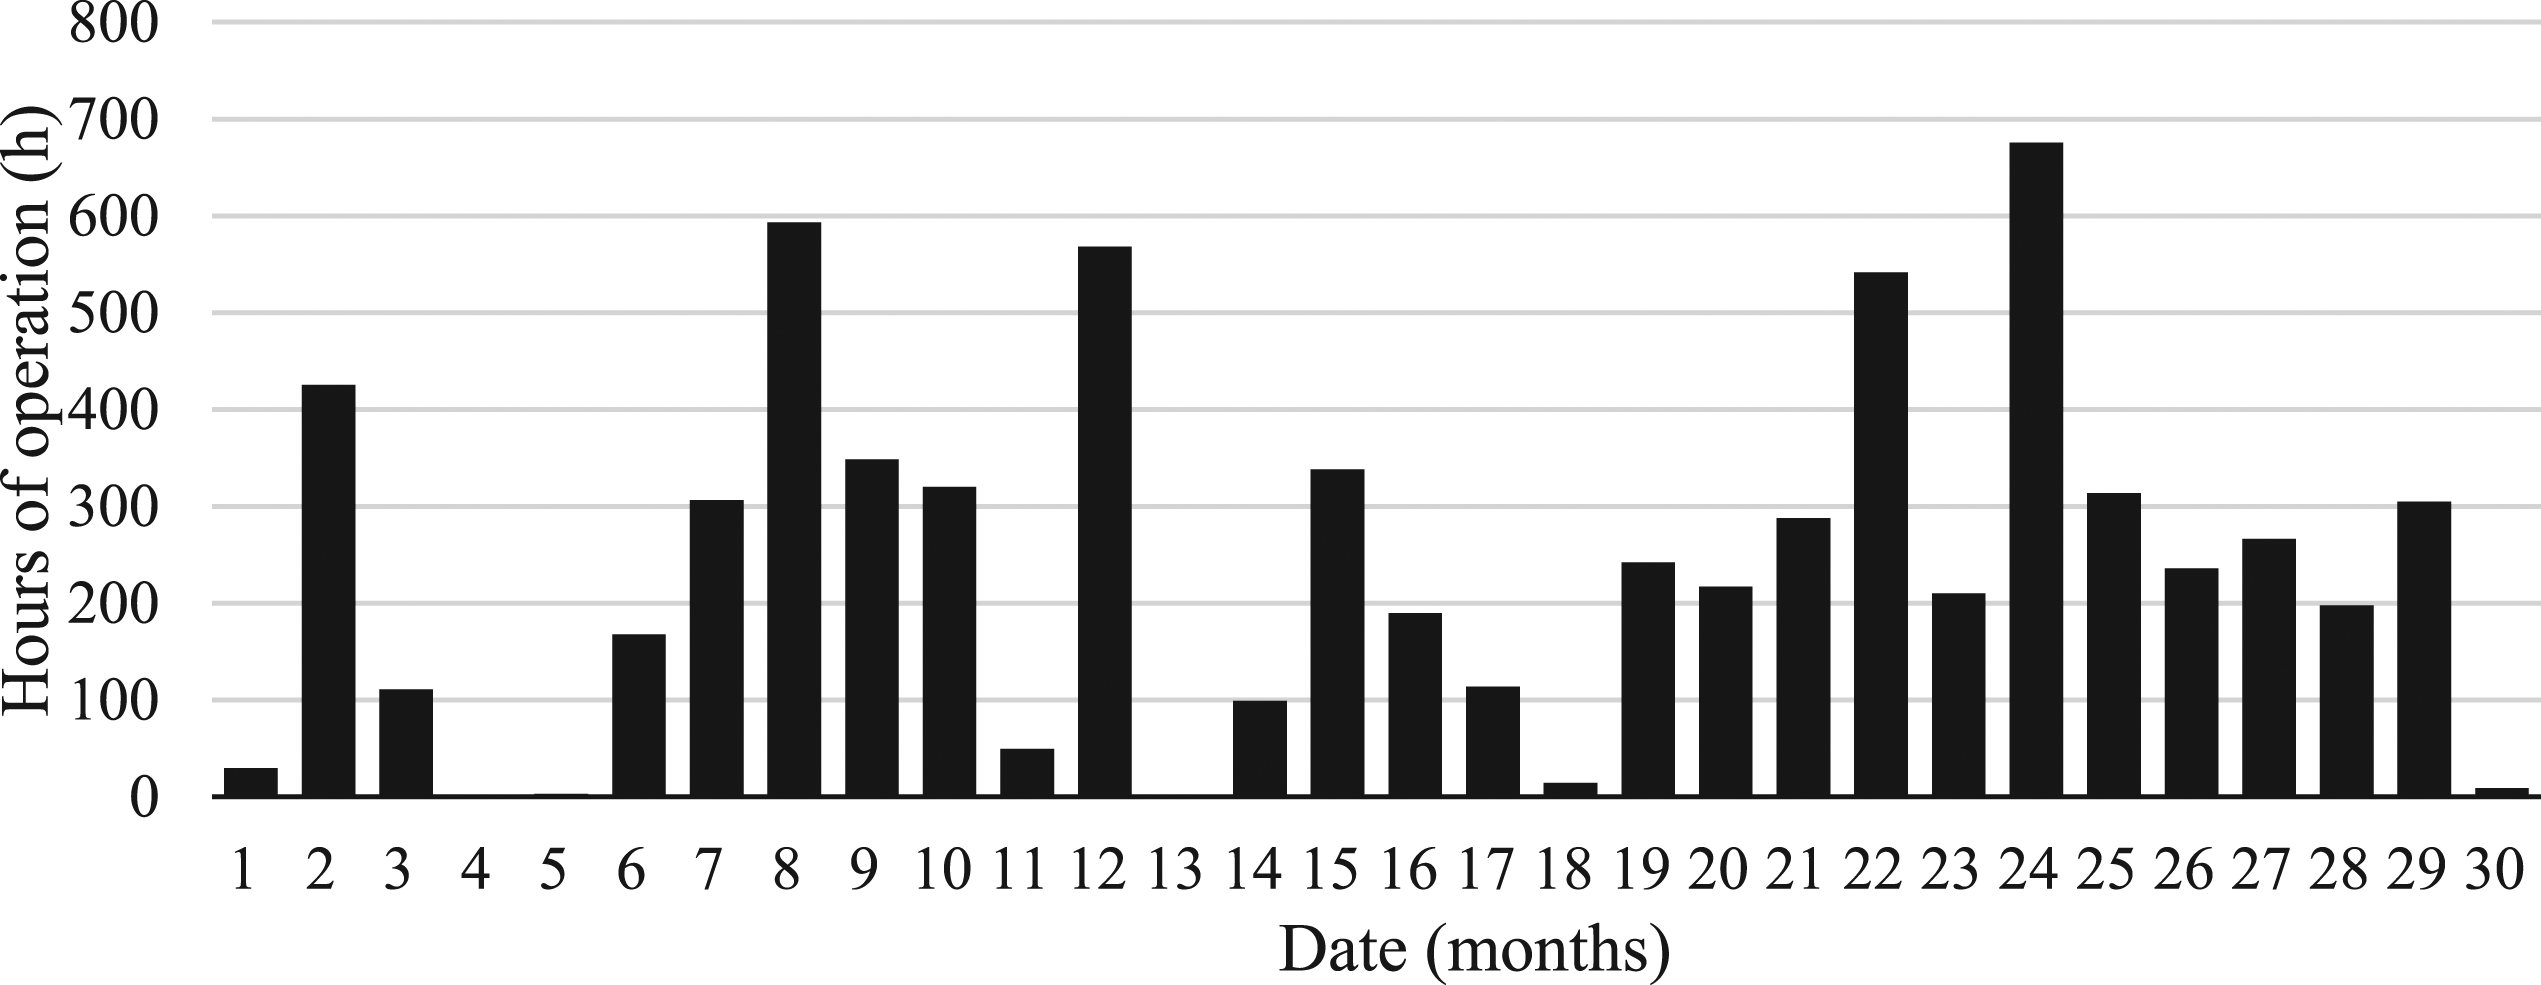
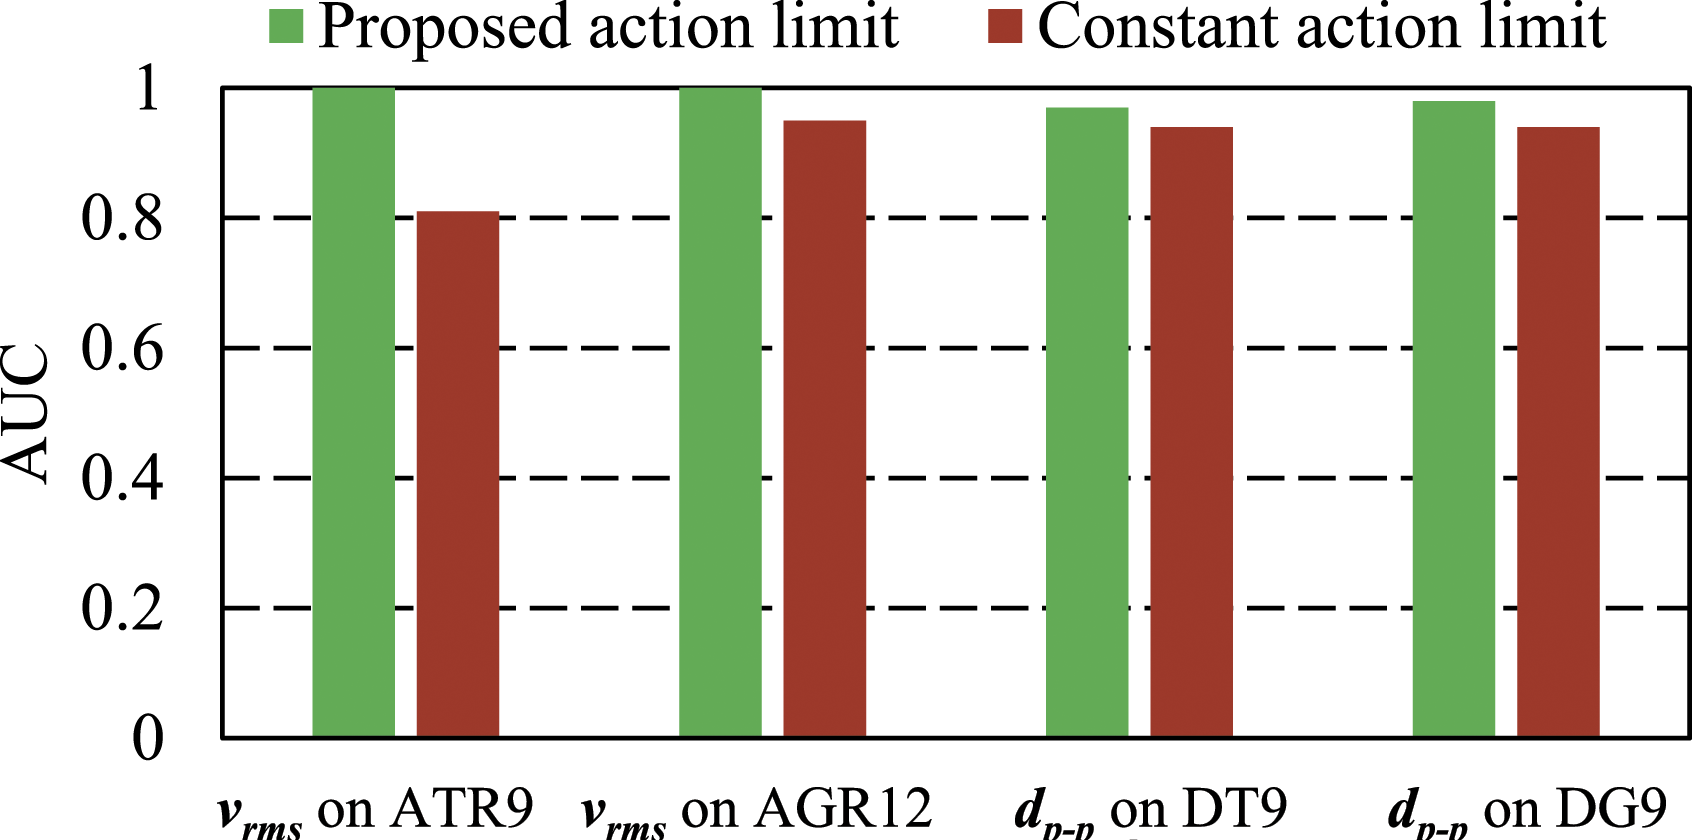
Sensors used in this study. Characteristics of the time signal and frequency spectrum.
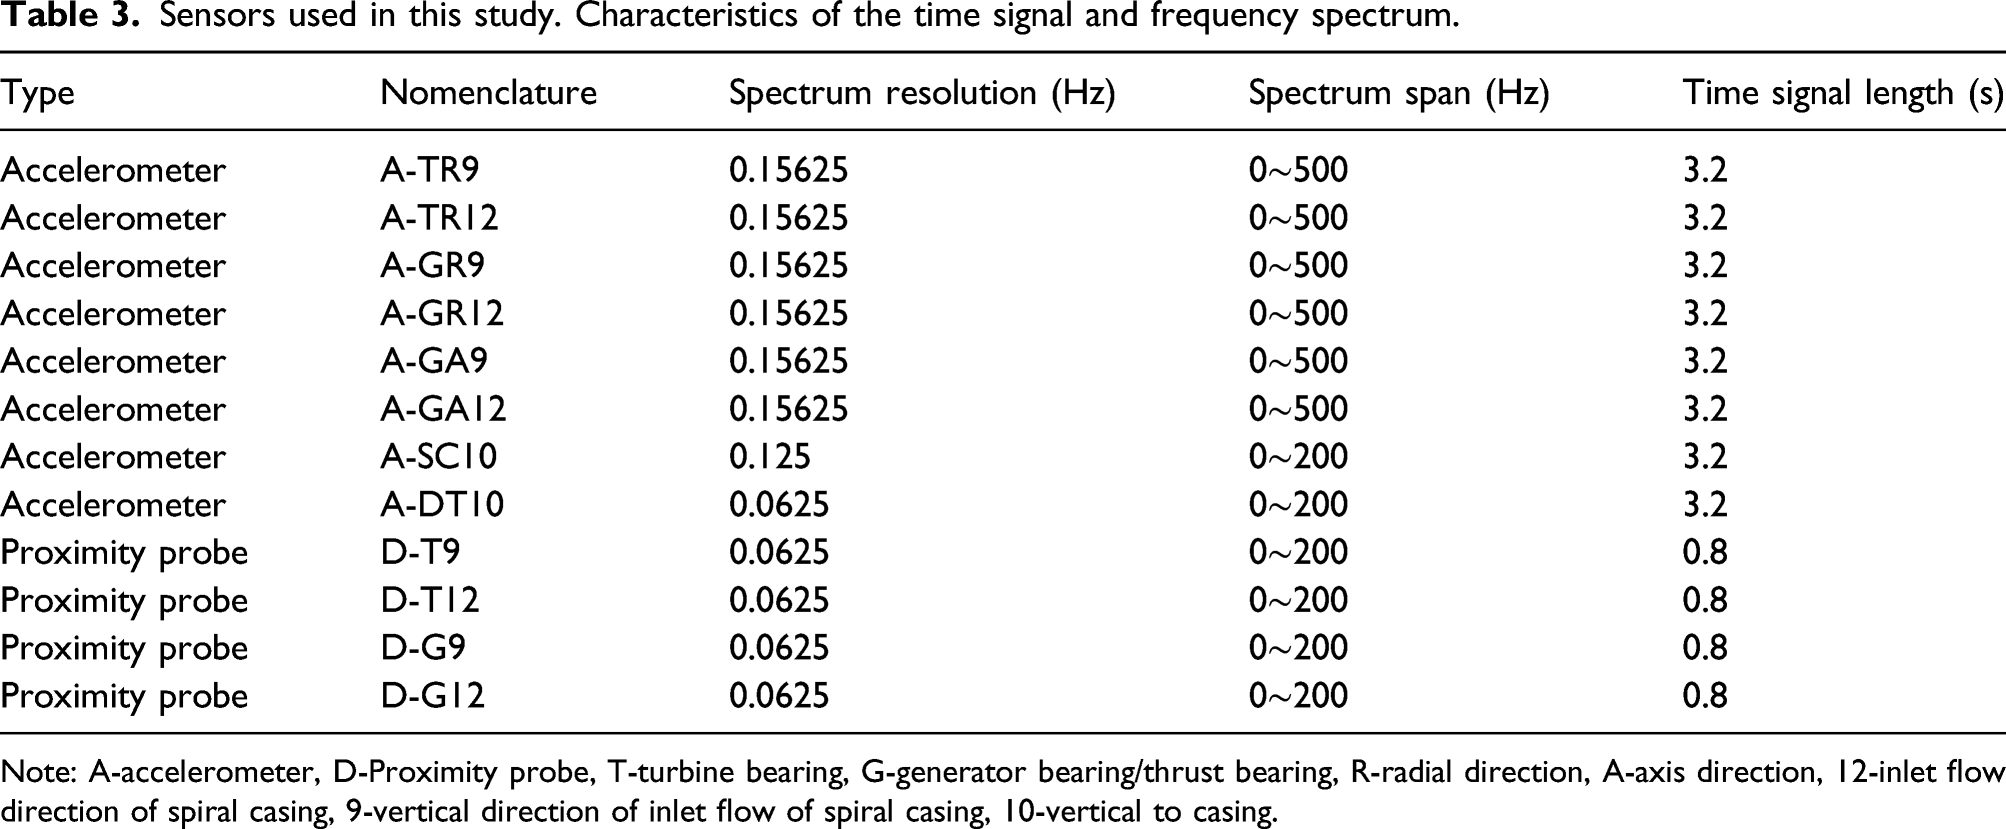
Note: A-accelerometer, D-Proximity probe, T-turbine bearing, G-generator bearing/thrust bearing, R-radial direction, A-axis direction, 12-inlet flow direction of spiral casing, 9-vertical direction of inlet flow of spiral casing, 10-vertical to casing.
Implementation of proposed multidimensional Vibrational Hill Chart in the acquired data
As mentioned before, only the points corresponding to turbine operation have been considered (Figure 9). Although the operating points corresponding to the synchronous condenser mode show some WGO value, this has not a physical meaning as the wicket gates are not used to regulate the flowrate during this operation (unit surrounded by compressed air). Turbine mode and synchronous condenser mode in wicket gate opening plot.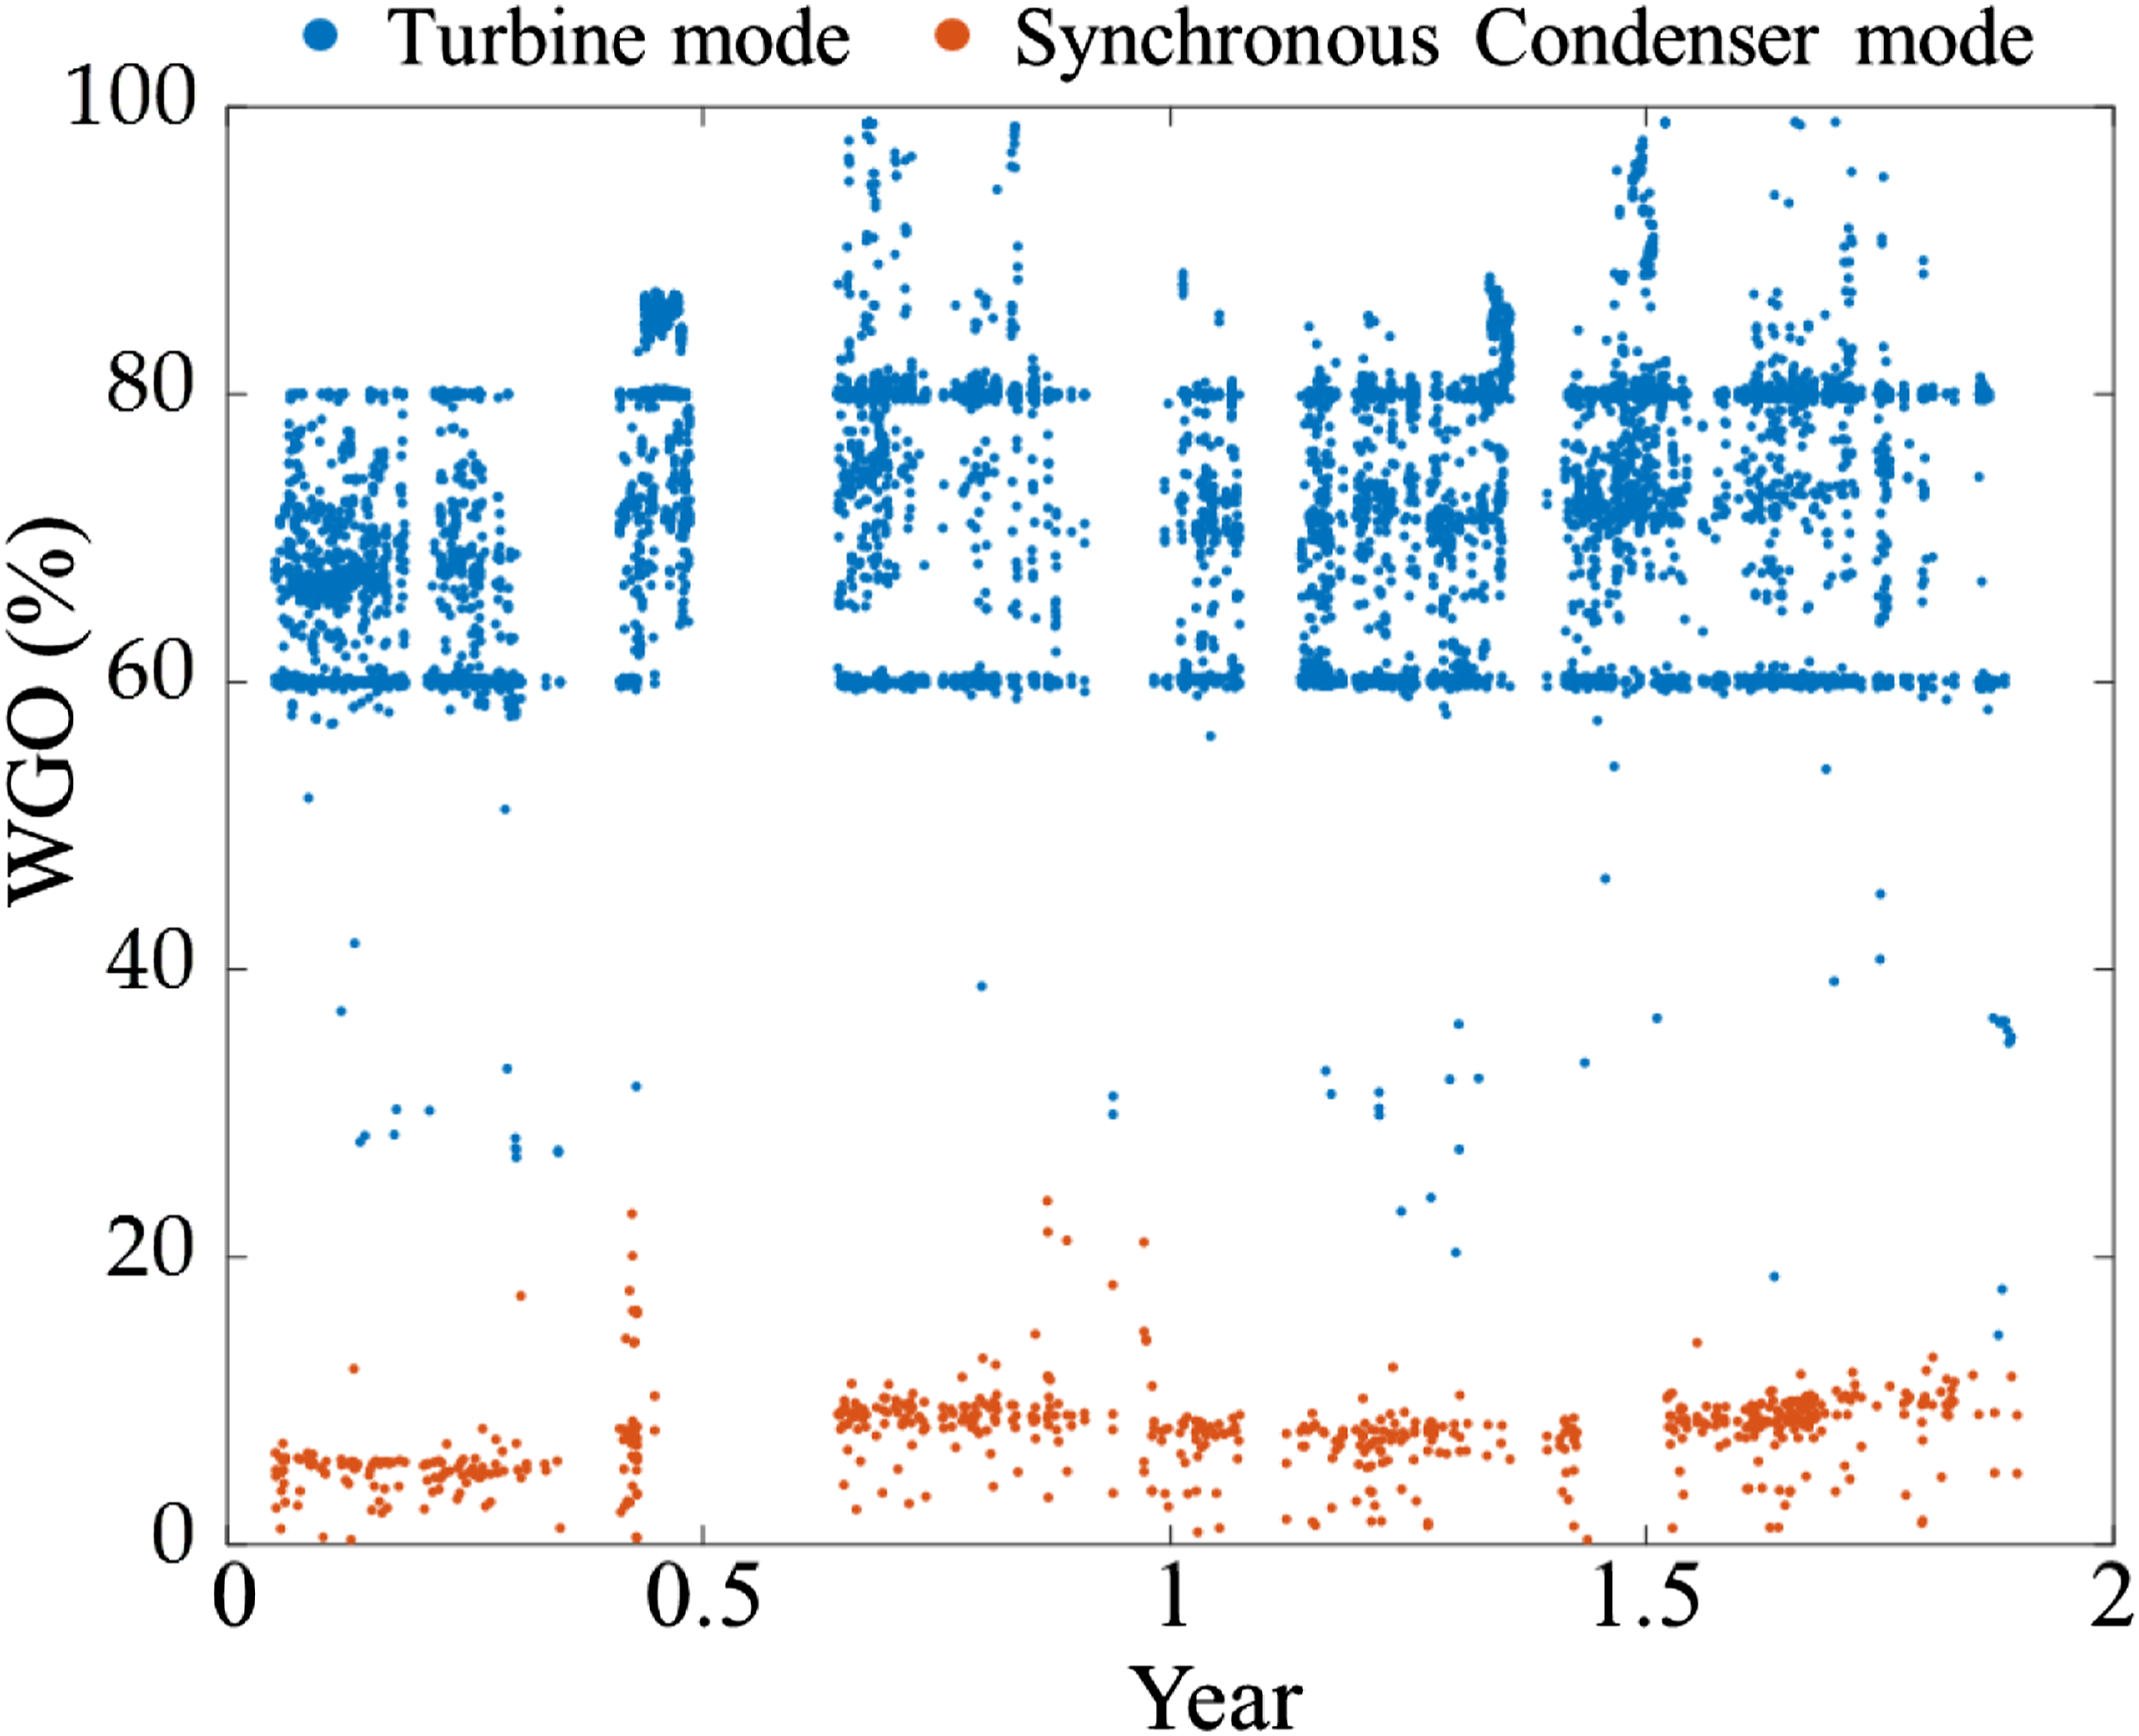
In the database there are also some transient conditions (load changes, power increase after start-up, and power decrease before stop) which have to be eliminated as they are not representative of the vibration levels for steady conditions. Figure 10 shows an example of three different conditions of the database which are transient conditions with a great variation of the mean power. An automatic code checks if the mean power measured during one acquisition (time signal of 8 s for the power) has a relative variation of less than 2%. If this is accomplished, then the measurement is considered as valid and it is used for the generation of the Vibrational Hill Chart. Power signals of three transient conditions.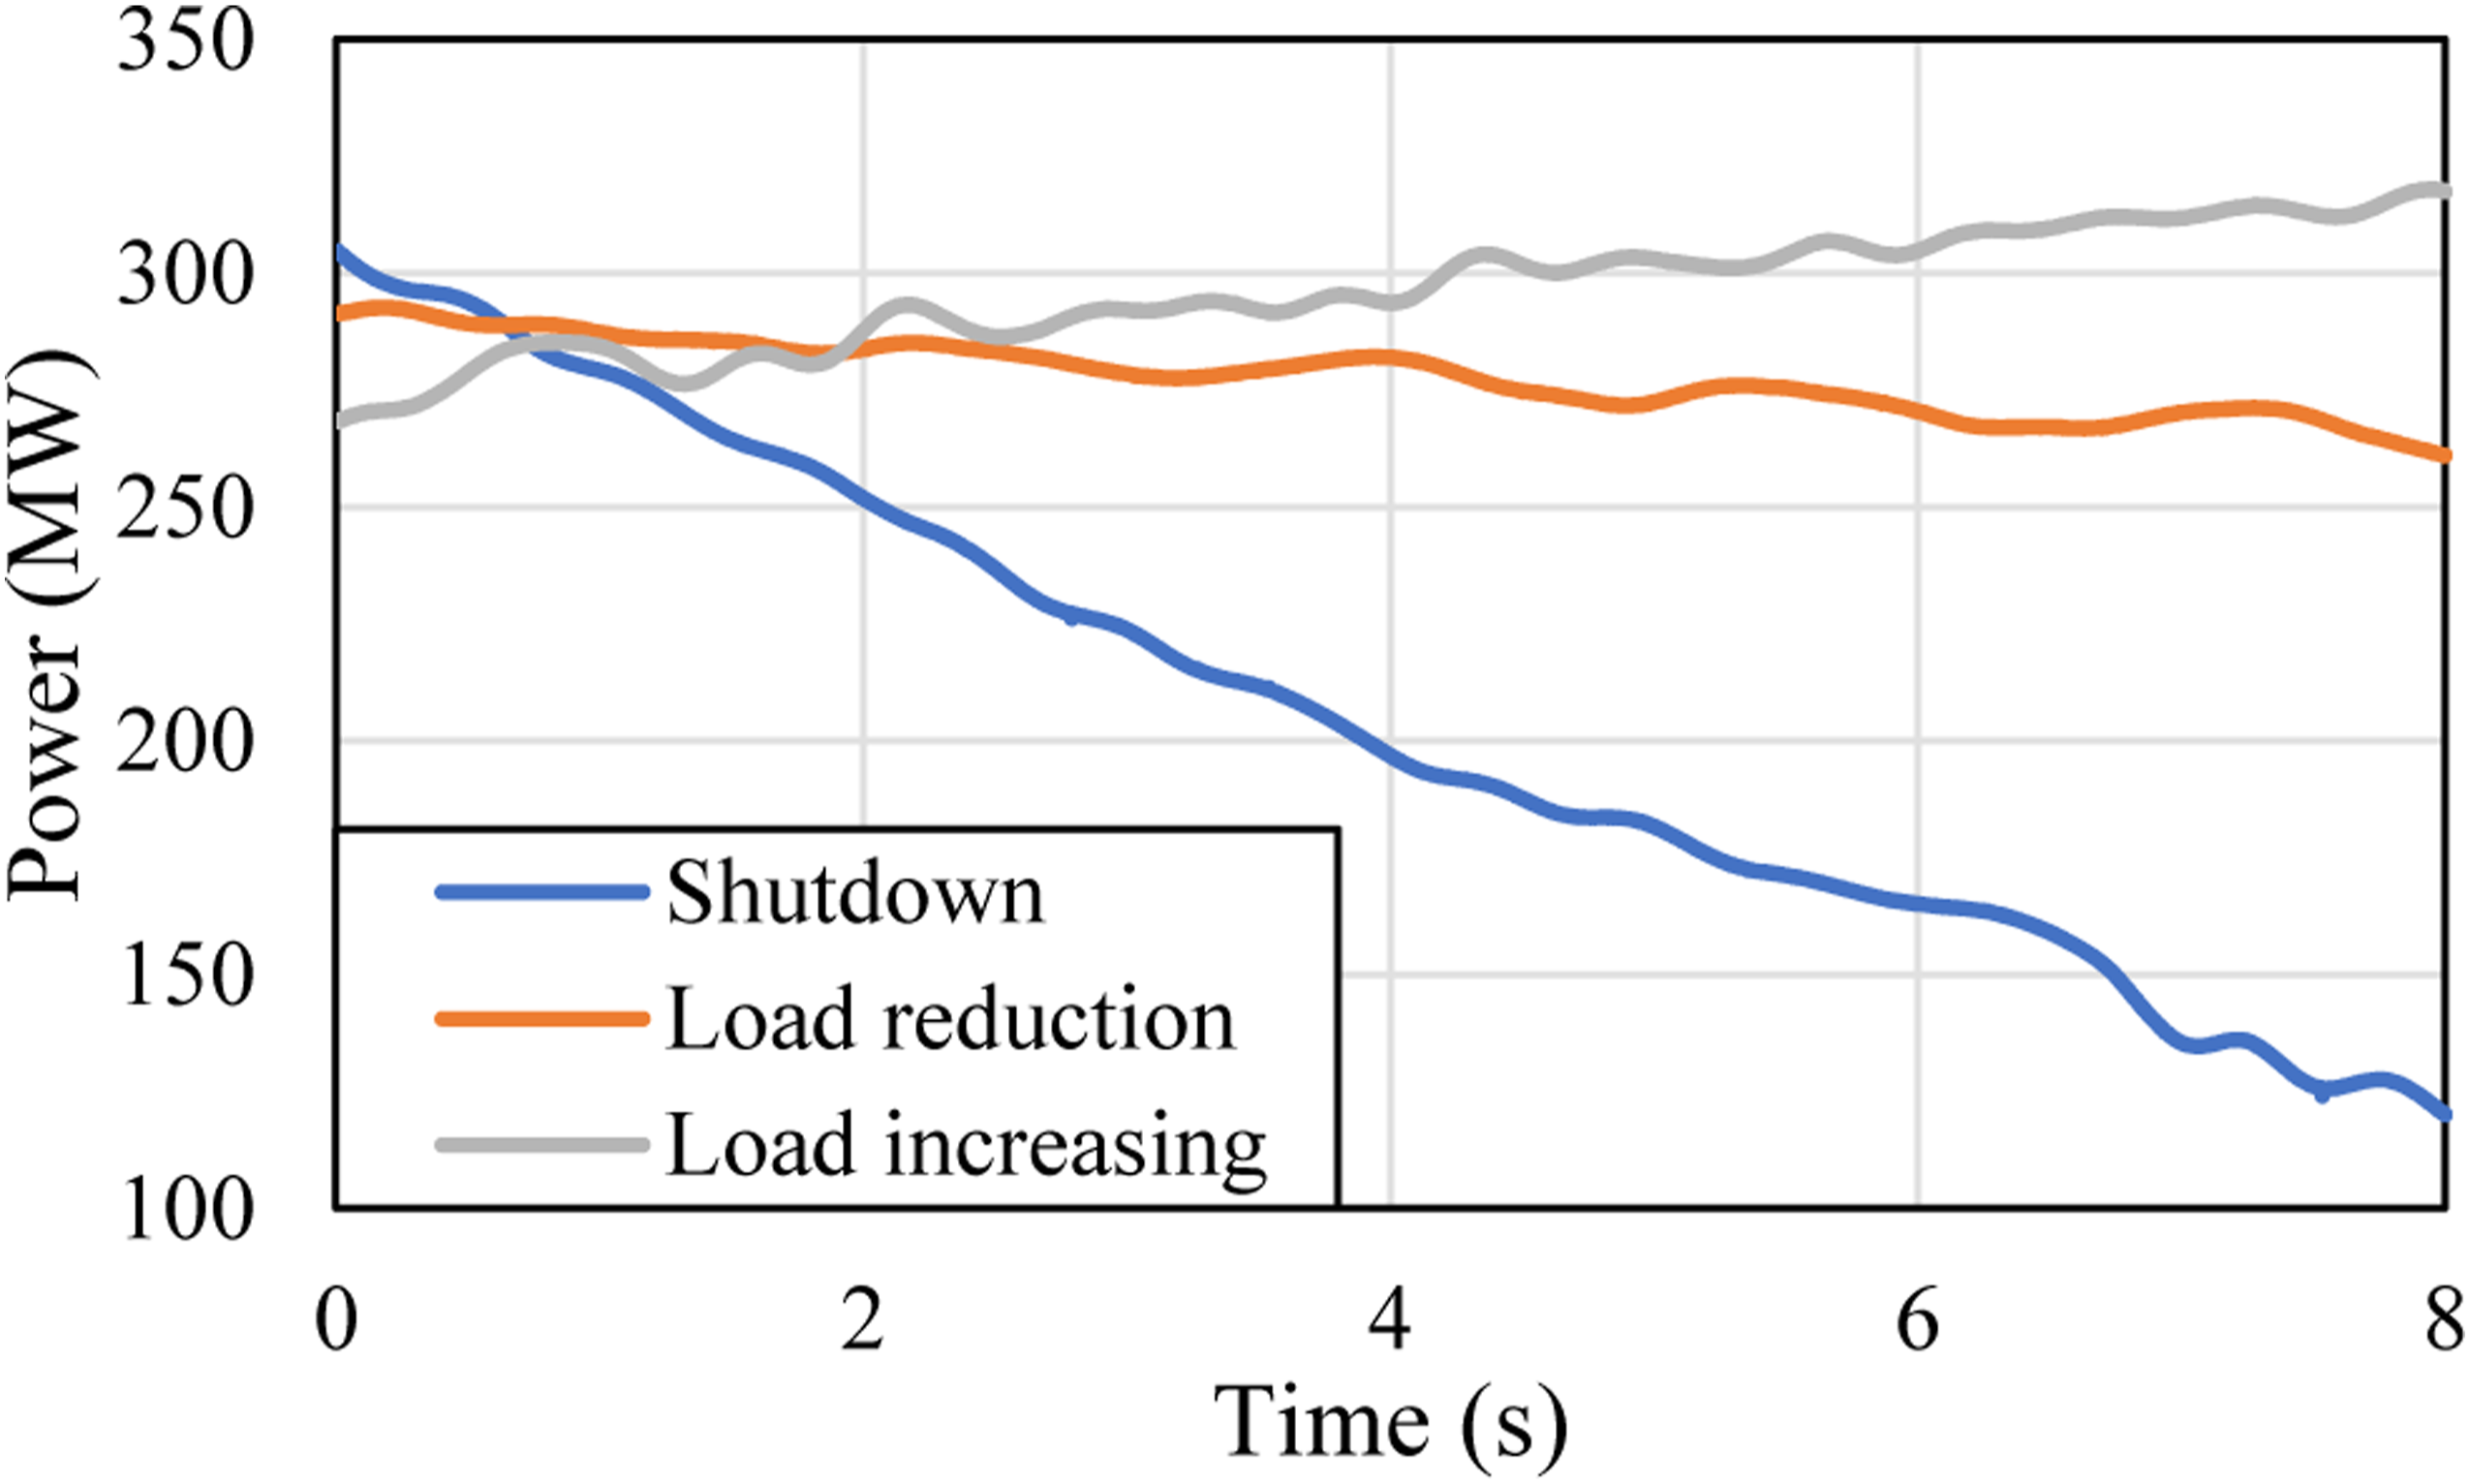
As shown in Figure 11 a, most of the conditions lay on the area 55–100% of the WGO, therefore only the conditions in this area are considered. The final database consists of 6394 records (Figure 11(b)). In the cleaned database, all records are measured under steady-state conditions at normal operating speed. Part load conditions and the researched conditions.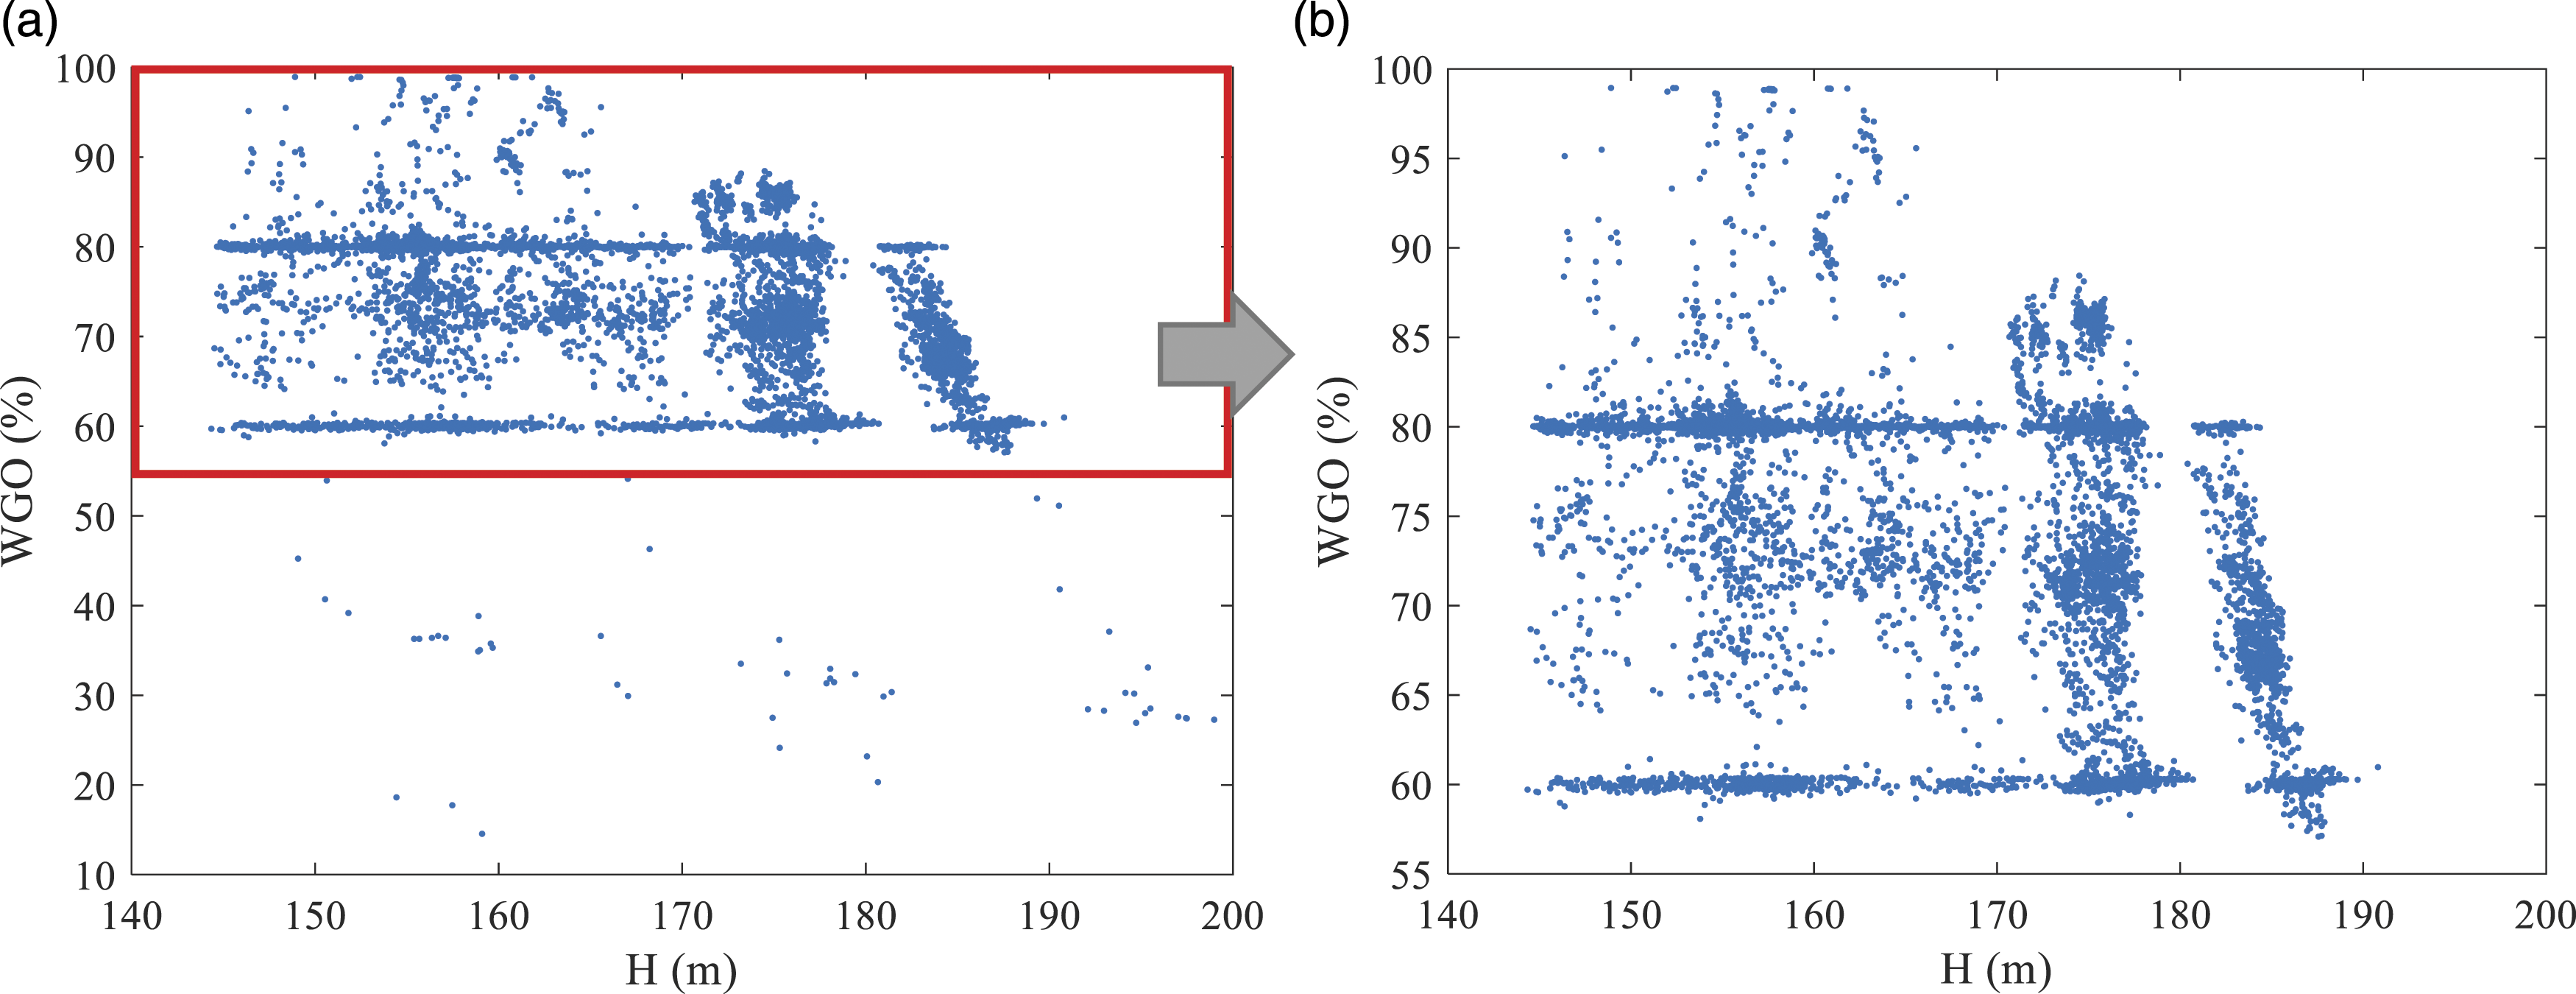
Finally, in the particular case of this database there is a special event that has been considered for the study. During the months April 2016–May 2016 it was a complete overhaul of the unit. After some months of operation, the runner suffered from erosive cavitation both on the inlet and outlet of the blades (Figure 12). The surfaces damaged by the erosive cavitation were repaired and at the end of May 2016 the unit returned to the normal operation until the end of the monitored period (until June 2018). Erosive cavitation on the inlet (left) and outlet (right) of the blades.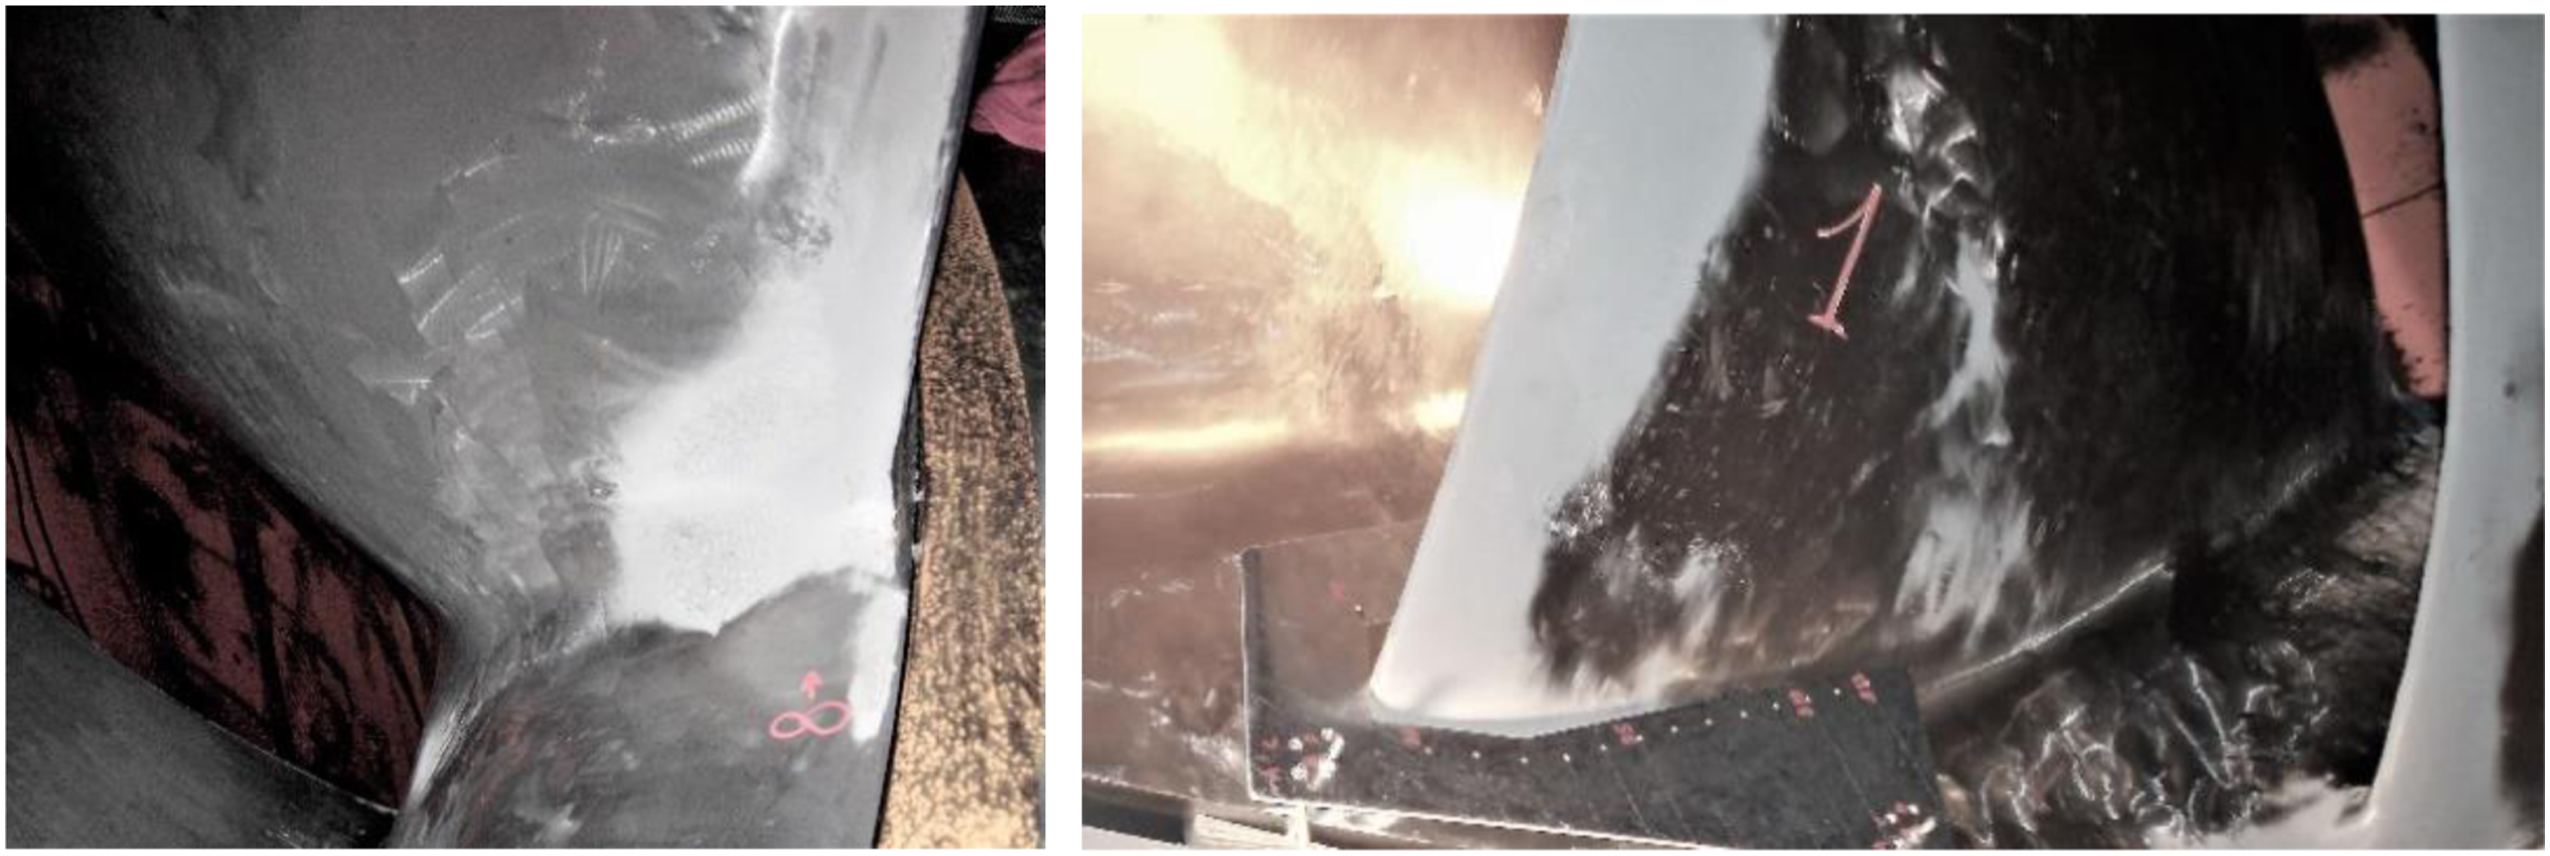
For the generation of the Vibrational Hill Charts only the data after the overhaul has been considered (May 2016–June 2018). In this way the Vibrational Hill Chart is fed only with data of the unit in “normal” condition. In fact, the data before the overhaul (January 2016–March 2016) will be used in Multidimensional analysis based on the Vibrational Hill Chart to discuss the feasibility of detecting potential damages based on the Vibrational Hill Charts.
Vibrational Hill Charts
Absolute bearing vibration and relative shaft displacement
The vibration level Vibrational Hill Chart of 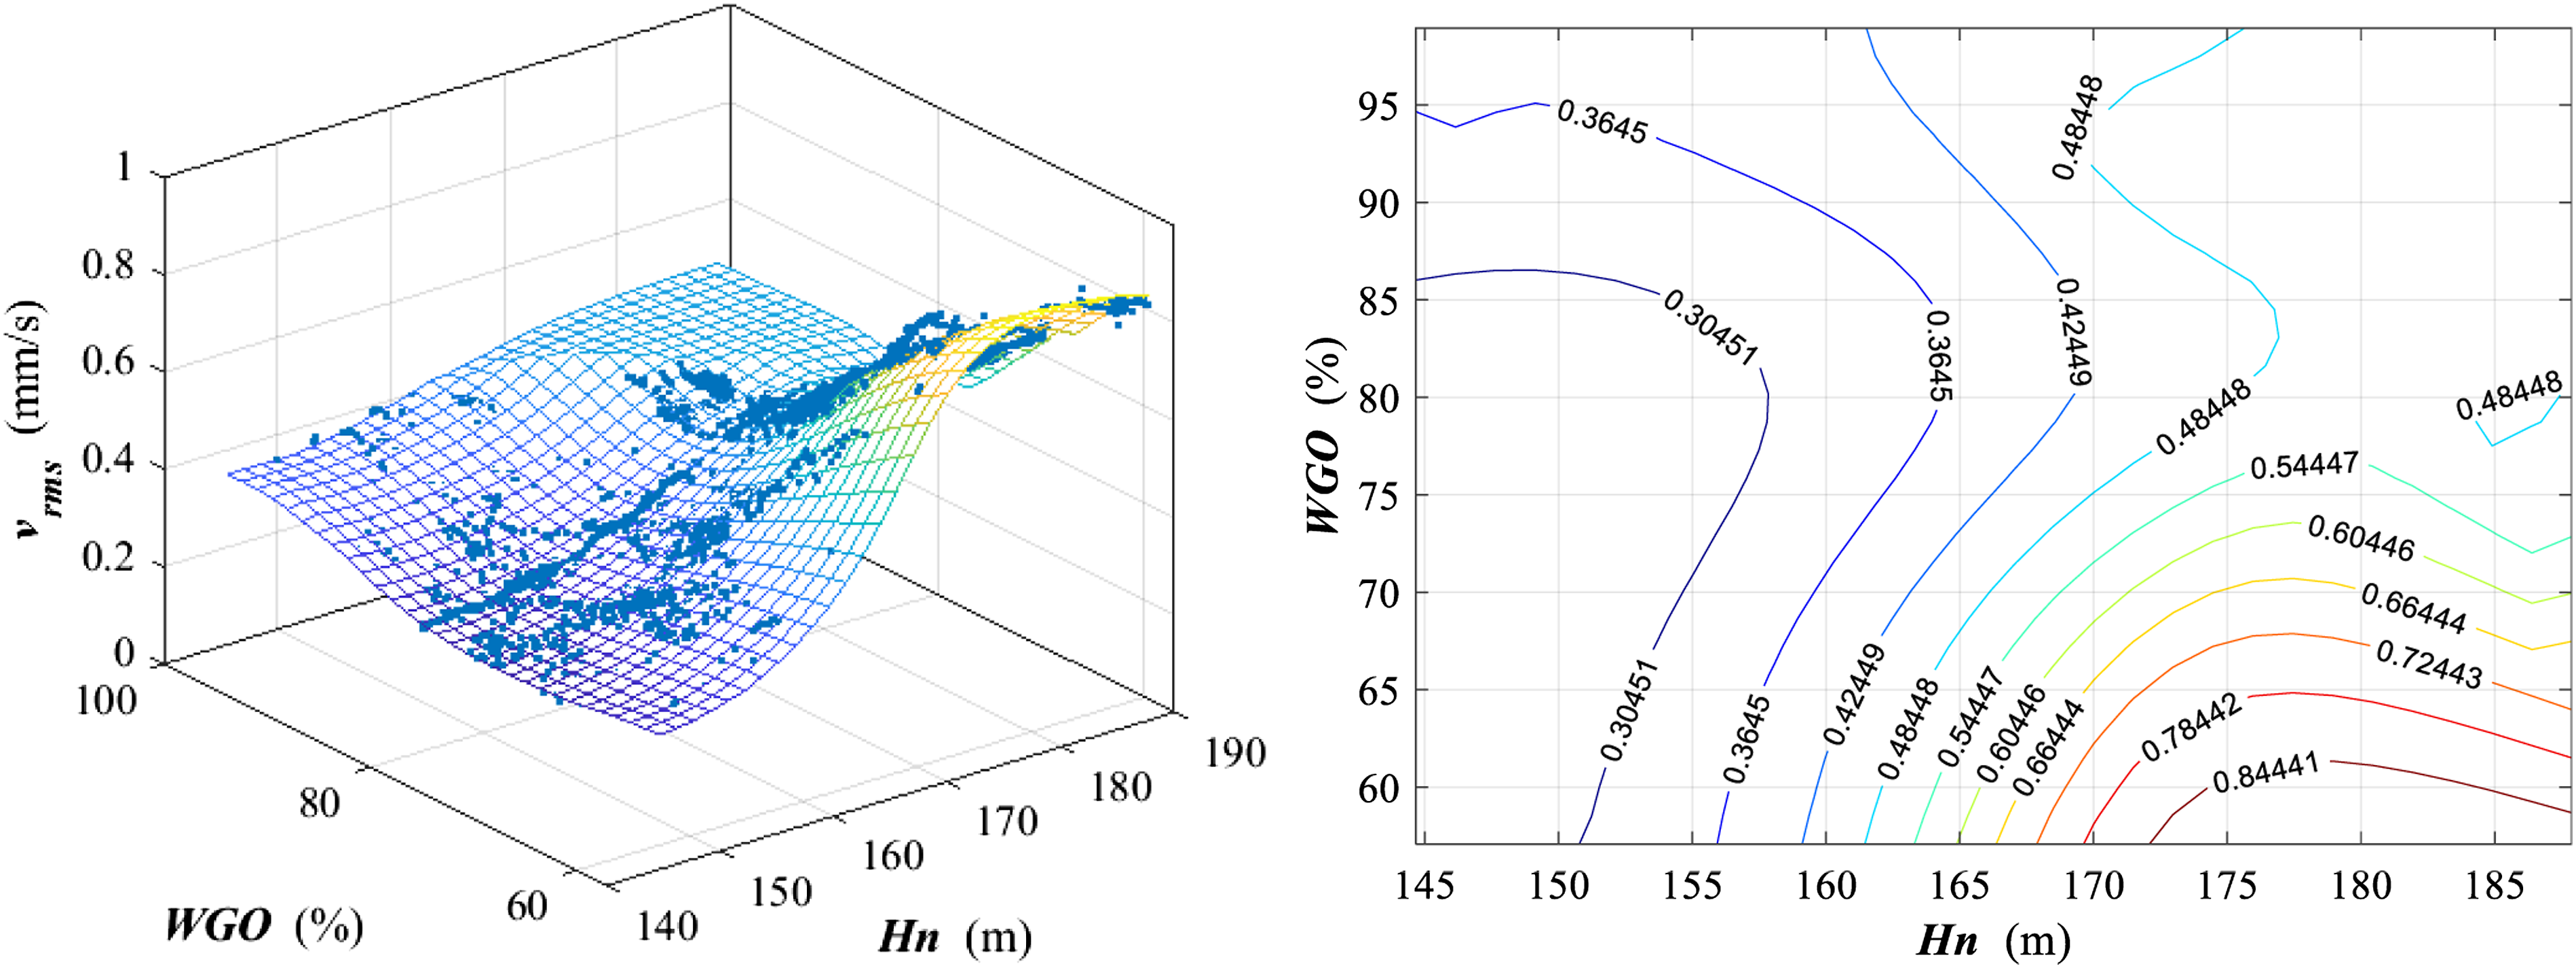
Regarding the overall peak-peak value of the displacement sensor, the generated surface is also below the trip and alarm levels recommended by the standard. The surface shows a relatively constant level for high loads and a significant increase at part load (WGO close to 60%) independently of the head. Again, the explanation lies on the vortex rope which generates a precession motion on the shaft that can be clearly detected with a displacement sensor (Figure 14). Vibrational Hill Chart of 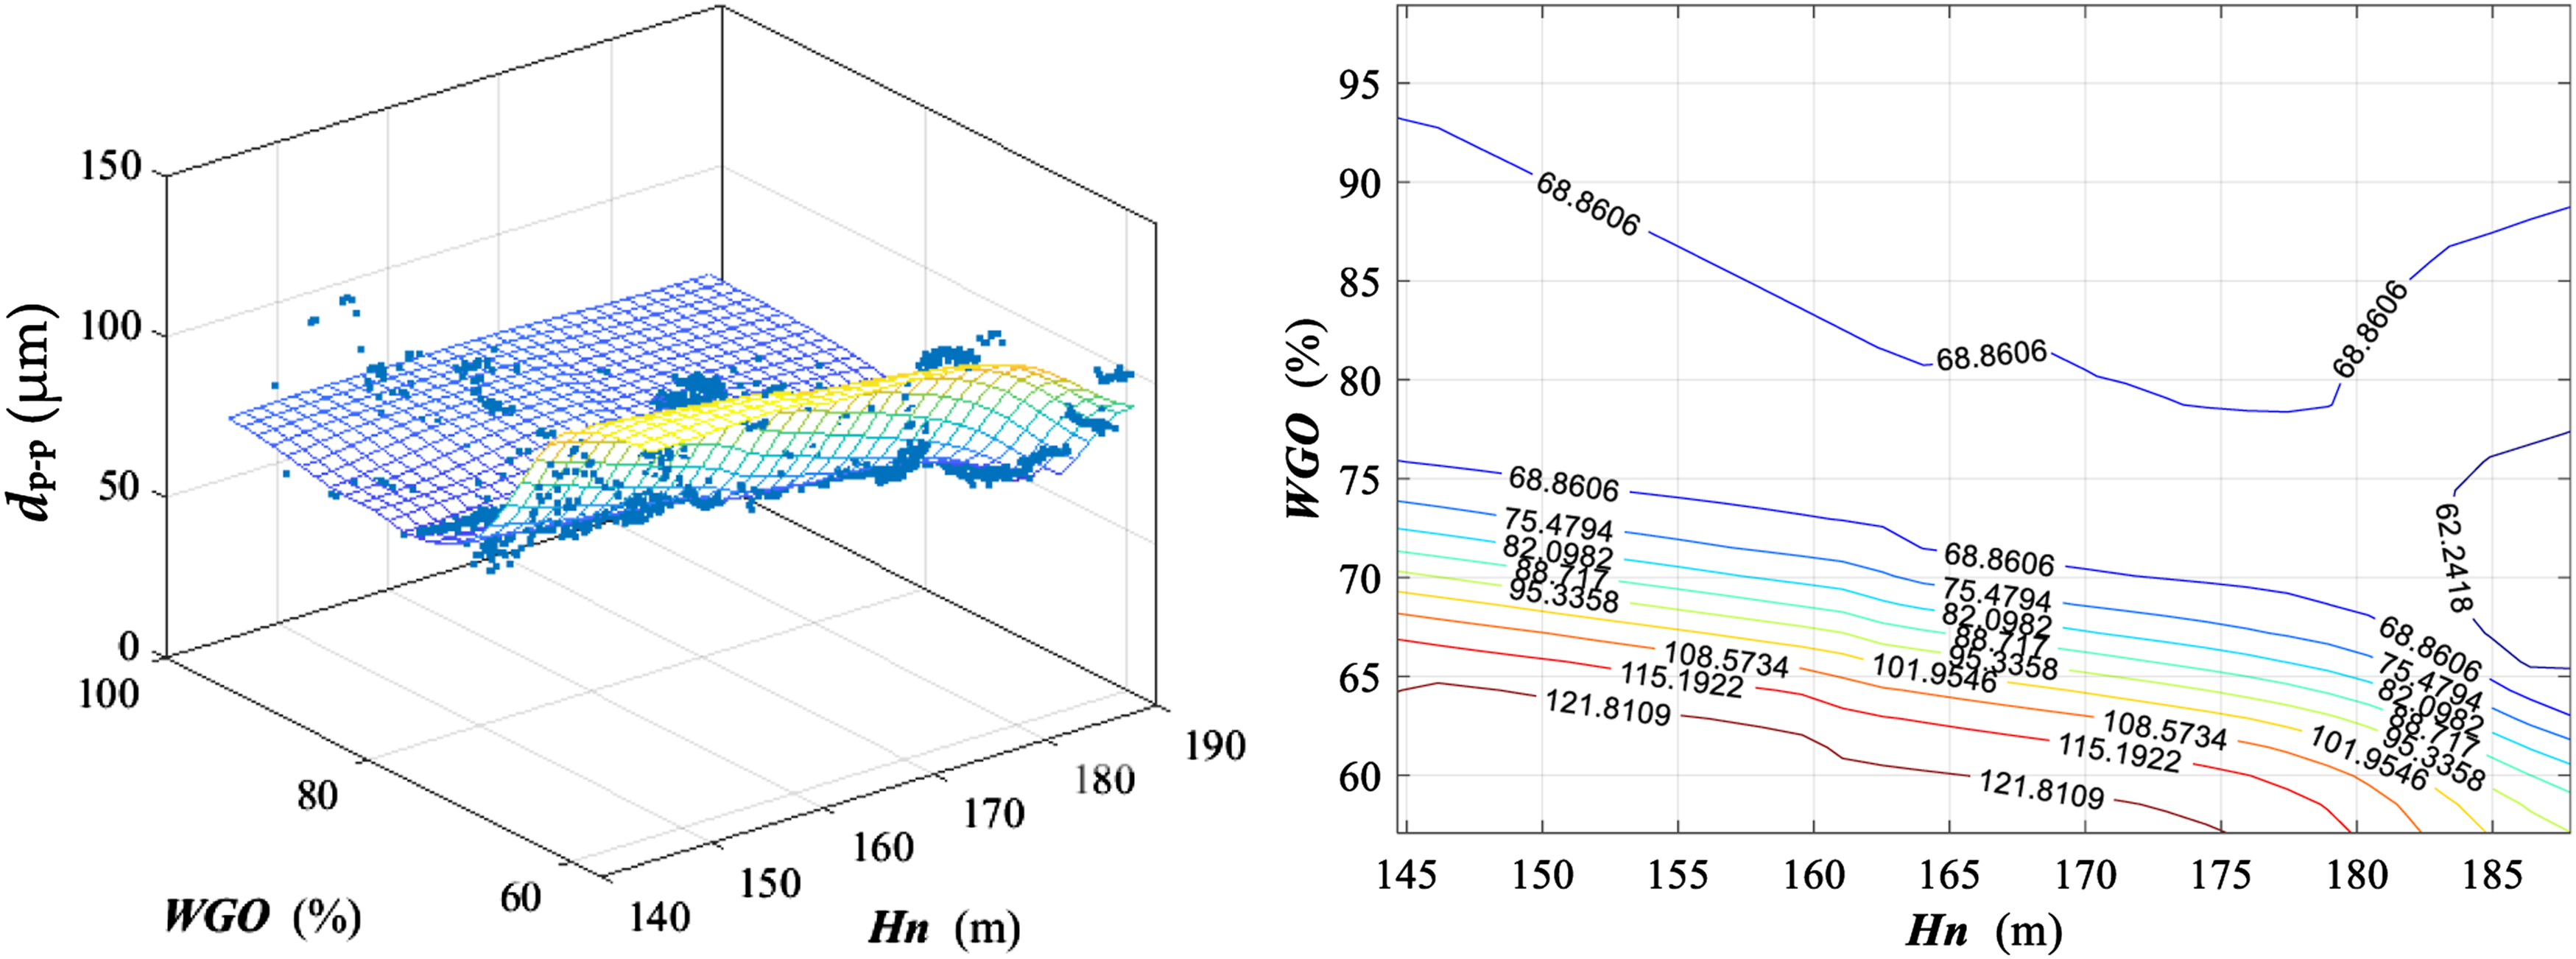
Unbalance
The unbalance of the shaft is analyzed by means of the spectral band indicator associated to the rotating frequency, which is measured with the displacement sensor. The surface shows a relatively constant trend which is consistent with the phenomena of the mechanical unbalance. Therefore, this surface is also useful to validate the fitting process performed by the ANN (Figure 15). Vibrational Hill Chart of 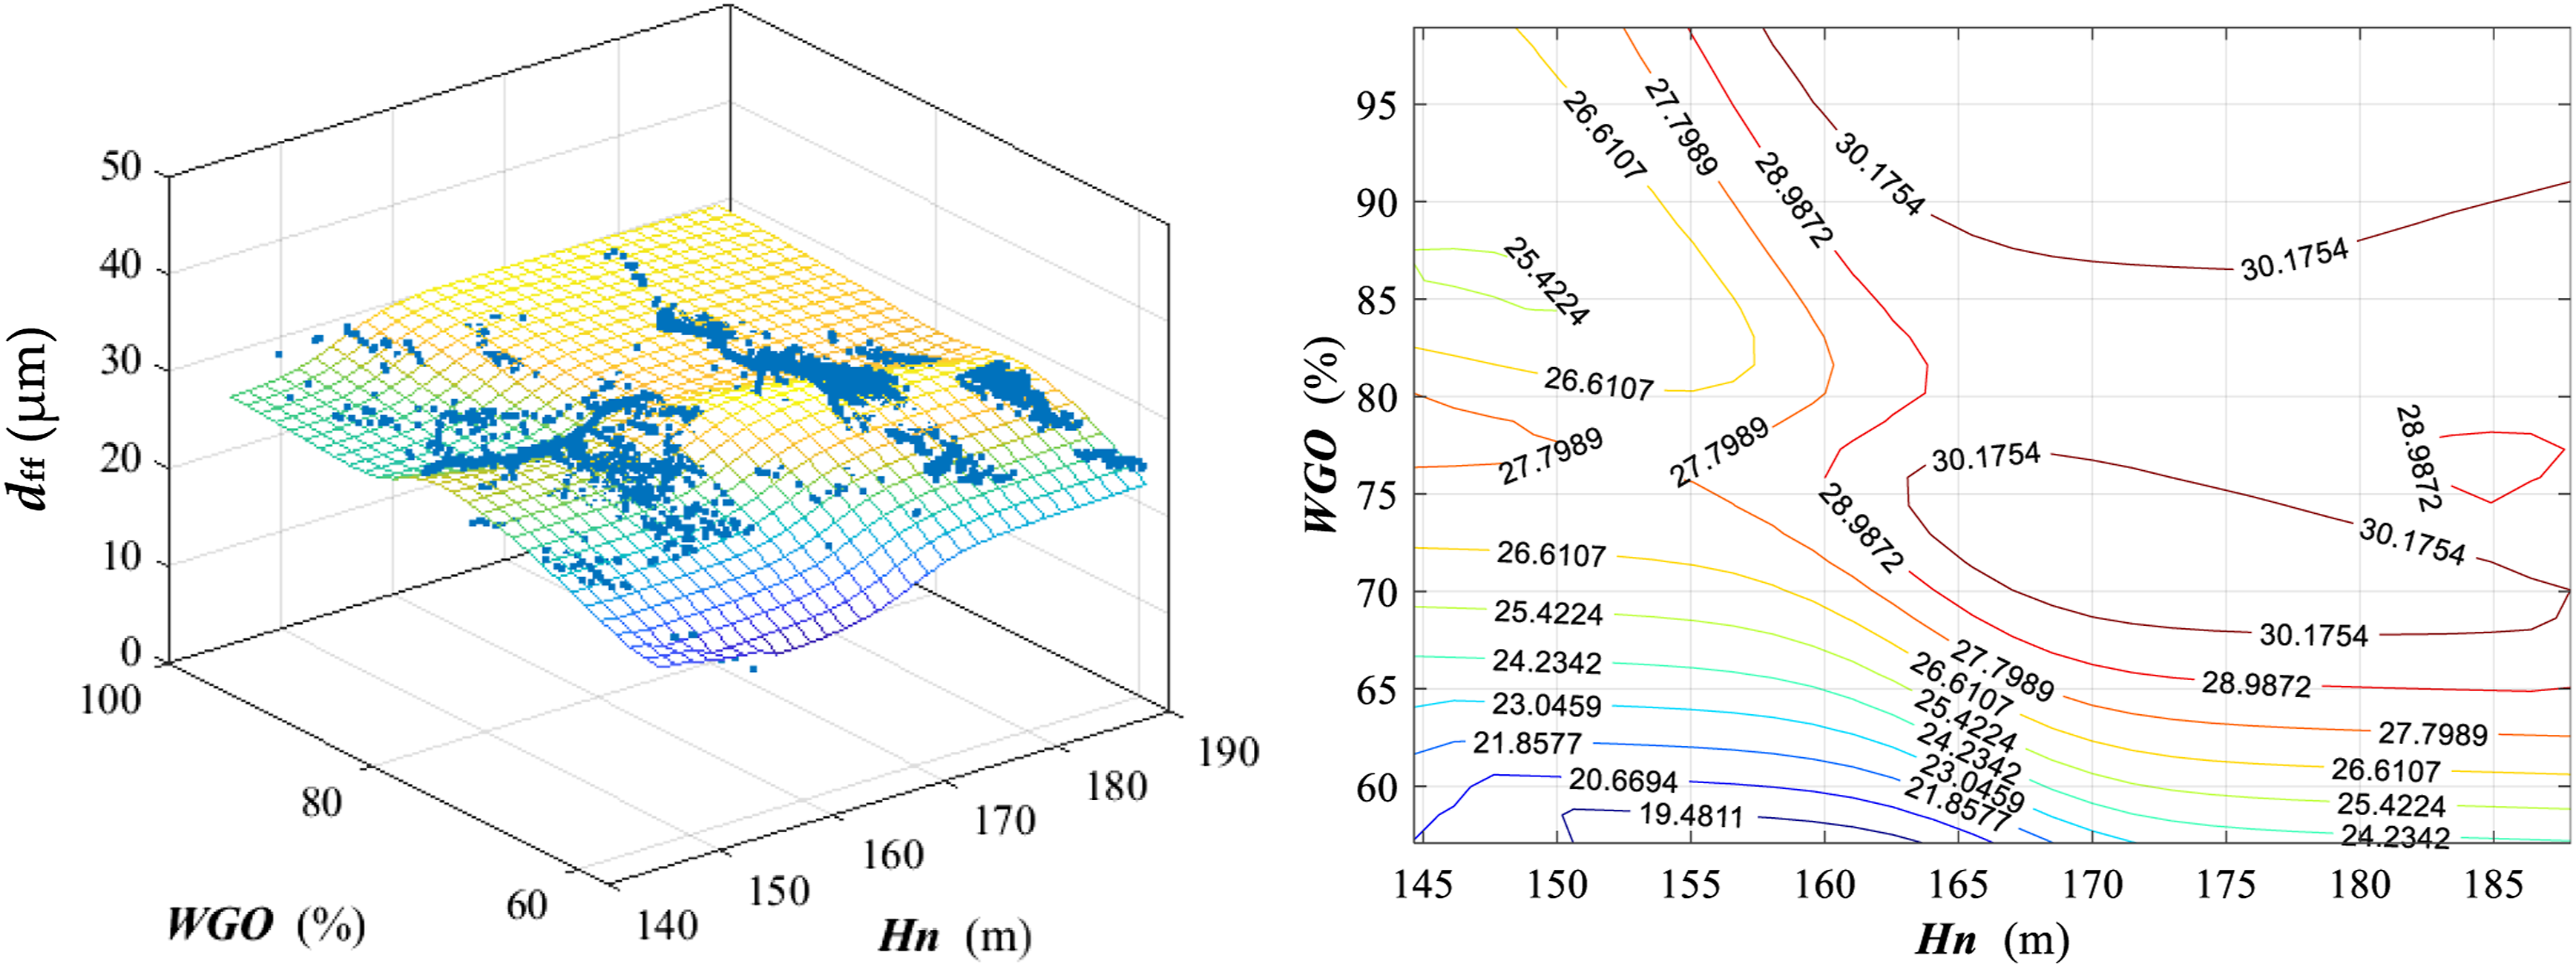
Rotor-stator interaction
The rotor-stator interaction is evaluated with the blade passing frequency band f
b
measured from the accelerometer on the turbine bearing. It can be seen form Figure 16 that the RSI is stronger for high head and high loads as pointed out by many authors.
31–33
Vibrational Hill Chart of 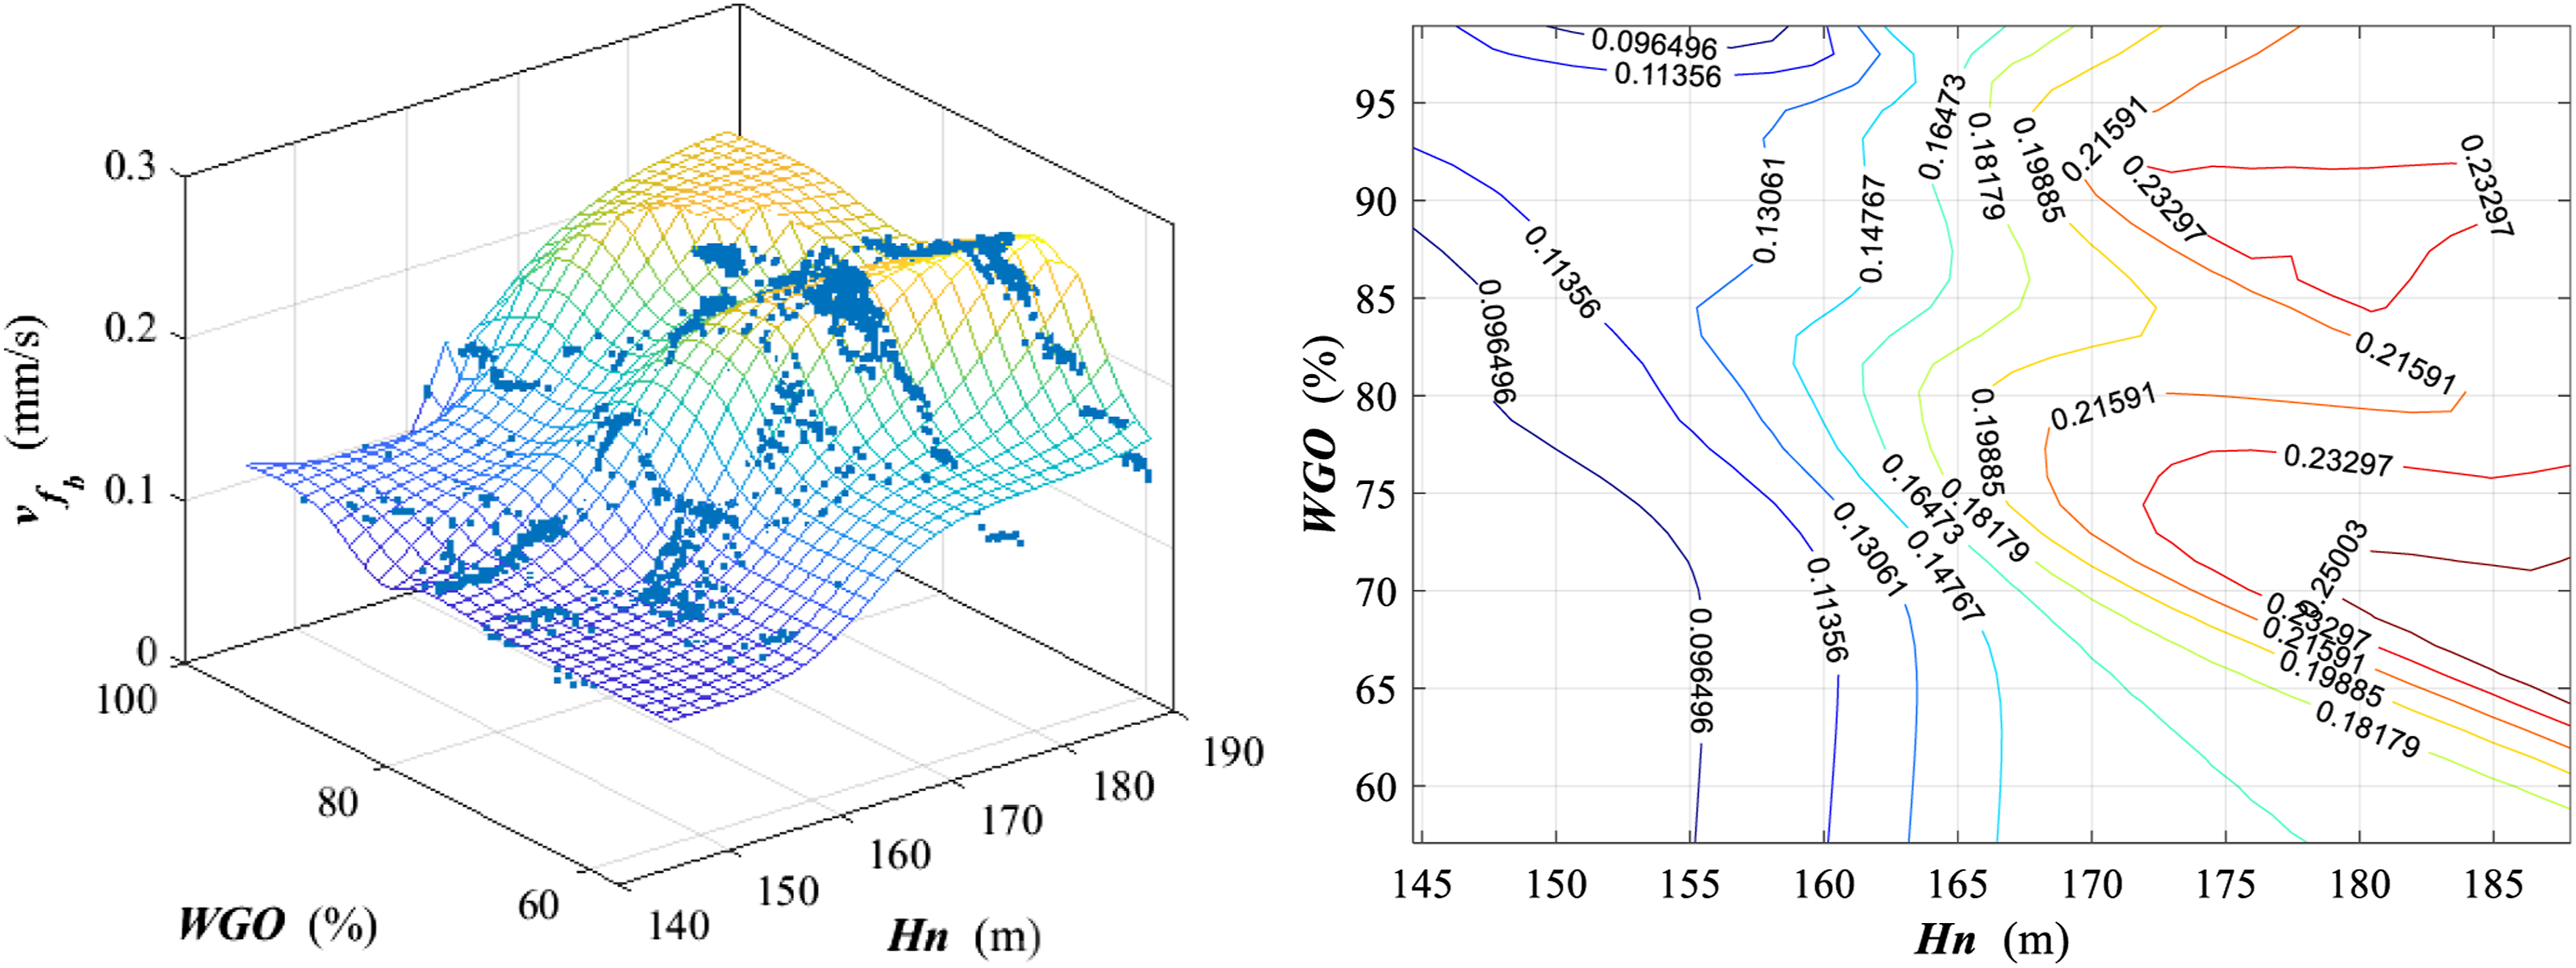
Vortex rope
d
fvrope
The precession of the vortex rope is clearly detected with the proximity probes installed on the turbine bearings. The Vibrational Hill Chart of the spectral band associated to the vortex rope frequency f
vrope
is shown in Figure 17. For high loads, there is not vortex rope and the displacement associated to this frequency is low (15 μm). For part load conditions, the vortex rope appears and due to the precession of the rope, the value of the indicator dramatically increases from 15 μm to 85 μm. Furthermore, it is interesting to observe that for low heads, the range where the vortex rope exists is larger. Vibrational Hill Chart of 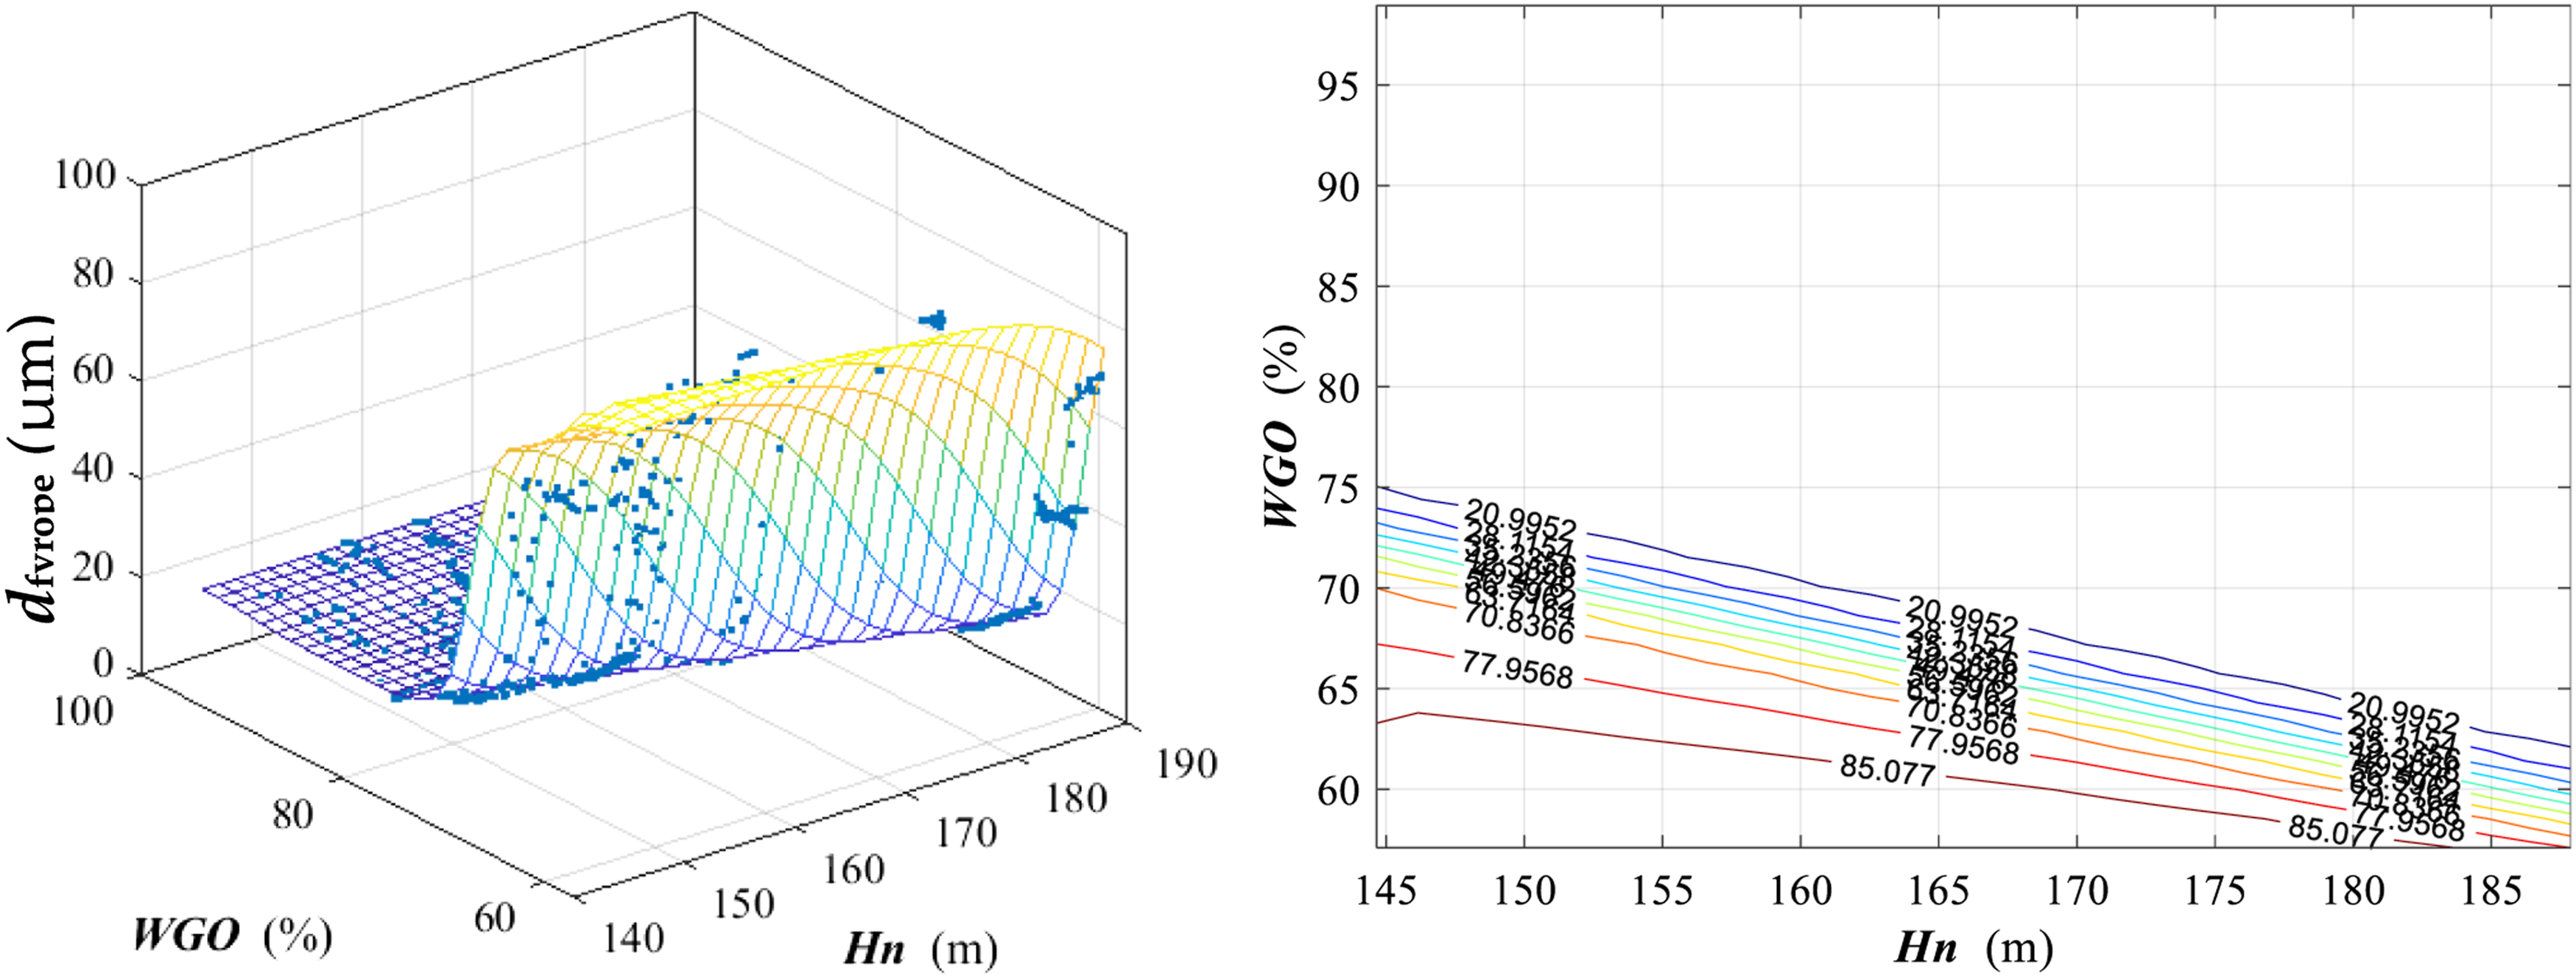
High frequency band
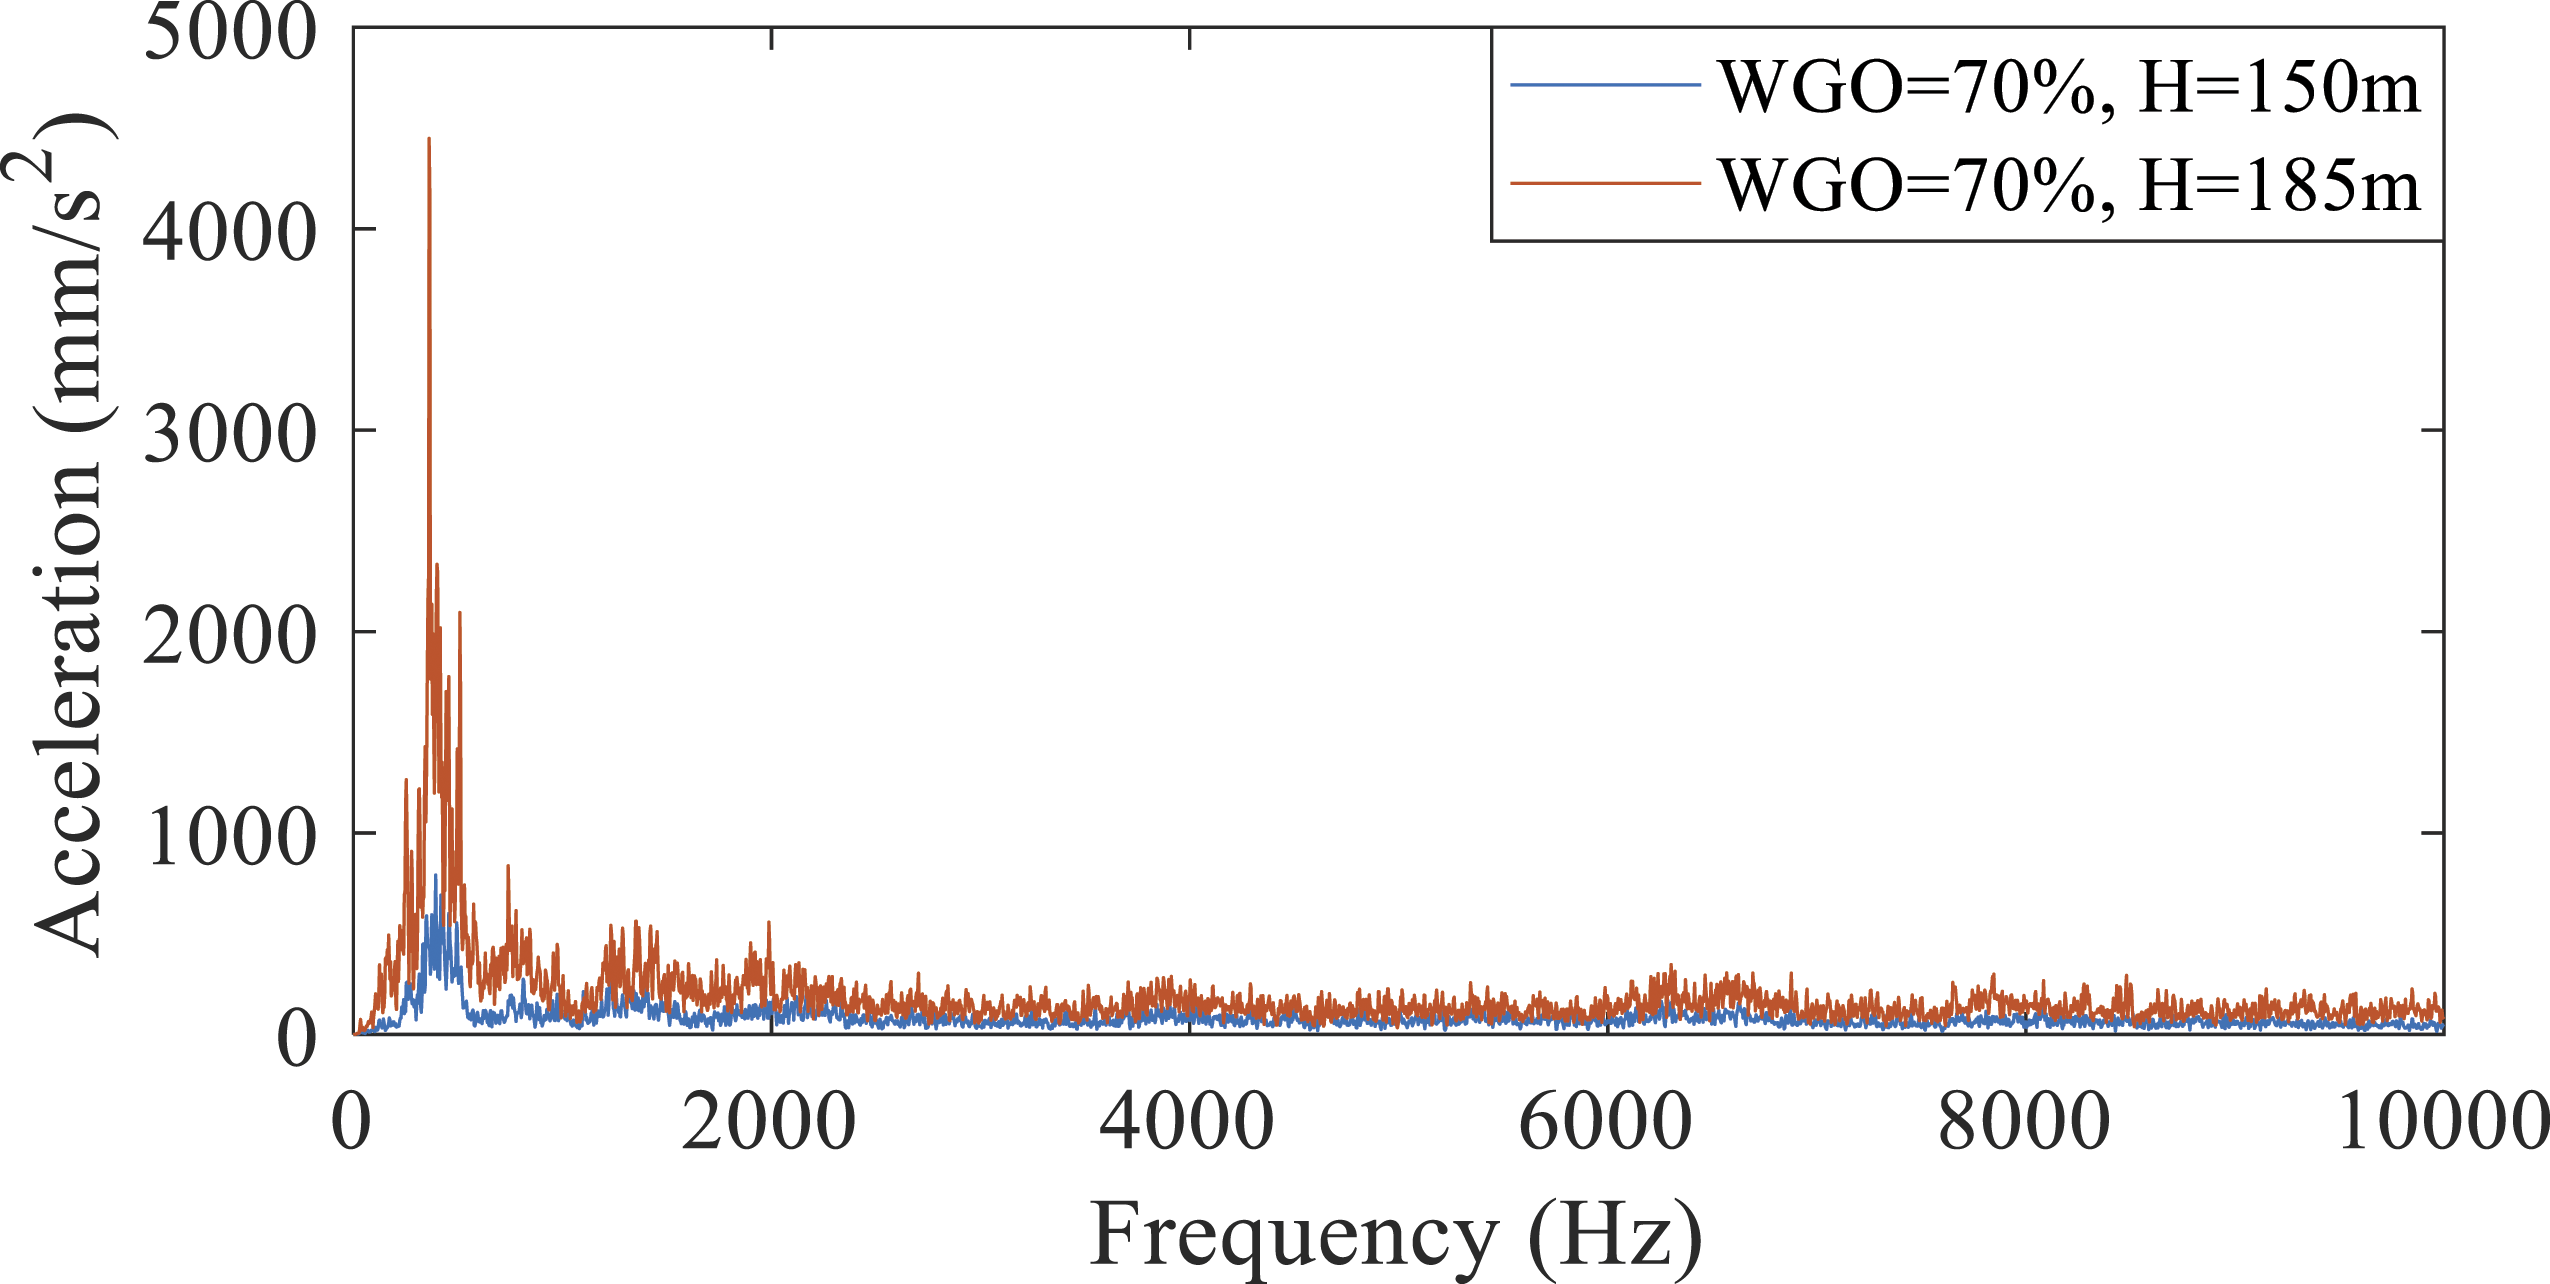
The map of high frequency band (Figure 18) is similar than the overall value that is, it is higher for high head and high loads. This band is associated to the turbulence and cavitation level of the fluid. This can be also seen when comparing a spectrum with the same WGO and different heads (Figure 19). For high heads, the energy in the high frequency range is significantly larger. Vibrational Hill Chart of Acceleration spectrum. Comparison between low head and high head (turbine bearing).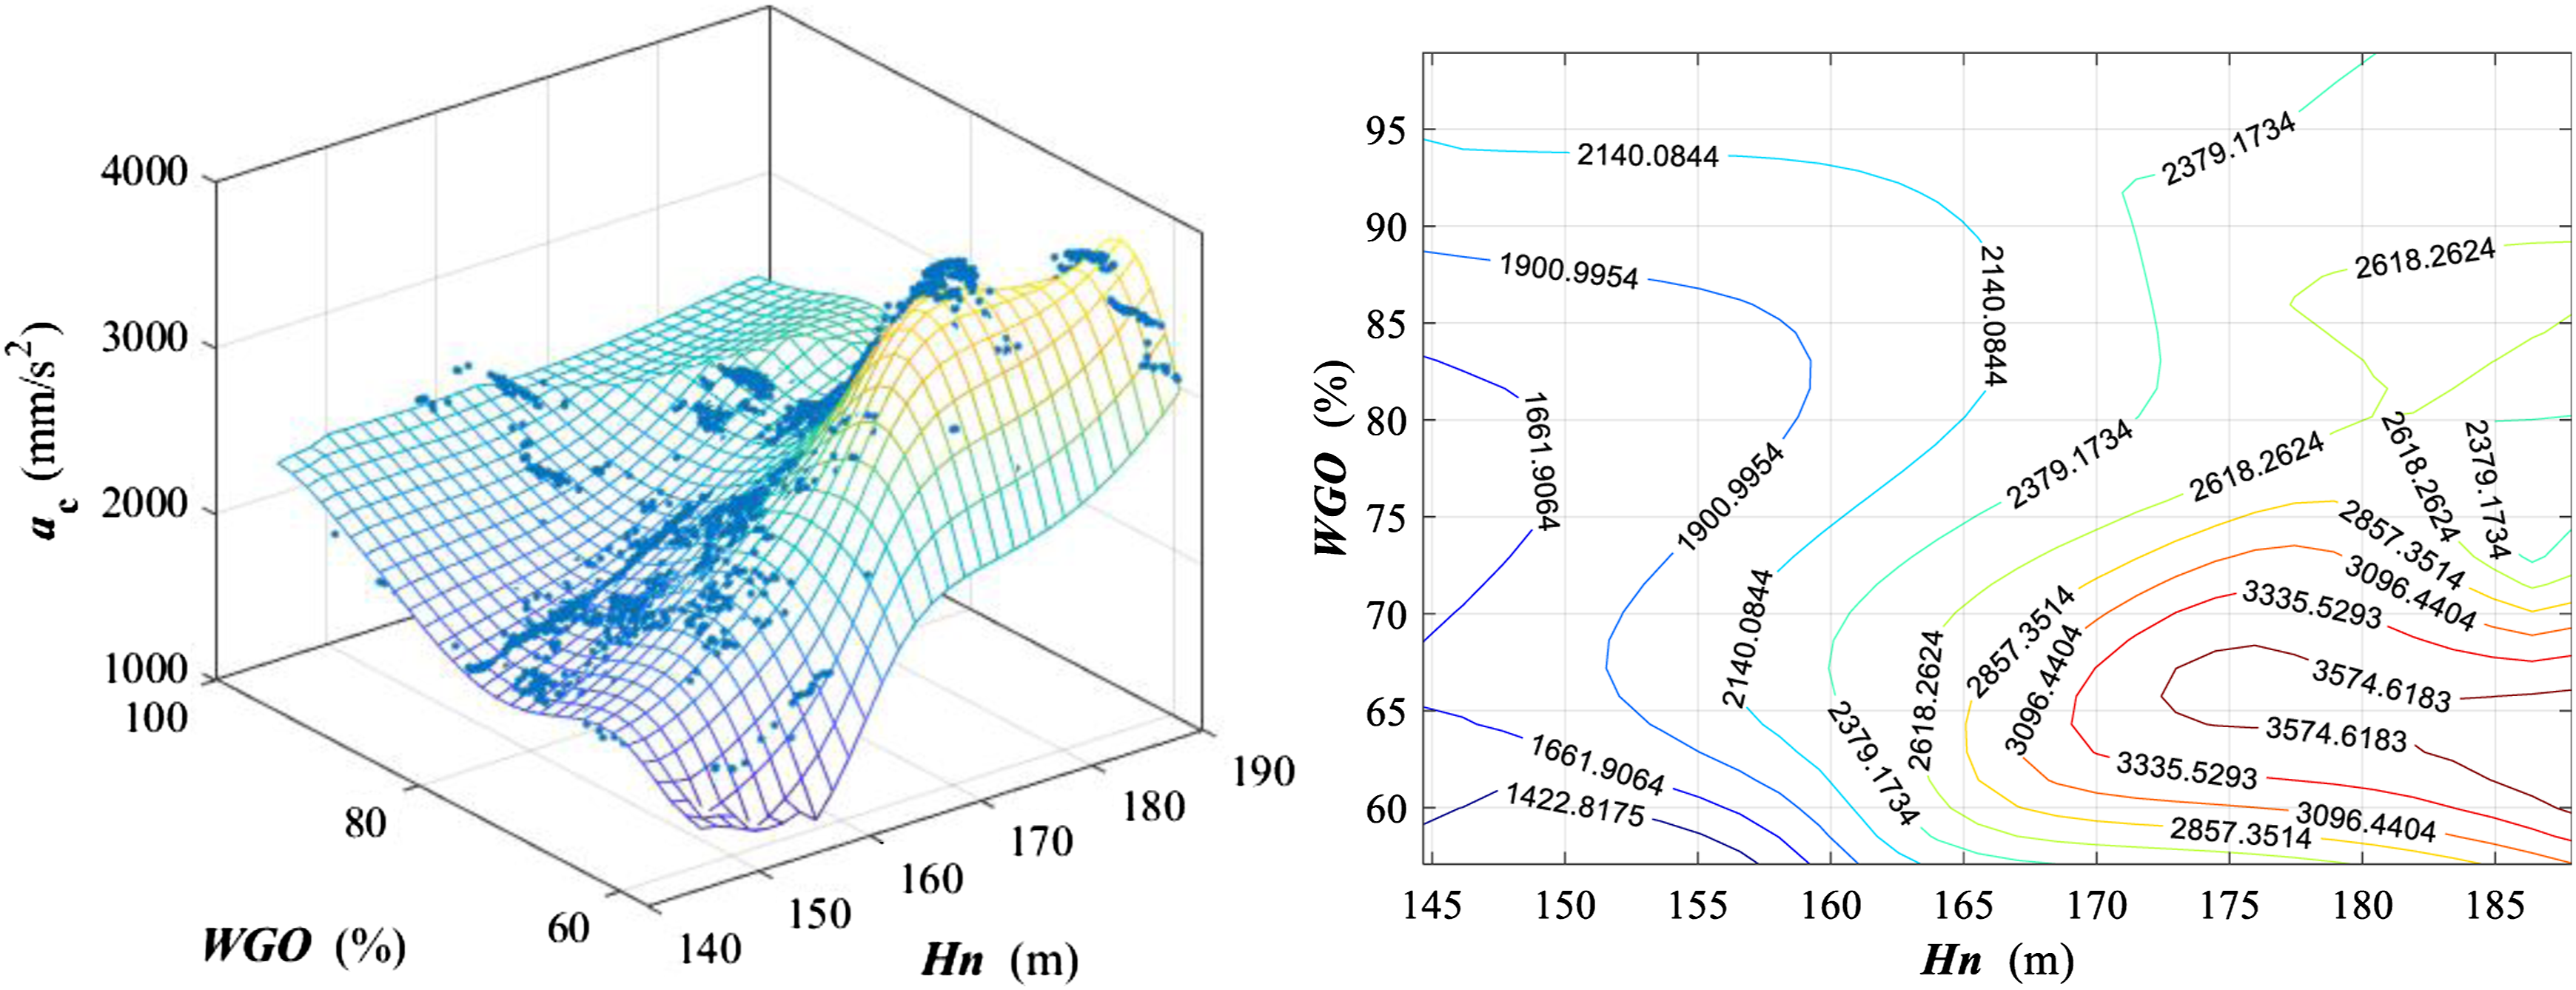
Application of the Vibrational Hill Chart for advanced monitoring
Classification performance of a classifier based on the Vibrational Hill Chart
Now, the performance of the classifiers based on the proposed Vibrational Hill Chart (Definition of the alarm and trip levels according to the Vibrational Hill Chart) will be compared with the constant action limit (see for example Figure 2). To do so the following assumptions are made. 1 .The measured values after the reparation of the machine are real negatives as they have been obtained short time after this event, that is, the machine was working in good condition. 2 .For one operating condition, a value is considered abnormal (real positive) if it is 1.6 times larger than the previous averaged values for each operating condition.
This ratio 1.6 is taken based on the discussion made in Definition of the alarm and trip levels according to the Vibrational Hill Chart, which defines abnormal value when it is 1.6 time higher than the averaged value. For the set of measured averaged values (blue points on Figure 20), a set of abnormal values has been generated (red points on Figure 20 are 1.6 times higher than the blue points on the same figure). Measured data, Vibrational Hill Chart and simulated abnormal level of RMS velocity of turbine bearing.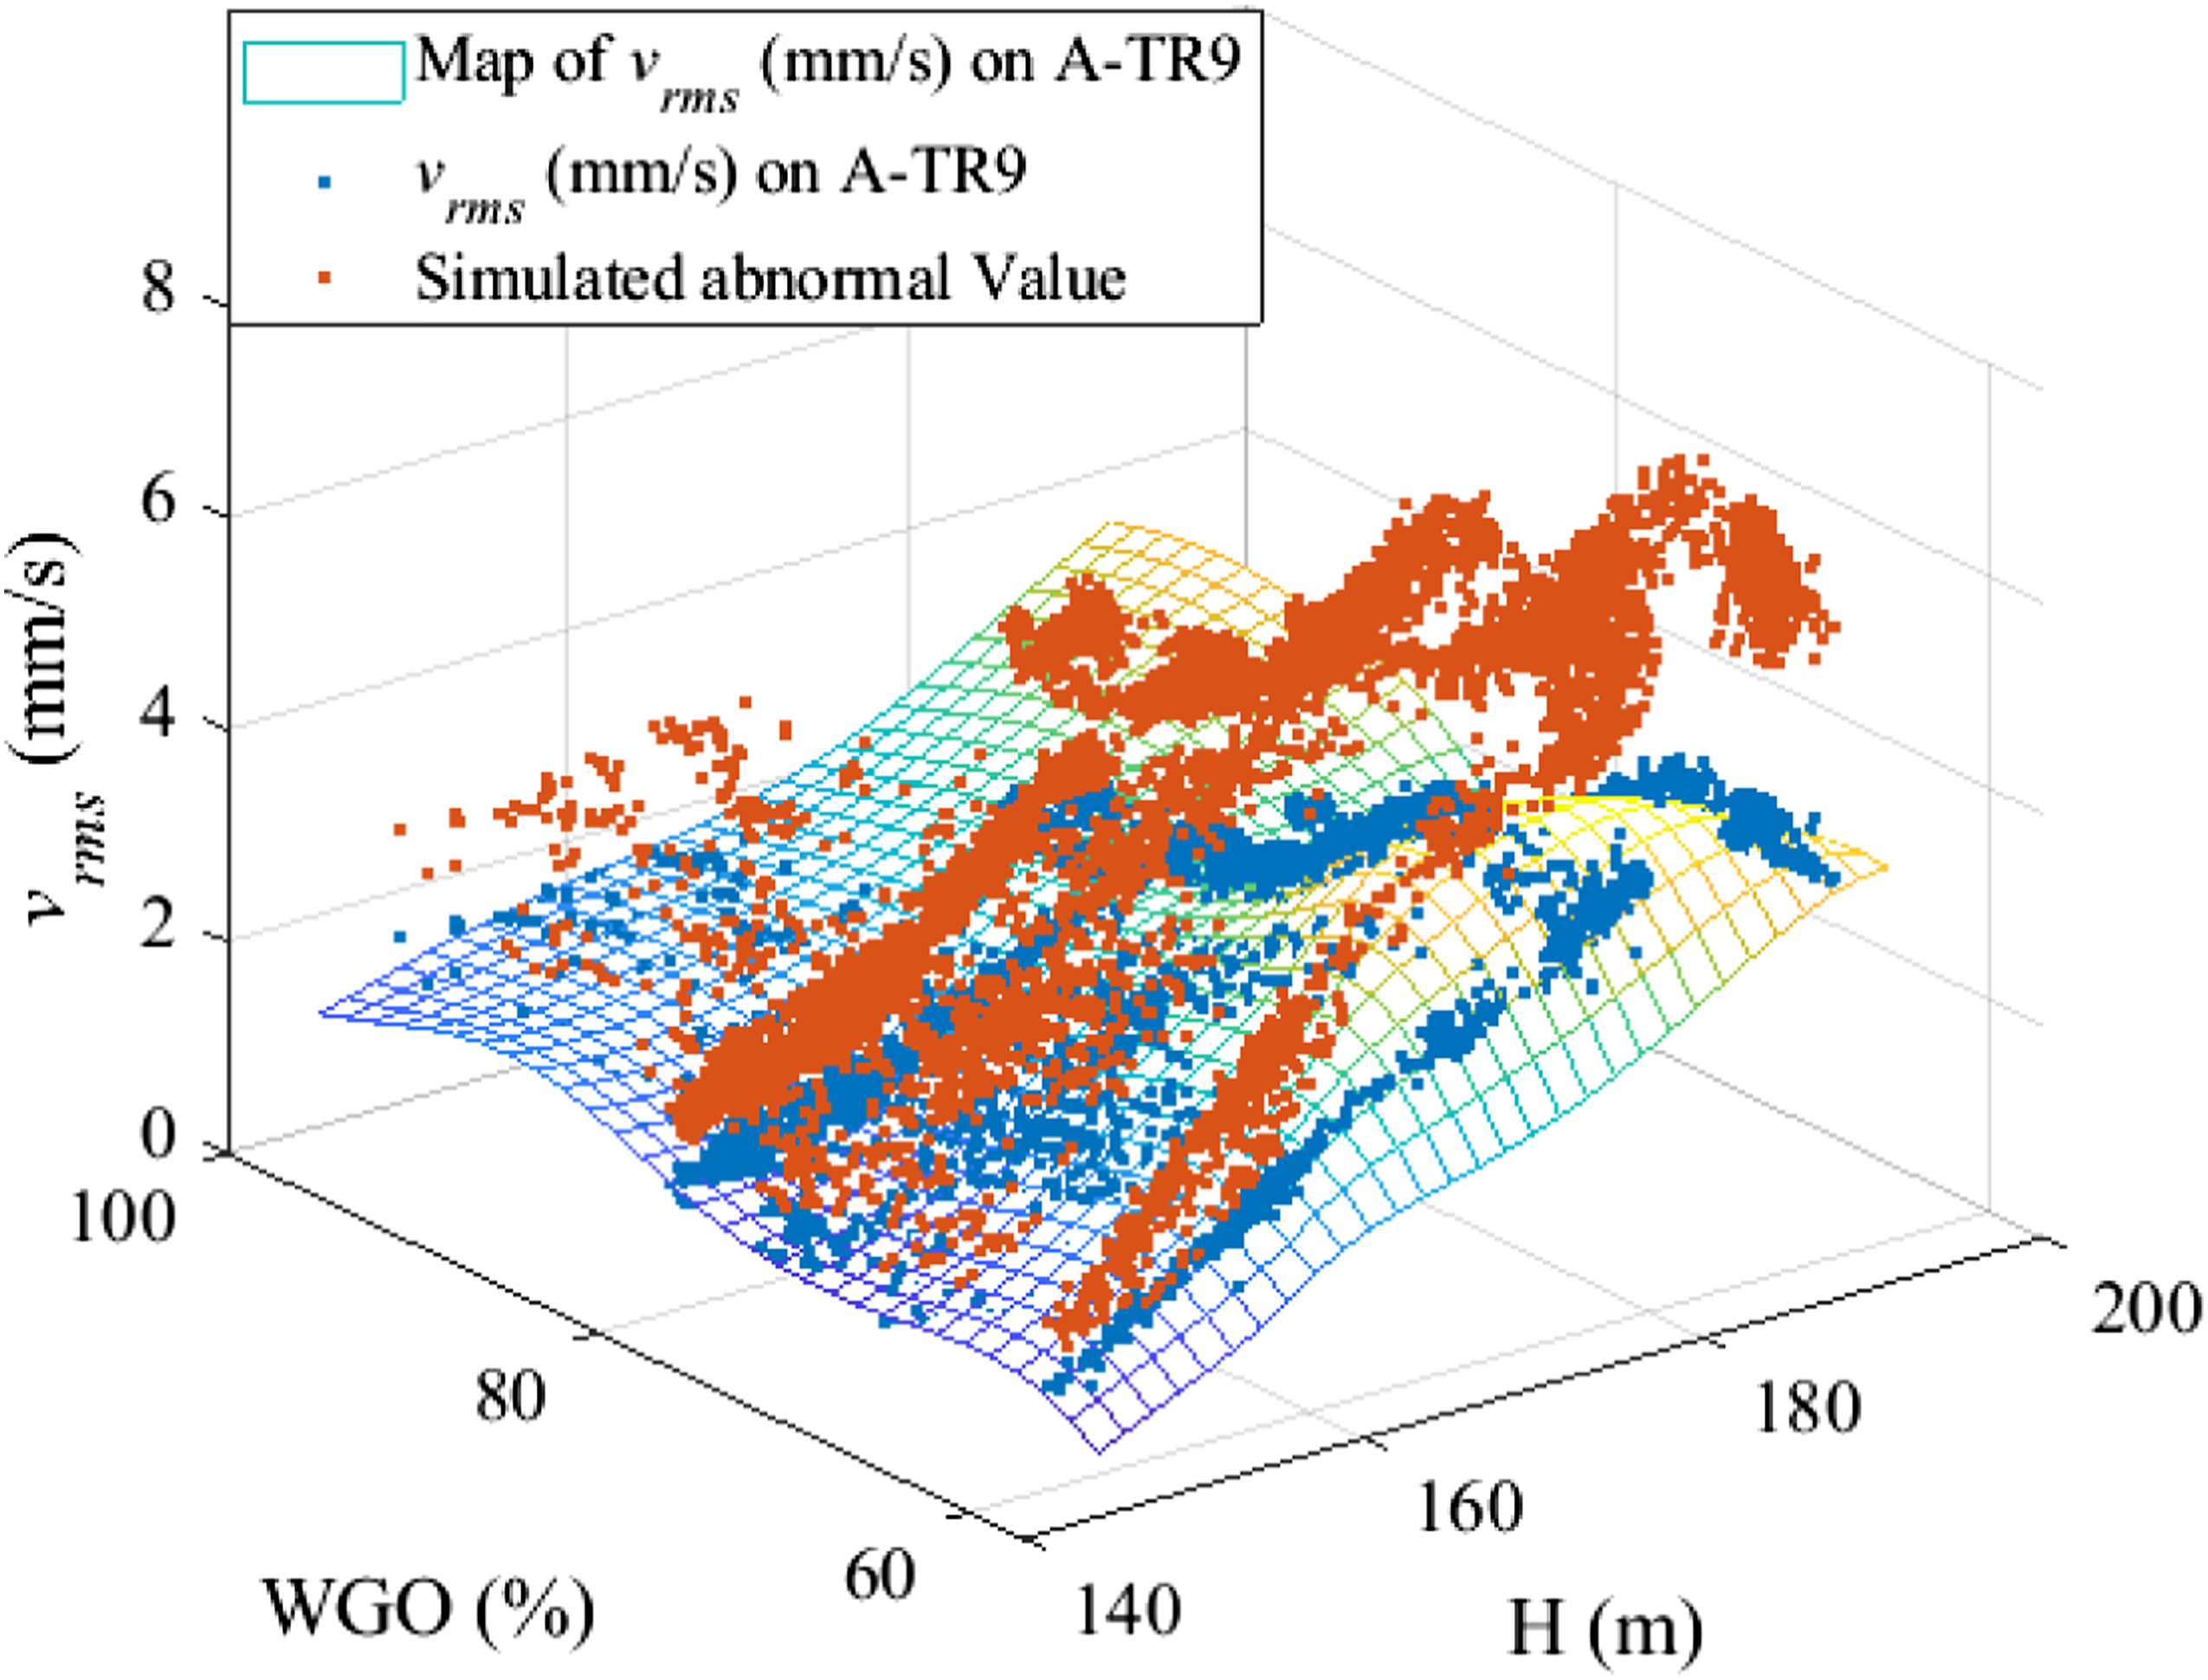
Sensors used in this study. Characteristics of the time signal and frequency spectrum.
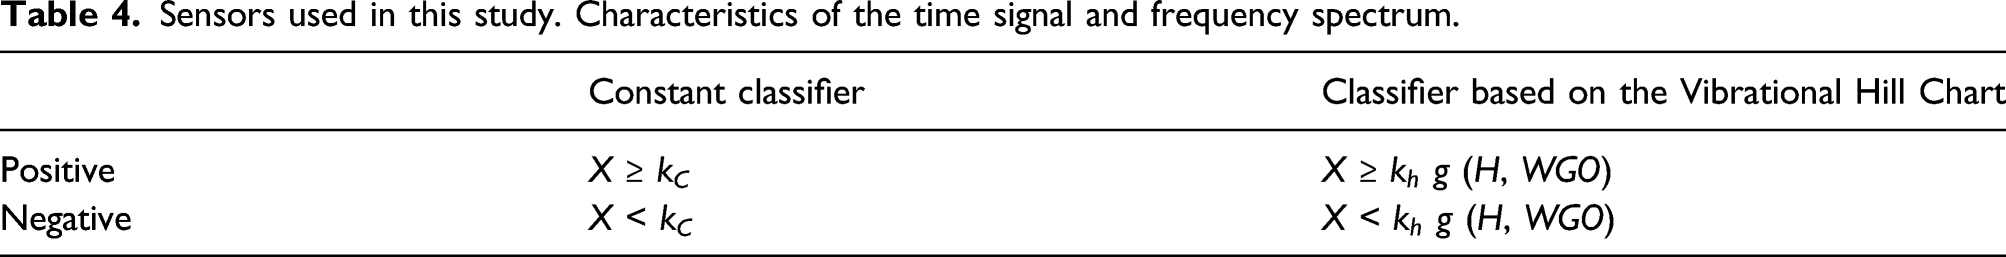
Where f (H, WGO) is a parallel surface of the Vibrational Hill Chart of the indicator X and the level is controlled by the parameter Receiver Operating Characteristic curve of the action limit based on the Vibrational Hill Chart and constant level.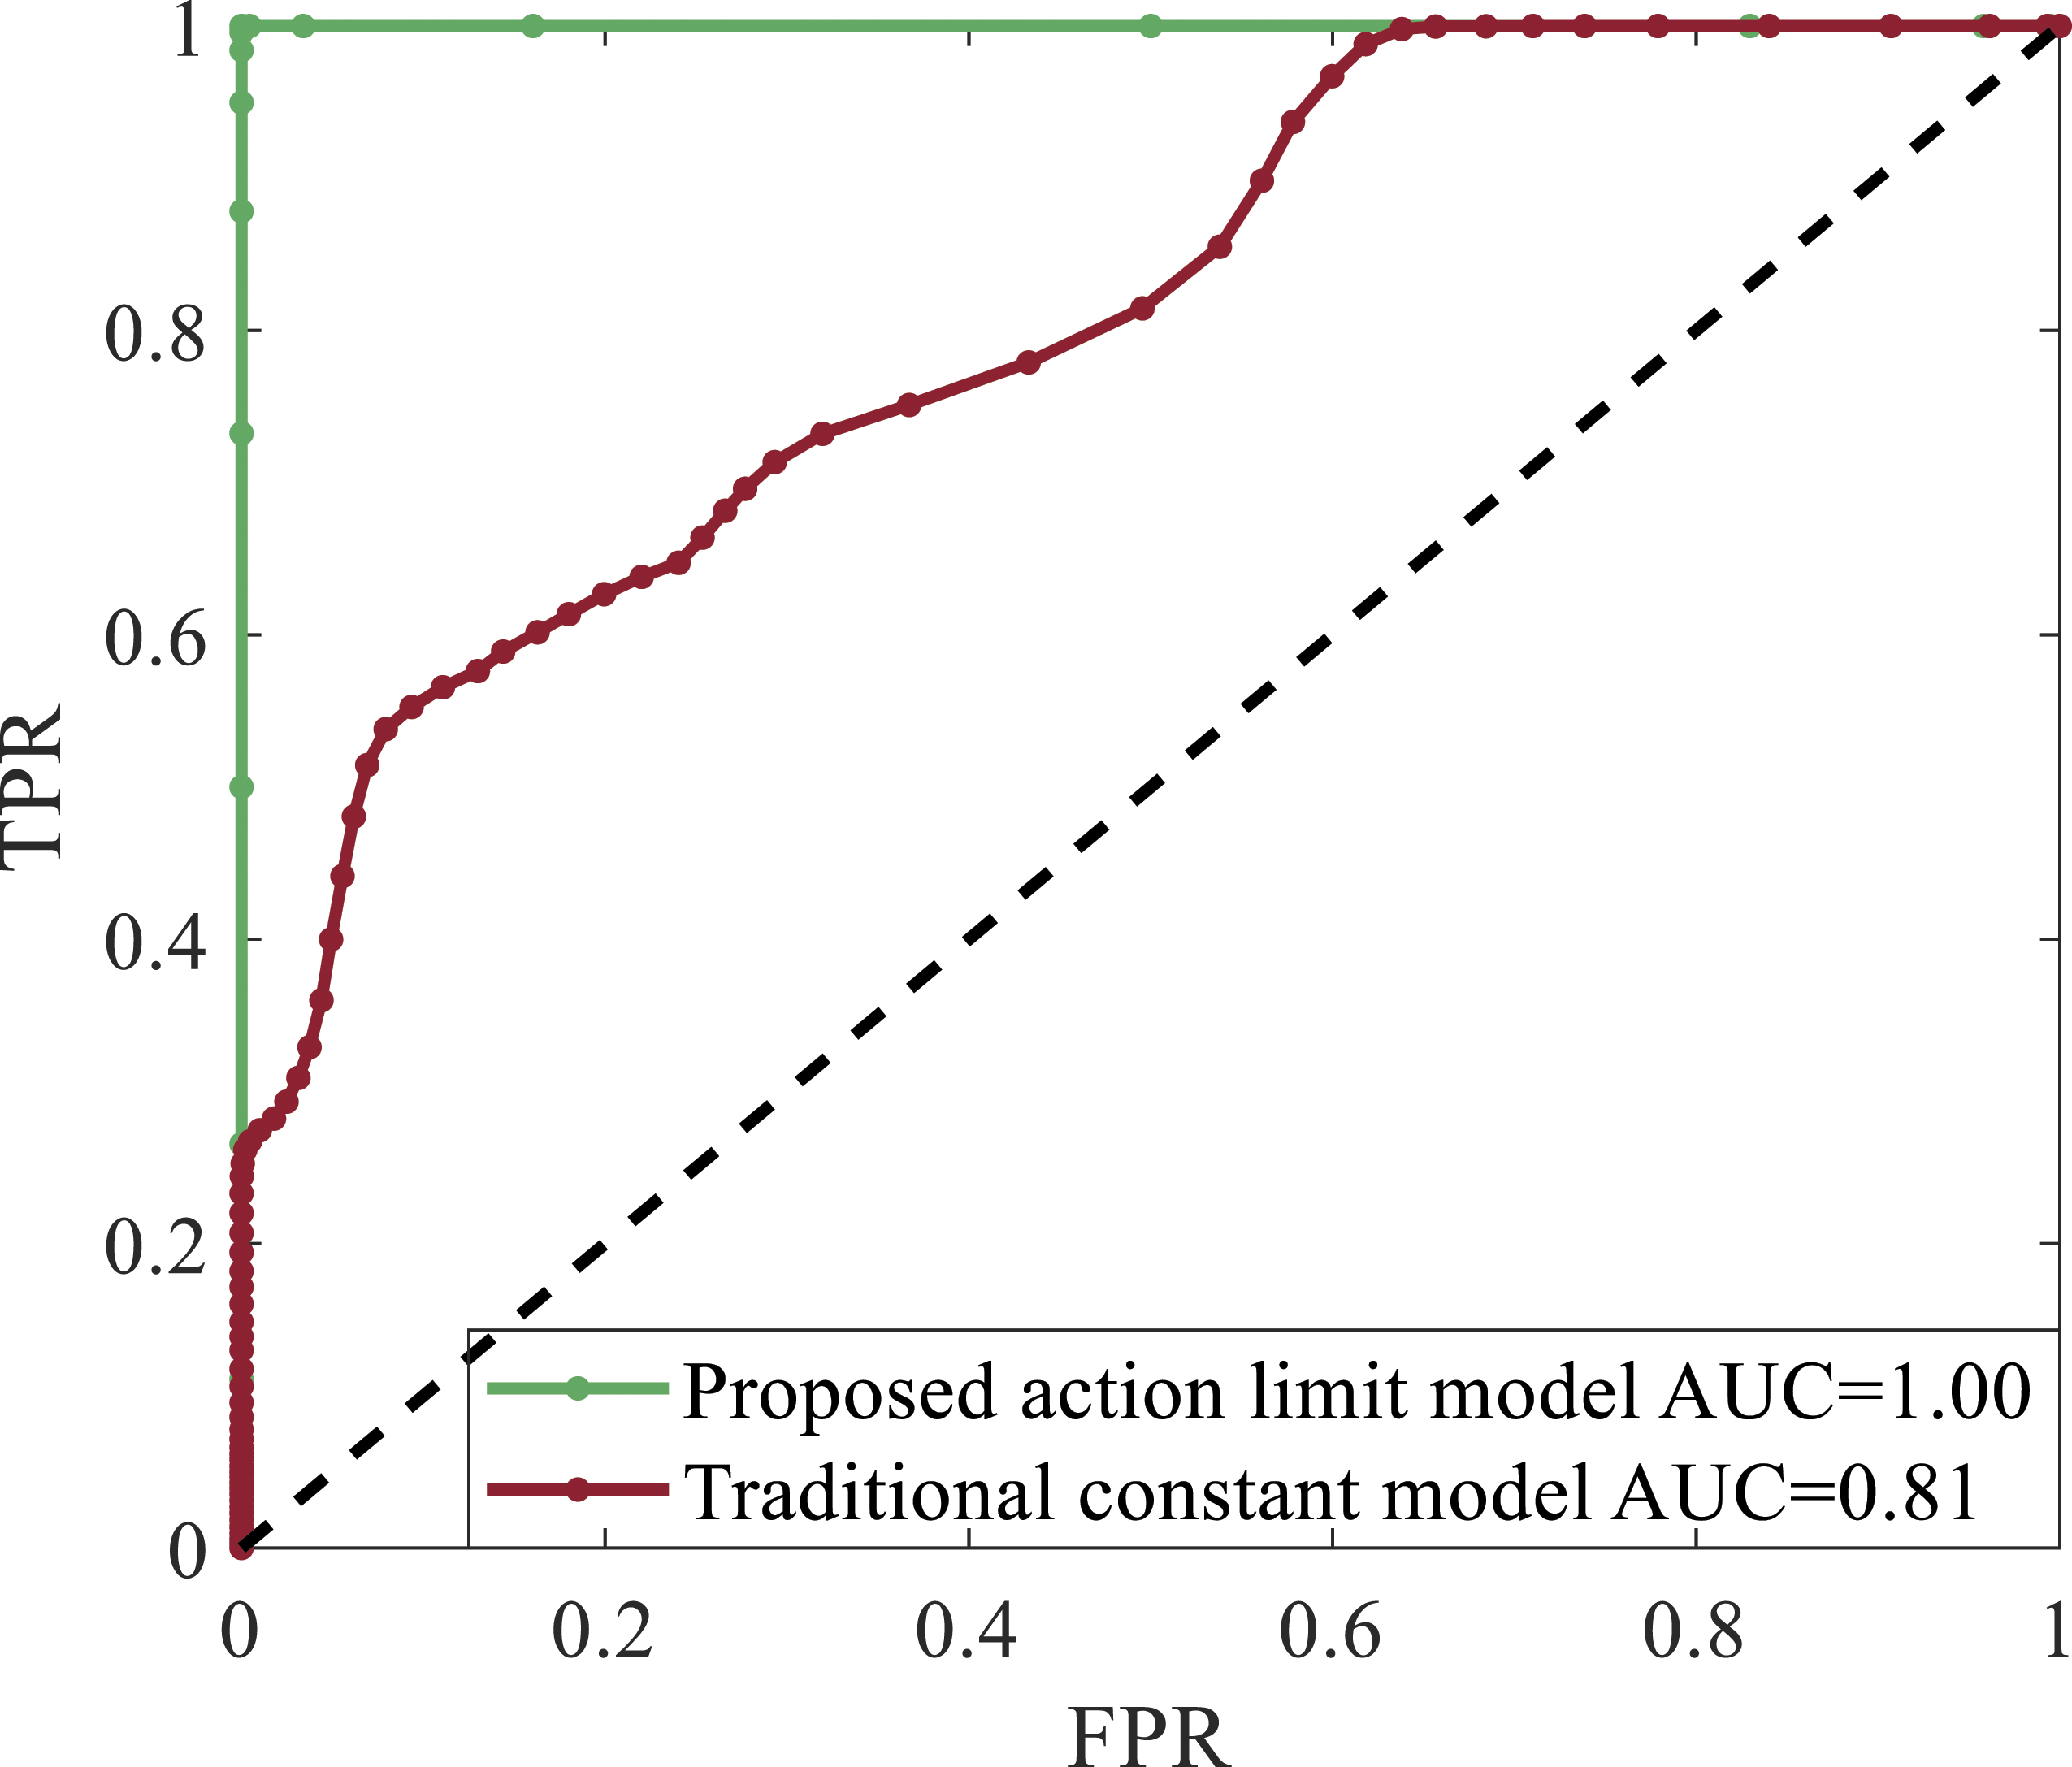
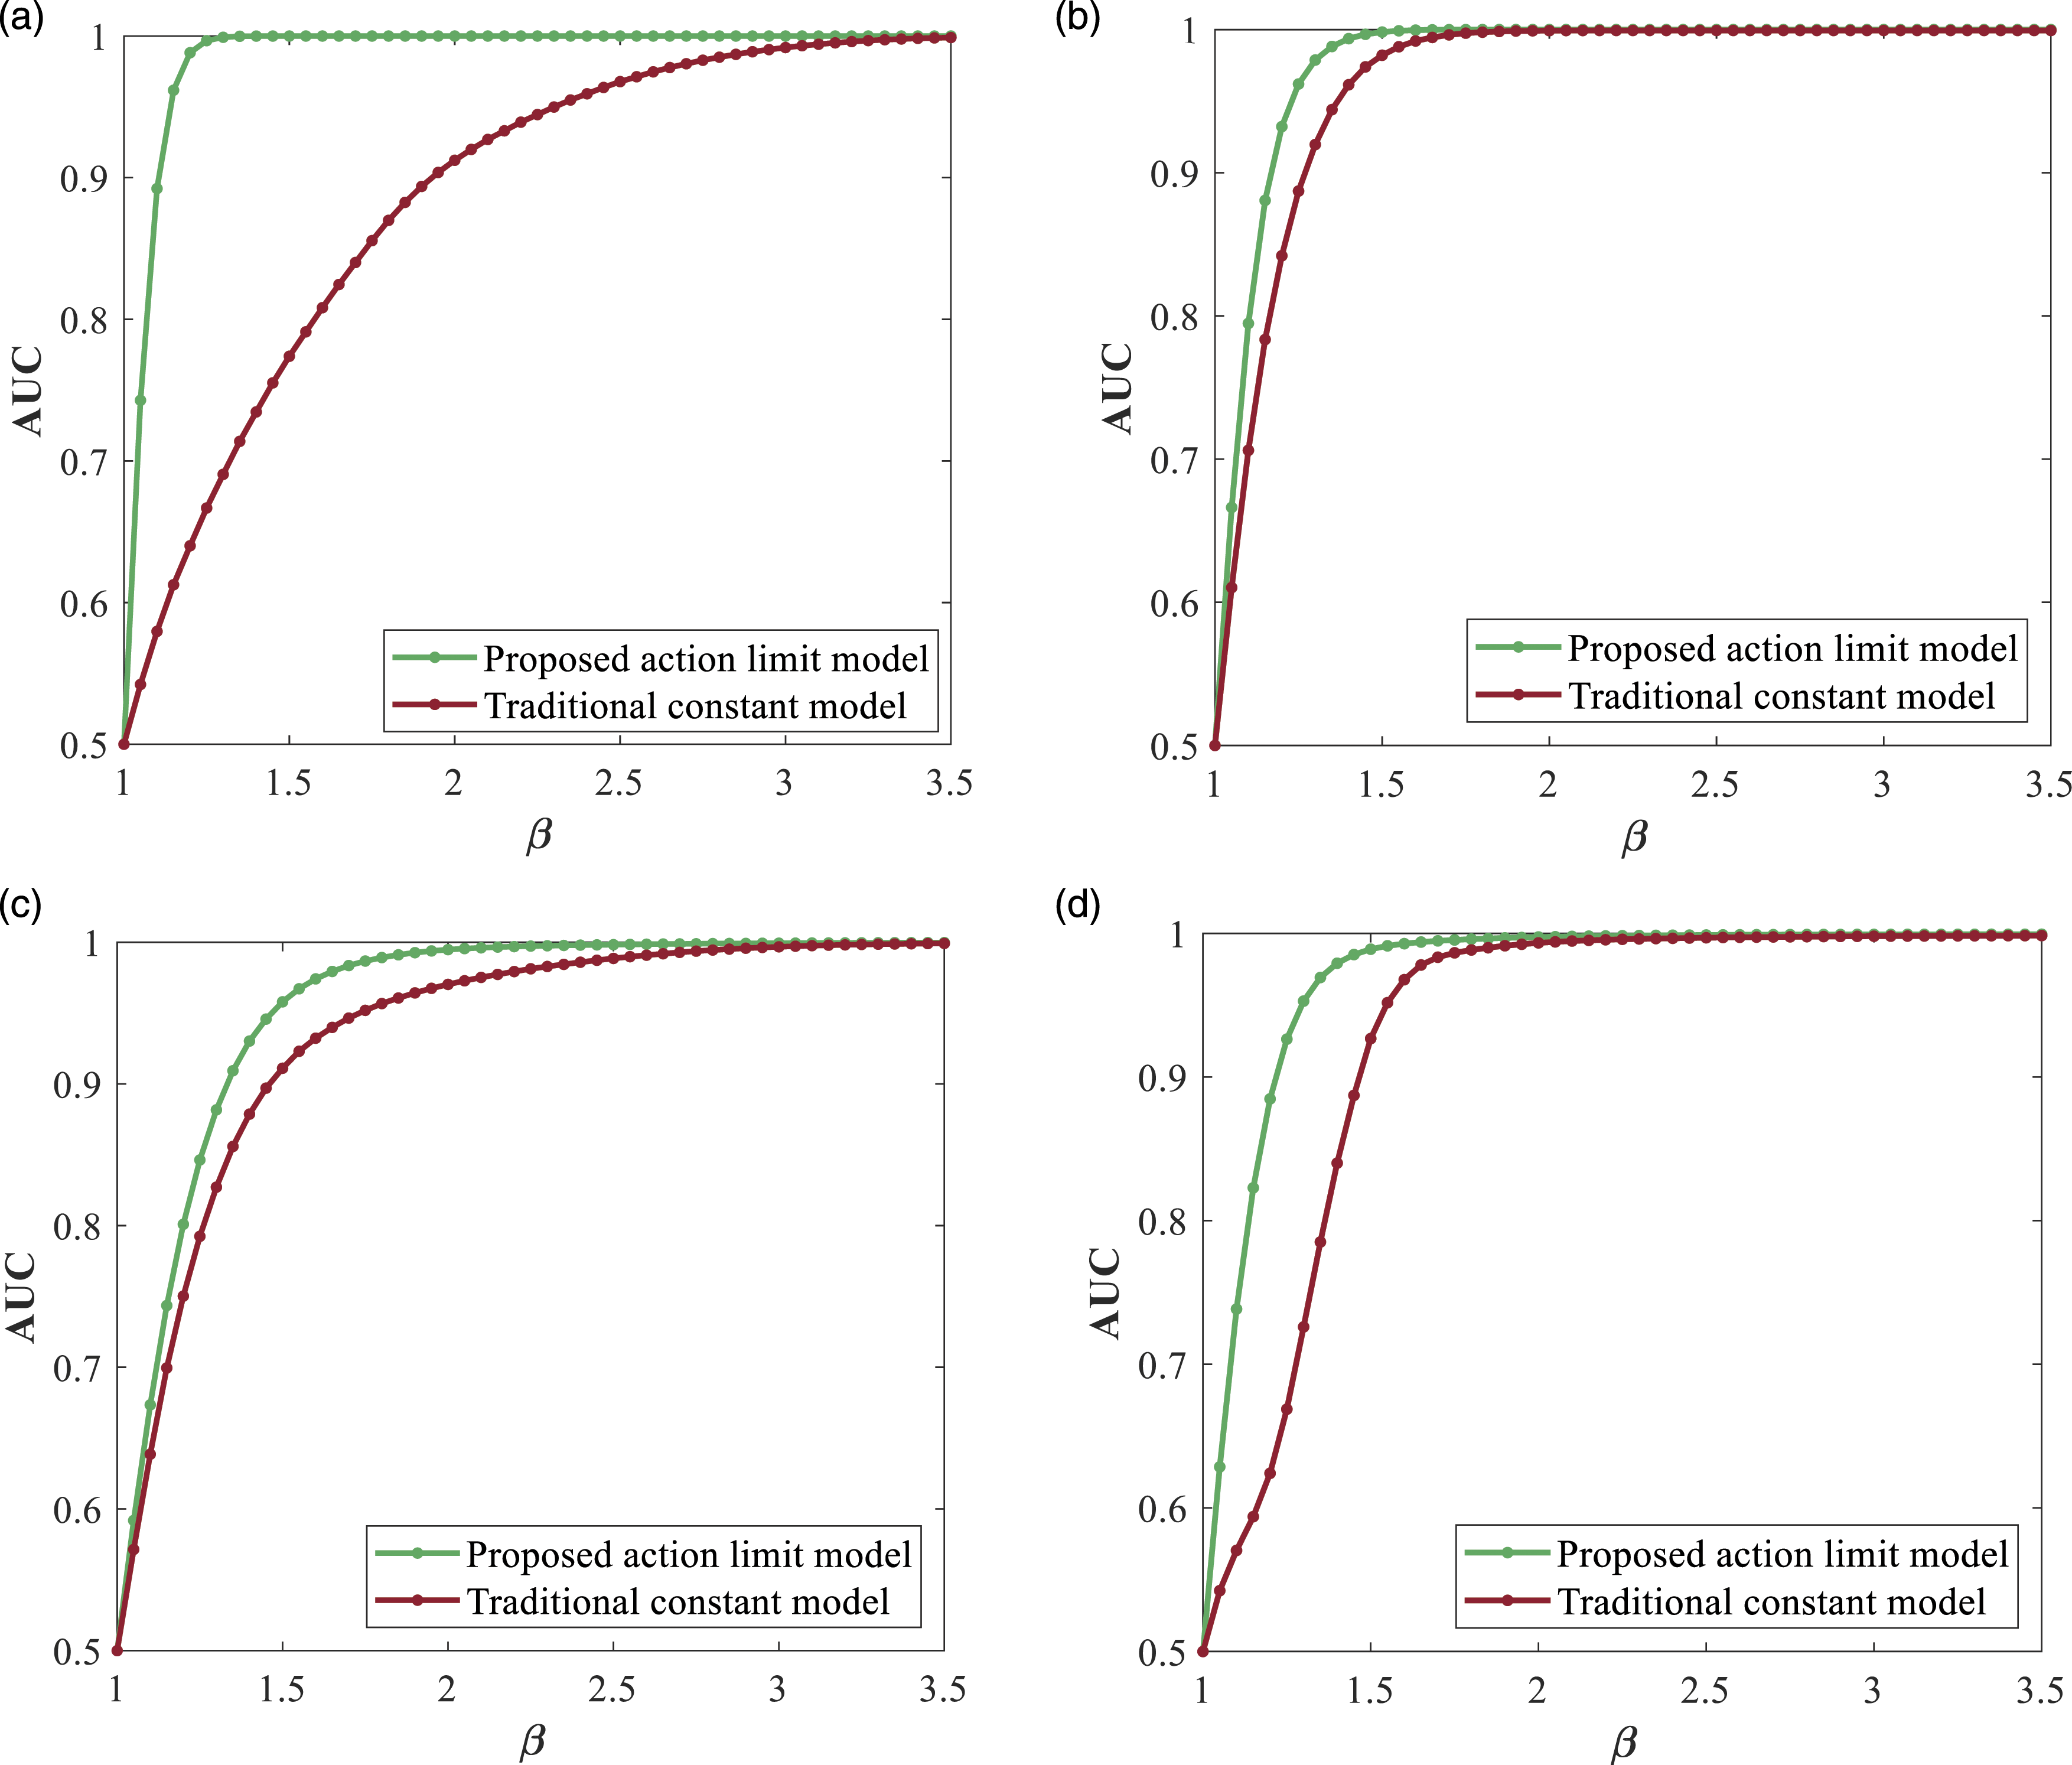
Figure 22 a, b, and c show the ROC curves for different indicators when using the classifier based on the Vibrational Hill Chart and the constant classifier. Obviously, the AUC for the classifier based on the Vibrational Hill Chart is higher as the basic assumption is that the real positive and real negative values have a shape which is almost parallel to the Vibrational Hill Chart. What is more relevant from this comparison is that this type of classifiers has a better classification performance than the constant values.
The comparison of the AUC for the analyzed indicators is shown in Figure 23 The results of the AUC for the shown indicators suggest that the performance of the proposed classifiers is better and if they are generally used for the rest of the indicators it is expected that the TPR (or sensitivity) will be higher than when using constant action limits. Receiver Operating Characteristic curve of the proposed action limit model and traditional constant model. Area under curve comparison when β = 1.6.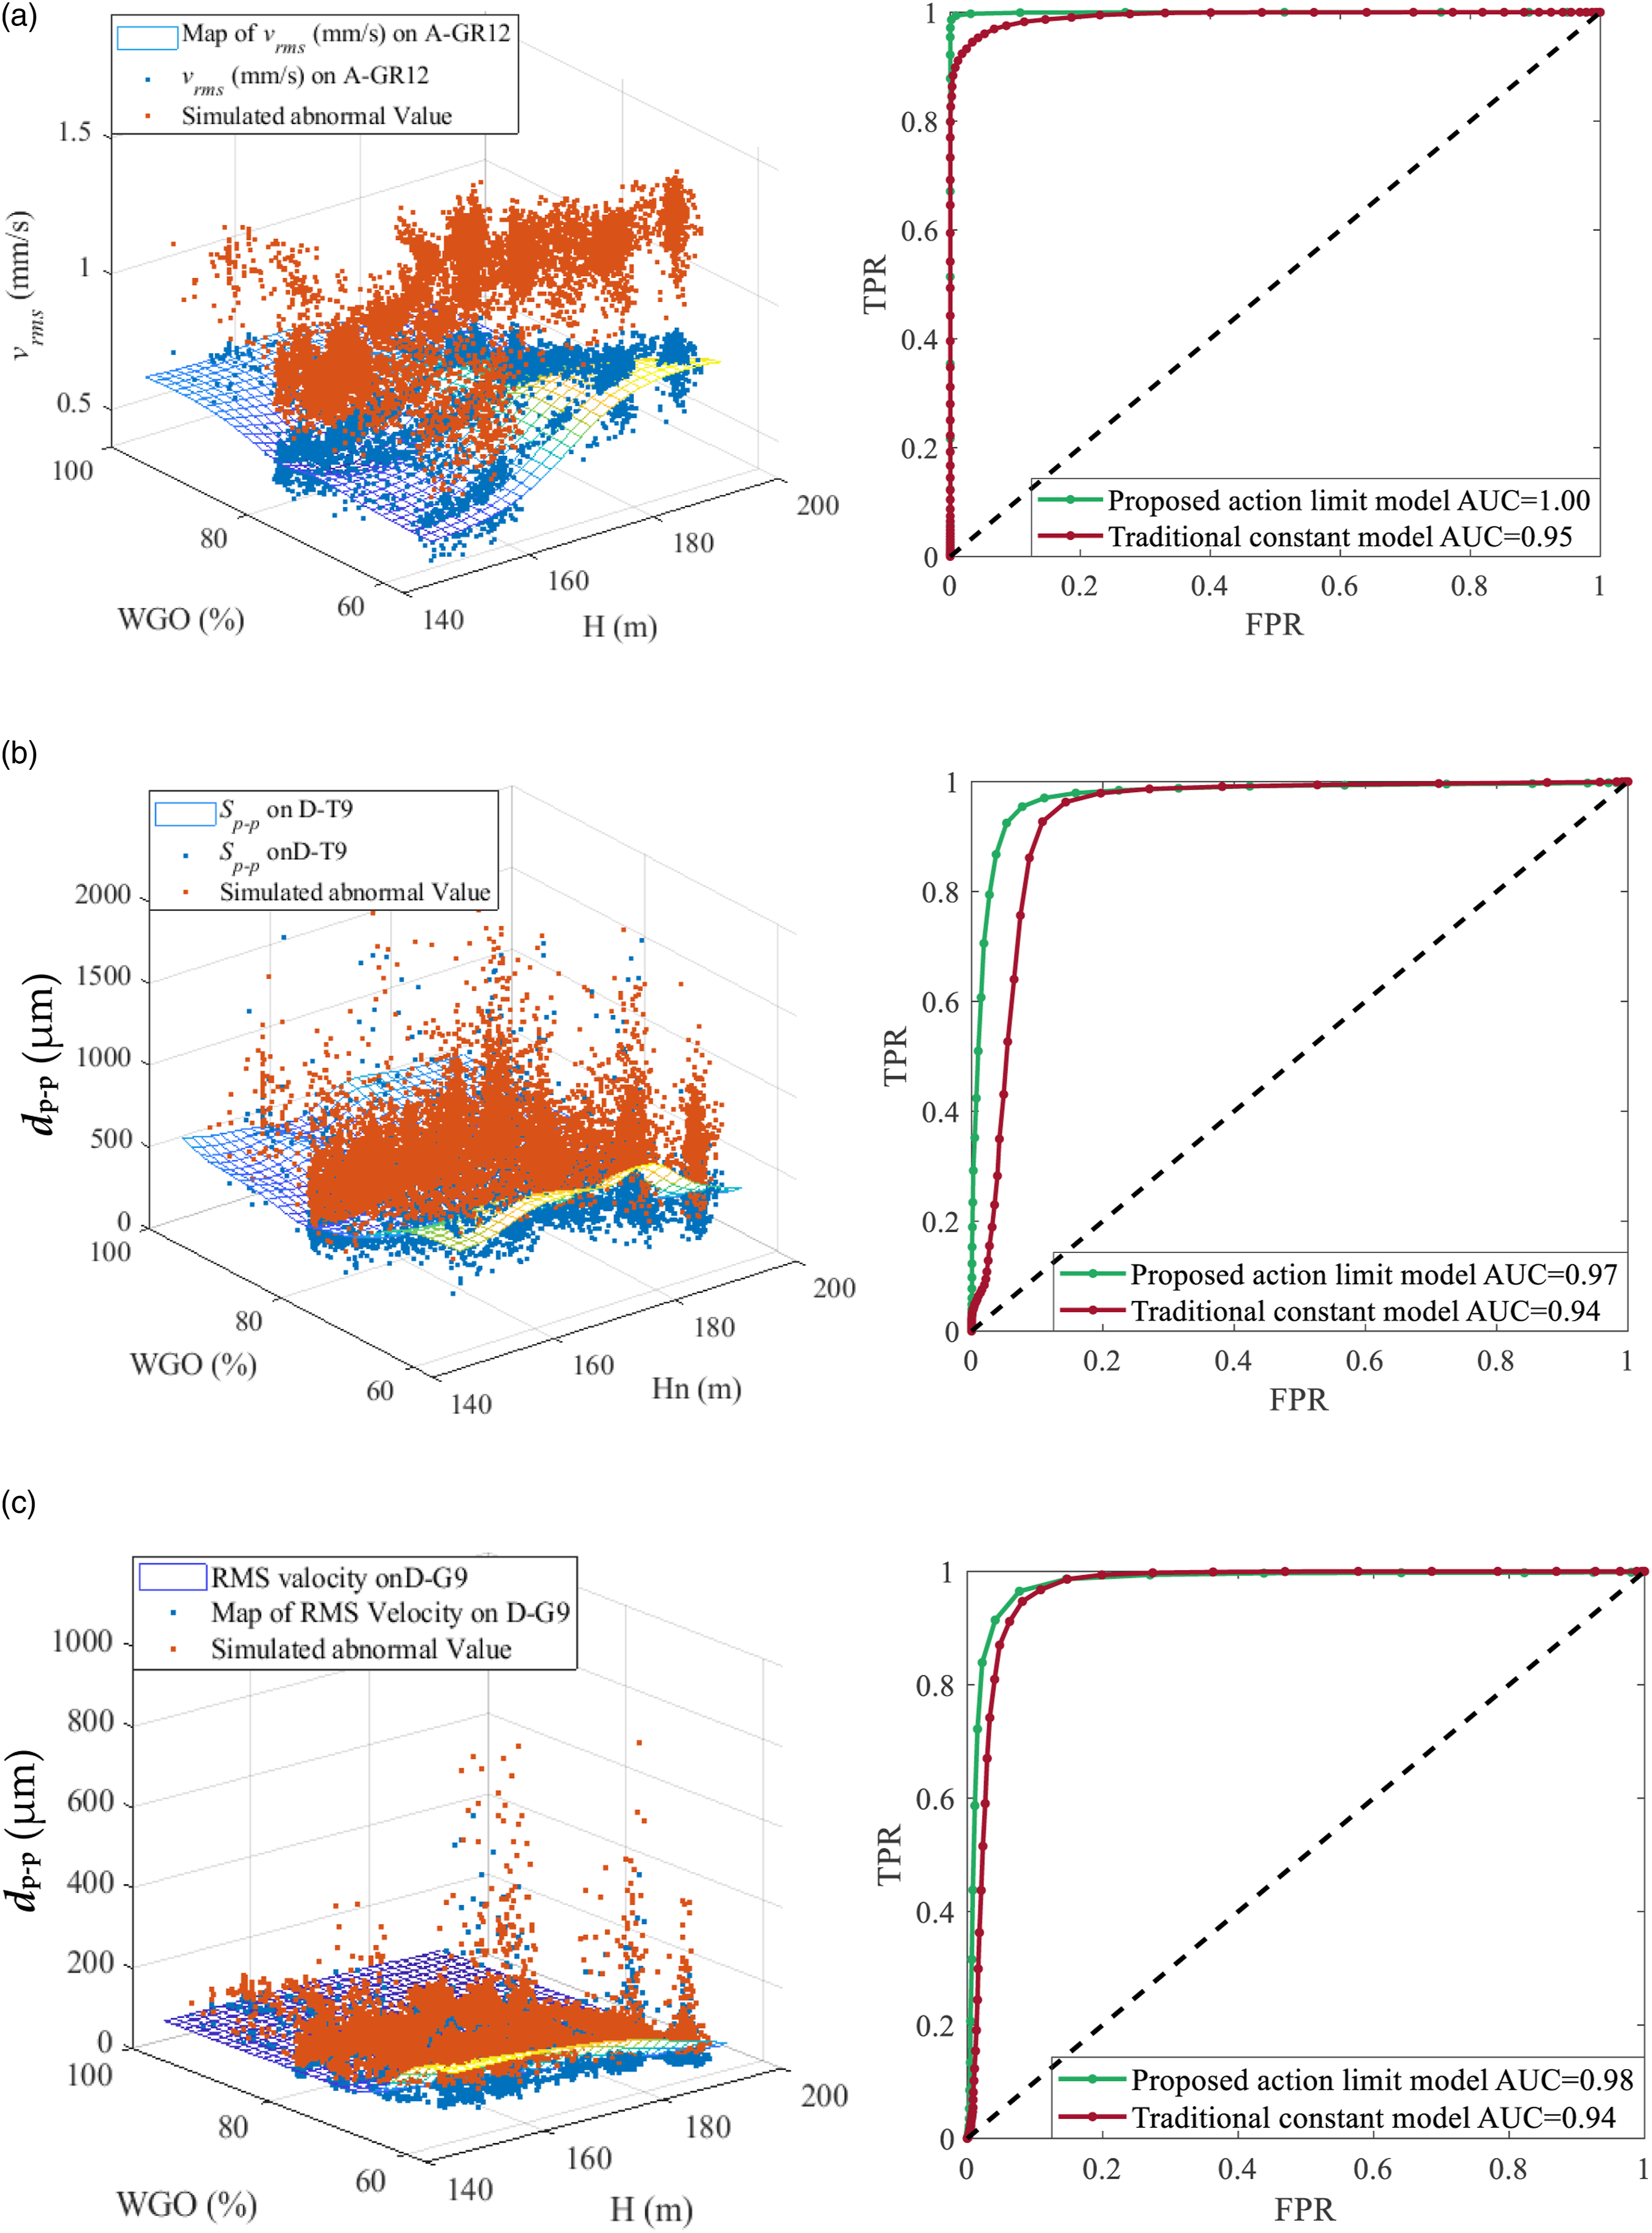
Note that these values have been calculated assuming a β ratio for abnormal values of 1.6. Nevertheless, this number is almost impossible to know it, in the reality. Generally, it can be assumed that the measured X is abnormal when Area under curve of different positive data. A) 
Multidimensional analysis based on the Vibrational Hill Chart
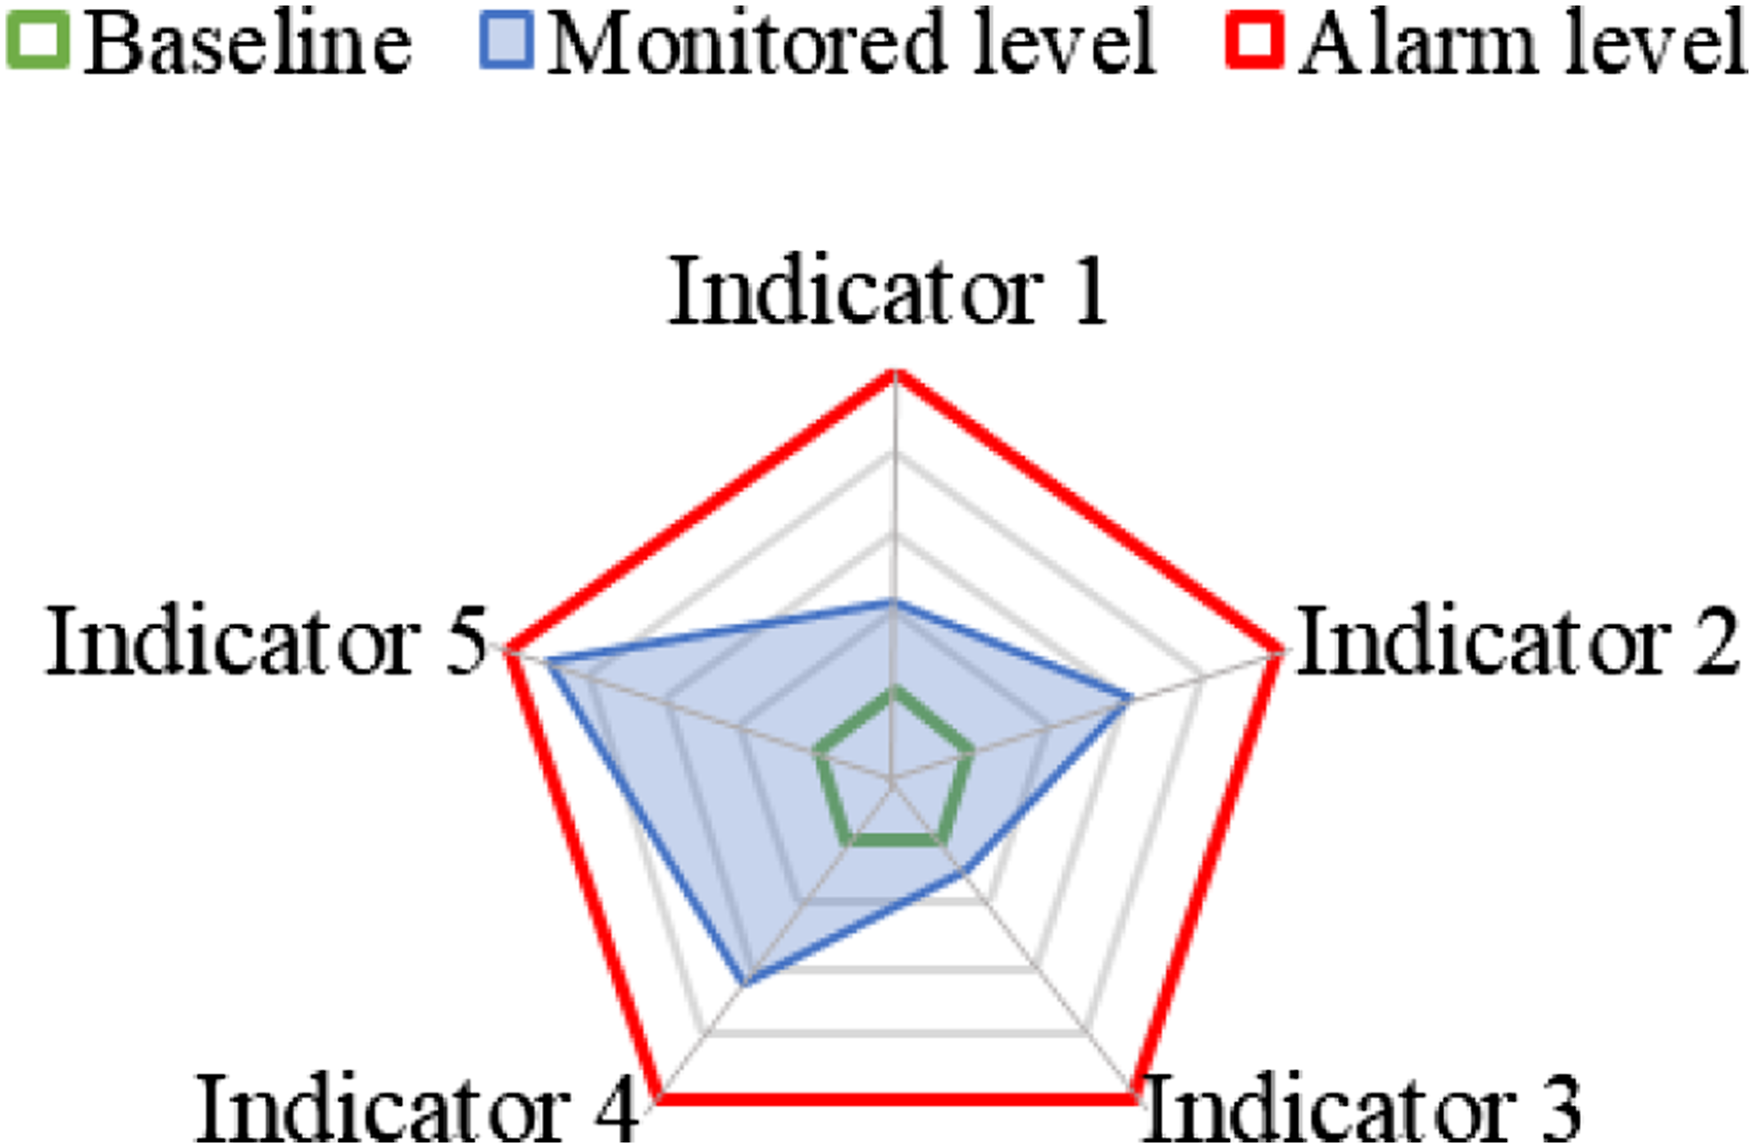
Based on the Vibrational Hill Chart of the turbine, a synthetic radar chart is proposed for advanced condition monitoring. The proposed radar chart uses the most relevant condition indicators obtained for one sensor. The idea is that for one indicator we have a Vibrational Hill Chart that has been obtained with the machine working in good condition (see Figure 25). Then we assume that after some months/years of operation the actual monitored values do not fit well the reference Vibrational Hill Chart because there is for example some wear on the unit components that will generally increase the vibration level. Calculation of the increasing rate of one indicator.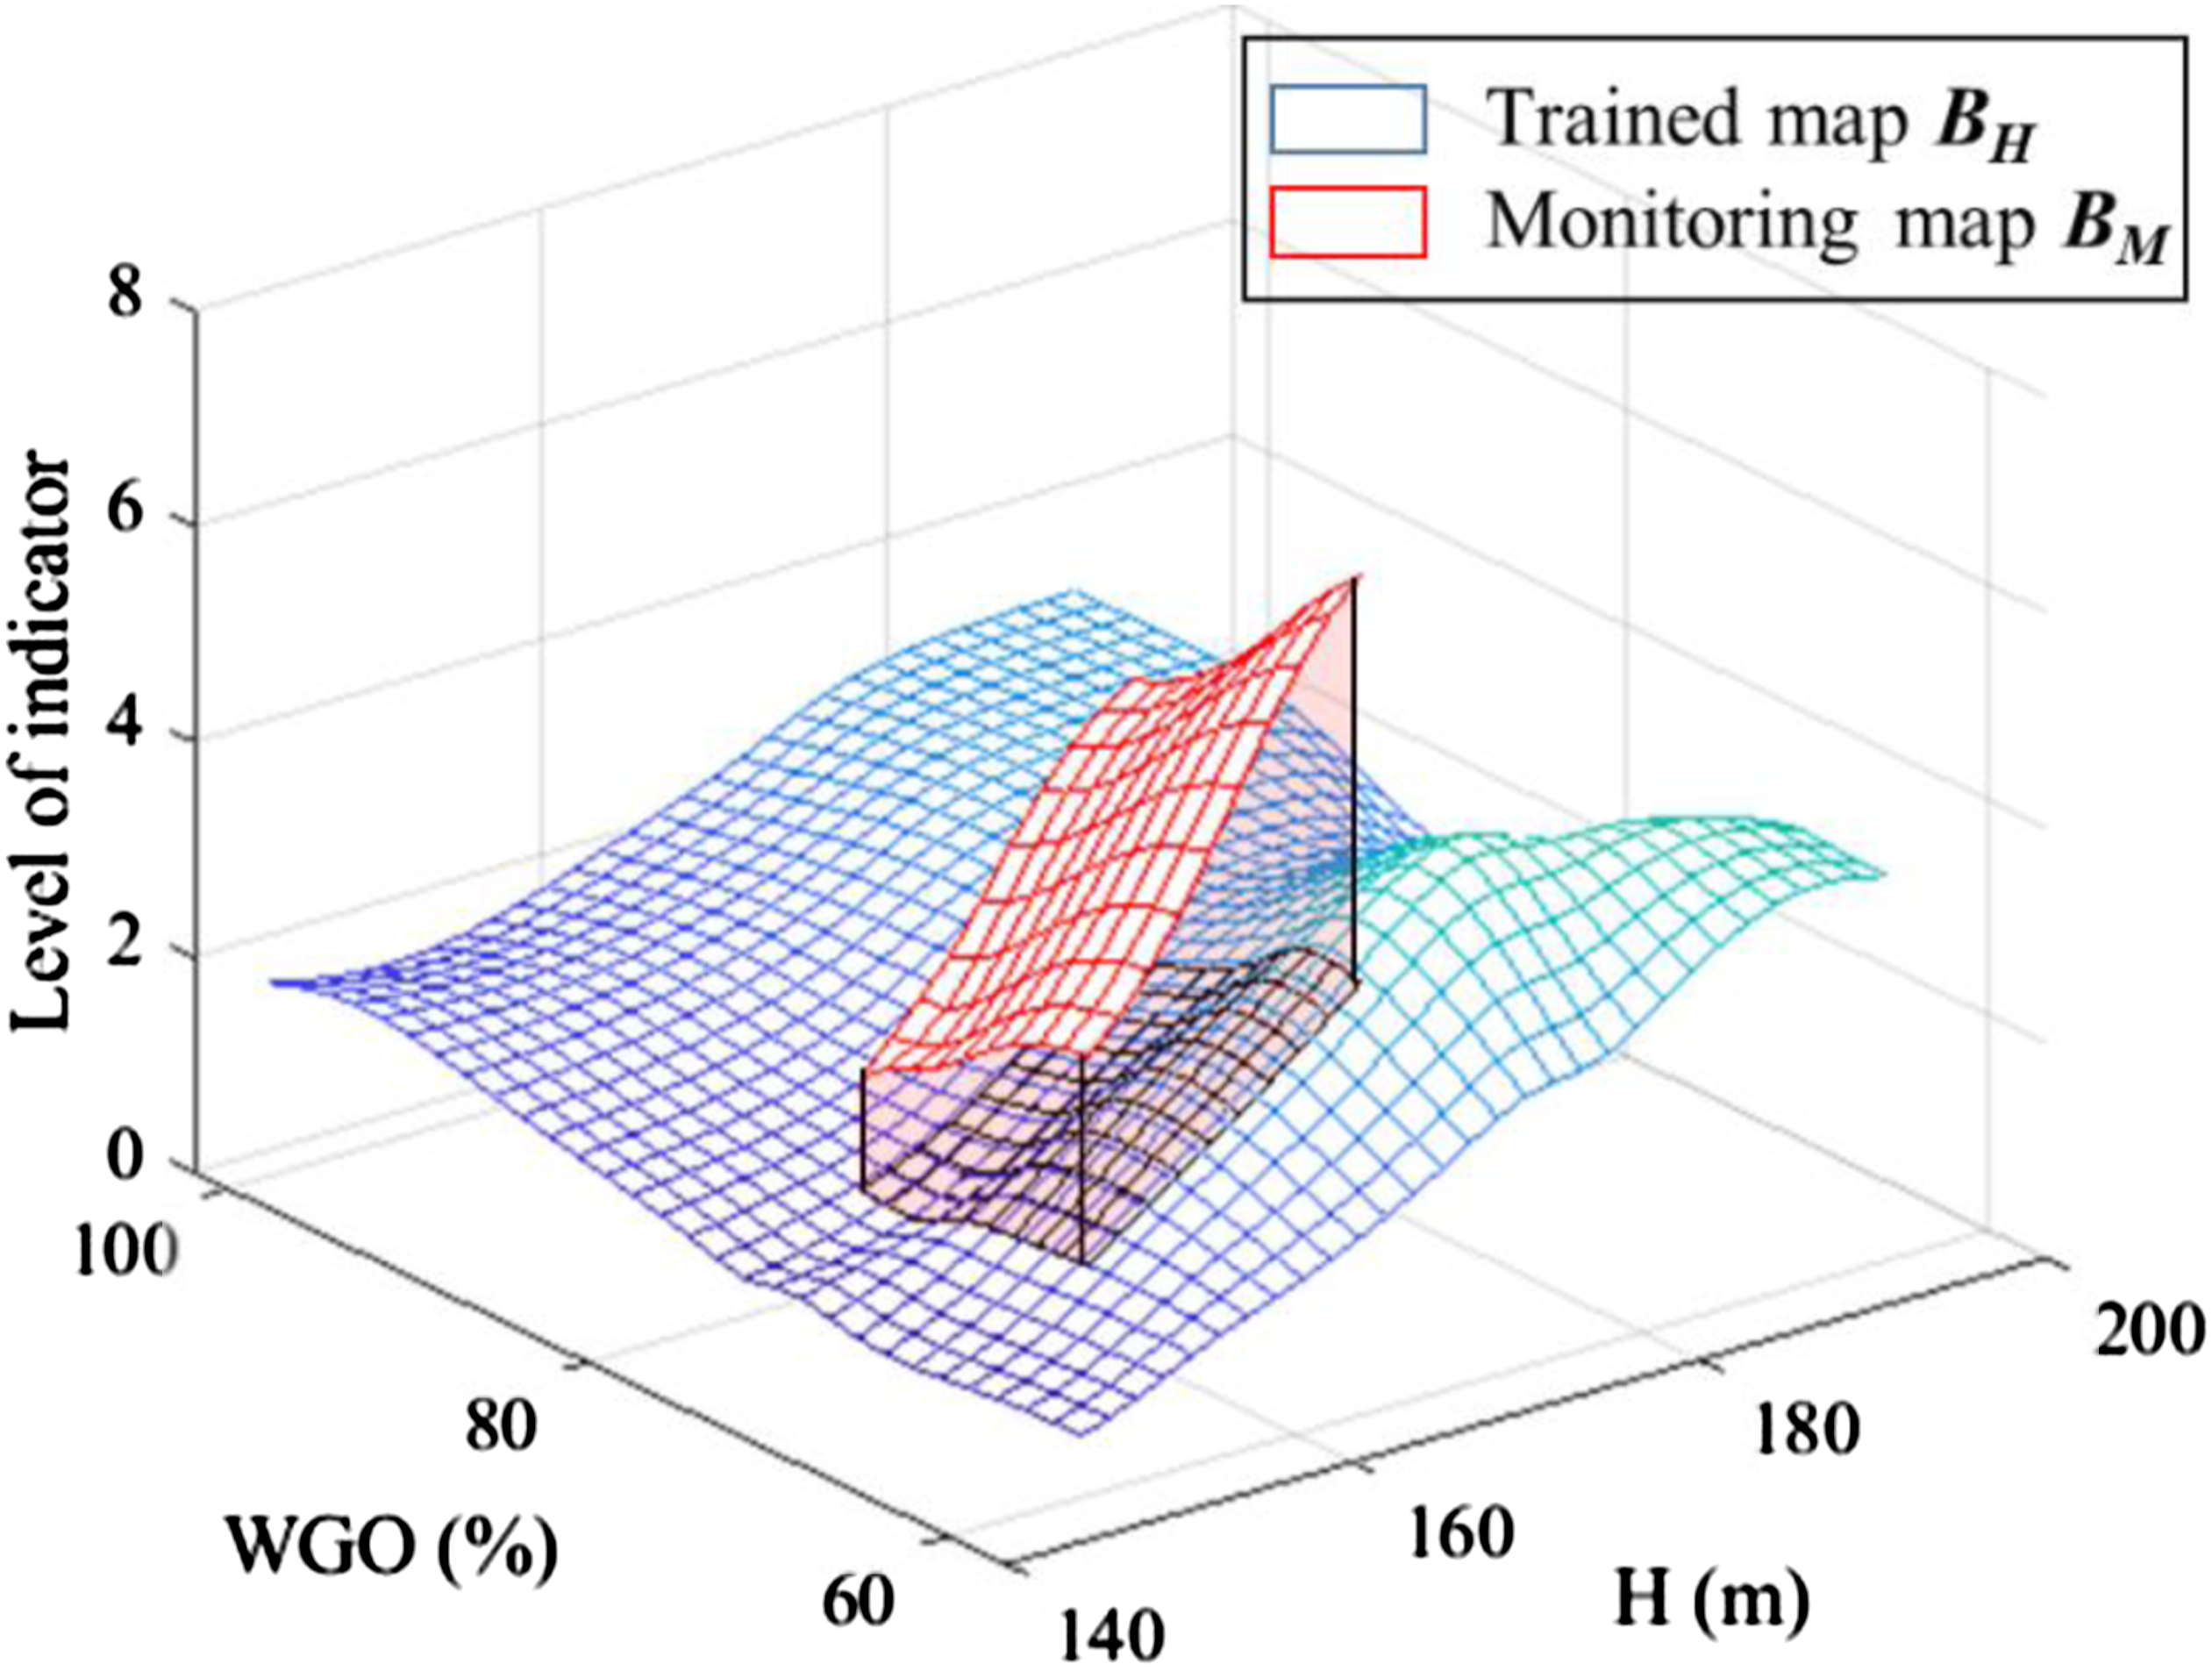
Then, in order to calculate an average deviation of the actual monitored values with respect to the reference Vibrational Hill Chart, a new surface can be generated with the actual monitored values for an arbitrary range of Head and WGO. The procedure to generate this new surface is the same as it has been previously explained. Figure 25 shows an example of this new surface that has been obtained with the actual measured values.
Then, the average rate of increase can be calculated according to Generic radar.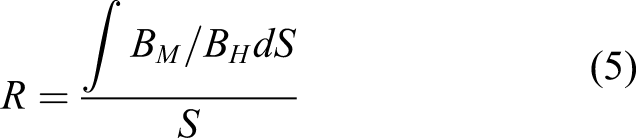
The particular turbine unit and database used in this paper is very appropriate to evaluate the performance of the radar plot. In this case, it will be used to discuss the feasibility of detecting erosive cavitation but it could be generally used to assess other phenomena. As said before, the first part of the database (January 2016–March 2016) was just before the overhaul in April 2016–May 2016), where several erosive cavitation damages were found (Figure 12). For the reference Vibrational Hill Chart only the measured values after the overhaul have been used (Figure 27). Definition of good condition group and damage group.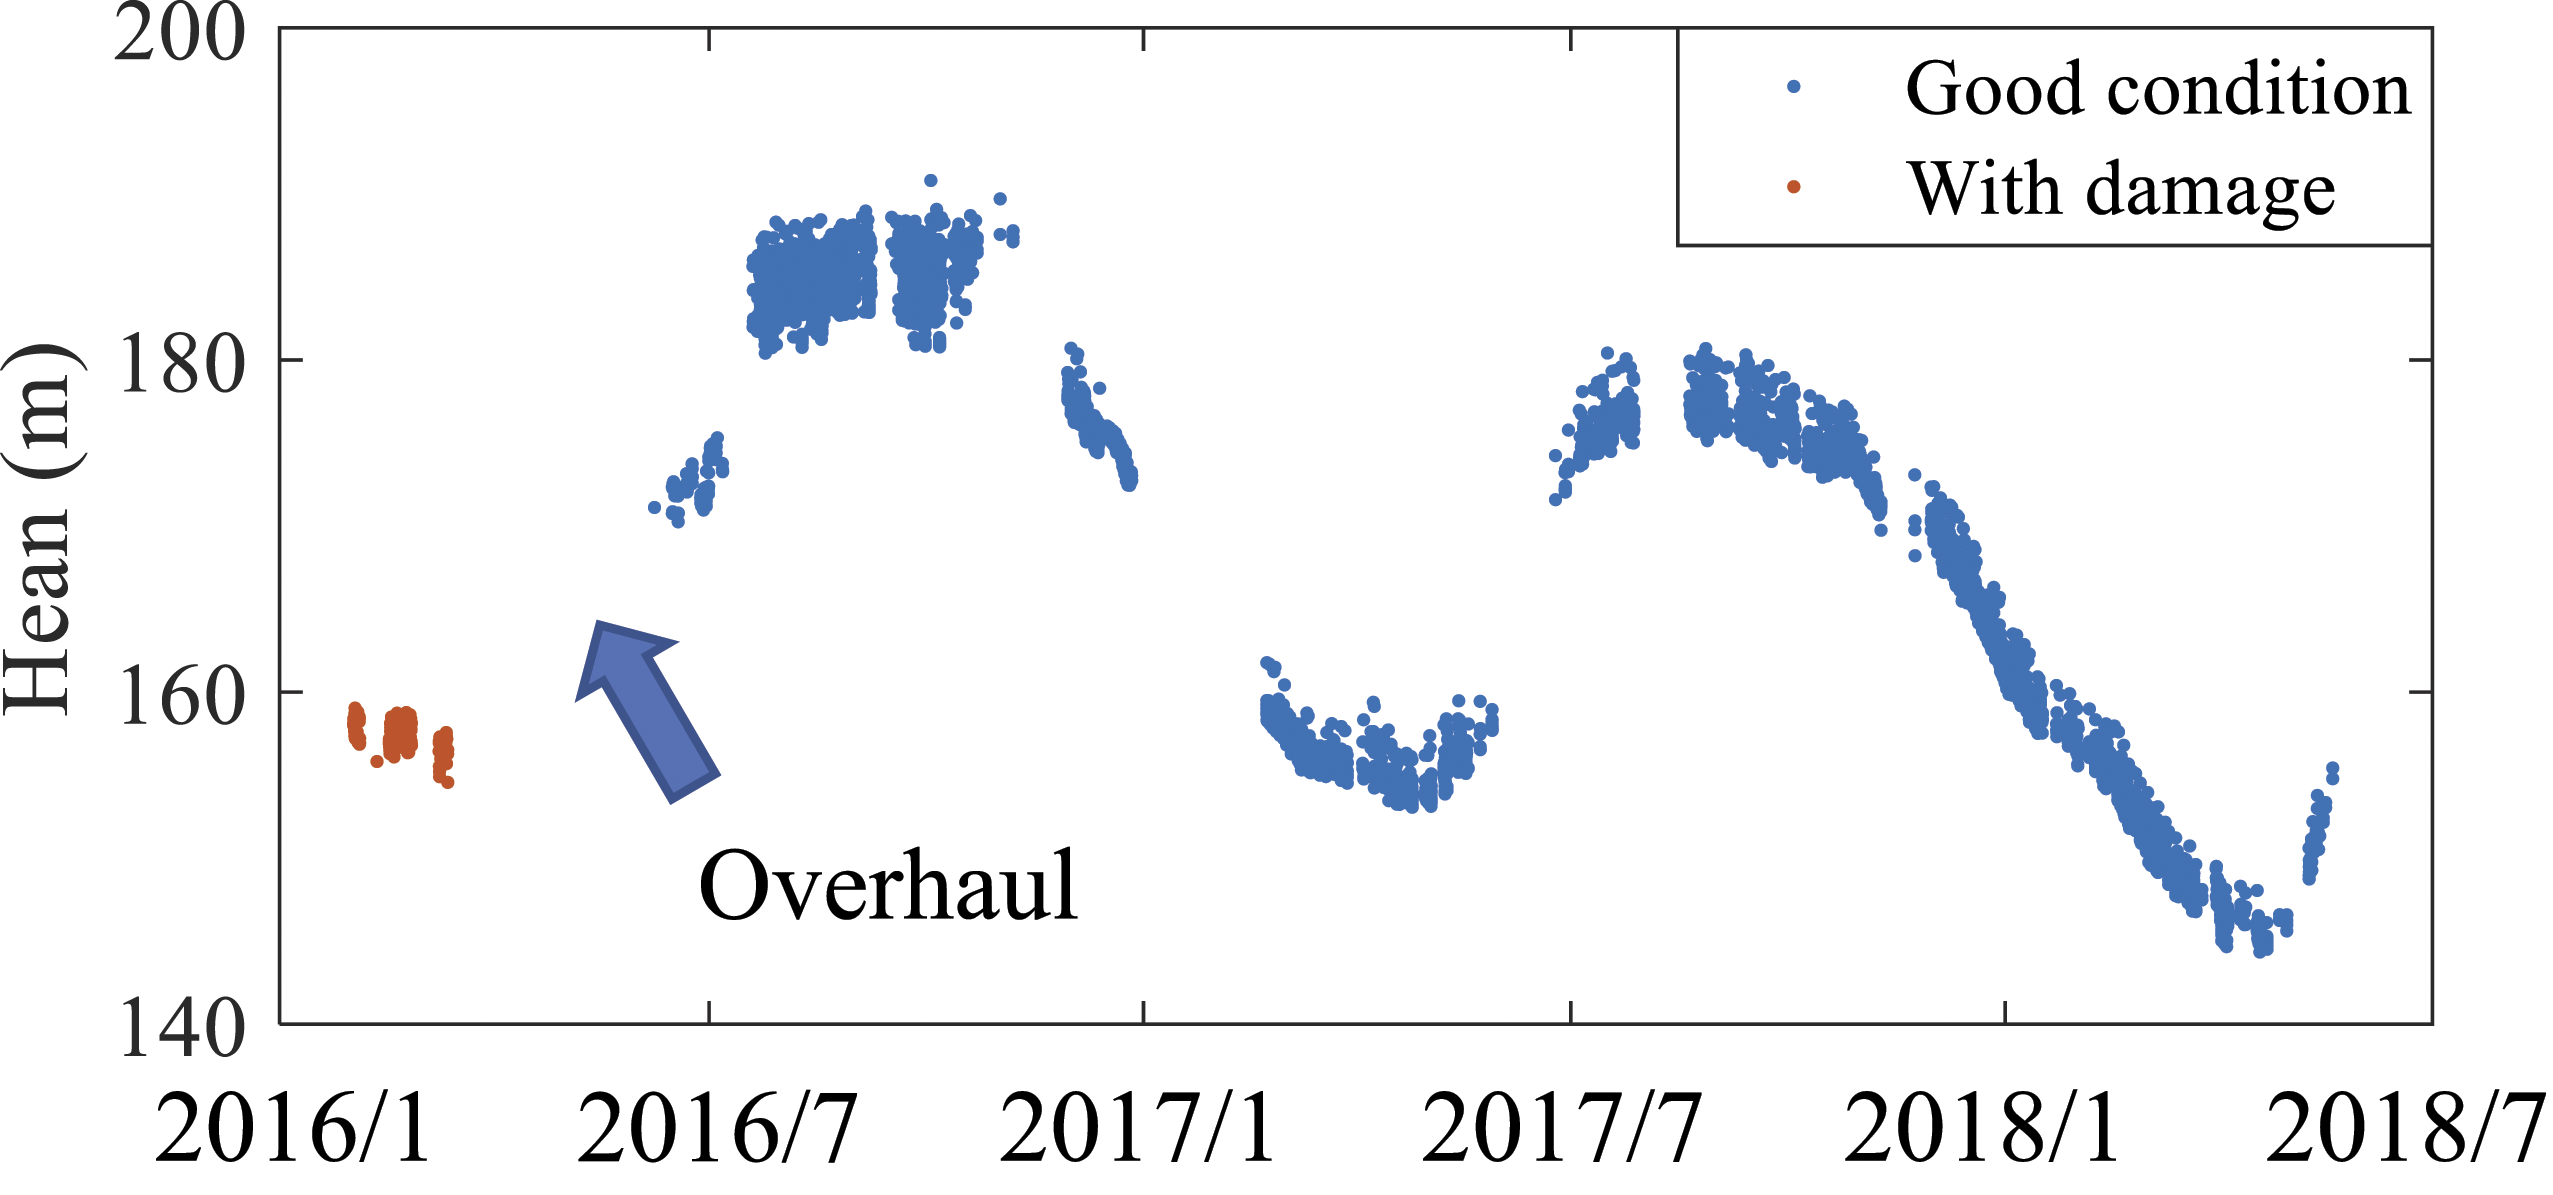
Now the data before the overhaul (orange points) which corresponds to the damaged runner is plotted against the reference Vibrational Hill Chart (Figure 28 shows this data and the reference Vibrational Hill Chart for the two sensors ATR9 and ATR12). From this figure, it can be seen that compared to the reference surface (made with the good condition values) the data before the overhaul shows a much higher value. It is worth to notice that although this increase can be clearly appreciated in this figure, none of the measured
v
rms on A-TR9.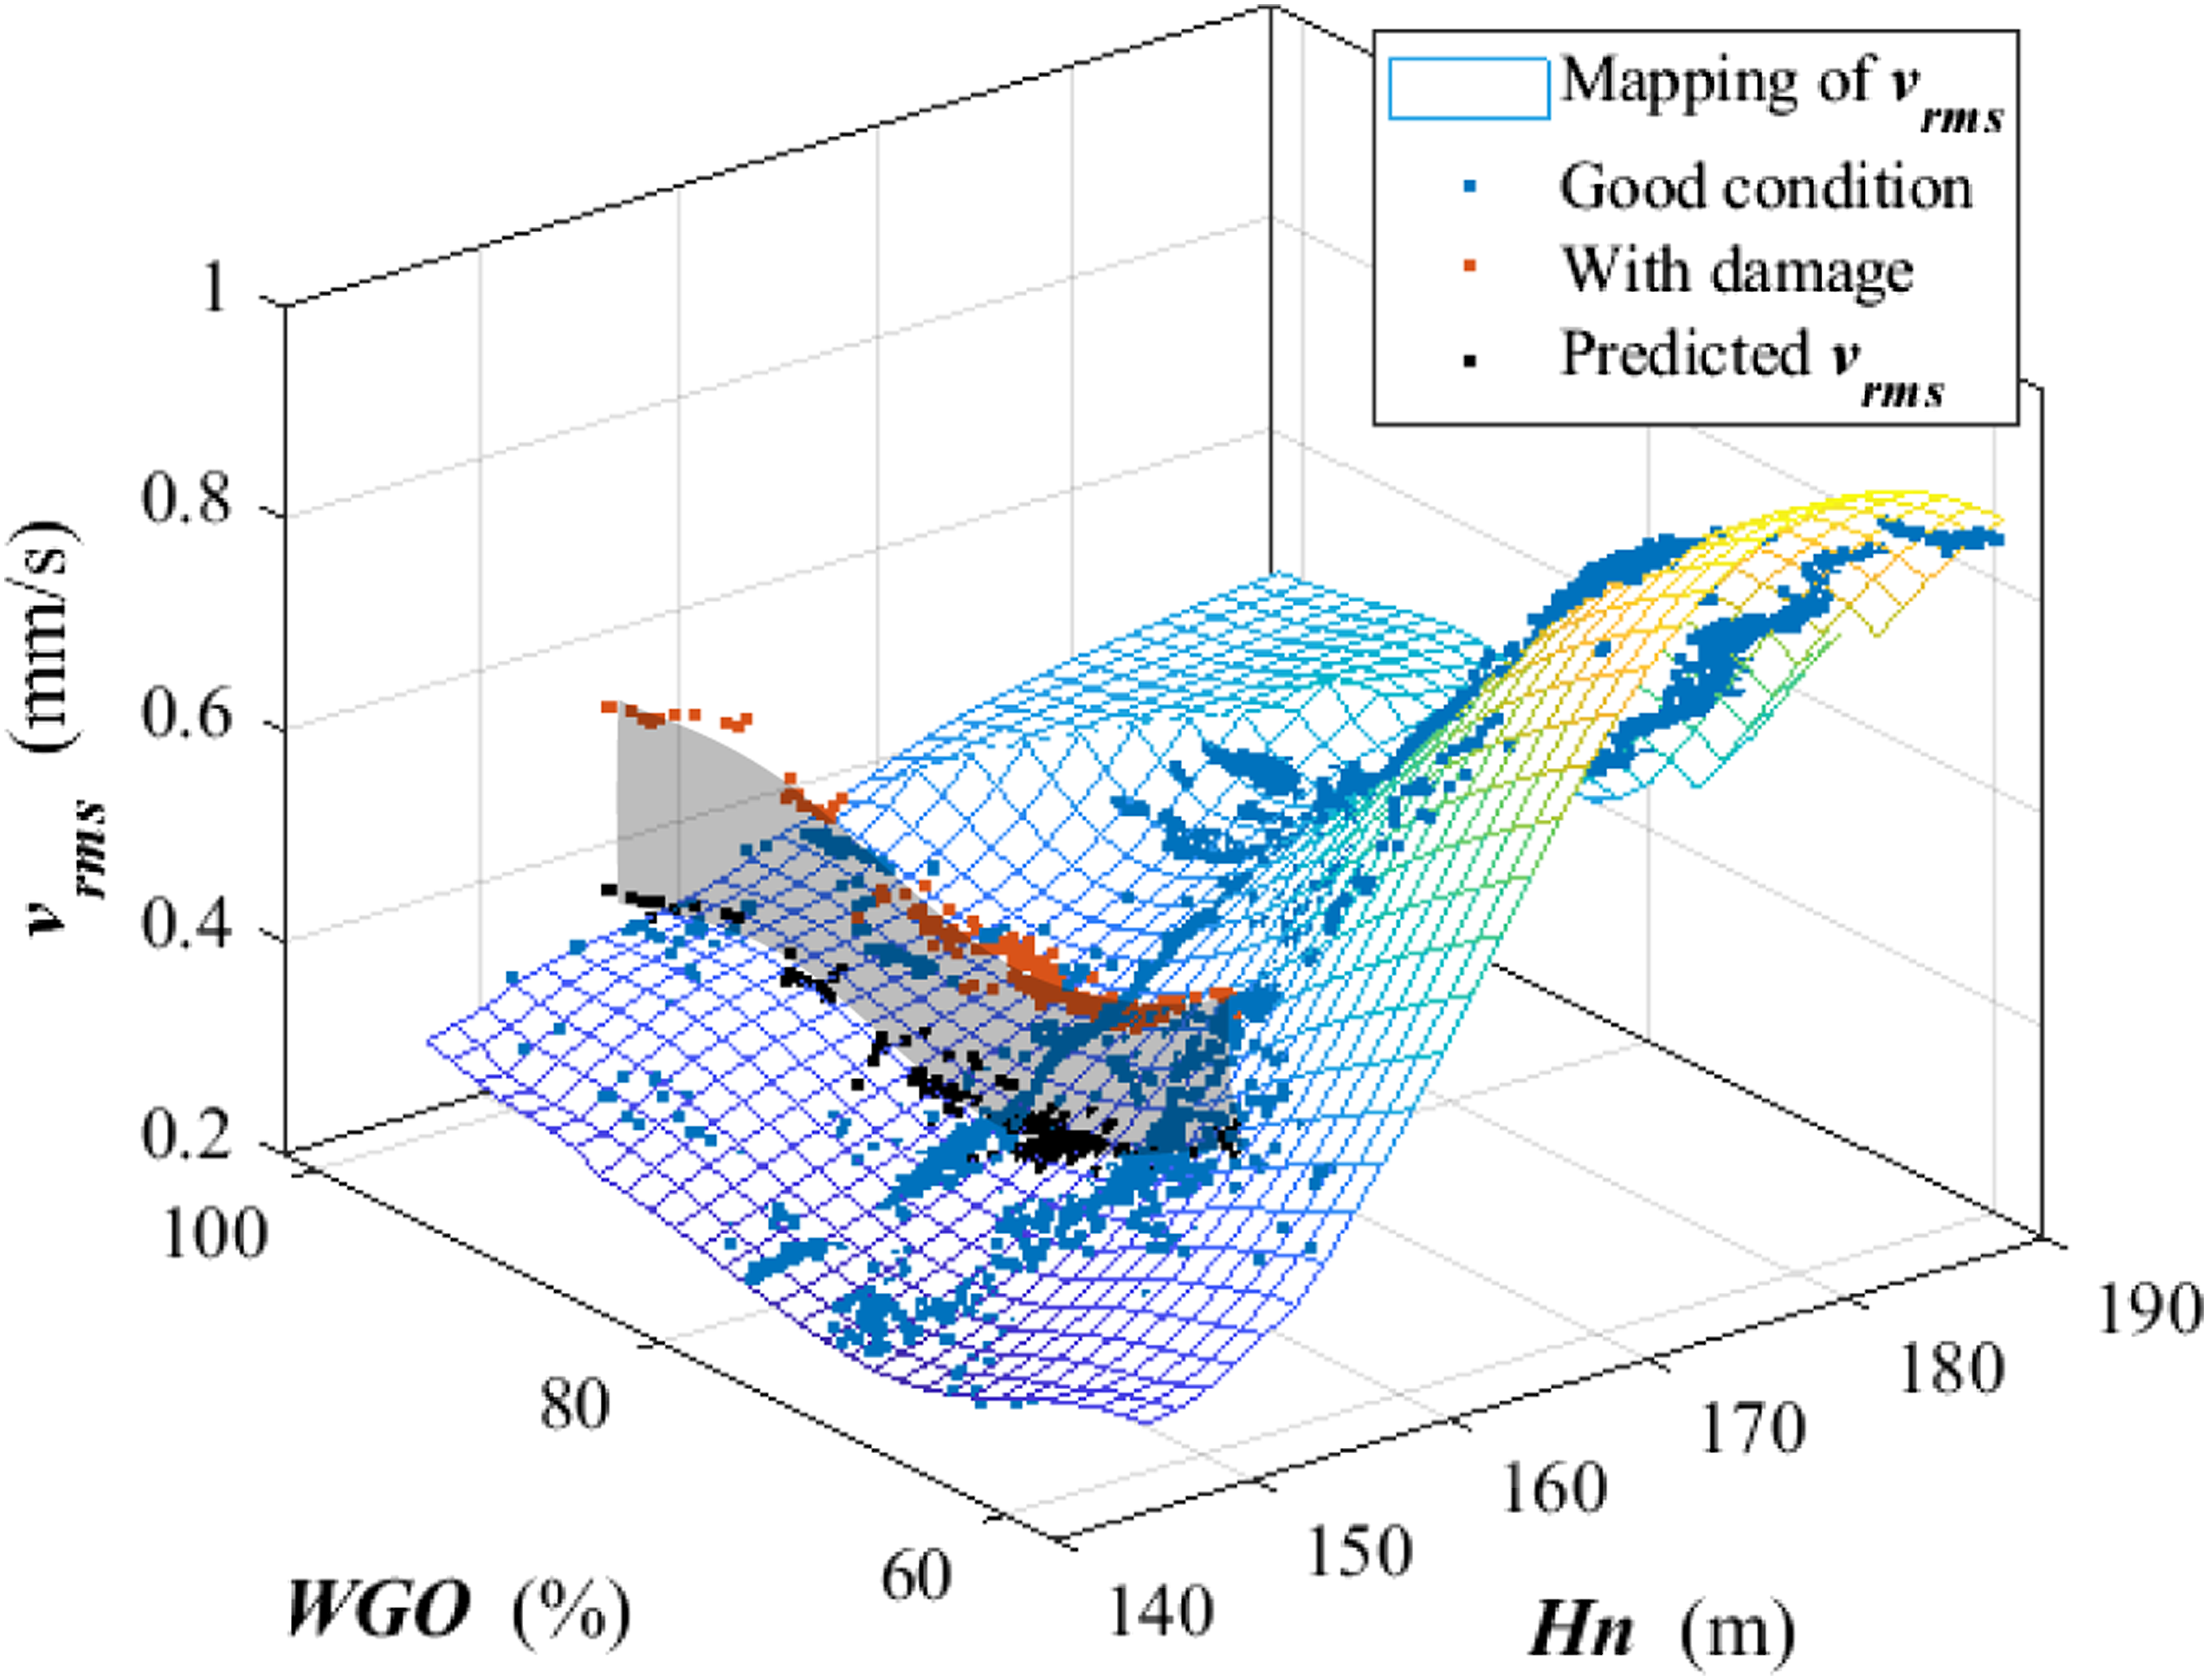
For this amount of data corresponding to a low head, an area S (Figure 25) has been defined and the R values for all of the indicators associated to ATR9 and ATR12 have been calculated. These R values are summarized in the radar chart of Figure 29. Radar charts for turbine bearing.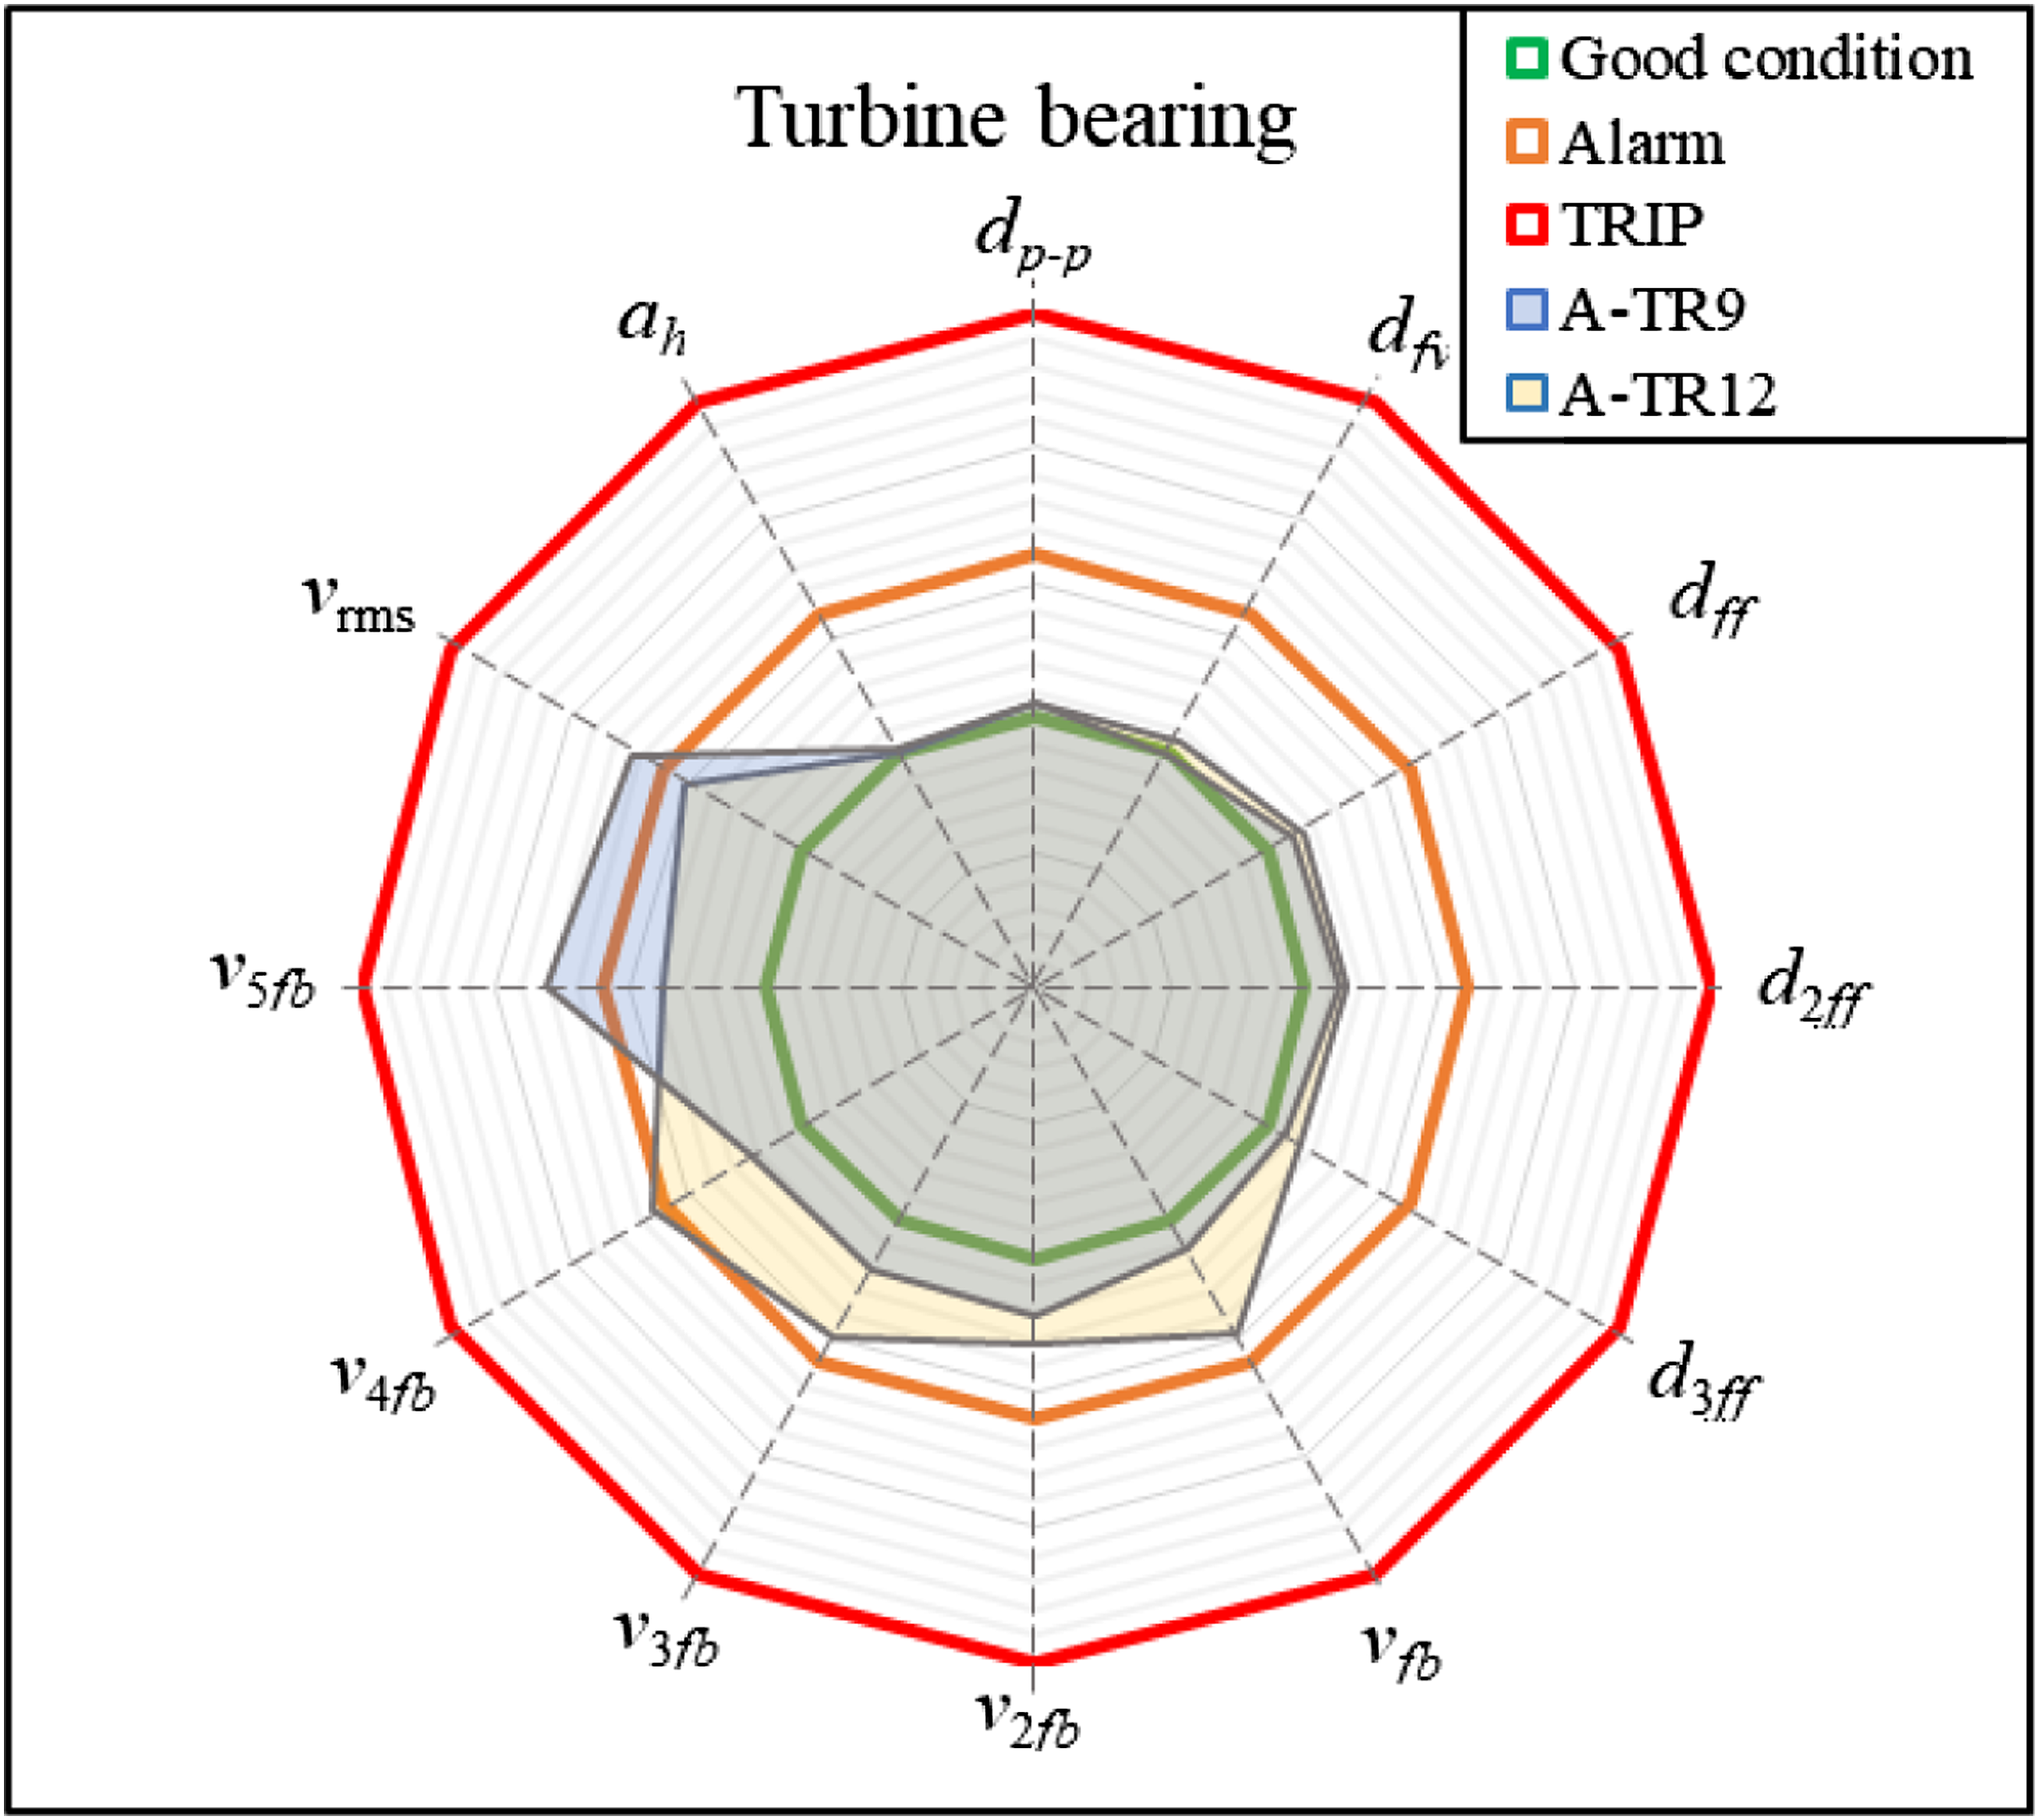
The radar charts show that most of the indicators increase under damage condition. Some indicators have surpassed the alarm level of the radar while none of them has reached trip level. Although some of these indicators showed a trend to increase when the runner blades had erosive cavitation damage, a cause-effect relationship of these two facts has to be analyzed and validated in future monitoring periods and/or in other similar units.
Conclusions and outlook
In this study, a tool called Vibrational Hill Chart is proposed for advanced condition monitoring of Francis turbines. A series of condition indicators are extracted from the monitoring data over 3 years on a Francis turbine. Artificial Neural Networks are applied to generate the Vibrational Hill Chart for each indicator. It is proposed that the action limits (alarm level and trip level) could be defined based on the Vibrational Hill Chart (respecting the limits recommended by the reference standards). To estimate the classification performance of this action limits, ROC curves are calculated and compared with constant action limits typically used in condition monitoring. The higher AUC of the proposed action limits indicates a better performance of the Vibrational Hill Chart for abnormal behavior detection and possible damages.
Furthermore, Vibrational Hill Charts can be used to detect possible abnormal behaviors if a reference surface is generated with the operating data for the machine in good condition. It is shown that a radar chart, which measures the deviation with respect to the reference surface for the most relevant indicators, can be a powerful tool for this purpose. For the analyzed unit a clear change in the radar chart was observed in the same period that the runner blades had erosive cavitation damages. A possible cause-effect relationship of these two facts will be analyzed and investigated in the future.
To summarize up, the main contributions of using a Vibrational Hill Chart for monitoring Francis turbines, working in an extended operating range, are: 1. Vibrational Hill Charts fitted by Artificial Neural Networks take operating condition (head and load) into account. Based on the monitoring data acquired for a large Francis turbine operating during 2.5 years, it is shown that action limits based on the Vibrational Hill Chart decrease both false positive and false negative rates. 2. The comparison between a reference Vibrational Hill Chart, made for the machine operating in good condition, and the actual monitored values is a powerful tool to detect possible abnormal behaviors or incipient damages on the unit.
Footnotes
Acknowledgments
Weiqiang Zhao would like to acknowledge the China Scolarship Council (CSC 201706350258) for its grants. The authors want also to acknowledge XFLEX EU Project (grant agreement nº 863927) for the support. Alexandre Presas and David Valentin want to acknowledge the Serra Hunter Programme of Generalitat de Catalunya.
Funding
The author(s) received no financial support for the research, authorship, and/or publication of this article.